
SARS-CoV-2 Survival in Common Non-Alcoholic and Alcoholic Beverages


Abstract
:1. Introduction
2. Materials and Methods
2.1. Cells and Viruses
2.2. Sample Preparation and Inoculation
2.3. Plaque Assay
2.4. Viral Genome Extraction and RT-qPCR
2.5. Statistical Analysis
3. Results
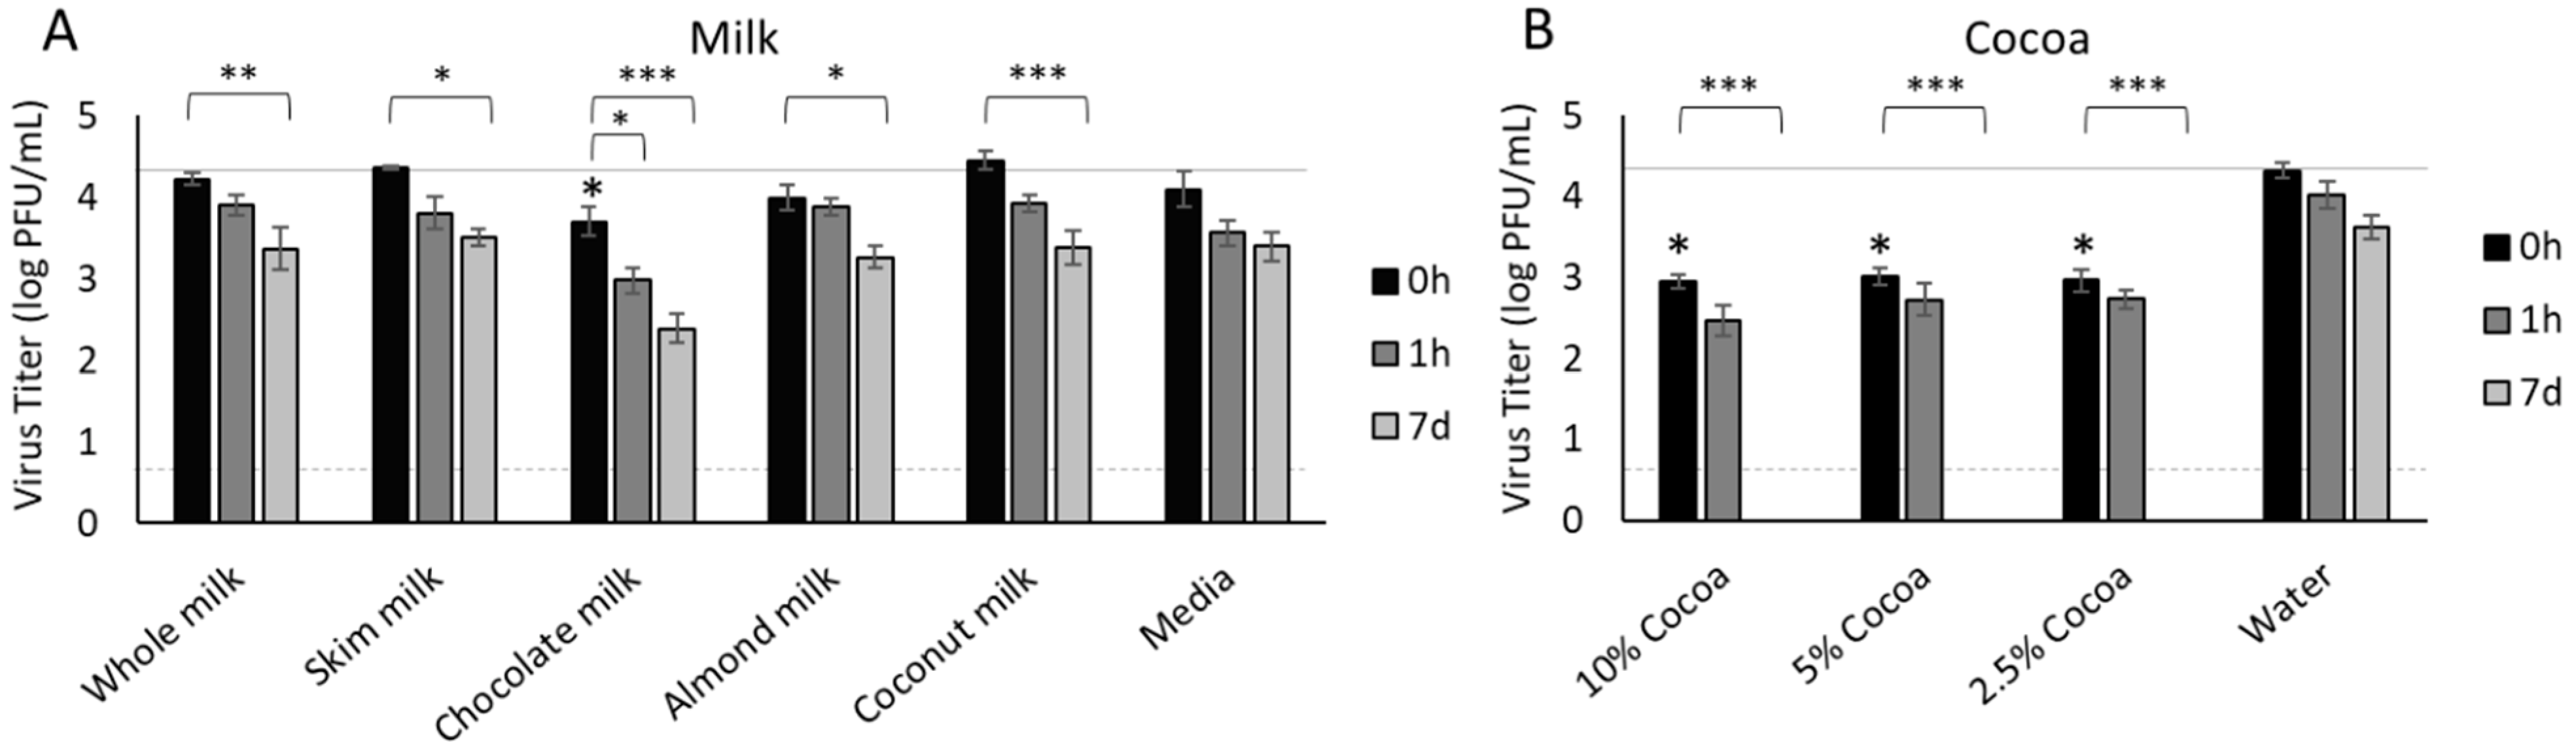
3.1. Milk
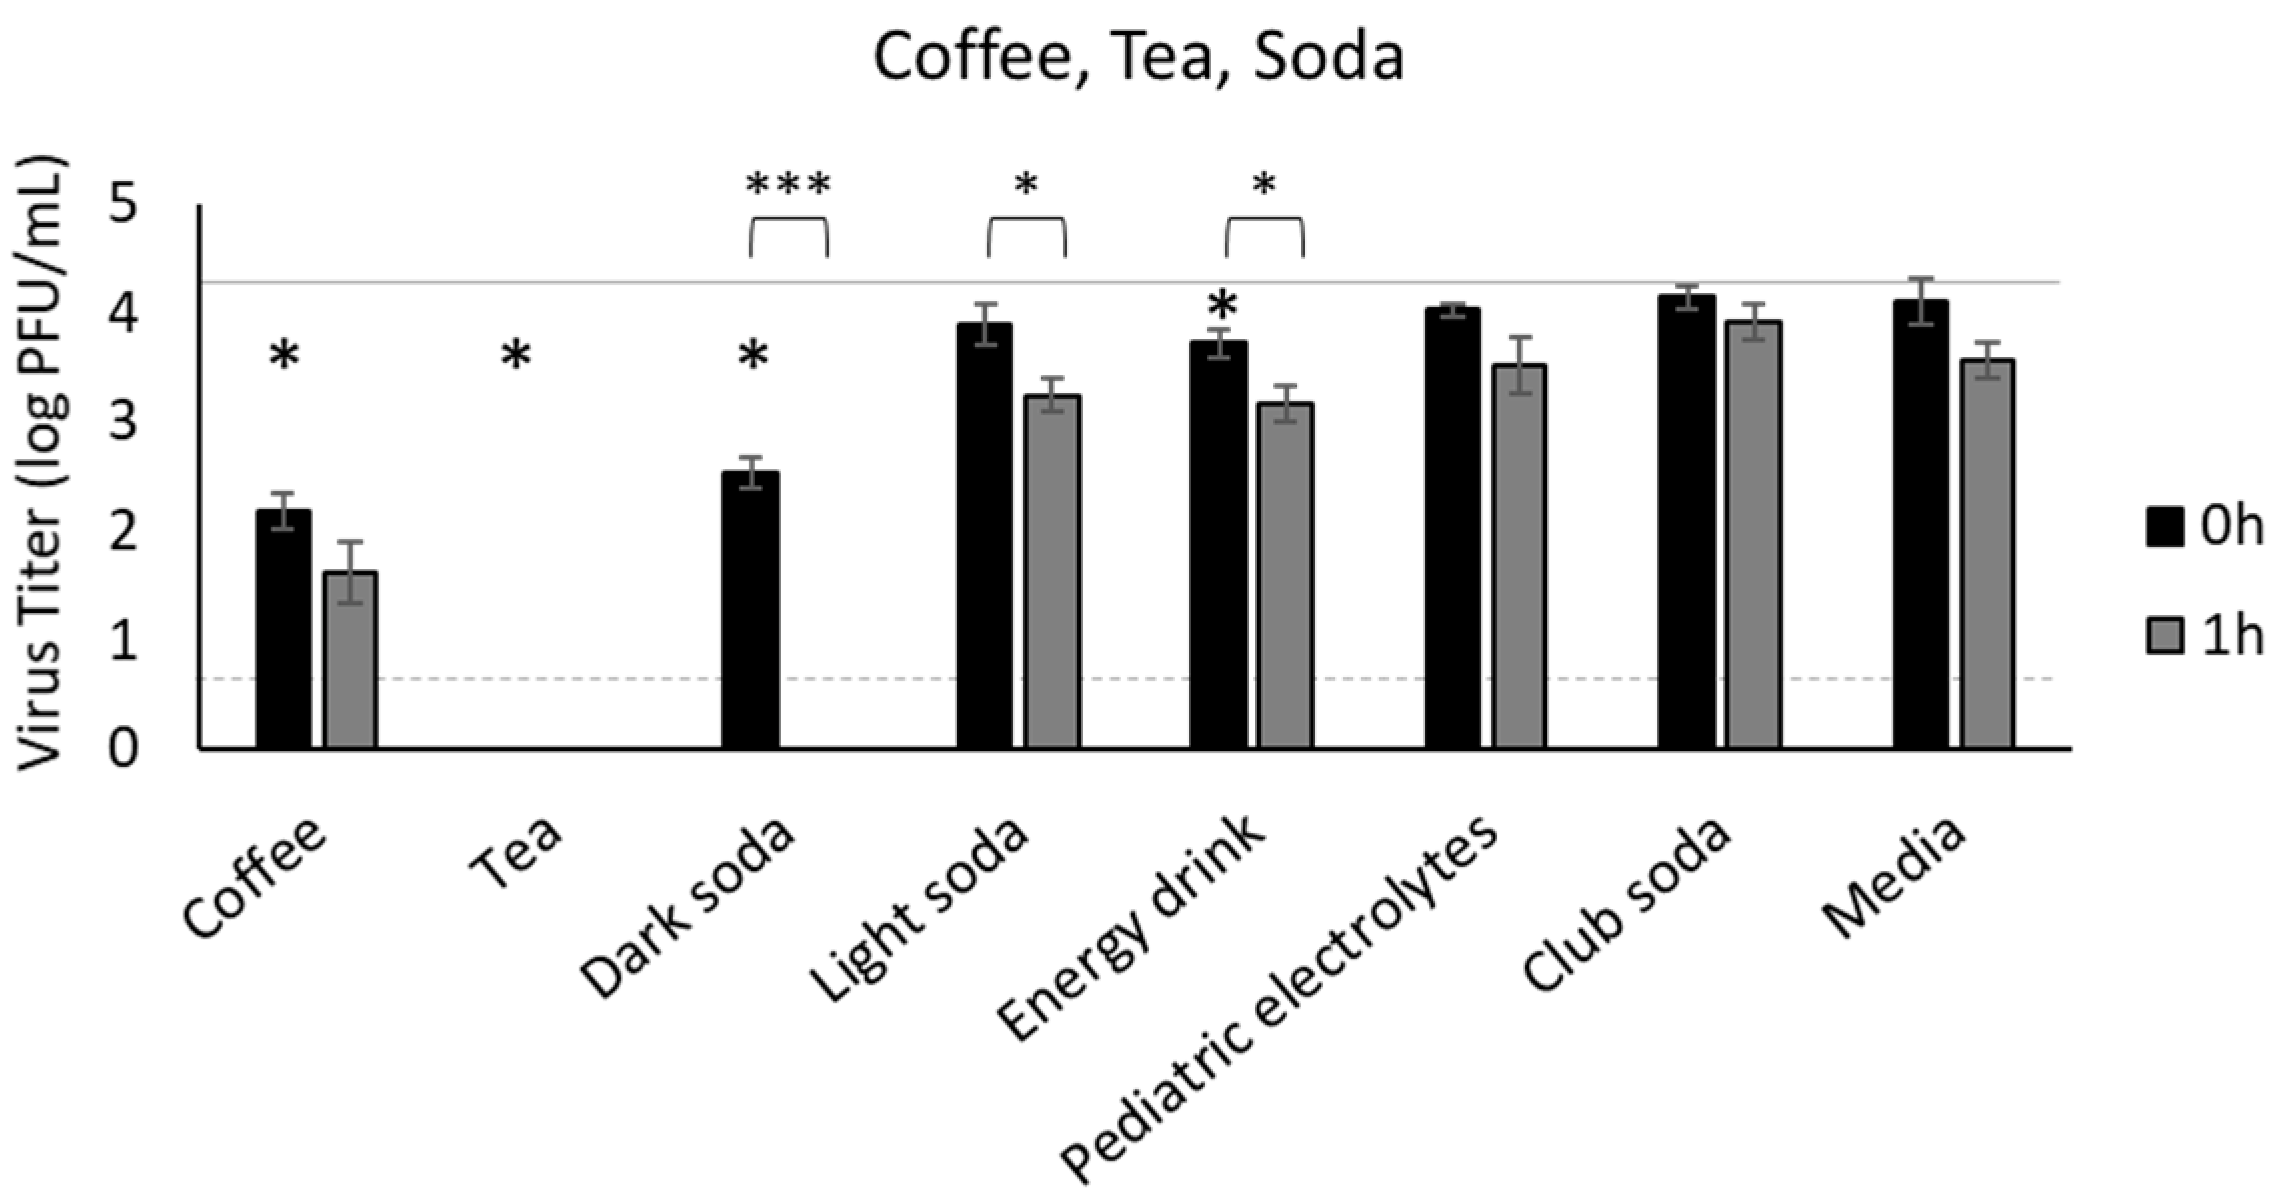
3.2. Coffee, Tea, and Soda
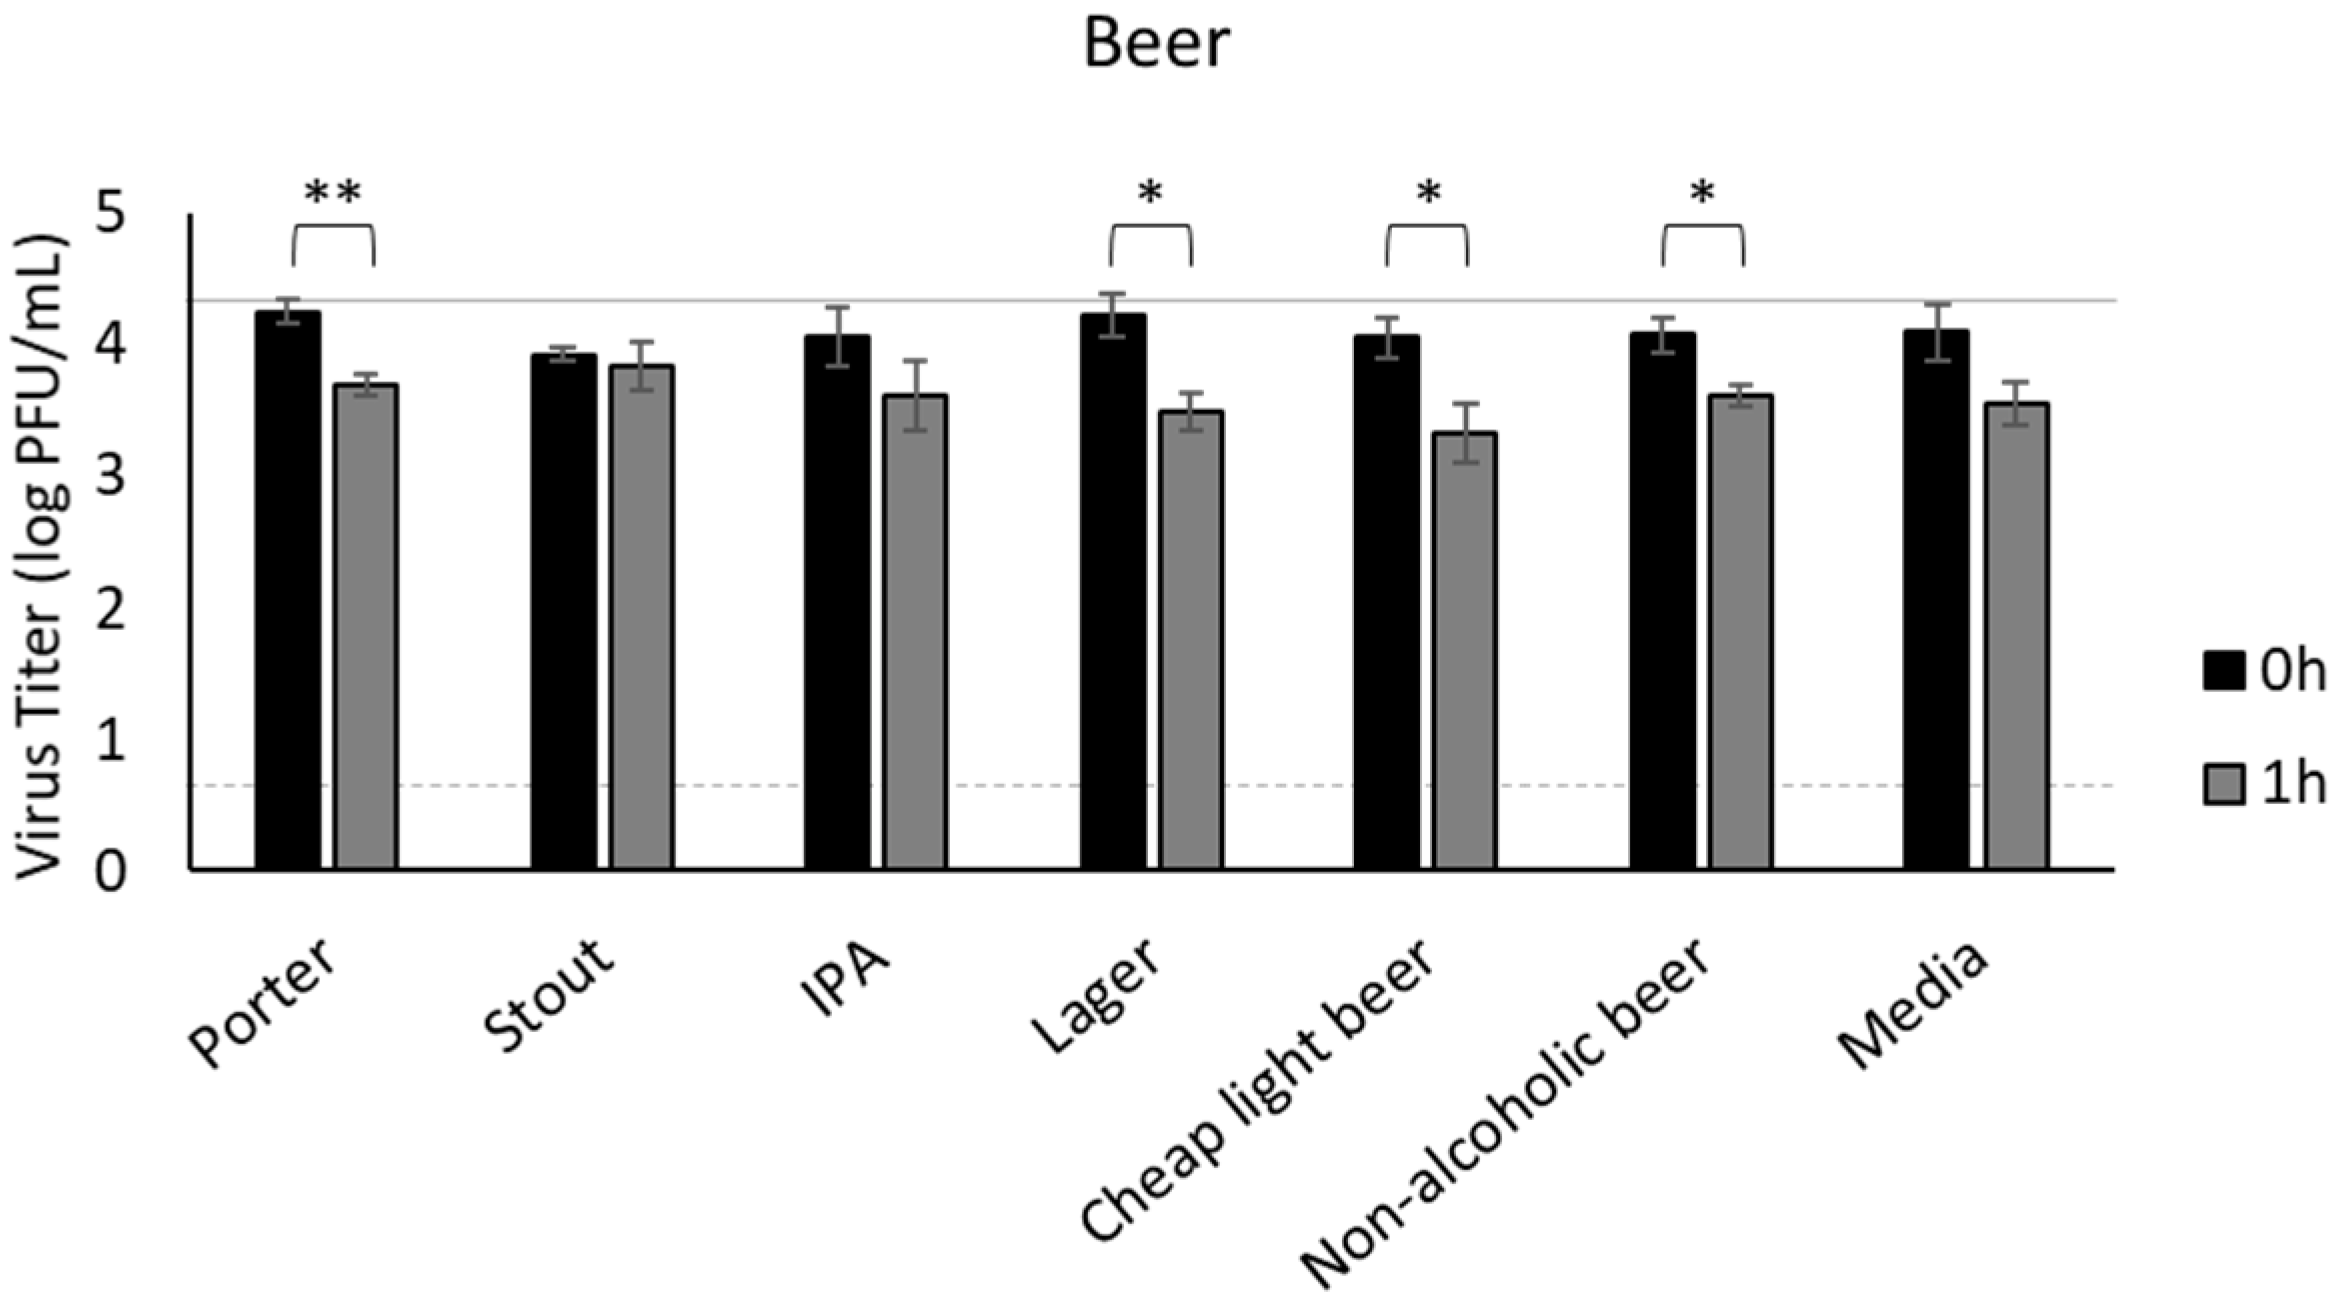
3.3. Beer
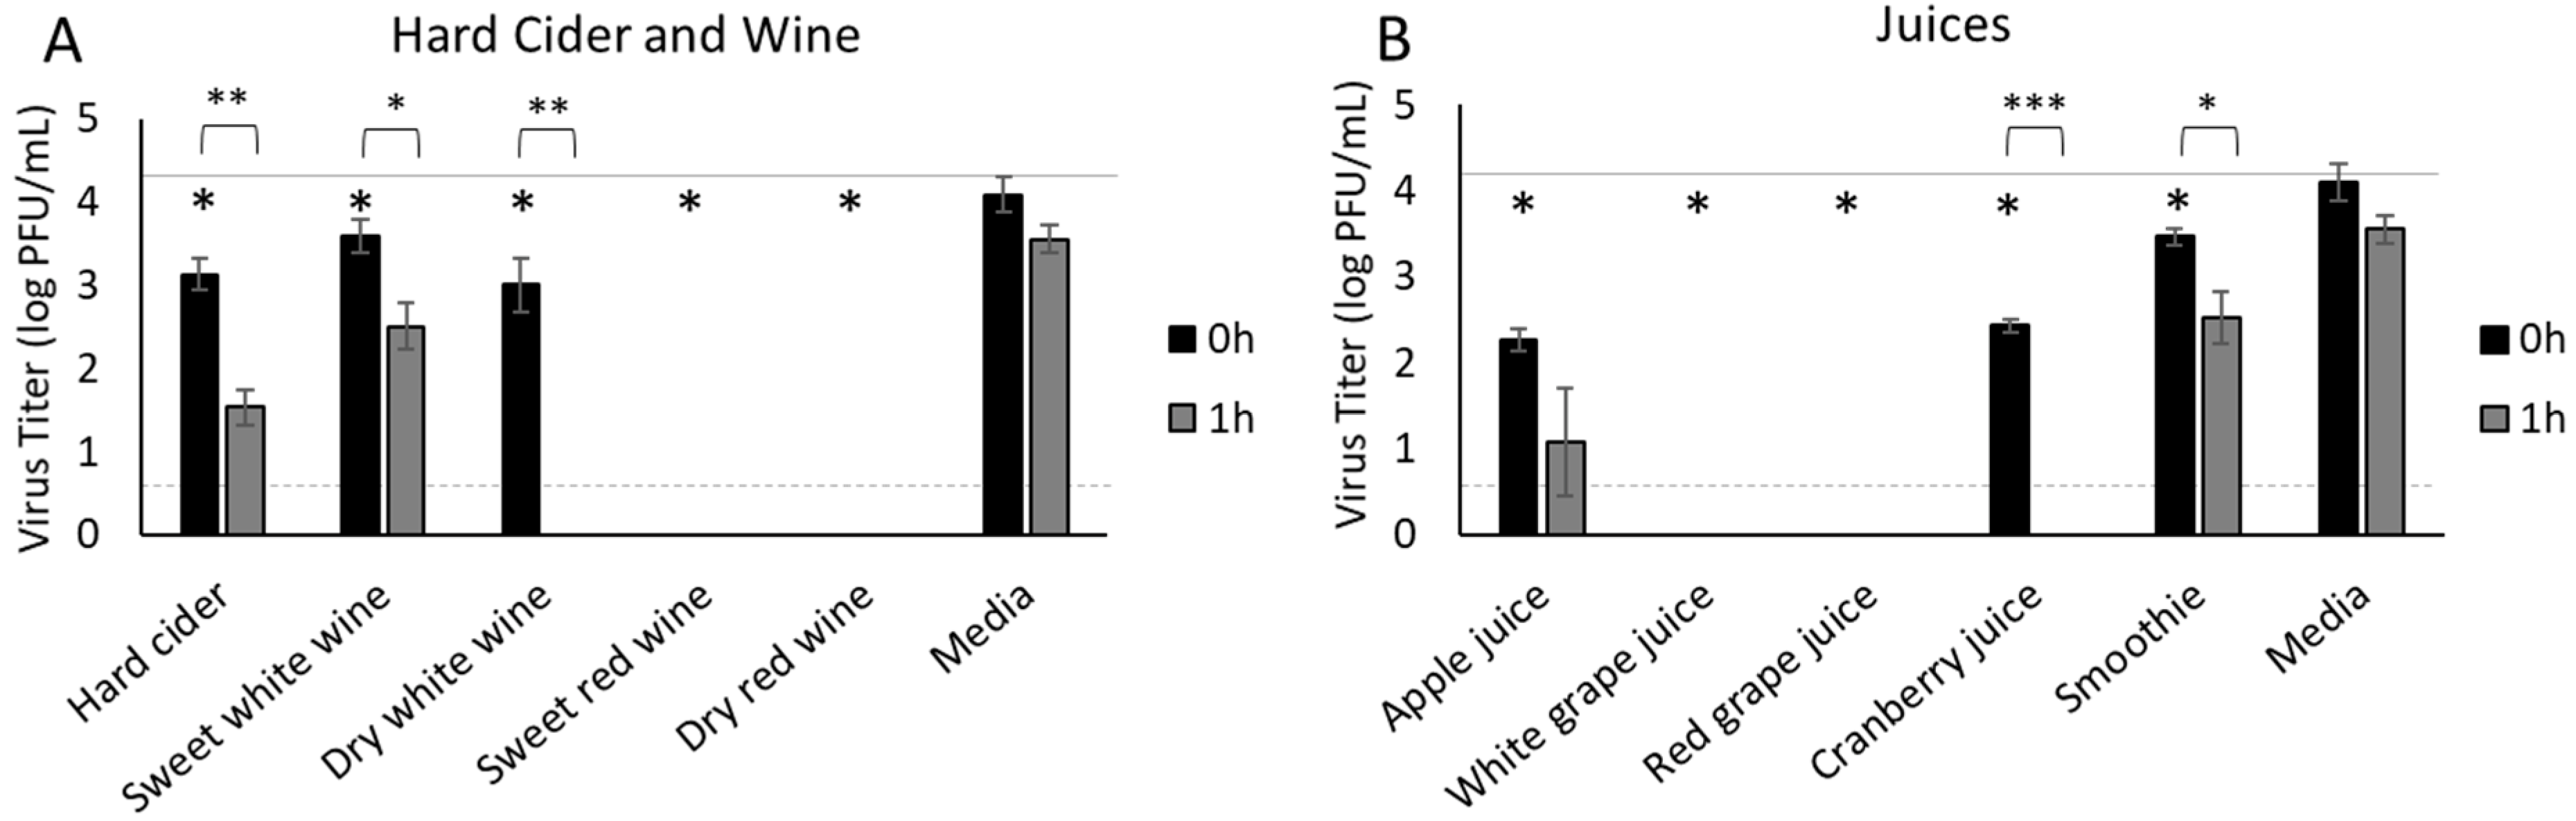
3.4. Hard Cider, Wine and Fruit Juices
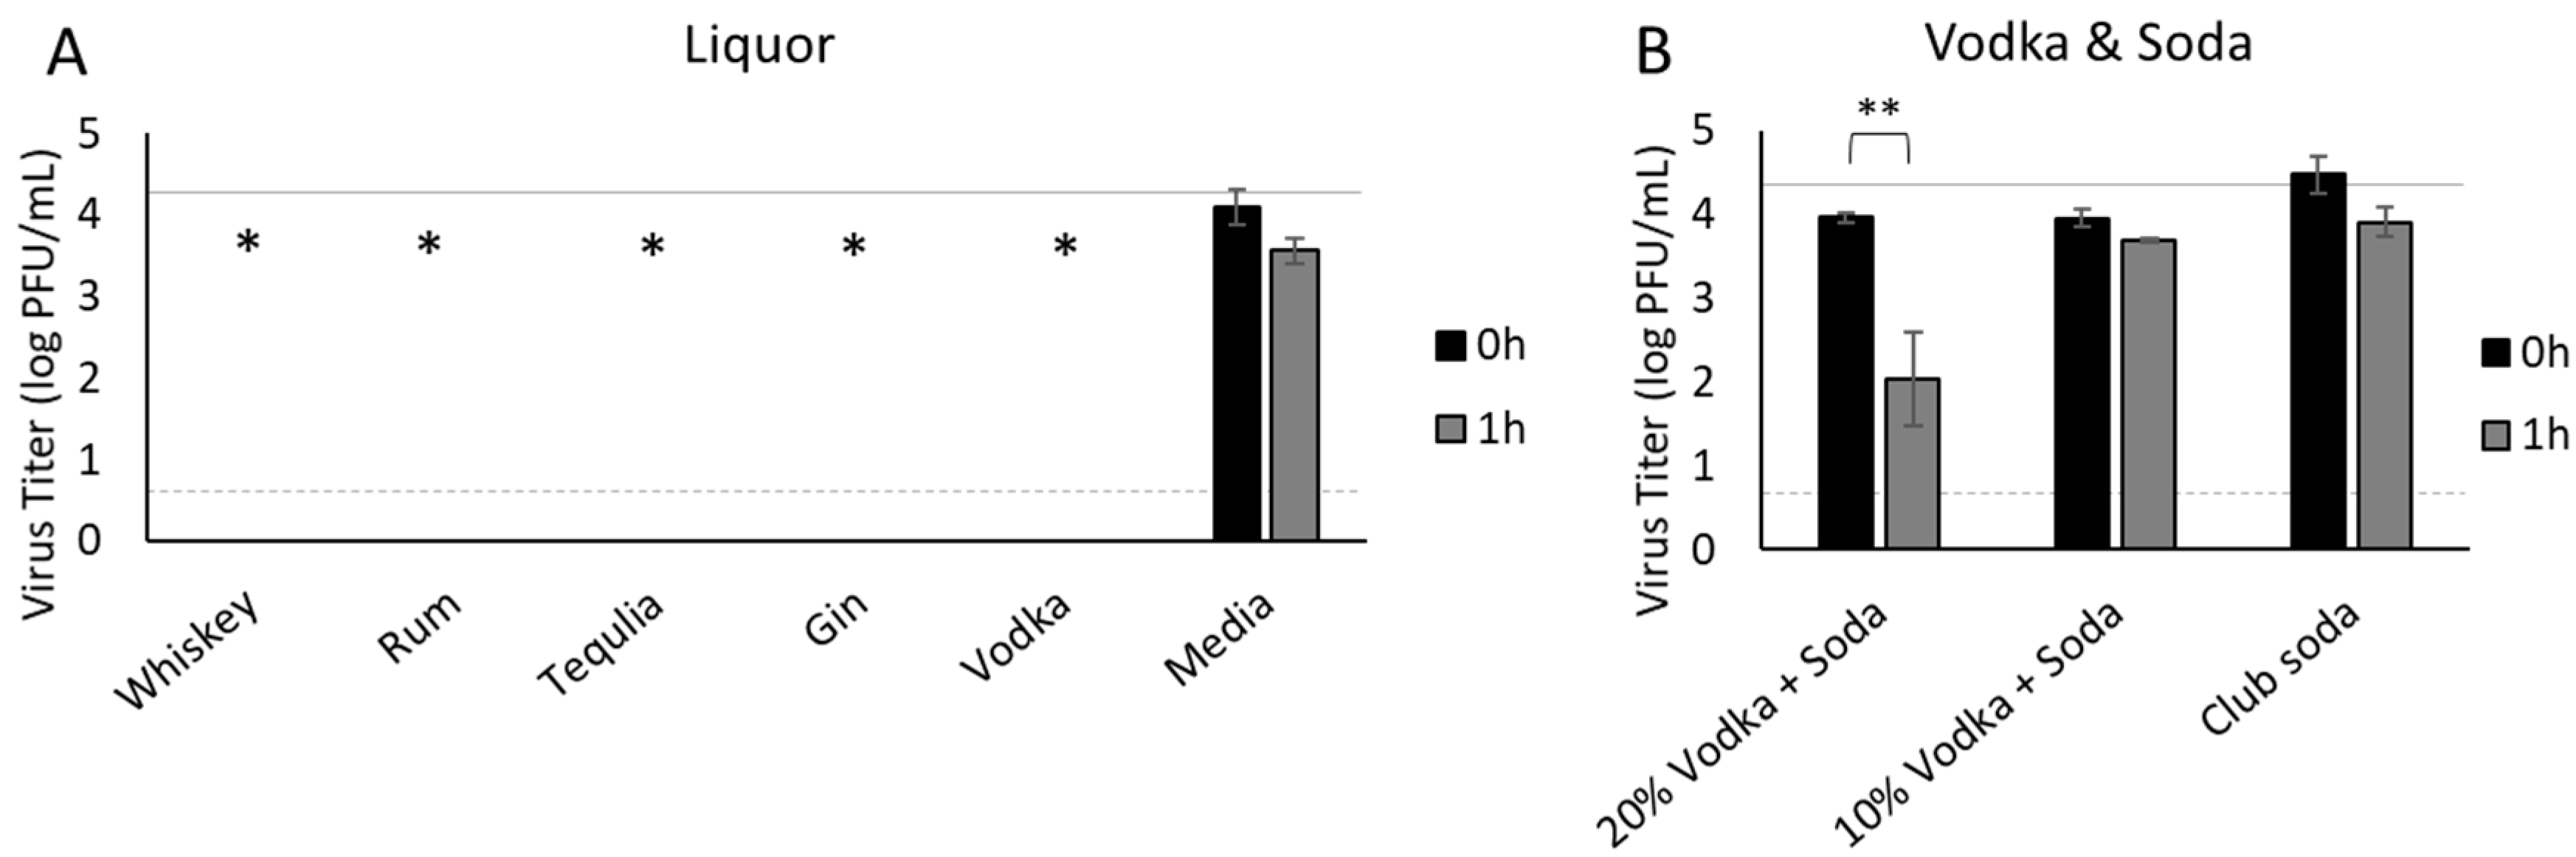
3.5. Liquor
3.6. Characteristics of Beverages
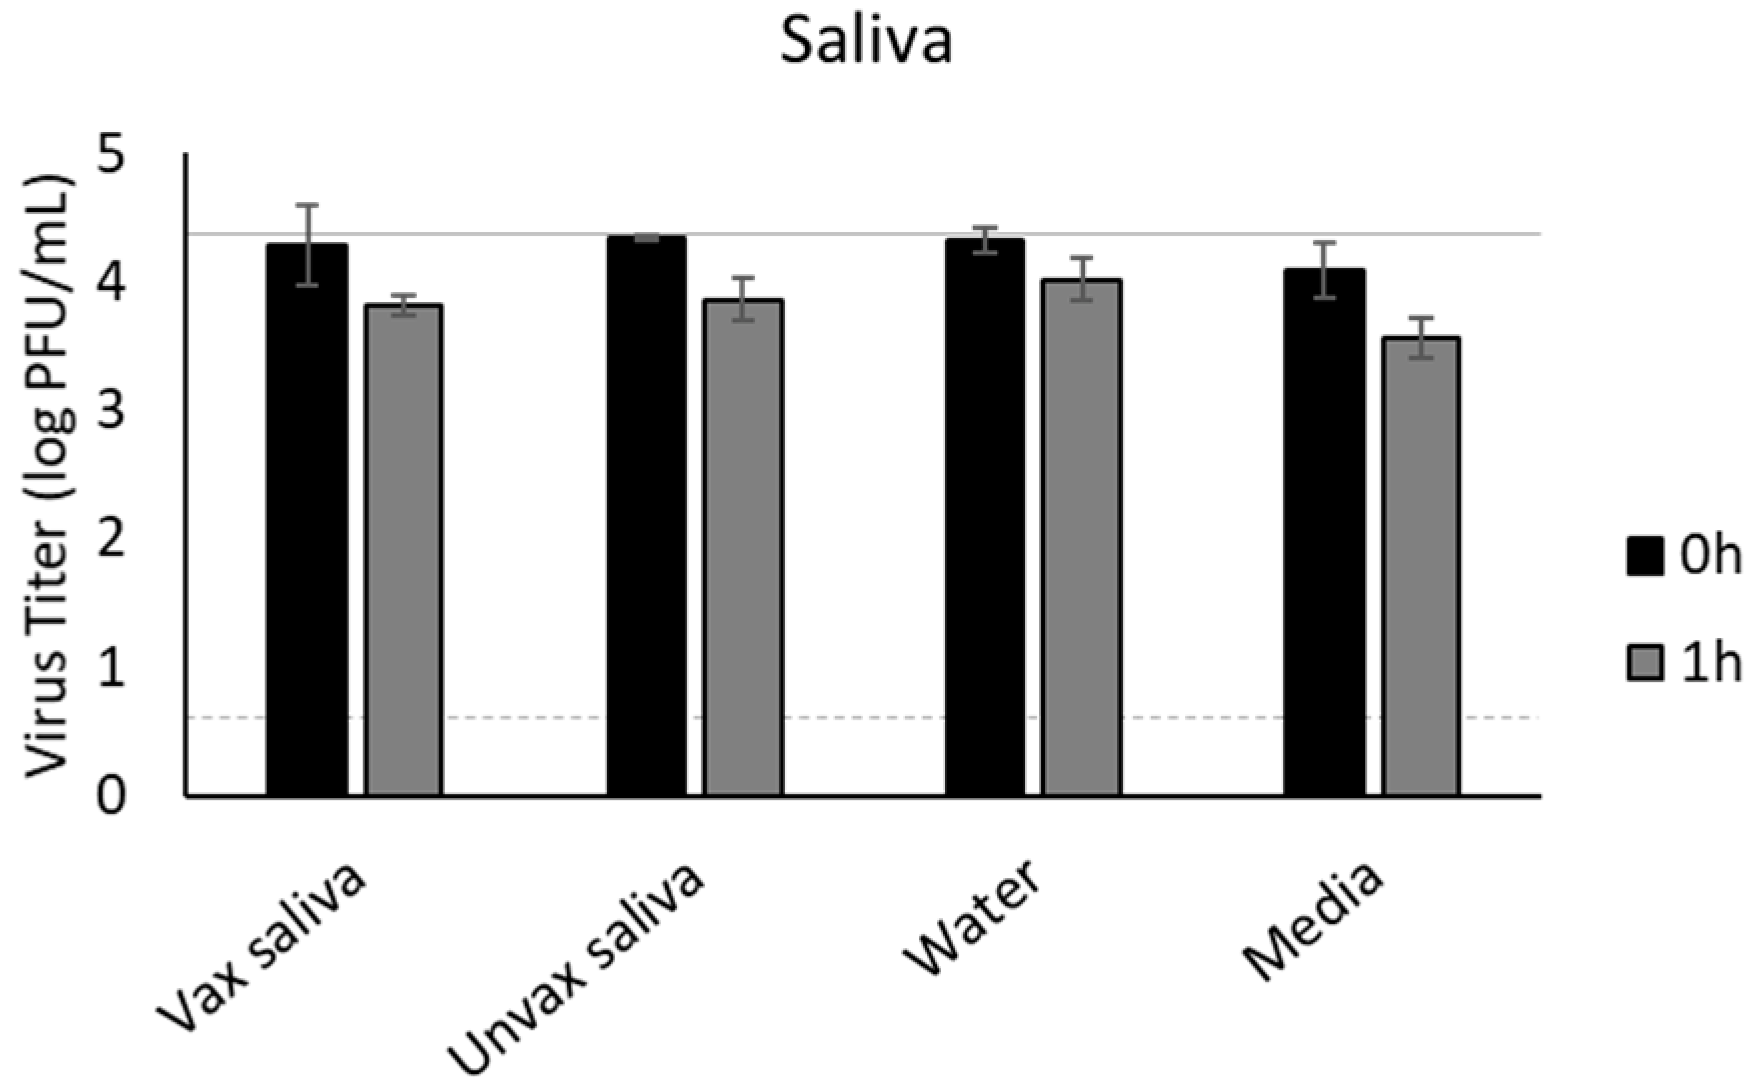
3.7. Saliva
4. Discussion
5. Conclusions
Author Contributions
Funding
Data Availability Statement
Acknowledgments
Conflicts of Interest
References
- World Health Organization (WHO). Coronavirus Disease (COVID-19) Pandemic. Available online: https://www.who.int/emergencies/diseases/novel-coronavirus-2019 (accessed on 1 January 2022).
- Gharpure, R.; Sami, S.; Vostok, J.; Johnson, H.; Hall, N.; Foreman, A.; Sabo, R.T.; Schubert, P.L.; Shephard, H.; Brown, V.R.; et al. Multistate outbreak of SARS-CoV-2 infections, including vaccine breakthrough infections, associated with large public gatherings, United States. Emerg. Infect. Dis. 2022, 28, 35–43. [Google Scholar] [CrossRef] [PubMed]
- Whaley, C.M.; Cantor, J.; Pera, M.; Jena, A.B. Assessing the Association between Social Gatherings and COVID-19 Risk Using Birthdays. JAMA Intern. Med. 2021, 181, 1090–1099. [Google Scholar] [CrossRef] [PubMed]
- Dhand, R.; Li, J. Coughs and sneezes: Their role in transmission of respiratory viral infections, including SARS-CoV-2. Am. J. Respir. Crit. Care Med. 2020, 202, 651–659. [Google Scholar] [CrossRef] [PubMed]
- Hamner, L. High SARS-CoV-2 attack rate following exposure at a choir practice—Skagit County, Washington, March 2020. MMWR Morb. Mortal. Wkly. Rep. 2020, 69, 606–610. [Google Scholar] [CrossRef] [PubMed]
- Groves, L.M.; Usagawa, L.; Elm, J.; Low, E.; Manuzak, A.; Quint, J.; Center, K.E.; Buff, A.M.; Kemble, S.K. Community Transmission of SARS-CoV-2 at Three Fitness Facilities—Hawaii, June–July 2020. Morb. Mortal. Wkly. Rep. 2021, 70, 316–320. [Google Scholar] [CrossRef] [PubMed]
- Wang, Y.; Xu, G.; Huang, Y.W. Modeling the load of SARS-CoV-2 virus in human expelled particles during coughing and speaking. PLoS ONE 2020, 15, e0241539. [Google Scholar] [CrossRef]
- To, K.K.; Tsang, O.T.; Yip, C.C.; Chan, K.H.; Wu, T.C.; Chan, J.M.; Leung, W.S.; Chik, T.S.; Choi, C.Y.; Kandamby, D.H.; et al. Consistent Detection of 2019 Novel Coronavirus in Saliva. Clin. Infect. Dis. 2020, 71, 841–843. [Google Scholar] [CrossRef] [Green Version]
- Jeong, H.W.; Kim, S.M.; Kim, H.S.; Kim, Y.I.; Kim, J.H.; Cho, J.Y.; Kim, S.H.; Kang, H.; Kim, S.G.; Park, S.J.; et al. Viable SARS-CoV-2 in various specimens from COVID-19 patients. Clin. Microbiol. Infect. 2020, 26, 1520–1524. [Google Scholar] [CrossRef]
- Tutuncu, E.E.; Ozgur, D.; Karamese, M. Saliva samples for detection of SARS-CoV-2 in mildly symptomatic and asymptomatic patients. J. Med. Virol. 2021, 93, 2932–2937. [Google Scholar] [CrossRef]
- World Health Organization (WHO). COVID-19 and Food Safety: Guidance for Food Businesses: Interim Guidance. Available online: https://www.who.int/publications/i/item/covid-19-and-food-safety-guidance-for-food-businesses (accessed on 11 November 2021).
- Food and Drug Administration (FDA). Food Safety and the Coronavirus Disease 2019 (COVID-19). Available online: https://www.fda.gov/food/food-safety-during-emergencies/food-safety-and-coronavirus-disease-2019-covid-19 (accessed on 17 March 2021).
- European Food Safety Authority (EFSA). Coronavirus: No Evidence that Food Is a Source or Transmission Route. Available online: https://www.efsa.europa.eu/en/news/coronavirus-no-evidence-food-source-or-transmission-route (accessed on 11 November 2021).
- Liu, P.; Yang, M.; Zhao, X.; Guo, Y.; Wang, L.; Zhang, J.; Lei, W.; Han, W.; Jiang, F.; Liu, W.J. Cold-chain transportation in the frozen food industry may have caused a recurrence of COVID-19 cases in destination: Successful isolation of SARS-CoV-2 virus from the imported frozen cod package surface. Biosaf. Health 2020, 2, 199–201. [Google Scholar] [CrossRef]
- Han, J.; Zhang, X.; He, S.; Jia, P. Can the coronavirus disease be transmitted from food? A review of evidence, risks, policies and knowledge gaps. Environ. Chem. Lett. 2020, 1, 1–12. [Google Scholar] [CrossRef]
- Associated Press. Chinese City Reports Coronavirus Found on Ice Cream. Available online: https://apnews.com/article/beijing-tianjin-coronavirus-pandemic-wuhan-china-a75ec51c11338190c483c78d65c3348d (accessed on 17 March 2021).
- Dhakal, J.; Jia, M.; Joyce, J.D.; Moore, G.A.; Ovissipour, R.; Bertke, A.S. Survival of Severe Acute Respiratory Syndrome Coronavirus 2 (SARS-CoV-2) and Herpes Simplex Virus 1 (HSV-1) on Foods Stored at Refrigerated Temperature. Foods 2021, 10, 1005. [Google Scholar] [CrossRef] [PubMed]
- Pang, X.; Ren, L.; Wu, S.; Ma, W.; Yang, J.; Di, L.; Li, J.; Xiao, Y.; Kang, L.; Du, S. Cold-chain food contamination as the possible origin of COVID-19 resurgence in Beijing. Natl. Sci. Rev. 2020, 7, 1861–1864. [Google Scholar] [CrossRef] [PubMed]
- Feng, X.-L.; Li, B.; Lin, H.-F.; Zheng, H.-Y.; Tian, R.-R.; Luo, R.-H.; Liu, M.-Q.; Jiang, R.-D.; Zheng, Y.-T.; Shi, Z.-L. Stability of SARS-CoV-2 on the Surfaces of Three Meats in the Setting That Simulates the Cold Chain Transportation. Virol. Sin. 2021, 36, 1069–1072. [Google Scholar] [CrossRef] [PubMed]
- Jia, M.; Taylor, T.M.; Senger, S.M.; Ovissipour, R.; Bertke, A.S. SARS-CoV-2 Remains Infectious on Refrigerated Deli Food, Meats, and Fresh Produce for up to 21 Days. Foods 2022, 11, 286. [Google Scholar] [CrossRef] [PubMed]
- Zhang, H.; Rostami, M.R.; Leopold, P.L.; Mezey, J.G.; O’Beirne, S.L.; Strulovici-Barel, Y.; Crystal, R.G. Expression of the SARS-CoV-2 ACE2 receptor in the human airway epithelium. Am. J. Respir. Crit. Care Med. 2020, 202, 219–229. [Google Scholar] [CrossRef]
- Letko, M.; Marzi, A.; Munster, V. Functional assessment of cell entry and receptor usage for SARS-CoV-2 and other lineage B betacoronaviruses. Nat. Microbiol. 2020, 5, 562–569. [Google Scholar] [CrossRef] [Green Version]
- Beyerstedt, S.; Casaro, E.B.; Rangel, É.B. COVID-19: Angiotensin-converting enzyme 2 (ACE2) expression and tissue susceptibility to SARS-CoV-2 infection. Eur. J. Clin. Microbiol. Infect. Dis. 2021, 40, 905–919. [Google Scholar] [CrossRef]
- Ketas, T.J.; Chaturbhuj, D.; Portillo, V.M.C.; Francomano, E.; Golden, E.; Chandrasekhar, S.; Debnath, G.; Diaz-Tapia, R.; Yasmeen, A.; Kramer, K.D.; et al. Antibody Responses to SARS-CoV-2 mRNA Vaccines Are Detectable in Saliva. Pathog. Immun. 2021, 6, 116–134. [Google Scholar] [CrossRef]
- Yoon, J.G.; Yoon, J.; Song, J.Y.; Yoon, S.Y.; Lim, C.S.; Seong, H.; Noh, J.Y.; Cheong, H.J.; Kim, W.J. Clinical Significance of a High SARS-CoV-2 Viral Load in the Saliva. J. Korean Med. Sci. 2020, 35, e195. [Google Scholar] [CrossRef]
- Ott, I.M.; Strine, M.S.; Watkins, A.E.; Boot, M.; Kalinich, C.C.; Harden, C.A.; Vogels, C.B.F.; Casanovas-Massana, A.; Moore, A.J.; Muenker, M.C.; et al. Stability of SARS-CoV-2 RNA in Nonsupplemented Saliva. Emerg. Infect. Dis. 2021, 27, 1146–1150. [Google Scholar] [CrossRef]
- Huang, N.; Perez, P.; Kato, T.; Mikami, Y.; Okuda, K.; Gilmore, R.C.; Conde, C.D.; Gasmi, B.; Stein, S.; Beach, M.; et al. SARS-CoV-2 infection of the oral cavity and saliva. Nat. Med. 2021, 27, 892–903. [Google Scholar] [CrossRef] [PubMed]
- Ota, K.; Yanagihara, K.; Sasaki, D.; Kaku, N.; Uno, N.; Sakamoto, K.; Kosai, K.; Miyazaki, T.; Hasegawa, H.; Fujita, A.; et al. Detection of SARS-CoV-2 using qRT-PCR in saliva obtained from asymptomatic or mild COVID-19 patients, comparative analysis with matched nasopharyngeal samples. PLoS ONE 2021, 16, e0252964. [Google Scholar] [CrossRef] [PubMed]
- Corstjens, P.L.; Abrams, W.R.; Malamud, D. Saliva and viral infections. Periodontol. 2000 2016, 70, 93–110. [Google Scholar] [CrossRef] [PubMed]
- Brown, C.M.; Vostok, J.; Johnson, H.; Burns, M.; Gharpure, R.; Sami, S.; Sabo, R.T.; Hall, N.; Foreman, A.; Schubert, P.L.; et al. Outbreak of SARS-CoV-2 Infections, Including COVID-19 Vaccine Breakthrough Infections, Associated with Large Public Gatherings—Barnstable County, Massachusetts, July 2021. MMWR Morb. Mortal. Wkly. Rep. 2021, 70, 1059–1062. [Google Scholar] [CrossRef]
- Sami, S.; Turbyfill, C.R.; Daniel-Wayman, S.; Shonkwiler, S.; Fisher, K.A.; Kuhring, M.; Patrick, A.M.; Hinton, S.; Minor, A.S.; Ricaldi, J.N.; et al. Community Transmission of SARS-CoV-2 Associated with a Local Bar Opening Event—Illinois, February 2021. MMWR Morb. Mortal. Wkly. Rep. 2021, 70, 528–532. [Google Scholar] [CrossRef]
- Muller, N.; Kunze, M.; Steitz, F.; Saad, N.J.; Muhlemann, B.; Beheim-Schwarzbach, J.I.; Schneider, J.; Drosten, C.; Murajda, L.; Kochs, S.; et al. Severe Acute Respiratory Syndrome Coronavirus 2 Outbreak Related to a Nightclub, Germany, 2020. Emerg. Infect. Dis. 2020, 27, 645–648. [Google Scholar] [CrossRef]
- Kripattanapong, S.; Jitpeera, C.; Wongsanuphat, S.; Issarasongkhram, M.; Mungaomklang, A.; Suphanchaimat, R. Clusters of Coronavirus Disease (COVID-19) in Pubs, Bars and Nightclubs in Bangkok, 2020. Outbreak Surveill. Investig. Response (OSIR) J. 2020, 13, 146–153. [Google Scholar]
- Song, J.; Li, Y.; Huang, X.; Chen, Z.; Li, Y.; Liu, C.; Chen, Z.; Duan, X. Systematic analysis of ACE2 and TMPRSS2 expression in salivary glands reveals underlying transmission mechanism caused by SARS-CoV-2. J. Med. Virol. 2020, 92, 2556–2566. [Google Scholar] [CrossRef]
- Xiao, F.; Tang, M.; Zheng, X.; Liu, Y.; Li, X.; Shan, H. Evidence for Gastrointestinal Infection of SARS-CoV-2. Gastroenterology 2020, 158, 1831–1833. [Google Scholar] [CrossRef]
- Lin, L.; Jiang, X.; Zhang, Z.; Huang, S.; Zhang, Z.; Fang, Z.; Gu, Z.; Gao, L.; Shi, H.; Mai, L.; et al. Gastrointestinal symptoms of 95 cases with SARS-CoV-2 infection. Gut 2020, 69, 997–1001. [Google Scholar] [CrossRef] [PubMed]
- Karamanolis, G.; Theofanidou, I.; Yiasemidou, M.; Giannoulis, E.; Triantafyllou, K.; Ladas, S.D. A Glass of Water Immediately Increases Gastric pH in Healthy Subjects. Dig. Dis. Sci. 2008, 53, 3128–3132. [Google Scholar] [CrossRef]
- Chin, A.W.H.; Chu, J.T.S.; Perera, M.R.A.; Hui, K.P.Y.; Yen, H.-L.; Chan, M.C.W.; Peiris, M.; Poon, L.L.M. Stability of SARS-CoV-2 in different environmental conditions. Lancet Microbe 2020, 1, e10. [Google Scholar] [CrossRef]
- Jiao, L.; Li, H.; Xu, J.; Yang, M.; Ma, C.; Li, J.; Zhao, S.; Wang, H.; Yang, Y.; Yu, W. The gastrointestinal tract is an alternative route for SARS-CoV-2 infection in a nonhuman primate model. Gastroenterology 2020. [Google Scholar] [CrossRef] [PubMed]
- Yekta, R.; Vahid-Dastjerdi, L.; Norouzbeigi, S.; Mortazavian, A.M. Food Products as Potential Carriers of SARS-CoV-2. Food Control 2020, 123, 107754. [Google Scholar] [CrossRef] [PubMed]
- Velebit, B.; Milojevic, L.; Jankovic, V.; Lakicevic, B.; Baltic, T.; Nikolic, A.; Grkovic, N. Surface adsorption and survival of SARS-CoV-2 on frozen meat. IOP Conf. Ser. Earth Environ. Sci. 2021, 854, 012101. [Google Scholar] [CrossRef]
- Stewart, H.; Kuchler, F.; Cessna, J.; Hahn, W. Are Plant-Based Analogues Replacing Cow’s Milk in the American Diet? J. Agric. Appl. Econ. 2020, 52, 562–579. [Google Scholar] [CrossRef]
- Farahmandfar, R.; Asnaashari, M.; Hesami, B. Monitoring of new coronavirus (SARS-CoV-2): Origin, transmission, and food preservation methods. J. Food Process. Preserv. 2021, 1, e15564. [Google Scholar] [CrossRef]
- Norouzbeigi, S.; Yekta, R.; Vahid-Dastjerdi, L.; Keyvani, H.; Ranjbar, M.M.; Shadnoush, M.; Khorshidian, N.; Yousefi, M.; Sohrabvandi, S.; Mortazavian, A.M. Stability of severe acute respiratory syndrome coronavirus 2 in dairy products. J. Food Saf. 2021, 1, e12917. [Google Scholar] [CrossRef]
- USDA. Estimated Fluid Milk Products Sales Report. Agricultural Marketing Service; USDA: Washington, DC, USA, 2021. [Google Scholar]
- Kamei, M.; Nishimura, H.; Takahashi, T.; Takahashi, N.; Inokuchi, K.; Mato, T.; Takahashi, K. Anti-influenza virus effects of cocoa. J. Sci. Food Agric. 2016, 96, 1150–1158. [Google Scholar] [CrossRef]
- Zhu, Y.; Xie, D.Y. Docking Characterization and in vitro Inhibitory Activity of Flavan-3-ols and Dimeric Proanthocyanidins Against the Main Protease Activity of SARS-Cov-2. Front. Plant. Sci. 2020, 11, 601316. [Google Scholar] [CrossRef] [PubMed]
- Martin, C.B.; Wambogo, E.A.; Ahluwalia, N.; Ogden, C.L. Nonalcoholic Beverage Consumption Among Adults: United States, 2015–2018; NCHS Data Brief; US Department of Health and Human Services, Centers for Disease Control and Prevention, National Center for Health Statistics: Washington, DC, USA, 2020; pp. 1–8. [Google Scholar]
- Utsunomiya, H.; Ichinose, M.; Uozaki, M.; Tsujimoto, K.; Yamasaki, H.; Koyama, A.H. Antiviral activities of coffee extracts in vitro. Food Chem. Toxicol. 2008, 46, 1919–1924. [Google Scholar] [CrossRef] [PubMed]
- Mhatre, S.; Srivastava, T.; Naik, S.; Patravale, V. Antiviral activity of green tea and black tea polyphenols in prophylaxis and treatment of COVID-19: A review. Phytomedicine 2021, 85, 153286. [Google Scholar] [CrossRef] [PubMed]
- Takeda, Y.; Tamura, K.; Jamsransuren, D.; Matsuda, S.; Ogawa, H. Severe Acute Respiratory Syndrome Coronavirus-2 Inactivation Activity of the Polyphenol-Rich Tea Leaf Extract with Concentrated Theaflavins and Other Virucidal Catechins. Molecules 2021, 26, 4803. [Google Scholar] [CrossRef] [PubMed]
- Ohgitani, E.; Shin-Ya, M.; Ichitani, M.; Kobayashi, M.; Takihara, T.; Kawamoto, M.; Kinugasa, H.; Mazda, O. Rapid inactivation in vitro of SARS-CoV-2 in saliva by black tea and green tea. Pathogens 2021, 10, 721. [Google Scholar] [CrossRef]
- Herrick, K.A.; Terry, A.L.; Afful, J. Beverage Consumption Among Youth in the United States, 2013-2016; NCHS Data Brief; US Department of Health and Human Services, Centers for Disease Control and Prevention, National Center for Health Statistics: Washington, DC, USA, 2018; pp. 1–8. [Google Scholar]
- Konowalchuk, J.; Speirs, J.I. Antiviral effect of commercial juices and beverages. Appl. Environ. Microbiol. 1978, 35, 1219–1220. [Google Scholar] [CrossRef] [Green Version]
- Suárez, B.; Álvarez, Á.L.; García, Y.D.; del Barrio, G.; Lobo, A.P.; Parra, F. Phenolic profiles, antioxidant activity and in vitro antiviral properties of apple pomace. Food Chem. 2010, 120, 339–342. [Google Scholar] [CrossRef] [Green Version]
- Weiss, E.I.; Houri-Haddad, Y.; Greenbaum, E.; Hochman, N.; Ofek, I.; Zakay-Rones, Z. Cranberry juice constituents affect influenza virus adhesion and infectivity. Antiviral. Res. 2005, 66, 9–12. [Google Scholar] [CrossRef]
- Oiknine-Djian, E.; Houri-Haddad, Y.; Weiss, E.I.; Ofek, I.; Greenbaum, E.; Hartshorn, K.; Zakay-Rones, Z. High molecular weight constituents of cranberry interfere with influenza virus neuraminidase activity in vitro. Planta Med. 2012, 78, 962–967. [Google Scholar] [CrossRef]
- Luganini, A.; Terlizzi, M.E.; Catucci, G.; Gilardi, G.; Maffei, M.E.; Gribaudo, G. The Cranberry Extract Oximacro((R)) Exerts in vitro Virucidal Activity Against Influenza Virus by Interfering With Hemagglutinin. Front. Microbiol. 2018, 9, 1826. [Google Scholar] [CrossRef]
- Terlizzi, M.E.; Occhipinti, A.; Luganini, A.; Maffei, M.E.; Gribaudo, G. Inhibition of herpes simplex type 1 and type 2 infections by Oximacro((R)), a cranberry extract with a high content of A-type proanthocyanidins (PACs-A). Antiviral. Res. 2016, 132, 154–164. [Google Scholar] [CrossRef] [PubMed] [Green Version]
- Sivakumar, D.; Jiang, Y.; Yahia, E.M. Maintaining mango (Mangifera indica L.) fruit quality during the export chain. Food Res. Int. 2011, 44, 1254–1263. [Google Scholar] [CrossRef]
- Hossain, M.A.; Rahman, S.M.M. Total phenolics, flavonoids and antioxidant activity of tropical fruit pineapple. Food Res. Int. 2011, 44, 672–676. [Google Scholar] [CrossRef]
- Franke, A.A.; Cooney, R.V.; Henning, S.M.; Custer, L.J. Bioavailability and Antioxidant Effects of Orange Juice Components in Humans. J. Agric. Food Chem. 2005, 53, 5170–5178. [Google Scholar] [CrossRef] [PubMed] [Green Version]
- Boersma, P.; Villarroel, M.A.; Vahratian, A. Heavy Drinking among U.S. Adults, 2018; NCHS Data Brief; US Department of Health and Human Services, Centers for Disease Control and Prevention, National Center for Health Statistics: Washington, DC, USA, 2020; pp. 1–8. [Google Scholar]
- Cliver, D.O.; Kostenbader, K.D., Jr. Antiviral Effectiveness of Grape Juice. J. Food Prot. 1979, 42, 100–104. [Google Scholar] [CrossRef] [PubMed]
- Konowalchuk, J.; Speirs, J.I. Virus inactivation by grapes and wines. Appl. Environ. Microbiol. 1976, 32, 757–763. [Google Scholar] [CrossRef] [Green Version]
- Annunziata, G.; Maisto, M.; Schisano, C.; Ciampaglia, R.; Narciso, V.; Tenore, G.C.; Novellino, E. Resveratrol as a Novel Anti-Herpes Simplex Virus Nutraceutical Agent: An Overview. Viruses 2018, 10, 473. [Google Scholar] [CrossRef] [Green Version]
- Lin, S.C.; Ho, C.T.; Chuo, W.H.; Li, S.; Wang, T.T.; Lin, C.C. Effective inhibition of MERS-CoV infection by resveratrol. BMC Infect. Dis. 2017, 17, 144. [Google Scholar] [CrossRef] [Green Version]
- Barh, D.; Tiwari, S.; Weener, M.E.; Azevedo, V.; Goes-Neto, A.; Gromiha, M.M.; Ghosh, P. Multi-omics-based identification of SARS-CoV-2 infection biology and candidate drugs against COVID-19. Comput. Biol. Med. 2020, 126, 104051. [Google Scholar] [CrossRef]
- Cheynier, V.; Prieur, C.; Guyot, S.; Rigaud, J.; Moutounet, M. The Structures of Tannins in Grapes and Wines and Their Interactions with Proteins. Am. Chem. Soc. 1997, 661, 81–93. [Google Scholar] [CrossRef]
- Khalifa, I.; Zhu, W.; Mohammed, H.H.H.; Dutta, K.; Li, C. Tannins inhibit SARS-CoV-2 through binding with catalytic dyad residues of 3CLpro: An in silico approach with 19 structural different hydrolysable tannins. J. Food Biochem. 2020, 44, e13432. [Google Scholar] [CrossRef] [PubMed]
- Wang, S.-C.; Chen, Y.; Wang, Y.-C.; Wang, W.-J.; Yang, C.-S.; Tsai, C.-L.; Hou, M.-H.; Chen, H.-F.; Shen, Y.-C.; Hung, M.-C. Tannic acid suppresses SARS-CoV-2 as a dual inhibitor of the viral main protease and the cellular TMPRSS2 protease. Am. J. Cancer Res. 2020, 10, 4538–4546. [Google Scholar] [PubMed]
- Dai, X.-j.; Tan, L.; Ren, L.; Shao, Y.; Tao, W.; Wang, Y. COVID-19 Risk Appears to Vary Across Different Alcoholic Beverages. Front. Nutr. 2022, 8. [Google Scholar] [CrossRef] [PubMed]
- Russell, M.W.; Moldoveanu, Z.; Ogra, P.L.; Mestecky, J. Mucosal Immunity in COVID-19: A Neglected but Critical Aspect of SARS-CoV-2 Infection. Front. Immunol. 2020, 11, 611337. [Google Scholar] [CrossRef] [PubMed]


| Beverage | Sugar (g) | Fat (g) | Protein (g) | Alcohol (%) | pH | Caffeine (mg) |
|---|---|---|---|---|---|---|
| Whole Milk | 5.00 | 3.33 | 3.33 | 0.0% | 6.63 ± 0.03 | 0.00 |
| Skim milk | 5.00 | 0.00 | 3.33 | 0.0% | 5.42 ± 0.21 | 0.00 |
| Chocolate milk | 9.17 | 0.83 | 3.33 | 0.0% | 6.96 ± 0.09 | 2.08 |
| Almond milk | 0.00 | 1.04 | 0.42 | 0.0% | 8.57 ± 0.15 | 0.00 |
| Coconut milk | 0.04 | 1.88 | 0.00 | 0.0% | 8.09 ± 0.15 | 0.00 |
| Apple juice | 11.67 | 0.00 | 0.00 | 0.0% | 3.96 ± 0.06 | 0.00 |
| White grape juice | 15.00 | 0.00 | 0.00 | 0.0% | 3.42 ± 0.11 | 0.00 |
| Red grape juice | 14.92 | 0.00 | 0.00 | 0.0% | 3.57 ± 0.05 | 0.00 |
| Cranberry juice | 9.80 | 0.00 | 0.00 | 0.0% | 3.10 ± 0.36 | 0.00 |
| Smoothie | 11.55 | 0.00 | 0.00 | 0.0% | 3.66 ± 0.18 | 0.00 |
| Pedialyte | 2.50 | 0.00 | 0.00 | 0.0% | 4.14 ± 0.00 | 0.00 |
| Coffee | 0.00 | 0.00 | 0.00 | 0.0% | 5.35 ± 0.14 | 56.96 |
| Tea | 0.00 | 0.00 | 0.00 | 0.0% | 5.30 ± 0.02 | 18.99 |
| Dark soda | 11.26 | 0.00 | 0.00 | 0.0% | 2.61 ± 0.22 | 9.57 |
| Light soda | 10.81 | 0.00 | 0.00 | 0.0% | 3.23 ± 0.17 | 0.00 |
| Energy drink | 10.70 | 0.00 | 0.00 | 0.0% | 3.37 ± 0.11 | 31.27 |
| Club soda | 0.00 | 0.00 | 0.00 | 0.0% | 5.30 ± 0.31 | 0.00 |
| Water | 0.00 | 0.00 | 0.00 | 0.0% | 5.95 ± 0.51 | 0.00 |
| Porter | 0.28 | 0.00 | 0.56 | 6.9% | 4.57 ± 0.05 | 0.00 |
| Stout | 1.41 | 0.00 | 0.56 | 6.0% | 4.78 ± 0.14 | 0.00 |
| IPA | 0.11 | 0.00 | 0.28 | 6.9% | 4.33 ± 0.02 | 0.00 |
| Lager | 2.54 | 0.00 | 0.00 | 5.2% | 4.51 ± 0.17 | 0.00 |
| Cheap light beer | 0.08 | 0.00 | 0.20 | 4.2% | 4.01 ± 0.14 | 0.00 |
| Non-alcoholic beer | 0.00 | 0.00 | 0.56 | 5.0% | 4.45 ± 0.06 | 0.00 |
| Hard cider | 5.07 | 0.00 | 0.00 | 5.0% | 3.37 ± 0.04 | 0.00 |
| Sweet white wine | 7.70 | 0.00 | 0.07 | 10.0% | 3.09 ± 0.09 | 0.00 |
| Dry white wine | 0.00 | 0.00 | 0.07 | 12.0% | 3.20 ± 0.14 | 0.00 |
| Sweet red wine | 4.05 | 0.00 | 0.07 | 14.7% | 3.40 ± 0.01 | 0.00 |
| Dry red wine | 0.61 | 0.00 | 0.07 | 13.0% | 3.36 ± 0.06 | 0.00 |
| Whiskey | 0.00 | 0.00 | 0.00 | 40.0% | 3.91 ± 0.01 | 0.00 |
| Rum | 0.00 | 0.00 | 0.00 | 40.0% | 4.36 ± 0.17 | 0.00 |
| Tequila | 0.00 | 0.00 | 0.00 | 40.0% | 4.32 ± 0.25 | 0.00 |
| Gin | 0.00 | 0.00 | 0.00 | 40.0% | 5.55 ± 0.31 | 0.00 |
| Vodka | 0.00 | 0.00 | 0.00 | 40.0% | 5.38 ± 0.20 | 0.00 |
| Cocoa powder (10%) | 0.00 | 1.30 | 0.00 | 0.0% | 5.39 ± 0.12 | 22.22 |
| Cocoa powder (5%) | 0.00 | 0.65 | 0.00 | 0.0% | 5.43 ± 0.07 | 11.10 |
| Cocoa powder (2.5%) | 0.00 | 0.33 | 0.00 | 0.0% | 5.62 ± 0.09 | 5.56 |
| Vodka + soda (alcohol 20%) | 0.00 | 0.00 | 0.00 | 20.0% | 6.45 ± 0.23 | 0.00 |
| Vodka + soda (alcohol 10%) | 0.00 | 0.00 | 0.00 | 10.0% | 6.18 ± 0.40 | 0.00 |
| Saliva (vaccinated) | 0.00 | 0.00 | 0.00 | 0.0% | 7.47 ± 0.53 | 0.00 |
| Saliva (unvaccinated) | 0.00 | 0.00 | 0.00 | 0.0% | 7.16 ± 0.03 | 0.00 |
| Media (DMEM) | 0.45 | 0.00 | 0.16 | 0.0% | 7.58 ± 0.03 | 0.00 |
Publisher’s Note: MDPI stays neutral with regard to jurisdictional claims in published maps and institutional affiliations. |
© 2022 by the authors. Licensee MDPI, Basel, Switzerland. This article is an open access article distributed under the terms and conditions of the Creative Commons Attribution (CC BY) license (https://creativecommons.org/licenses/by/4.0/).
Share and Cite
Jia, M.; Joyce, J.D.; Bertke, A.S. SARS-CoV-2 Survival in Common Non-Alcoholic and Alcoholic Beverages. Foods 2022, 11, 802. https://doi.org/10.3390/foods11060802
Jia M, Joyce JD, Bertke AS. SARS-CoV-2 Survival in Common Non-Alcoholic and Alcoholic Beverages. Foods. 2022; 11(6):802. https://doi.org/10.3390/foods11060802
Chicago/Turabian StyleJia, Mo, Jonathan D. Joyce, and Andrea S. Bertke. 2022. "SARS-CoV-2 Survival in Common Non-Alcoholic and Alcoholic Beverages" Foods 11, no. 6: 802. https://doi.org/10.3390/foods11060802
APA StyleJia, M., Joyce, J. D., & Bertke, A. S. (2022). SARS-CoV-2 Survival in Common Non-Alcoholic and Alcoholic Beverages. Foods, 11(6), 802. https://doi.org/10.3390/foods11060802