
Detection of Peanut Traces in Food by an Official Food Safety Laboratory


Abstract
:1. Introduction
2. Materials and Methods
2.1. Food Matrix and Sample Preparation
2.2. DNA Extraction
2.3. Real-Time PCR Procedure
2.4. Determination of Specificity
2.5. Determination of Sensitivity
2.6. Robustness
2.7. Repeatability
3. Results
3.1. Specificity
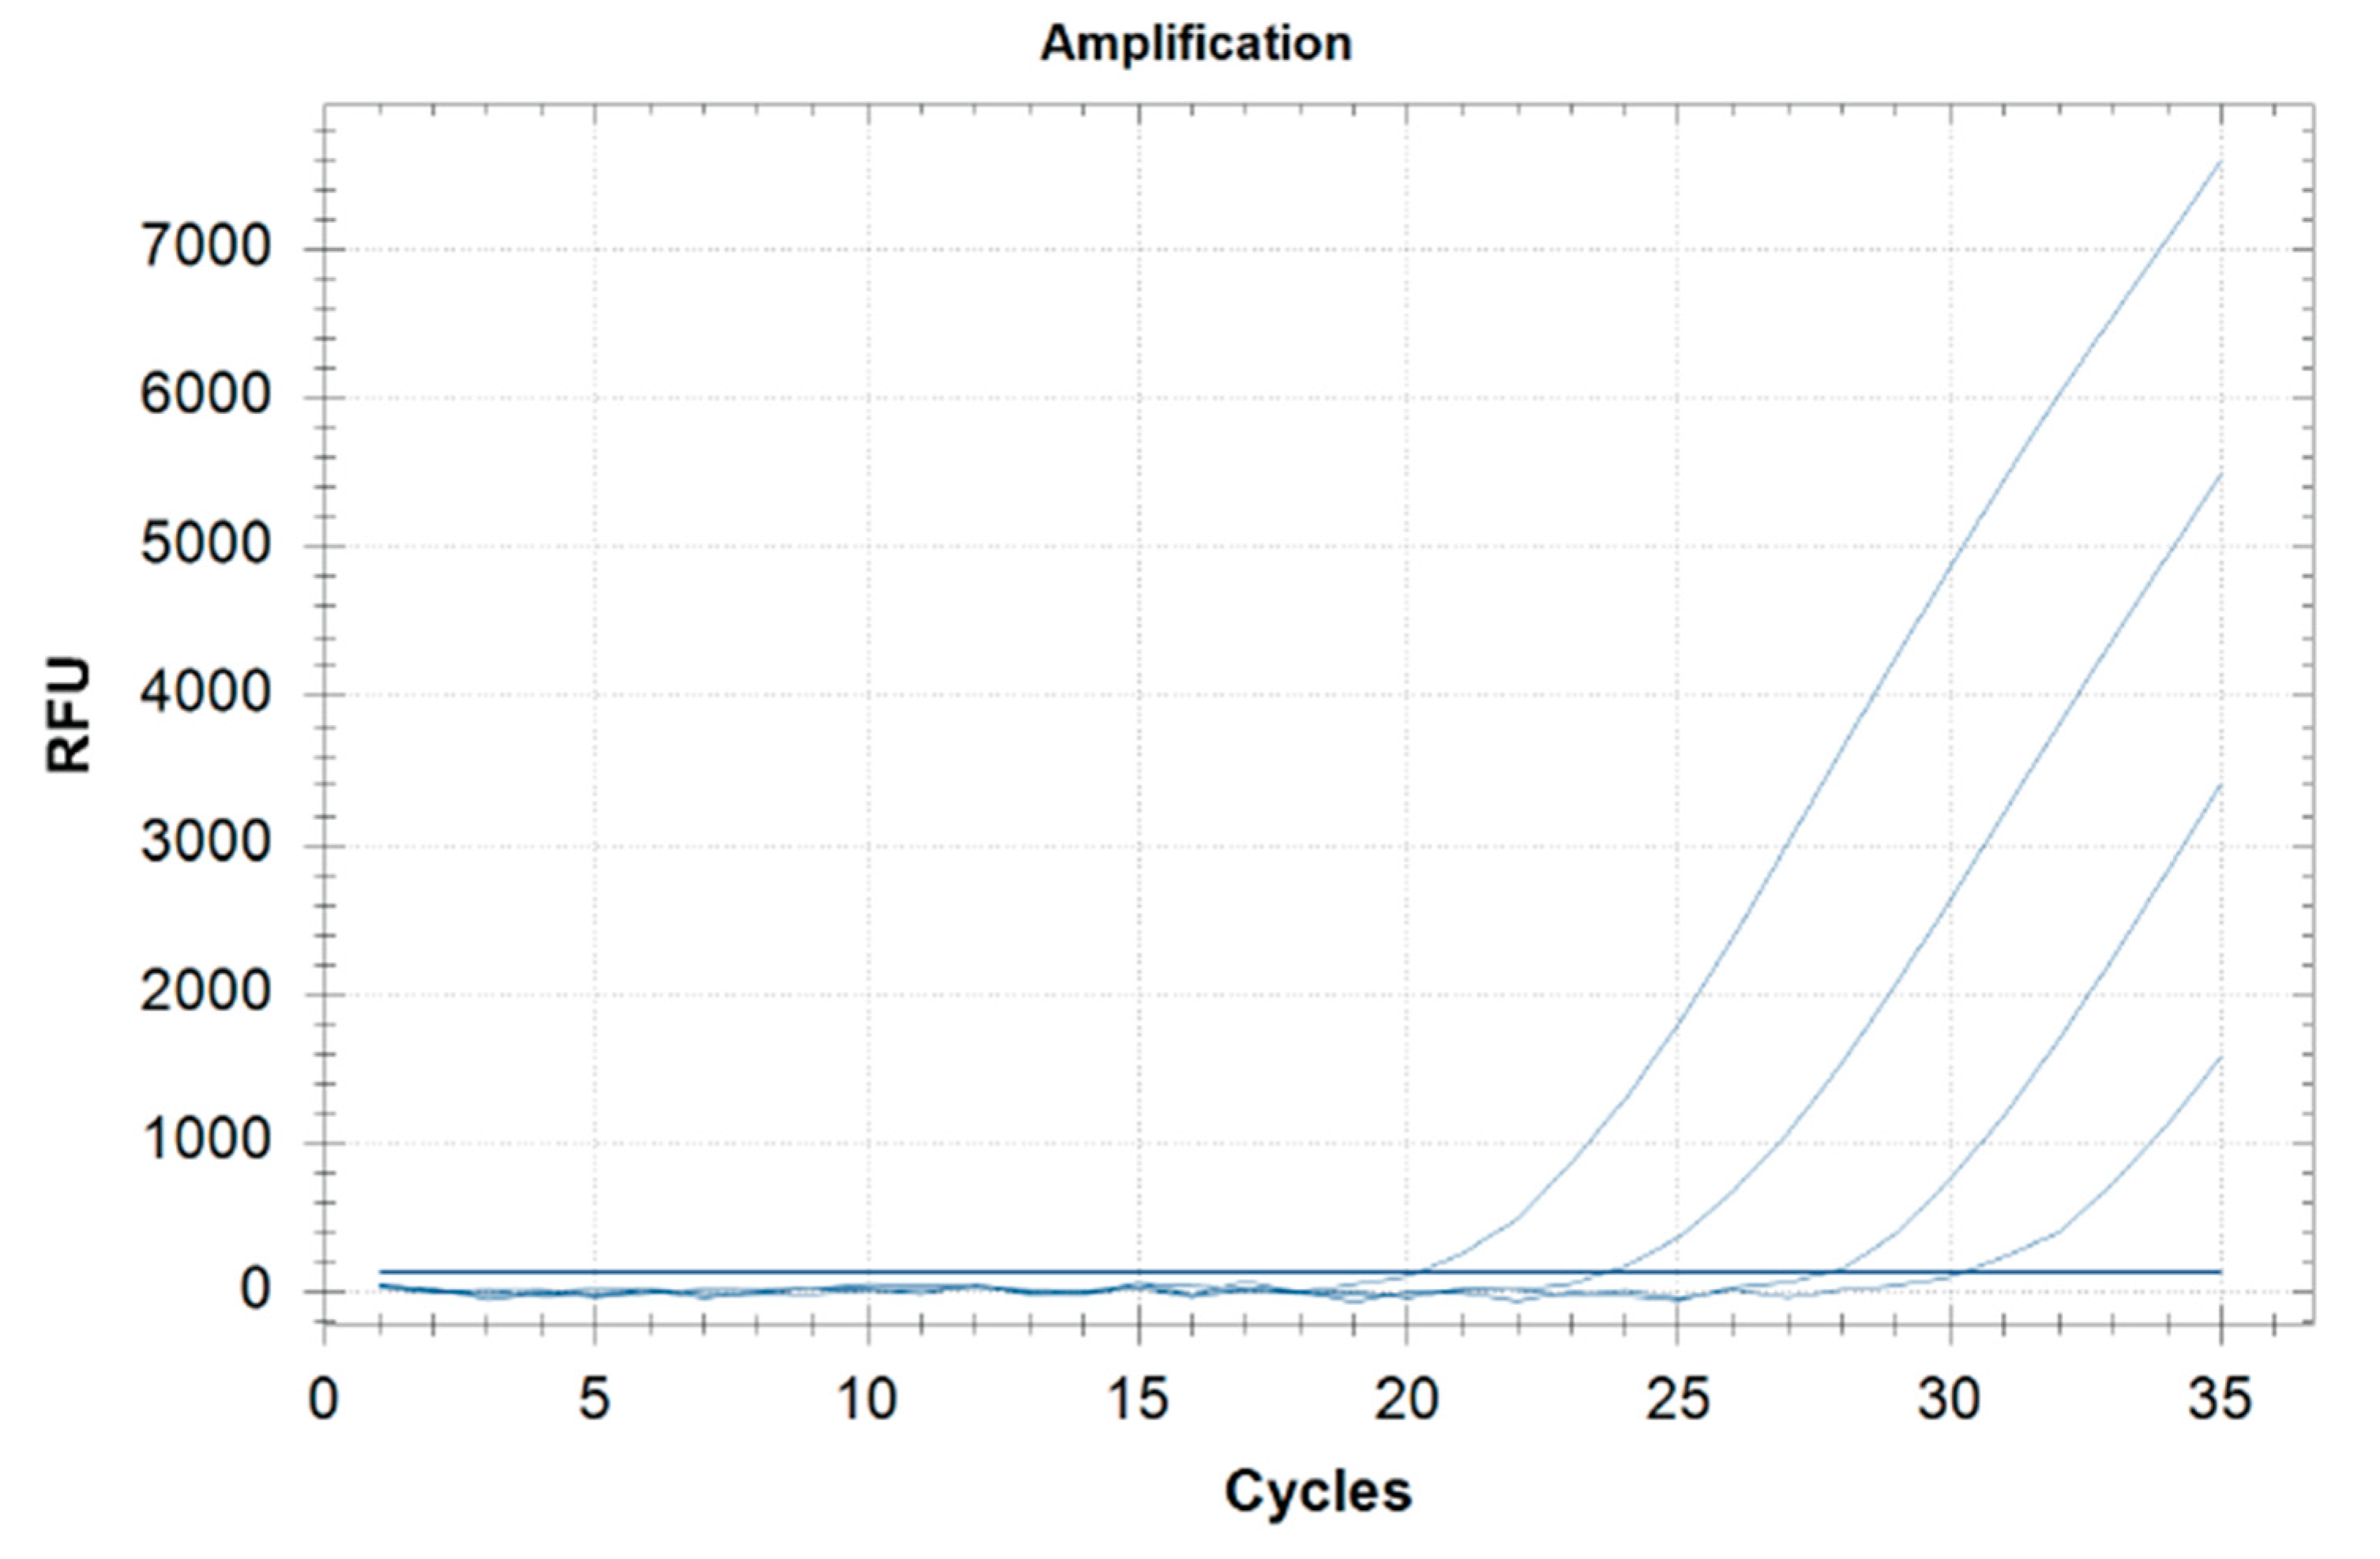
3.2. Sensitivity
3.3. Robustness
3.4. Repeatability
4. Discussion
5. Conclusions
Author Contributions
Funding
Data Availability Statement
Conflicts of Interest
References
- Worm, M.; Timmermans, F.; Moneret-Vautrin, A.; Muraro, A.; Malmheden Yman, I.I.; Lövik, M.; Hattersley, S.; Crevel, R. Towards a European registry of severe allergic reactions: Current status of national registries and future needs. Allergy 2010, 65, 671–680. [Google Scholar] [CrossRef] [PubMed]
- Regulation (EU) No. 1169/2011 of the European Parliament and of the Council of 25 October 2011 on the provision of food information to consumers. OJEU 2011, 304, 18–63. Available online: https://eur-lex.europa.eu/LexUriServ/LexUriServ.do?uri=OJ:L:2011:304:0018:0063:en:PDF (accessed on 25 October 2011).
- Hird, H.; Lloyd, J.; Goodier, R.; Brown, J.; Reece, P. Detection of peanut using real-time polymerase chain reaction. Eur. Food Res. Technol. 2003, 217, 265–268. [Google Scholar] [CrossRef]
- Patel, R.; Koterba, A.P. Peanut Allergy; StatPearls Publishing: Treasure Island, FL, USA, 2022. Available online: https://pubmed.ncbi.nlm.nih.gov/30860761/ (accessed on 11 July 2021).
- European Food Safety Authority. Scientific Opinion on the evaluation of allergenic foods and food ingredients for labelling purposes. EFSA J. 2014, 12, 3894. [Google Scholar]
- Cannon, H.E. The Economic Impact of Peanut Allergies. Am. J. Manag. Care. 2018, 24, S0. [Google Scholar]
- Garino, C.; De Paolis, A.; Coïsson, J.D.; Bianchi, D.M.; Decastelli, L.; Arlorio, M. Sensitive and specific detection of pine nut (Pinus spp.) by real-time PCR in complex food products. Food Chem. 2016, 194, 980–985. [Google Scholar] [CrossRef] [PubMed]
- Bianchi, D.M.; Maurella, C.; Gallina, S.; Gorrasi, I.S.R.; Caramelli, M.; Decastelli, L. Analysis of Gluten Content in Gluten-Free Pizza from Certified Take-Away Pizza Restaurants. Foods 2018, 7, 180. [Google Scholar] [CrossRef] [PubMed] [Green Version]
- FDA Foods Program Regulatory Science Steering Committee (RSSC). Guidelines for the Validation of Analytical Methods for Nucleic Acid Sequence-Based Analysis of Food, Feed, Cosmetics and Veterinary Products; U.S. Food and Drug Administration: White Oak, MD, USA, 2020; pp. 1–39. Available online: https://www.fda.gov/media/121751/download (accessed on 20 October 2020).
- Commission Regulation (EC) No 2073/2005 on microbiological criteria for foodstuffs. OJEU 2005, 338, 1–26. Available online: https://www.fsai.ie/uploadedFiles/Reg2073_2005(1).pdf (accessed on 22 December 2005).
- ISO/IEC 17043:2010. General Requirements for Proficiency Testing. Available online: https://www.mitoeagle.org/index.php/ISO/IEC_17043:2010_General_requirements_for_proficiency_testing (accessed on 2 February 2010).
- Barbaro, A.; Rubinetti, F.; Galleggiante Crisafulli, A.; Radaelli, M.C.; Chiavacci, L.; Bianchi, D.M.; Adriano, D.; Zuccon, F.; Fragassi, S.; Buonincontro, G.; et al. Food Allergens: State of the Art in Piedmont Region in the Period 2011-2012. Ital. J. Food Saf. 2014, 6, 1700. [Google Scholar] [CrossRef] [PubMed]
- Bianchi, D.M.; Adriano, D.; Astegiano, S.; Gallina, S.; Caramelli, M.; Decastelli, L. Egg and milk proteins as hidden allergens in food: 5year results of monitoring in Piedmont. J. Food Prot. 2016, 79, 1583–1587. [Google Scholar] [CrossRef] [PubMed]
- Decastelli, L.; Arioli, F.; Bianchi, D.M.; Barbaro, A.; Nobile, M.; Panseri, S.; Chiesa, L.M. An Italian survey of undeclared allergens in food over the years 2014-2018. Food Addit. Contam. Part B Surveill. 2020, 13, 115–120. [Google Scholar] [CrossRef] [PubMed]
- Renčová, E.; Piskatá, Z.; Kostelníková, D.; Tremlová, B. Simultaneous detection of peanut and hazelnut allergens in food matrices using multiplex PCR method. Acta Vet. Brno. 2014, 83, S77–S83. [Google Scholar] [CrossRef]
- García, A.; Madrid, R.; García, T.; Martín, R.; González, I. Detection of Food Allergens by Taqman Real-Time PCR Methodology. Methods Mol. Biol. 2017, 1592, 95–108. [Google Scholar] [PubMed]
- Pandey, A.K.; Varshney, R.K.; Sudini, H.K.; Pandey, M.K. An Improved Enzyme-Linked Immunosorbent Assay (ELISA) Based Protocol Using Seeds for Detection of Five Major Peanut Allergens Ara h 1, Ara h 2, Ara h 3, Ara h 6, and Ara h 8. Front. Nutr. 2019, 6, 68. [Google Scholar] [CrossRef] [PubMed]
- Madrid, R.; García-García, A.; Cabrera, P.; González, I.; Martín, R.; García, T. Survey of Commercial Food Products for Detection of Walnut (Juglans regia) by Two ELISA Methods and Real Time PCR. Foods 2021, 10, 440. [Google Scholar] [CrossRef] [PubMed]


| Matrix | True Negative Food | Ingredient | Origin |
|---|---|---|---|
| Bakery and pastry products | Chocolate cookies | Corn flour | Field harvest |
| Egg | Farm shell egg | ||
| Oil | Commercial | ||
| Sugar | Commercial | ||
| Cocoa beans | Commercial, negative for peanuts after testing | ||
| Grains and milling products | Rice and barley flour | Rice in grains | Commercial, negative for peanuts after testing |
| Barley in grains | Commercial, negative for peanuts after testing | ||
| Ready-to-eat | Olivier salad | Egg | Farm shell egg |
| Oil | Commercial | ||
| Carrot | Family vegetable garden | ||
| Peas | Family vegetable garden | ||
| Dairy product | Yogurt | Milk | Bovine farm bulk milk tank |
| Lyophilized bacterial cultures | Commercial Lactobacillus bulgaricus and Streptococcus thermophilus strains | ||
| Meats | Ragù | Beef | Muscle taken at slaughtering |
| Tomato | Family vegetable garden | ||
| Onion | Family vegetable garden | ||
| Carrot | Family vegetable garden |
| Extraction | Cookies | Ragù | Flour | Olivier Salad | Yogurt |
|---|---|---|---|---|---|
| 1 | 28.07 | 29.34 | 28.69 | 28.42 | 32.05 |
| 2 | 27.04 | 30.28 | 28.54 | 28.98 | 33.52 |
| 3 | 27.73 | 29.09 | 29.16 | 28.32 | 31.63 |
| 4 | 28.61 | Not detected | 30.29 | 30.83 | 30.04 |
| 5 | 31.27 | 31.24 | 29.37 | 32.36 | 31.27 |
| 6 | 28.07 | 39.62 | 29.48 | 27.26 | 25.9 |
| 7 | 27.71 | 28.38 | 29.27 | 27.58 | 31.24 |
| 8 | 28.27 | 29.08 | 28.81 | 28.16 | 31.49 |
| 9 | 28.04 | 32.04 | 28.54 | 27.62 | 32.38 |
| 10 | 28.36 | 28.46 | 28.7 | 29.63 | 32.36 |
| Mean | 28.32 | 29.73 | 29.09 | 28.92 | 31.19 |
| Sd | 1.12 | 1.24 | 0.55 | 1.61 | 2.07 |
| Median | 28.07 | 29.34 | 28.99 | 28.37 | 31.56 |
| Minimum | 27.04 | 28.38 | 28.54 | 27.26 | 25.90 |
| Maximum | 31.27 | 32.04 | 30.29 | 32.36 | 33.52 |
| Extraction | Cookies | Ragù | Flour | Olivier Salad | Yogurt |
|---|---|---|---|---|---|
| 1 | 25.09 | 25.67 | 25.85 | 25.4 | 27.73 |
| 2 | 24.3 | 26.53 | 26.56 | 25.66 | 29.27 |
| 3 | 24.7 | 25.23 | 26.22 | 25.35 | 27.96 |
| 4 | 25.54 | 32.05 | 27.05 | 27.68 | 26.44 |
| 5 | 28.19 | 27.12 | 26.21 | 29.47 | 25.71 |
| 6 | 24.65 | 26.04 | 27.22 | 24.29 | 22.62 |
| 7 | 25.03 | 25.01 | 26.03 | 24.43 | 28.27 |
| 8 | 25.17 | 25.51 | 26 | 25.28 | 27.85 |
| 9 | 25.58 | 27.6 | 25.54 | 24.67 | 28.52 |
| 10 | 24.88 | 25.21 | 26.14 | 26.54 | 28.65 |
| Mean | 25.31 | 26.60 | 26.28 | 25.88 | 27.30 |
| Sd | 1.08 | 2.10 | 0.52 | 1.62 | 1.95 |
| Median | 25.06 | 25.86 | 26.18 | 25.38 | 27.91 |
| Minimum | 24.30 | 25.01 | 25.54 | 24.29 | 22.62 |
| Maximum | 28.19 | 32.05 | 27.22 | 29.47 | 29.27 |
| Pairwise Comparisons | LOD | 10XLOD | ||||
|---|---|---|---|---|---|---|
| p-Value (p) | p-Value (p) | |||||
| Cookies | vs. | Olivier salad | 0.4055 | 0.4057 | ||
| Cookies | vs. | Flour | 0.0040 | ** | 0.0036 | ** |
| Cookies | vs. | Ragù | 0.0042 | ** | 0.0233 | * |
| Cookies | vs. | Yogurt | 0.0046 | ** | 0.0082 | ** |
| Olivier salad | vs. | Flour | 0.2263 | 0.0963 | ||
| Olivier salad | vs. | Ragù | 0.1025 | 0.3643 | ||
| Olivier salad | vs. | Yogurt | 0.0140 | * | 0.0412 | * |
| Flour | vs. | Ragù | 0.4140 | 0.4963 | ||
| Flour | vs. | Yogurt | 0.0032 | ** | 0.0343 | * |
| Ragù | vs. | Yogurt | 0.0199 | * | 0.0696 | |
Publisher’s Note: MDPI stays neutral with regard to jurisdictional claims in published maps and institutional affiliations. |
© 2022 by the authors. Licensee MDPI, Basel, Switzerland. This article is an open access article distributed under the terms and conditions of the Creative Commons Attribution (CC BY) license (https://creativecommons.org/licenses/by/4.0/).
Share and Cite
Tramuta, C.; Decastelli, L.; Barcucci, E.; Ingravalle, F.; Fragassi, S.; Lupi, S.; Bianchi, D.M. Detection of Peanut Traces in Food by an Official Food Safety Laboratory. Foods 2022, 11, 643. https://doi.org/10.3390/foods11050643
Tramuta C, Decastelli L, Barcucci E, Ingravalle F, Fragassi S, Lupi S, Bianchi DM. Detection of Peanut Traces in Food by an Official Food Safety Laboratory. Foods. 2022; 11(5):643. https://doi.org/10.3390/foods11050643
Chicago/Turabian StyleTramuta, Clara, Lucia Decastelli, Elisa Barcucci, Francesco Ingravalle, Sandra Fragassi, Samantha Lupi, and Daniela Manila Bianchi. 2022. "Detection of Peanut Traces in Food by an Official Food Safety Laboratory" Foods 11, no. 5: 643. https://doi.org/10.3390/foods11050643
APA StyleTramuta, C., Decastelli, L., Barcucci, E., Ingravalle, F., Fragassi, S., Lupi, S., & Bianchi, D. M. (2022). Detection of Peanut Traces in Food by an Official Food Safety Laboratory. Foods, 11(5), 643. https://doi.org/10.3390/foods11050643