
Fractionation of Extracts from Black Chokeberry, Cranberry, and Pomegranate to Identify Compounds That Influence Lipid Metabolism


Abstract

1. Introduction
2. Materials and Methods
2.1. Chemicals and Reagents
2.2. Samples
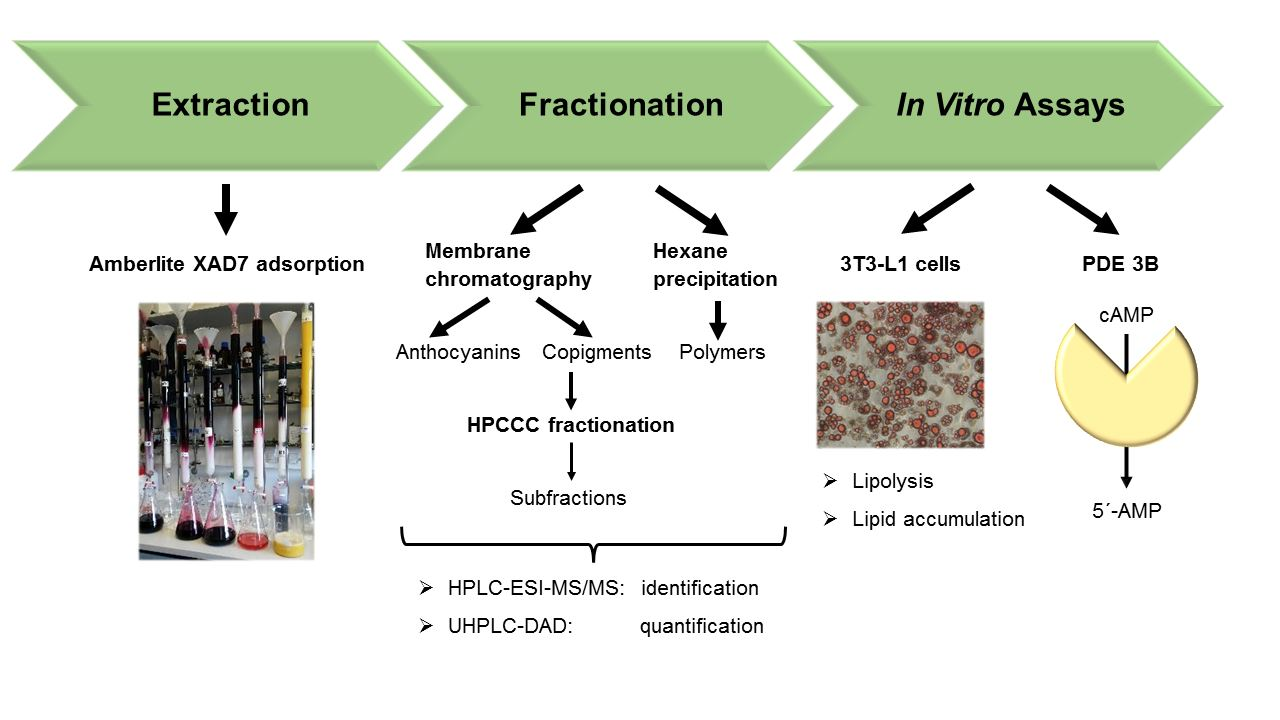
2.3. XAD-7 Extraction
2.4. Fractionation by Membrane Chromatography
2.5. Precipitation of the Polymer Polyphenols
2.6. HPLC-ESI-MS/MS Parameters for Identification
2.7. UHPLC-DAD-Parameters for Quantification
2.8. High Performance Counter Current Chromatography (HPCCC)
2.9. 3T3-L1 Cell Culture, Differentiation, and Treatment
2.10. Cytotoxicity (Alamarblue Assay)
2.11. Determination of Lipid Accumulation by Oil Red O Staining
2.12. Lipolysis Assay
2.13. The cAMP-Specific PDE Activity Assay
2.14. Statistical Analysis
3. Results
3.1. Fractionation of the Extracts of Chokeberry, Cranberry, and Pomegranate by Membrane Chromatography
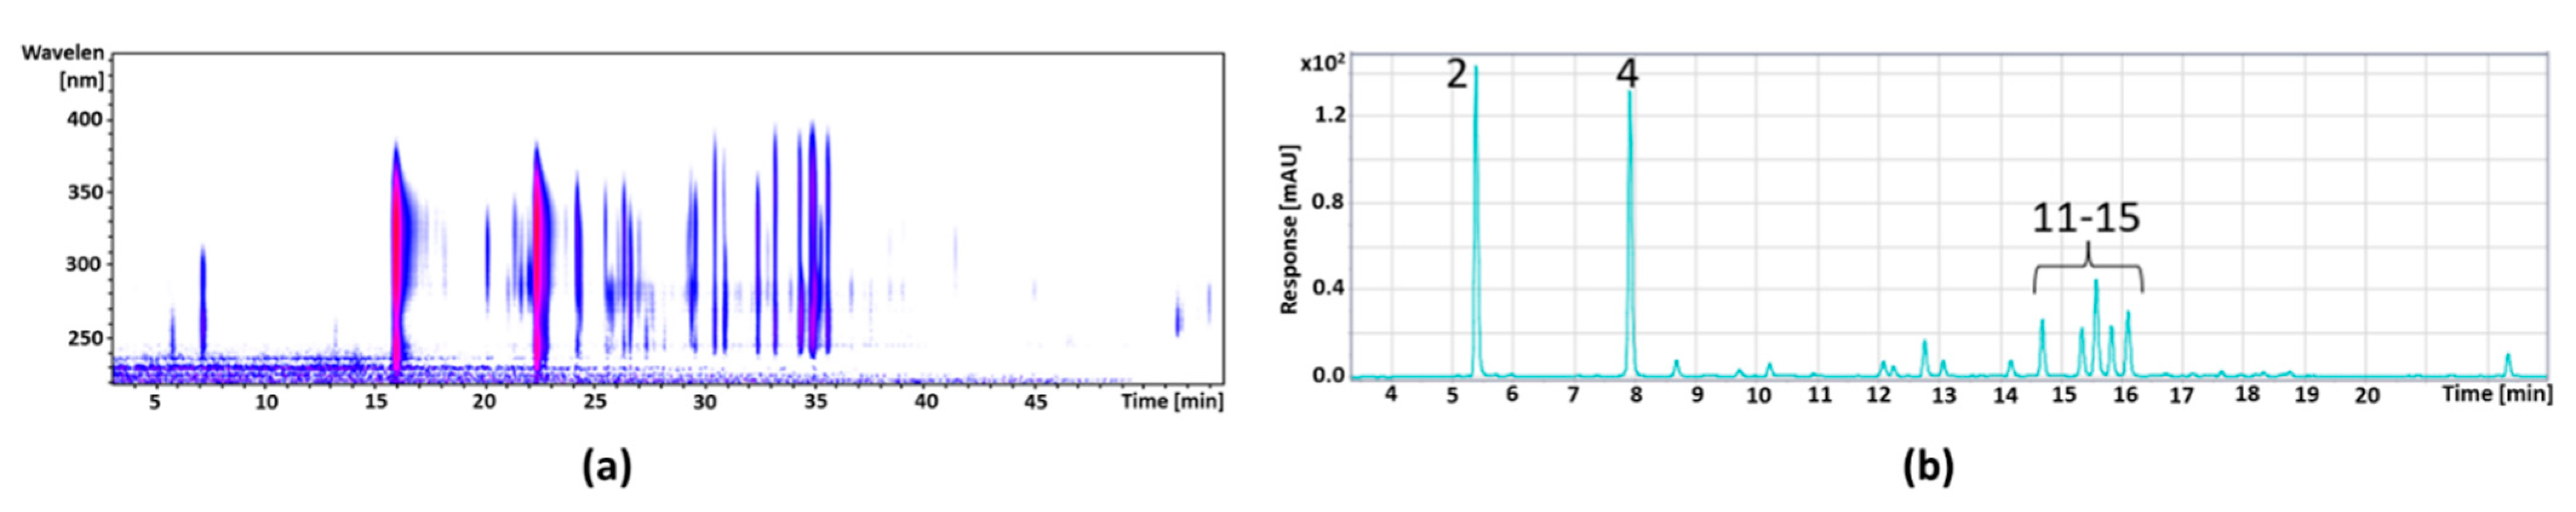
3.2. Qualification and Quantification of Polyphenolic Compounds in Anthocyanin and Copigment Fractions
3.2.1. Chokeberry
3.2.2. Cranberry
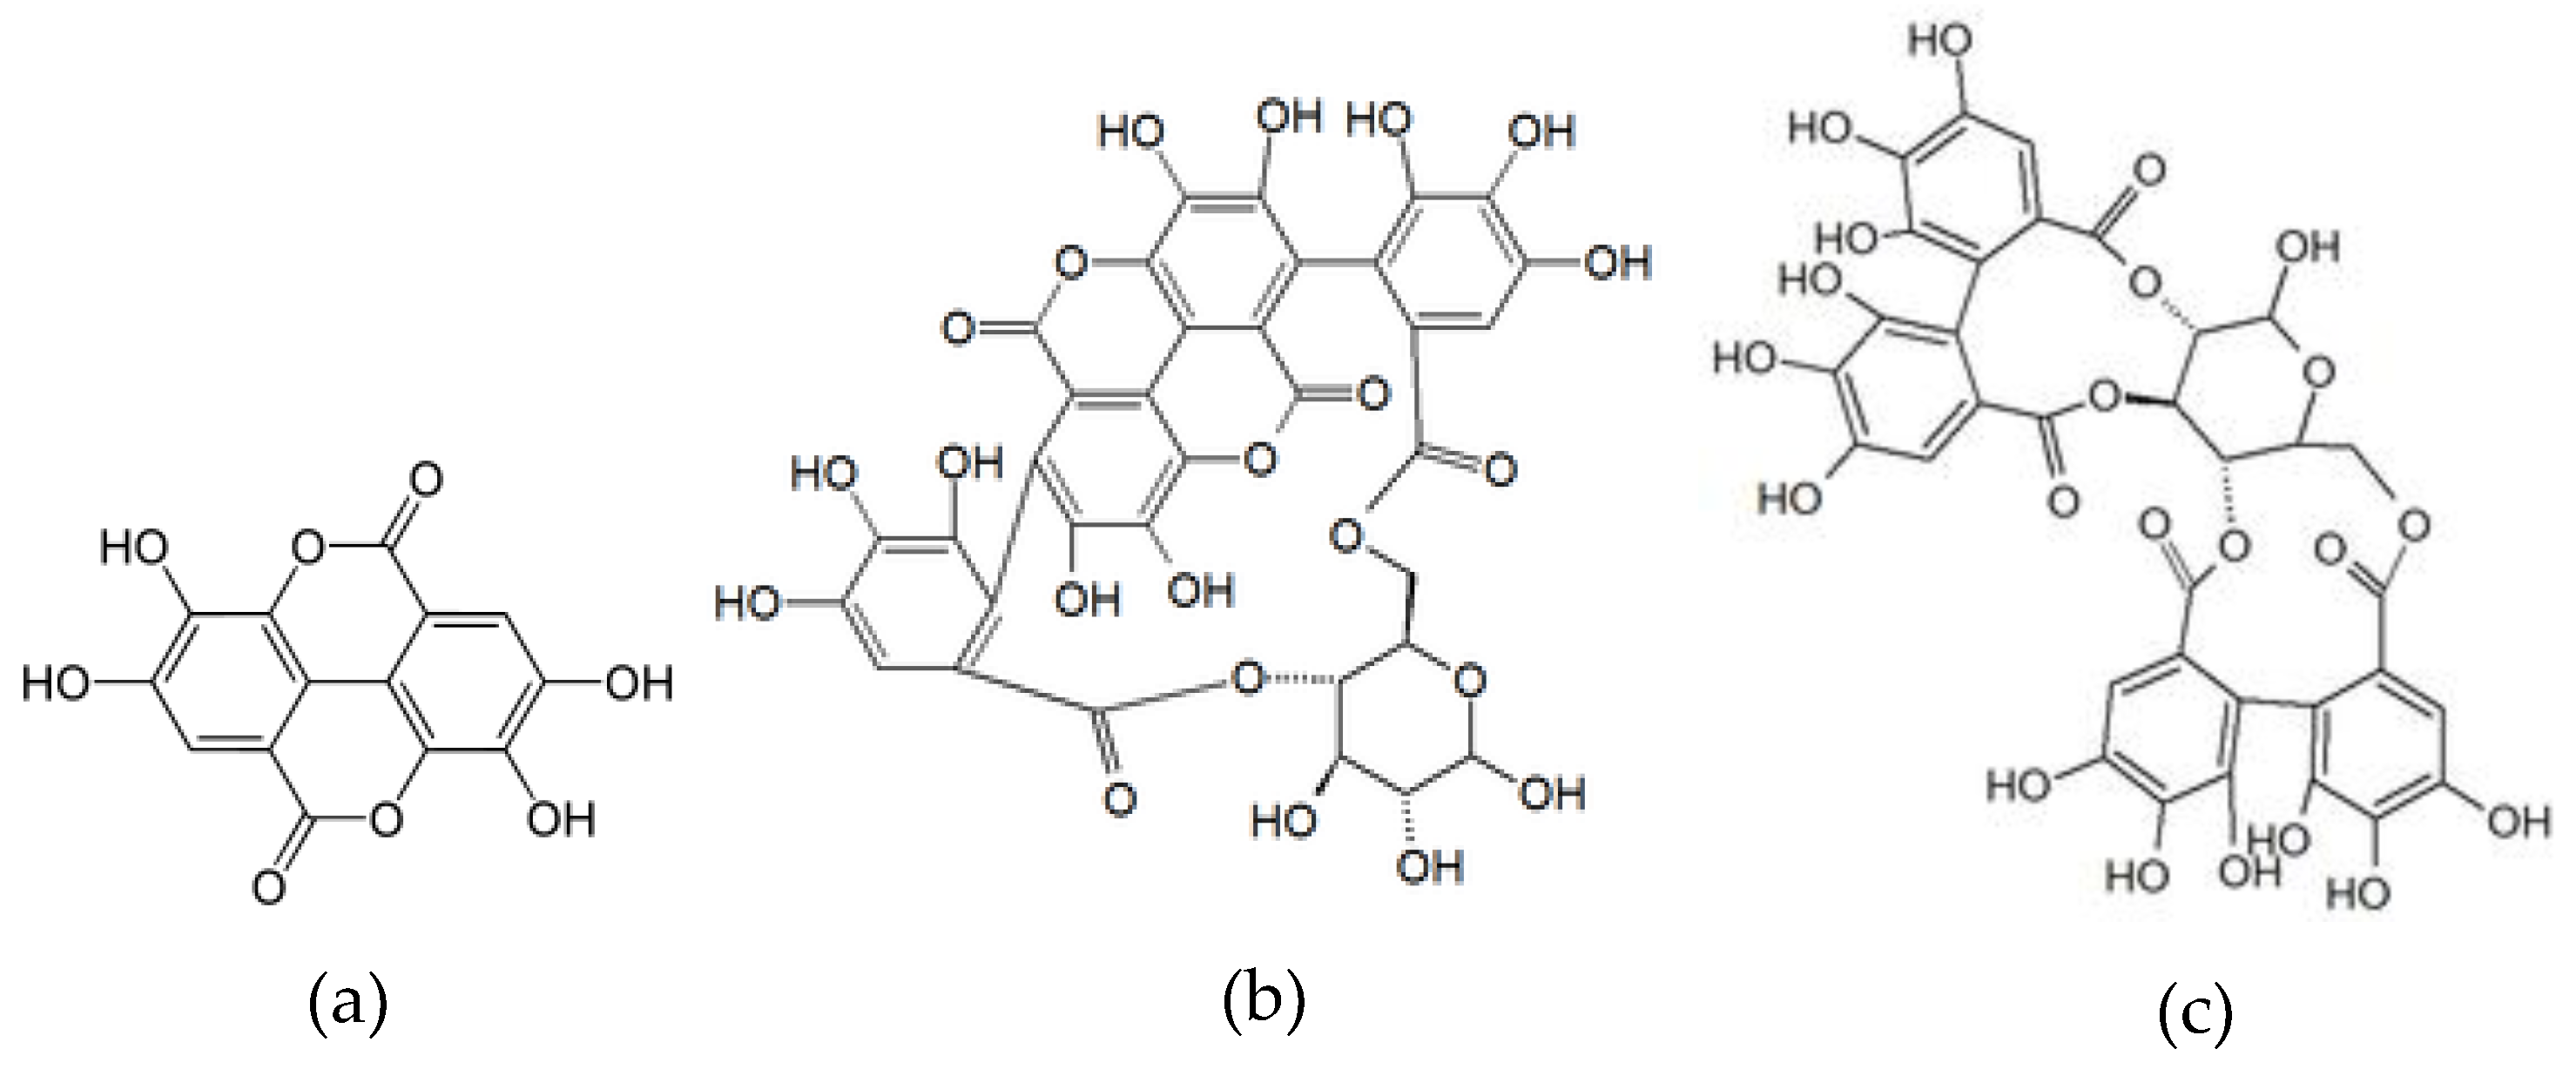
3.2.3. Pomegranate
3.3. Polymer Content of the Extracts of Chokeberry, Cranberry, and Pomegranate
3.4. Effects of the Three Fractions (Anthocyanins, Copigments, and Polymers) on Cytotoxicity and Lipid Metabolism In Vitro
3.4.1. Cytotoxicity
3.4.2. Lipid Accumulation
3.4.3. Lipolysis
3.4.4. PDE 3B Activity
3.5. Subfractionation of the Cranberry and Pomegranate Copigment Fraction by High Perfomance Counter Current Chromatography (HPCCC)
3.5.1. Fractionation of Cranberry Copigments by HPCCC
3.5.2. Fractionation of the Pomegranate Copigments by HPCCC
3.5.3. Characterization of the HPCCC Subfractions
3.5.4. Effects of the Subfractions of the Cranberry Copigment Fraction on Cytotoxicity and Lipid Metabolism In Vitro
3.5.5. Effects of the Subfractions of the Pomegranate Copigment Fraction on Cytotoxicity and Lipid Metabolism In Vitro
4. Discussion
Author Contributions
Funding
Institutional Review Board Statement
Informed Consent Statement
Data Availability Statement
Acknowledgments
Conflicts of Interest
References
- Williamson, G. The role of polyphenols in modern nutrition. Nutr. Bull. 2017, 42, 226–235. [Google Scholar] [CrossRef] [PubMed]
- Ostberg-Potthoff, J.J.; Berger, K.; Richling, E.; Winterhalter, P. Activity-guided fractionation of red fruit extracts for the identification of compounds influencing glucose metabolism. Nutrients 2019, 11, 1166. [Google Scholar] [CrossRef] [PubMed]
- Iriti, M.; Faoro, F. Bioactivity of grape chemicals for human health. Nat. Prod. Commun. 2009, 611–634. [Google Scholar] [CrossRef]
- Crozier, A.; Clifford, M.N.; Ashihara, H. Plant Secondary Metabolites: Occurrence, Structure and Role in the Human Diet; Wiley-Blackwell: Oxford, UK, 2006; ISBN 9780470988558. [Google Scholar]
- Haslam, E. Natural polyphenols (vegetable tannins) as drugs: Possible modes of action. J. Nat. Prod. 1996, 59, 205–215. [Google Scholar] [CrossRef]
- Santos-Buelga, C.; Scalbert, A. Proanthocyanidins and tannin-like compounds—Nature, occurrence, dietary intake and effects on nutrition and health. J. Sci. Food Agric. 2000, 80, 1094–1117. [Google Scholar] [CrossRef]
- Bakuradze, T.; Meiser, P.; Galan, J.; Richling, E. DNA protection by an aronia juice-based food supplement. Antioxidants 2021, 10, 857. [Google Scholar] [CrossRef]
- Da Cañete Costa, P.; Pires Dorneles, G.; Da Vital Silva, I.R.; Pereira de Araujo, C.L.; Pereira Reinaldo, G.; Peres, A.; Funchal, C.; Dal Lago, P.; Dani, C.; Rostirola Elsner, V. Chronic purple grape juice consumption induces age-dependent changes on cognitive function in elderly women. J. Syst. Integr. Neurosci. 2017, 3, 2–6. [Google Scholar] [CrossRef][Green Version]
- Kuntz, S.; Kunz, C.; Herrmann, J.; Borsch, C.H.; Abel, G.; Fröhling, B.; Dietrich, H.; Rudloff, S. Anthocyanins from fruit juices improve the antioxidant status of healthy young female volunteers without affecting anti-inflammatory parameters: Results from the randomised, double-blind, placebo-controlled, cross-over ANTHONIA (ANTHOcyanins in Nutrition Investigation Alliance) study. Br. J. Nutr. 2014, 112, 925–936. [Google Scholar] [CrossRef]
- Schantz, M.; Mohn, C.; Baum, M.; Richling, E. Antioxidative efficiency of an anthocyanin rich bilberry extract in the human colon tumor cell lines Caco-2 and HT-29. J. Berry Res. 2010, 1, 25–33. [Google Scholar] [CrossRef]
- Berger, K.; Ostberg Potthoff, J.J.; Bakuradze, T.; Winterhalter, P.; Richling, E. Blood glucose lowering effect by an extract from aronia (aronia melanocarpa)—A pilot intervention study. CNT 2021, 2, 223–229. [Google Scholar] [CrossRef]
- Joseph, S.V.; Edirisinghe, I.; Burton-Freeman, B.M. Berries: Anti-inflammatory effects in humans. J. Agric. Food Chem. 2014, 62, 3886–3903. [Google Scholar] [CrossRef]
- Banach, M.; Wiloch, M.; Zawada, K.; Cyplik, W.; Kujawski, W. Evaluation of antioxidant and anti-inflammatory activity of anthocyanin-rich water-soluble aronia dry extracts. Molecules 2020, 25, 4055. [Google Scholar] [CrossRef]
- Ikuta, K.; Hashimoto, K.; Kaneko, H.; Mori, S.; Ohashi, K.; Suzutani, T. Anti-viral and anti-bacterial activities of an extract of blackcurrants (Ribes nigrum L.). Microbiol. Immunol. 2012, 56, 805–809. [Google Scholar] [CrossRef]
- Kuppusamy, U.R.; Das, N.P. Effects of flavonoids on cyclic AMP phosphodiesterase and lipid mobilization in rat adipocytes. Biochem. Pharmacol. 1992, 44, 1307–1315. [Google Scholar] [CrossRef]
- Dallas, C.; Gerbi, A.; Tenca, G.; Juchaux, F.; Bernard, F.-X. Lipolytic effect of a polyphenolic citrus dry extract of red orange, grapefruit, orange (SINETROL) in human body fat adipocytes. Mechanism of action by inhibition of cAMP-phosphodiesterase (PDE). Phytomedicine 2008, 15, 783–792. [Google Scholar] [CrossRef]
- Girotti, C.; Ginet, M.; Demarne, F.C.; Lagarde, M.; Géloën, A. Lipolytic activity of cirsimarin extracted from Microtea debilis. Planta Med. 2005, 71, 1170–1172. [Google Scholar] [CrossRef]
- Nielsen, T.S.; Jessen, N.; Jørgensen, J.O.L.; Møller, N.; Lund, S. Dissecting adipose tissue lipolysis: Molecular regulation and implications for metabolic disease. J. Mol. Endocrinol. 2014, 52, R199–R222. [Google Scholar] [CrossRef]
- Huang, C.-C.; Huang, W.-C.; Hou, C.-W.; Chi, Y.-W.; Huang, H.-Y. Effect of black soybean koji extract on glucose utilization and adipocyte differentiation in 3T3-L1 cells. Int. J. Mol. Sci. 2014, 15, 8280–8292. [Google Scholar] [CrossRef]
- Kim, H.-K.; Kim, J.N.; Han, S.N.; Nam, J.-H.; Na, H.-N.; Ha, T.J. Black soybean anthocyanins inhibit adipocyte differentiation in 3T3-L1 cells. Nutr. Res. 2012, 32, 770–777. [Google Scholar] [CrossRef]
- Kowalska, K.; Olejnik, A.; Szwajgier, D.; Olkowicz, M. Inhibitory activity of chokeberry, bilberry, raspberry and cranberry polyphenol-rich extract towards adipogenesis and oxidative stress in differentiated 3T3-L1 adipose cells. PLoS ONE 2017, 12, e0188583. [Google Scholar] [CrossRef]
- Mosqueda-Solís, A.; Lasa, A.; Gómez-Zorita, S.; Eseberri, I.; Picó, C.; Portillo, M.P. Screening of potential anti-adipogenic effects of phenolic compounds showing different chemical structure in 3T3-L1 preadipocytes. Food Funct. 2017, 8, 3576–3586. [Google Scholar] [CrossRef]
- Juadjur, A.; Winterhalter, P. Development of a novel adsorptive membrane chromatographic method for the fractionation of polyphenols from bilberry. J. Agric. Food Chem. 2012, 60, 2427–2433. [Google Scholar] [CrossRef] [PubMed]
- Juadjur, A.; Mohn, C.; Schantz, M.; Baum, M.; Winterhalter, P.; Richling, E. Fractionation of an anthocyanin-rich bilberry extract and in vitro antioxidative activity testing. Food Chem. 2015, 167, 418–424. [Google Scholar] [CrossRef] [PubMed]
- O’Brien, J.; Wilson, I.; Orton, T.; Pognan, F. Investigation of the alamar Blue (resazurin) fluorescent dye for the assessment of mammalian cell cytotoxicity. Eur. J. Biochem. 2000, 267, 5421–5426. [Google Scholar] [CrossRef] [PubMed]
- Fischer-Posovszky, P.; Kukulus, V.; Tews, D.; Unterkircher, T.; Debatin, K.-M.; Fulda, S.; Wabitsch, M. Resveratrol regulates human adipocyte number and function in a Sirt1-dependent manner. Am. J. Clin. Nutr. 2010, 92, 5–15. [Google Scholar] [CrossRef]
- Pöch, G. Assay of phosphodiesterase with radioactively labeled cyclic 3′,5′-AMP as substrate. Naunyn-Sehmiedebergs Arch. Pharmak. 1971, 268, 272–299. [Google Scholar] [CrossRef] [PubMed]
- Göttel, C.; Niesen, S.; Daub, V.; Werle, T.; Bakuradze, T.; Winterhalter, P.; Richling, E. In vitro inhibition of phosphodiesterase 3B (PDE 3B) by anthocyanin-rich fruit juice extracts and selected anthocyanins. Int. J. Mol. Sci. 2020, 21, 6934. [Google Scholar] [CrossRef]
- Directive 2012/12/EU of the European Parliament and of the Council of 19 April 2012 Amending Council Directive 2001/112/EC Relating to Fruit Juices and Certain Similar Products Intended for Human Consumption. 2012. Available online: https://eur-lex.europa.eu/LexUriServ/LexUriServ.do?uri=OJ:L:2012:115:0001:0011:EN:PDF (accessed on 25 January 2022).
- Esatbeyoglu, T.; Rodríguez-Werner, M.; Winterhalter, P. Fractionation and isolation of polyphenols from Aronia melanocarpa by countercurrent and membrane chromatography. Eur. Food Res. Technol. 2017, 243, 1261–1275. [Google Scholar] [CrossRef]
- Wu, X.; Gu, L.; Prior, R.L.; McKay, S. Characterization of anthocyanins and proanthocyanidins in some cultivars of ribes, aronia, and sambucus and their antioxidant capacity. J. Agric. Food Chem. 2004, 52, 7846–7856. [Google Scholar] [CrossRef]
- Jurikova, T.; Skrovankova, S.; Mlcek, J.; Balla, S.; Snopek, L. Bioactive compounds, antioxidant activity, and biological effects of European cranberry (vaccinium oxycoccos). Molecules 2018, 24, 24. [Google Scholar] [CrossRef]
- Liu, Y.; Seeram, N.P. Liquid chromatography coupled with time-of-flight tandem mass spectrometry for comprehensive phenolic characterization of pomegranate fruit and flower extracts used as ingredients in botanical dietary supplements. J. Sep. Sci. 2018, 41, 3022–3033. [Google Scholar] [CrossRef]
- Abdulla, R.; Mansur, S.; Lai, H.; Ubul, A.; Sun, G.; Huang, G.; Aisa, H.A. Qualitative analysis of polyphenols in macroporous resin pretreated pomegranate husk extract by HPLC-QTOF-MS. Phytochem. Anal. 2017, 28, 465–473. [Google Scholar] [CrossRef]
- Zebisch, K.; Voigt, V.; Wabitsch, M.; Brandsch, M. Protocol for effective differentiation of 3T3-L1 cells to adipocytes. Anal. Biochem. 2012, 425, 88–90. [Google Scholar] [CrossRef]
- Chang, C.-C.; Lin, K.-Y.; Peng, K.-Y.; Day, Y.-J.; Hung, L.-M. Resveratrol exerts anti-obesity effects in high-fat diet obese mice and displays differential dosage effects on cytotoxicity, differentiation, and lipolysis in 3T3-L1 cells. Endocr. J. 2016, 63, 169–178. [Google Scholar] [CrossRef]
- Robidoux, J.; Kumar, N.; Daniel, K.W.; Moukdar, F.; Cyr, M.; Medvedev, A.V.; Collins, S. Maximal beta3-adrenergic regulation of lipolysis involves Src and epidermal growth factor receptor-dependent ERK1/2 activation. J. Biol. Chem. 2006, 281, 37794–37802. [Google Scholar] [CrossRef]
- Park, K.S. Raspberry ketone, a naturally occurring phenolic compound, inhibits adipogenic and lipogenic gene expression in 3T3-L1 adipocytes. Pharm. Biol. 2015, 53, 870–875. [Google Scholar] [CrossRef]
- Moghe, S.S.; Juma, S.; Imrhan, V.; Vijayagopal, P. Effect of blueberry polyphenols on 3T3-F442A preadipocyte differentiation. J. Med. Food 2012, 15, 448–452. [Google Scholar] [CrossRef]
- Jungfer, E.; Zimmermann, B.F.; Ruttkat, A.; Galensa, R. Comparing procyanidins in selected Vaccinium species by UHPLC-MS(2) with regard to authenticity and health effects. J. Agric. Food Chem. 2012, 60, 9688–9696. [Google Scholar] [CrossRef]
- Les, F.; Arbonés-Mainar, J.M.; Valero, M.S.; López, V. Pomegranate polyphenols and urolithin A inhibit α-glucosidase, dipeptidyl peptidase-4, lipase, triglyceride accumulation and adipogenesis related genes in 3T3-L1 adipocyte-like cells. J. Ethnopharmacol. 2018, 220, 67–74. [Google Scholar] [CrossRef]
- Little, R.; Houghton, M.J.; Carr, I.M.; Wabitsch, M.; Kerimi, A.; Williamson, G. The ability of quercetin and ferulic acid to lower stored fat is dependent on the metabolic background of human adipocytes. Mol. Nutr. Food Res. 2020, 64, e2000034. [Google Scholar] [CrossRef]
- Allott, E.H.; Oliver, E.; Lysaght, J.; Gray, S.G.; Reynolds, J.V.; Roche, H.M.; Pidgeon, G.P. The SGBS cell strain as a model for the in vitro study of obesity and cancer. Clin. Transl. Oncol. 2012, 14, 774–782. [Google Scholar] [CrossRef] [PubMed]


| Concentrate | °Brix of Juice Concentrate | Polyphenolic Content of Juice Concentrates in g/100 mL | °Brix of Juice Dilution | Polyphenolic Content in Juice in g/100 mL |
|---|---|---|---|---|
| Chokeberry | 65.4 | 4.08 | 18.0 | 1.12 |
| Cranberry | 49.8 | 1.39 | 8.8 | 0.25 |
| Pomegranate | 64.5 | 2.31 | 15.0 | 0.54 |
| Extract | Anthocyanin Content in g/100 g | Copigment Content in g/100 g | Recovery in g/100 g |
|---|---|---|---|
| Chokeberry | 47.9 | 39.6 | 87.5 |
| Cranberry | 17.7 | 72.2 | 89.9 |
| Pomegranate | 14.4 | 79.8 | 94.2 |
| Peak No. | Retention Time (min) | [M-H]+ m/z | Fragments m/z | λmax | Anthocyanin | Concentration (mg/g) |
|---|---|---|---|---|---|---|
| 1 | 6.2 | 737 | 575, 287 | 522 | Cyanidin-3-hexoside-(epi)catechin | 3.44 ± 0.09 |
| 2 | 7.4 | 707 | 575, 287 | 523 | Cyanidin-3-pentoside-(epi)catechin | 2.11 ± 0.05 |
| 3 | 9.1 | 449 | 287 | 515 | Cyandin-3-galactoside * | 328.26 ± 6.12 |
| 4 | 9.9 | 449 | 287 | 515 | Cyanidin-3-glucoside * | 18.06 ± 1.07 |
| 5 | 10.5 | 419 | 287 | 515 | Cyanidin-3-arabinoside * | 120.93 ± 4.71 |
| 6 | 12.4 | 419 | 287 | 517 | Cyanidin-3-xyloside | 23.20 ± 0.52 |
| 7 | 13.8 | 491 | 287 | 520 | Cyanidin-derivative | 17.69 ± 0.43 |
| Peak No. | Retention Time (min) | [M-H]− m/z | Fragments m/z | λmax | Copigment | Concentration (mg/g) |
|---|---|---|---|---|---|---|
| 1 | 3.6 | 153 | 109 | 295 | Protocatechuic acid | 0.29 ± 0.04 |
| 2 | 5.4 | 353 | 191,179,135 | 323 | Neochlorogenic acid * | 133.16 ± 4.35 |
| 3 | 7.1 | 461 | 337, 297, 275 | 310 | Coumaroylquinic acid ester | 3.49 ± 0.15 |
| 4 | 7.9 | 353 | 191, 179, 161 | 324 | Chlorogenic acid * | 118.90 ± 0.05 |
| 5 | 8.7 | 353 | 191 | 324 | Cryptochlorogenic acid * | 7.11 ± 0.41 |
| 6 | 9.7 | 367 | 335, 161, 132 | 323 | Feruloylquinic acid | 2.20 ± 0.08 |
| 7 | 10.2 | 595 | 385, 335, 235, 209 | 279 | Unknown | 7.27 ± 0.16 |
| 8 | 12.1 | 625 | 301 | 351 | Quercetin-dihexoside | 4.68 ± 0.25 |
| 9 | 12.7 | 625 | 301 | 349 | Quercetin-dihexoside | 10.01 ± 0.42 |
| 10 | 14.2 | 367 | 179, 135 | - | Feruloylquinic acid | 5.37 ± 0.27 |
| 11 | 14.7 | 595 | 301, 179, 151 | 352 | Quercetin-3-vicianoside | 15.39 ± 0.82 |
| 12 | 15.3 | 609 | 301 | 351 | Quercetin-3-robinobioside | 13.52 ± 0.79 |
| 13 | 15.5 | 609 | 301 | 349 | Quercetin-3-rutinoside * | 28.53 ± 1.03 |
| 14 | 15.8 | 463 | 301, 179 | 352 | Quercetin-3-galactoside | 13.95 ± 0.57 |
| 15 | 16.1 | 463 | 301, 151 | 352 | Quercetin-3-glucoside * | 18.83 ± 0.63 |
| 16 | 22.3 | 301 | 179, 151 | - | Quercetin * | 6.01 ± 0.18 |
| Peak No. | Retention Time (min) | [M+H]+ m/z | Fragments m/z | λmax | Anthocyanin | Concentration (mg/g) |
|---|---|---|---|---|---|---|
| 1 | 9.2 | 449 | 287 | 515 | Cyanidin-3-galactoside * | 97.59 ± 5.11 |
| 2 | 9.9 | 449 | 287 | 524 | Cyanidin-3-glucoside * | 3.77 ± 0.23 |
| 3 | 10.5 | 419 | 287 | 516 | Cyanidin-3-arabinoside * | 92.97 ± 5.09 |
| 4 | 11.4 | 463 | 301 | 516 | Peonidin-3-galactoside | 141.96 ± 6.05 |
| 5 | 12.2 | 463 | 301 | 520 | Peonidin-3-glucoside * | 14.09 ± 0.87 |
| 6 | 12.7 | 433 | 301 | 516 | Peonidin-3-arabinoside | 70.72 ± 4.36 |
| 7 | 13.9 | 463 | 331 | 528 | Malvidin-3-arabinoside | 9.77 ± 0.48 |
| Peak No. | Retention time (min) | [M-H]− m/z | Fragments m/z | λmax | Copigment | Concentration (mg/g) |
|---|---|---|---|---|---|---|
| 1 | 6.0 | 341 | 179, 135 | 313 | Caffeic acid hexoside | 3.68 ± 0.12 |
| 2 | 7.4 | 325 | 163, 145, 117 | 315 | Coumaric acid hexoside | 6.75 ± 0.33 |
| 3 | 8.0 | 325 | 163, 145, 117 | 322 | Coumaric acid hexoside | 62.89 ± 3.91 |
| 4 | 8.8 | 353 | 191 | 322 | Chlorogenic acid * | 4.00 ± 0.15 |
| 5 | 9.1 | 355 | 193 | 328 | Ferulic acid * | 1.67 ± 0.09 |
| 6 | 9.7 | 577 | 407 | 308 | Proanthocyanidin dimer | 5.83 ± 0.34 |
| 7 | 10.3 | 385 | 223 | 294 | Sinapic acid hexoside | 3.41 ± 0.23 |
| 8 | 10.5 | 335 | 179 | 325 | Caffeoylshikimic acid | 4.94 ± 0.30 |
| 9 | 10.7 | 337 | 191 | 312 | Coumaroylquinic acid | 13.98 ± 0.68 |
| 10 | 12.6 | 863 | 711 | 310 | Proanthocyanidin trimer | 1.17 ± 0.09 |
| 11 | 13.2 | 479 | 316 | 354 | Myricetin-hexoside | 49.77 ± 1.87 |
| 12 | 13.9 | 449 | 316 | 354 | Myricetin-xyloside | 1.77 ± 0.10 |
| 13 | 14.1 | 493 | 330 | 357 | Laricitrin-hexoside | 2.27 ± 0.16 |
| 14 | 15.0 | 535 | 371 | 351 | Coumaroyl Iridoid hexoside | 8.95 ± 0.41 |
| 15 | 15.6 | 463 | 301 | 352 | Quercetin-hexoside | 104.73 ± 4.55 |
| 16 | 16.4 | 463 | 301 | 355 | Quercetin-hexoside | 6.71 ± 0.35 |
| 17 | 16.7 | 433 | 301 | 351 | Quercetin-pentoside | 13.78 ± 0.34 |
| 18 | 17.2 | 433 | 301 | 350 | Quercetin-pentoside | 60.66 ± 0.72 |
| 19 | 17.7 | 433 | 301 | 351 | Quercetin-pentoside | 21.13 ± 0.19 |
| 20 | 18.4 | 447 | 301 | 346 | Quercetin-rhamnoside | 25.35 ± 0.22 |
| 21 | 18.6 | 507 | 344 | 352 | Syringetin-hexoside | 24.06 ± 0.21 |
| 23 | 19.2 | 317 | 179 | 368 | Myricetin * | 8.32 ± 0.10 |
| 23 | 20.6 | 447 | 314 | 355 | Isorhamnetin-pentoside | 2.14 ± 0.10 |
| 24 | 21.6 | 477 | 344 | 351 | Syringetin-pentoside | 2.58 ± 0.11 |
| 25 | 22.3 | 301 | 179 | 368 | Quercetin * | 30.71 ± 0.87 |
| Peak No. | Retention Time (min) | [M+H]+ m/z | Fragments m/z | λmax | Anthocyanin | Concentration (mg/g) |
|---|---|---|---|---|---|---|
| 1 | 6.3 | 627 | 303 | 523 | Delphinidin-3,5-diglucoside | 8.01 ± 0.29 |
| 2 | 7.5 | 611 | 287 | 514 | Cyanidin-3,5-diglucoside * | 22.51 ± 0.36 |
| 3 | 8.6 | 595 | 271 | 514 | Delphinidin-3-glucoside * | 7.36 ± 0.25 |
| 4 | 10.0 | 449 | 287 | 517 | Cyanidin-3-glucoside * | 16.89 ± 0.31 |
| Peak No. | Retention Time (min) | [M-H]− m/z | Fragments m/z | λmax | Copigment | Concentration (mg/g) |
|---|---|---|---|---|---|---|
| 1 | 1.9 | 783 | 721, 601 | 377 | Pedunculagin I | 1.96 ± 0.11 |
| 2 | 2.1 | 1101 | 781, 601 | 377 | Punicalin-derivative | 9.77 ± 0.35 |
| 3 | 2.4 | 649 | 605, 301 | Trisgalloyl-glucoside | 7.15 ± 0.31 | |
| 4 | 2.6 | 781 | 601, 271 | 378 | Punicalin I * | 40.36 ± 1.09 |
| 5 | 2.7 | 781 | 601, 299 | 377 | Punicalin II * | 53.44 ± 1.18 |
| 6 | 4.01 | 933 | 451 | 372 | Galloyl-O-punicalin | 37.17 ± 0.82 |
| 7 | 5.2 | 1083 | 601 | Punicalagin I * | 141.51 ± 3.60 | |
| 8 | 6.9 | 951 | 907 | 373 | Granatin B | 12.25 ± 0.44 |
| 9 | 7.4 | 783 | 299, 601 | 376 | Pedunculagin II | 259.56 ± 10.79 |
| 10 | 8.0 | 469 | 425 | 371 | Valonic acid bilactone | 20.63 ± 0.58 |
| 11 | 8.3 | 951 | 783 | 377 | HHDP-valoneoyl-glucoside | 2.75 ± 0.14 |
| 12 | 8.6 | 799 | 301 | 376 | Ellagic acid derivative | 7.21 ± 0.26 |
| 13 | 8.9 | 1085 | 451 | 375 | Digalloyl-galloyl-hexoside | 1.96 ± 0.08 |
| 14 | 9.2 | 799 | 301 | 375 | Granatin A | 2.12 ± 0.09 |
| 15 | 9.3 | 325 | 145 | 312 | Coumaric acid hexoside | 6.31 ± 0.22 |
| 16 | 9.7 | 801 | 347 | 365 | Digalloyl-HHDP-glucuronide | 3.21 ± 0.20 |
| 17 | 9.8 | 449 | 287 | 322 | Dihydrokaempferol-hexoside | 7.81 ± 0.34 |
| 18 | 10.5 | 355 | 193 | 327 | Ferulic acid hexoside | 5.81 ± 0.29 |
| 19 | 10.7 | 633 | 301 | 370 | Galloyl-HHDP-glucoside | 9.59 ± 0.42 |
| 20 | 10.8 | 635 | 465 | 322 | Tri-O-galloyl-glucoside | 14.11 ± 0.57 |
| 21 | 12.1 | 463 | 301 | 360 | Ellagic acid hexoside | 29.09 ± 0.78 |
| 22 | 12.6 | 953 | 301 | 332 | Galloyl-bis-HDDP-glucoside | 12.78 ± 0.36 |
| 23 | 15.1 | 447 | 301 | 360 | Quercetin-3-rhamnoside | 66.68 ± 0.54 |
| 24 | 15.4 | 301 | 229 | 366 | Ellagic acid * | 13.53 ± 0.35 |
| Polymer Content (g/100 g) | ||
|---|---|---|
| Polymer Fraction after Precipitation | Extract | |
| Chokeberry | 37.85 ± 0.67 | 14.62 ± 0.05 |
| Cranberry | 41.23 ± 0.51 | 18.12 ± 1.03 |
| Pomegranate | 5.31 ± 0.12 | 2.60 ± 0.04 |
| Extract | Fraction | IC50 [µg/mL] |
|---|---|---|
| Chokeberry | anthocyanin | 120 ± 6 |
| copigment | 113 ± 15 | |
| polymer | 126 ± 13 | |
| Cranberry | anthocyanin | 94 ± 13 |
| copigment | 104 ± 10 | |
| polymer | 95 ± 20 | |
| Pomegranate | anthocyanin | 13 ± 3 |
| copigment | 12 ± 4 | |
| polymer | 10 ± 1 |
| Subfraction | F1 | F2 | F3 | F4 | F5 | F6 (Coil) | Sum |
|---|---|---|---|---|---|---|---|
| Amount (g) | 0.72 | 0.48 | 0.26 | 0.24 | 0.20 | 0.11 | 2.01 |
| Yield (%) | 32.7 | 21.8 | 11.8 | 10.9 | 9.1 | 5.0 | 91.3 |
| Fraction | F1 | F2 | F3 | F4 | F5 | F6 | F7 (Coil) | Sum |
|---|---|---|---|---|---|---|---|---|
| Amount (g) | 1.08 | 0.58 | 1.03 | 0.90 | 0.34 | 0.83 | 0.66 | 5.42 |
| Yield (%) | 17.6 | 9.4 | 16.7 | 14.7 | 5.5 | 13.5 | 10.7 | 88.1 |
| Subfraction | Cranberry | Pomegranate |
|---|---|---|
| F1 | Caffeic acid hexoside, Caffeic acid derivative, Coumaric acid hexoside, Sinapic acid hexoside | Punicalin, Pedunculagin, Punicalagin, Punicalagin like |
| F2 | Caffeic acid hexoside, Coumaric acid hexoside, Ferulic acid hexoside, Sinapic acid hexoside, Coumaroyl Iridoid hexoside | Punicalin, Pedunculagin, Galloyl-O-punicalin, Punicalagin, Punicalagin derivative |
| F3 | Coumaric acid hexoside, Myricetin hexosid, Coumaroyl Iridoid hexoside | Ellagic acid hexoside, Pedunculagin, Punicalagin |
| F4 | Chlorogenic acid, Chlorogenic acid hexoside, Quercetin hexoside, Laricitrin hexoside | Ellagic acid hexoside, Pedunculagin, Galloyl-O-punicalin, Granatin A, Punicalagin |
| F5 | Coumaric acid, Myricetin-pentosides, Proanthocyanidin dimer, Quercetin-hexosides, Quercetin | Ellagic acid hexoside, Pedunculagin, Punigluconin, HHDP-valoneoyl hexoside, Digalloyl-gallagyl hexosid |
| F6 | Ellagic acid, Ferulic acid hexoside, HHDP hexoside, Galloyl-HHDP hexoside, Tri-O-galloyl hexoside, Pedunculagin, Digalloyl-HHDP hexoside, Granatin A, Granatin B, Galloyl-bis-HDDP hexoside | |
| F7 (Coil) | Caffeic acid, Ellagic acid, Coumaric acid hexoside, Quercetin, Luteolin hexoside, Valonic acid dilactone, Digalloyl-HHDP hexoside, Tetra-O-galloyl hexoside, Granatin A, HHDP-valoneoyl hexoside, Granatin B |
| Fraction | Subfraction | IC50 [µg/mL] |
|---|---|---|
| Cranberry copigment fraction | F1 | 45 ± 15 |
| F2 | 266 ± 10 | |
| F3 | 471 ± 67 | |
| F4 | 229 ± 23 | |
| F5 | 37 ± 7 |
| Fraction | Subfraction | IC50 [µg/mL] |
|---|---|---|
| Pomegranate copigment fraction | F1 | 4.8 ± 1.6 |
| F2 | 0.5 ± 0 | |
| F3 | 0.2 ± 0.1 | |
| F4 | 0.5 ± 0.2 | |
| F5 | 3.8 ± 1.2 | |
| F6 | 8.5 ± 3.0 | |
| F7 | 9.0 ± 0.1 |
Publisher’s Note: MDPI stays neutral with regard to jurisdictional claims in published maps and institutional affiliations. |
© 2022 by the authors. Licensee MDPI, Basel, Switzerland. This article is an open access article distributed under the terms and conditions of the Creative Commons Attribution (CC BY) license (https://creativecommons.org/licenses/by/4.0/).
Share and Cite
Niesen, S.; Göttel, C.; Becker, H.; Bakuradze, T.; Winterhalter, P.; Richling, E. Fractionation of Extracts from Black Chokeberry, Cranberry, and Pomegranate to Identify Compounds That Influence Lipid Metabolism. Foods 2022, 11, 570. https://doi.org/10.3390/foods11040570
Niesen S, Göttel C, Becker H, Bakuradze T, Winterhalter P, Richling E. Fractionation of Extracts from Black Chokeberry, Cranberry, and Pomegranate to Identify Compounds That Influence Lipid Metabolism. Foods. 2022; 11(4):570. https://doi.org/10.3390/foods11040570
Chicago/Turabian StyleNiesen, Sonja, Celina Göttel, Hanna Becker, Tamara Bakuradze, Peter Winterhalter, and Elke Richling. 2022. "Fractionation of Extracts from Black Chokeberry, Cranberry, and Pomegranate to Identify Compounds That Influence Lipid Metabolism" Foods 11, no. 4: 570. https://doi.org/10.3390/foods11040570
APA StyleNiesen, S., Göttel, C., Becker, H., Bakuradze, T., Winterhalter, P., & Richling, E. (2022). Fractionation of Extracts from Black Chokeberry, Cranberry, and Pomegranate to Identify Compounds That Influence Lipid Metabolism. Foods, 11(4), 570. https://doi.org/10.3390/foods11040570