1. Introduction
Rhus coriaria L., generally known as sumac, is a typical plant native of a large area spreading from the Canary Islands over the Mediterranean coast to Iran and Afghanistan. Its name originates from “sumaga,” which means red in Syriac [
1].
Among the sumac species,
R. coriaria L. has the greatest economic importance. In Sicily, this Asian species was first imported by the Arabs; on this island, it grows spontaneously and acquires surprising nutritional characteristics determined by the pedoclimatic conditions [
2].
R. coriaria is a high shrub or small tree (1–3 m high) with imparipinnate leaves, villose and red fruits with one-seeded drupe, and small greenish-white flowers organized in panicles [
3].
Several studies have been carried out in order to identify the major components of the
R. coriaria plant’s different parts [
3], its bioactive molecules [
4], and its fatty acid composition [
5]. However, only few studies have been conducted on Sicilian sumac [
6,
7], and in particular on its drupes, which are the main endpoints of the proposed study.
Since ancient times, given its nutritional value and its phytochemical components (flavonoids, flavones, anthocyanins, tannins, organic acids, fiber, proteins, volatile oils, nitrites, and nitrates), it has been used both as a spice by mashing and mixing the dehydrated fruits with salt and as a medicinal herb [
7,
8]. Its ordinary state is a fruit, and, to date, it is economically attractive because of its growing use in several biotechnological applications, from the nutraceutical and food sectors, to cosmetic and pharmaceutical industries as well as in veterinary practices, and in dying leather [
3,
4,
6,
9,
10].
The
R. coriaria components, including fatty acids, minerals, fiber, and phytochemicals, are responsible for its several beneficial properties. Its nutritional value makes this plant interesting as a food fortifier or functional food [
6]. Its antimicrobial and antioxidant properties make this plant a promising tool as a food preservative [
3,
11,
12]. In addition, its coloring properties and tannins are used in dying and tanning fine leather. The bioactive compounds, which are responsible for antioxidant, antilipidemic, antimicrobial, antiviral, antifungal, and anti-inflammatory activity [
11,
12,
13,
14], also make this plant an interesting tool for the pharmaceutical sector.
To date, there is no study investigating the antimicrobial activity of Sicilian sumac, and although several studies have reported on the antimicrobial activity of
R. coriaria [
15,
16,
17], the proposed study is novel, adding information to the area of interest.
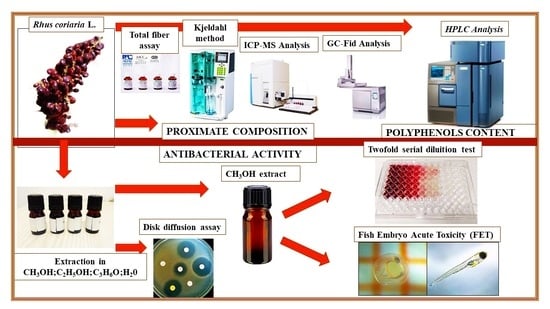
In order to investigate all the promising potential of Sicilian sumac, in the present study, a full characterization of this fruit is reported, including the proximate composition determination, the phenolic and anthocyanin content, and the mineral content. A preliminary comparative antibacterial screening of different sumac extracts was carried out, and its non-toxicity was proven by using the Zebrafish Embryo Toxicity Test (ZFET). Further studies are in progress to have a better understanding of this plant genotype and its possible biotechnological applications.
2. Materials and Methods
2.1. Reagents and Chemicals
Heptane, methanol, ethanol, and acetone were supplied by PanReac AppliChem (Barcelona, Spain) and J.T. Baker (Phillipsburg, NJ, USA). Ultrapure water (18 mΩ cm resistivity and <5 ppb TOC) was produced by a Barnstead Smart2Pure 12 Water Purification System (Thermo Scientific, Milan, Italy). Reference standards of fatty acids methyl esters (FAMEs, C4–C24) and stock standard solutions of inorganic elements (1000 mg/L in 2% HNO3) were obtained from Supelco (Bellefonte, USA). Sugars and polyphenol standards were obtained from Extrasynthese (Genay, France) and Sigma-Aldrich (St. Louis, MO, USA). The Kjeldahl catalyst was supplied by Carlo Erba (Milan, Italy). Methanol, standard gallic acid, cyanidin-3-O-glucoside, and Folin–Ciocalteau reagent were obtained from Sigma-Aldrich (Steinheim, Germany). PTFE syringe filters (0.45 μm) were purchased from Gelman Sciences Inc. (Ann Arbor, MI, USA). High purity water with a resistivity of 10 mΩ cm, nitric acid trace metal analysis grade, and hydrogen peroxide were acquired from J.T. Baker (Milan, Italy). Stock standard solutions of B, Mg, Na, Al, K, Ti, Cr, Mn, Fe, Zn, Ni, As, Sr, Ba, Pb, and Bi (1000 mg/L in 2% nitric acid) were purchased from Fluka (Milan, Italy). The Cd solution (1000 mg/L in 2% nitric acid) and the Hg solution (1000 mg/L in 3% hydrochloric acid) were obtained from Merck (Darmstadt, Germany). MeOH HPLC grade, quercetin, and gallic acid standards were obtained from Sigma-Aldrich (St. Louis, MO, USA).
2.2. Plant Material
R. coriaria L. drupes (1 kg) were collected in Messina (38°13′31.42″ N 15°32′21.7″ E) in September 2020. The fresh material was immediately dried in the dark at a low temperature and then pulverized.
2.3. Proximate Composition Determination
The determination of the proximate composition was carried out according to the AOAC (Association of Official Analytical Chemist) methods [
18]. In particular, the following methods were used: dry matter (method 925.10), crude ash (method 923.03), crude protein (method 990.03), crude fiber (method 962.09), starch (method 996.11), and crude fat by Soxhlet extraction (method 960.39 with some modifications). The sumac sample was analyzed in triplicate.
For the fatty acids profiling, 15 g of sample was extracted for 6 h with a Soxhlet apparatus using heptane as solvent. After the extraction, the solvent was eliminated with a rotating evaporator and stored at −18 °C until the chromatographic analysis. The analysis of FAMEs was performed as described by the EU Regulation n. 1833/2015 (European Commission, 2015). One μL of each extract was analyzed by a gas chromatograph (GC) (Dani Master GC1000) equipped with a split/splitless injector and a flame ionization detector (FID) (Dani Instrument, Milan, Italy). A 60 m × 0.25 mm ID 0.20 μm film thickness Supelco SLB-IL100 capillary column (Supelco, Sigma-Aldrich, St. Louis, MO, USA) was used. The chromatographic conditions used were as follows: temperature from 165 °C to 210 °C (10 min held) at 2 °C/min, injector and detector temperature was 250 °C, and helium was at a linear velocity of 30 cm/s. The injection volume was 1 μL with a split ratio of 1:100. The Clarity Chromatography Software v4.0.2 (DataApex, Prague, Czech Republic) was used for data acquisition and processing. The sample was analyzed in triplicate. FAMEs were identified by comparing the retention times of the peaks with those of the standards. The percentage of each FAMEs was calculated by comparison with the corresponding chromatogram peak area. The precision of the method was assessed in terms of RSD% analyzing five times each sample [
19].
2.4. Total Phenolic and Anthocyanin Content Determination
The total phenolic content of
R. coriaria L. was determined using the Folin–Ciocalteu method [
20]. Briefly, 3 g of dried and minced sample was homogenized with 8 mL of an 80% aqueous methanol solution and placed in a vessel at −20 °C overnight. The sample was then centrifuged (10000 rpm for 15 min), and the supernatant was filtered with a 0.45 µM filter.
The total phenolic content absorbance measurements were registered using a Ultrospec 2100 Pro UV-VIS spectrophotometer (GE Healthcare Ltd., Chicago, IL, USA) at a wavelength of 760 nm. Absorbance values were converted to gallic acid equivalents and expressed as mg/g.
The total anthocyanins content was spectrophotometrically evaluated, as described by Landi et al. [
21], in acidified methanol (0.1% HCl,
v/
v), and the absorbance was measured at 535 nm. Absorbance values were converted to cyanidin-3-O-glucoside equivalents and expressed as mg/g.
2.5. Mineral Element Content Determination
The determination of the mineral elements in the
Rhus coriaria samples was carried out using an ICP-MS iCAP-Qc spectrometer (Thermo Fisher Scientific, Milan, Italy) equipped with a 27 MHz radiofrequency solid-state generator at 1550 W. A closed vessel microwave digestion system Ethos 1 (Milestone, Bergamo, Italy) was used for the sample digestion. Approximately 0.50 g of
R. coriaria sample was digested with 7 mL of HNO
3 (69%
v/
v) and 1 mL of H
2O
2 (30%
v/
v) in a pre-washed PTFE vessel. The sample was then cooled down at room temperature, diluted up to 25 mL with ultrapure water, and filtered with a 0.45 µm filter [
19,
22]. The certified reference materials were processed using the same conditions. The ICP-MS operating parameters were the incident radiofrequency power 1500 W, plasma gas flow argon (Ar) at 15 L/min, auxiliary gas flow rate (Ar) 0.9 L/min, and carrier gas flow rate (Ar) 1.10 L/min. Helium (He) was the collision cell gas (4 mL/min), and the spray chamber was set at T = 2 °C. The injection volume and sample introduction rate were 200 μL and 1 mL/min, respectively. A full scan mode (dwell time 0.5 s point 1) was used for spectra acquisition. All samples and the analytical blanks were analyzed in triplicate.
Data acquisition was performed using the Qtegra™ Intelligent Scientific Data Solution™ (Thermo Scientific) software. For the quantification, an external calibration procedure was used. The determination of mercury was performed using the automatic mercury analyzer DMA-80 (Milestone Srl, Bergamo, Italy). An aliquot of the sample (100 mg) was placed in a vessel, dried for 3 min at 200 °C, and decomposed at 650 °C for 2 min. The content of Hg was determined by measuring the absorbance at 253.7 nm.
2.6. Preparation of Extracts
The dried and ground fruits were extracted with different solvents obtained from Sigma-Aldrich: methanol (SM), ethanol (SE), acetone (SA), methanol and water (SMW), ethanol and water (SEW), acetone and water (SAW), and water (SW). The samples (2 g) in the respective extraction solvents (20 mL) were sonicated for 15 min, filtered with a Whatman filter, dried with a rotary evaporator (BUCHI R-210, Merck KGaA, Darmstadt, Germany), and lyophilized. The resulting dried extracts were used for further microbiological analysis.
2.7. Polyphenols Profile in SM
Amounts of 229.16 mg and 224.29 mg of sumac powder were added to 3 mL aliquots of HPLC grade MeOH. The ultrasound-assisted extraction of phenolics from each powder was performed using a Transonic 460 H ultrasonic bath (Elma Hans Schmidbauer, Singen, Germany) at room temperature operating for 15 min at 35 kHz ultrasonic frequency. Then, each sample was centrifuged (5000 rpm, 6 min) using an SL 16 centrifuge (Thermo Fisher Scientific, Waltham, MA, USA). The supernatant was recovered, and to the solid residue, another 3 mL of MeOH were added two times. The methanolic extracts were dried under reduced pressure. Samples were then added with 2 mL of MeOH, filtered, and transferred in a glass vessel. Analyses were carried out using an HPLC Alliance e2695 (Waters, Milford, MA, USA) system equipped with an autosampler, degasser, and column heater coupled with a Q-Tof Premier quadrupole time-of-flight mass spectrometer (Waters, Milford, MA, USA).
The compounds were separated using a 50 × 2.1 mm ID Hypersil GOLD HPLC column (Thermo Fisher Scientific, Waltham, MA, USA) kept at 20 °C. The injection volume was 5 µL. A thermostated auto sampler, kept at 4 °C, was used, and all samples were injected in triplicate. The HPLC eluent was a mix of 0.1% aqueous formic acid solution and 0.1% formic acid in MeOH, with a flow rate of 0.25 mL/min.
Elution started with 95% aqueous formic acid and 5% methanol formic acid, and then isocratic for 1 min. Then, in the following 14 min, the solvent became 100% MeOH, remaining isocratic for the subsequent 5 min (from min 15 to min 20). After 30 s, the eluting solvent mixture was reverted to 95% aqueous formic acid and 5% methanolic formic acid and maintained for another 30 s. Each run lasted 21 min. Every sample was injected three times. The concentration values, which are reported in Table 4, are the arithmetic mean of the values observed in each run.
For the detection of flavonoids and other phenols, the calibration curves of quercetin and gallic acid, both of HPLC purity grade, were used. The calibration curves were performed using a standard solution of quercetin in methanol (1000 ppm 10 mg/10 mL) and a standard solution of gallic acid in methanol (1000 ppm 10 mg/10 mL), respectively. Each calibration curve was obtained using 0.5 ppm, 1 ppm, 5 ppm, 10 ppm, and 20 ppm solutions.
The following compounds were investigated: quercetin, quercetin 2′O-gallate, quercetin glucuronide, quercetin-hexose malic acid, methyl-dihydroquercetin hexoside, kaempferolol, myricetin-rhamnose malic acid, quercetin 3-O-hexuronide, kaempferol 3-O-glucoside, quercetin 3-O-galactoside, myricetin, myricetin 3-O-hexoside, apigenin glucoside, myrecetin O-rhamnosylglucose, phenols, gallic acid, methyl digallate, pentagalloyl-hexoside, p-coumaric acid, peonidin 3-O-hexoside isomer, and vanillic acid.
2.8. Antimicrobial Tests
2.8.1. Bacterial Strains
Five
Enterobacteriaceae isolates, four
Escherichia coli, and one
Klebsiella pneumonia were selected to carry out the study. The strains were isolated from poultry in the Regional Veterinary Laboratory of Mostaganem, Algeria, and identified using matrix-assisted laser desorption–ionization time-of-flight mass spectrometry (MALDI-TOF-MS), as previously reported [
23].
E. coli ATCC 25922 and
Staphylococcus aureus ATCC 6538 (American Type Culture Collection, Rockville, MD, USA) were also tested.
2.8.2. Antimicrobial Susceptibility Testing
Disk diffusion method was used to test and confirm the antimicrobial susceptibility of the Enterobacteriaceae isolates using Muller–Hinton agar (MHA, Oxoid, Milan, Italy) and an incubation time of 16–18 h at 37 °C, following the Clinical and Laboratory Standards Institute Guidelines (CLSI) [
24]. The antimicrobial used were: ciprofloxacin (CIP, 5 µg), nalidixic acid (NA, 30 µg), amoxicillin/clavulanic acid (AMC, 20/10 µg), amoxicillin (AML, 25 µg), levofloxacin (LEV, 5 µg), cefotaxime (CTX, 30 µg), sulphonamides (SSS, 300 µg), tetracycline (TE, 30 µg), trimethoprim/sulphamethoxazole (SXT, 1,25/23,75 µg), trimethoprim (TMP, 5 µg), chloramphenicol (C, 30 µg), and neomycin (N, 30 µg) (Bio-Rad, Marnes la Coquette, France). The results were assessed following the CLSI guidelines [
24].
2.8.3. Determination of the Antibacterial Activity of all Extracts of Rhus Coriaria by Disk Diffusion Assays
The antibacterial activity of the different extracts (SE, SM, SA, SEW, SMW, SAW, and SW) against the selected Enterobacteriaceae isolates was assessed by the disk diffusion method, as previously described [
25]. Briefly, the bacterial colonies were suspended in 10 mL of saline water, and the turbidity of the bacterial suspension was adjusted to 0.5 McFarland standard. MHA plates were inoculated with bacteria by spreading overnight cultures on MHA using sterile cotton swabs. Filter paper disks (6 mm diameter; Thermo Fisher, Milan, Italy) containing 10 µL of each extract at a concentration of 10 mg/mL were then applied on the agar plates. Cefotaxime served as a positive control, and a disk impregnated with sterile distilled water was used as a negative control. The plates were incubated for 24 h at 37 °C, and the antibacterial activity was evaluated by measuring the diameters of the inhibition zones. Each assay was performed in triplicate.
2.8.4. Determination of the Minimum Inhibitory Concentration (MIC) of the SM Extract
In order to determine the minimum inhibitory concentration (MIC) of SM, the serial double dilution method was performed according to CLSI guidelines [
26]. Briefly, overnight bacterial cultures in log phase were used to prepare the suspension of cells adjusted to 10
6 CFU in Muller-Hinton Broth (MHB). Serial dilutions were performed in the growth medium in a concentration range between 2000 and 2 μg/mL for the SM extract. Wells containing compound-free MHB with bacteria were used as the positive control. Plates were incubated at 37 °C for 24 h. The MIC value was defined as the lowest concentration of the tested compound that inhibits the growth of bacteria at the end of the 24 h incubation. MICs were determined in triplicate. The MIC was defined as the lowest concentration inhibiting the visible growth of the tested strains after incubation.
2.9. Embryo Acute Toxicity Test
The embryo acute toxicity test was carried out according to the Organisation for Economic Cooperation and Development (OECD) guidelines for the testing of chemicals [
27]. The ZFET was conducted on fertilized eggs from the Centre for Experimental Fish Pathology of Sicily (CISS, Sicily, Italy). Adult zebrafish (
Danio rerio) were kept in a standalone facility (ZebTec, Tecniplast, West Chester, PA, United States) in water-controlled conditions: temperature 28 °C, conductivity 600 µS/cm, pH 7.5, and 14/10 h dark/light regimen. Twice a day, fish were fed with
Artemia salina at 3% of body weight and Gemma micro 300 (Skretting, Varese, Italy). Following mating, the eggs were placed in steel grids inside tanks to avoid predation by adults and to guarantee their collection. The fertilized eggs were collected using a stereomicroscope (Leica M205 C) and exposed to
R. coriaria extract, which was previously prepared at a concentration of 9.37 µg/mL, in a sterilized embryo medium (15 mM NaCl, 0.5 mM KCl, 1 mM CaCl
2, 1 mM MgSO
4, 0.15 mM KH
2PO
4, 0.05 mM Na
2HPO
4, 0.7 mM NaHCO
3; pH 7.3). The control group was held in an embryo medium. The Fish Embryo Acute Toxicity (FET) was performed, as described by Pecoraro et al. [
28]. Right after the fertilization, embryos were collected, bleached as reported by Westerfield [
29], and distributed as one embryo per well into 24-well plates (LABSOLUTE, Th. Geyer GmbH & Co.KG, Berlin, Germany). Embryos were incubated with a 10/14 h dark/light regimen at 26 °C for 96-hours post-fertilization (hpf). The test solutions and controls were replaced daily [
27]. The exposure period started from 180 min post-fertilization and ended at 96 h. The following endpoints were used to evaluate the toxicity: embryo coagulation, tail non-detachment, somite formation lack, heartbeat non-detection, and the hatched embryos number. Acute toxicity was determined at the end of the exposure period.
2.10. Statistical Analysis
The existence of significant differences in the antimicrobial activity of the extracts was assessed by one-way ANOVA using SIGMAPLOT, version 14.0 (Systat Software Inc., San Jose, California, USA). Tukey’s HSD was used as a post hoc test. The level of significance was set at p ≤ 0.05.


 ,
, 


