
Food Safety Assessment of Commercial Genetically Modified Soybeans in Rats

 ,
,  ,
,
Abstract
:1. Introduction
2. Materials and Methods
2.1. Soybean Samples and Preparation
2.2. DNA Isolation and PCR Assay
2.3. Animals
2.4. Experimental Design
2.5. Clinical Observations
2.6. Hematology and Coagulation
2.7. Serum Chemistry
2.8. Urinalysis
2.9. Gross and Histopathological Examinations
2.10. Statistical Analysis
3. Results
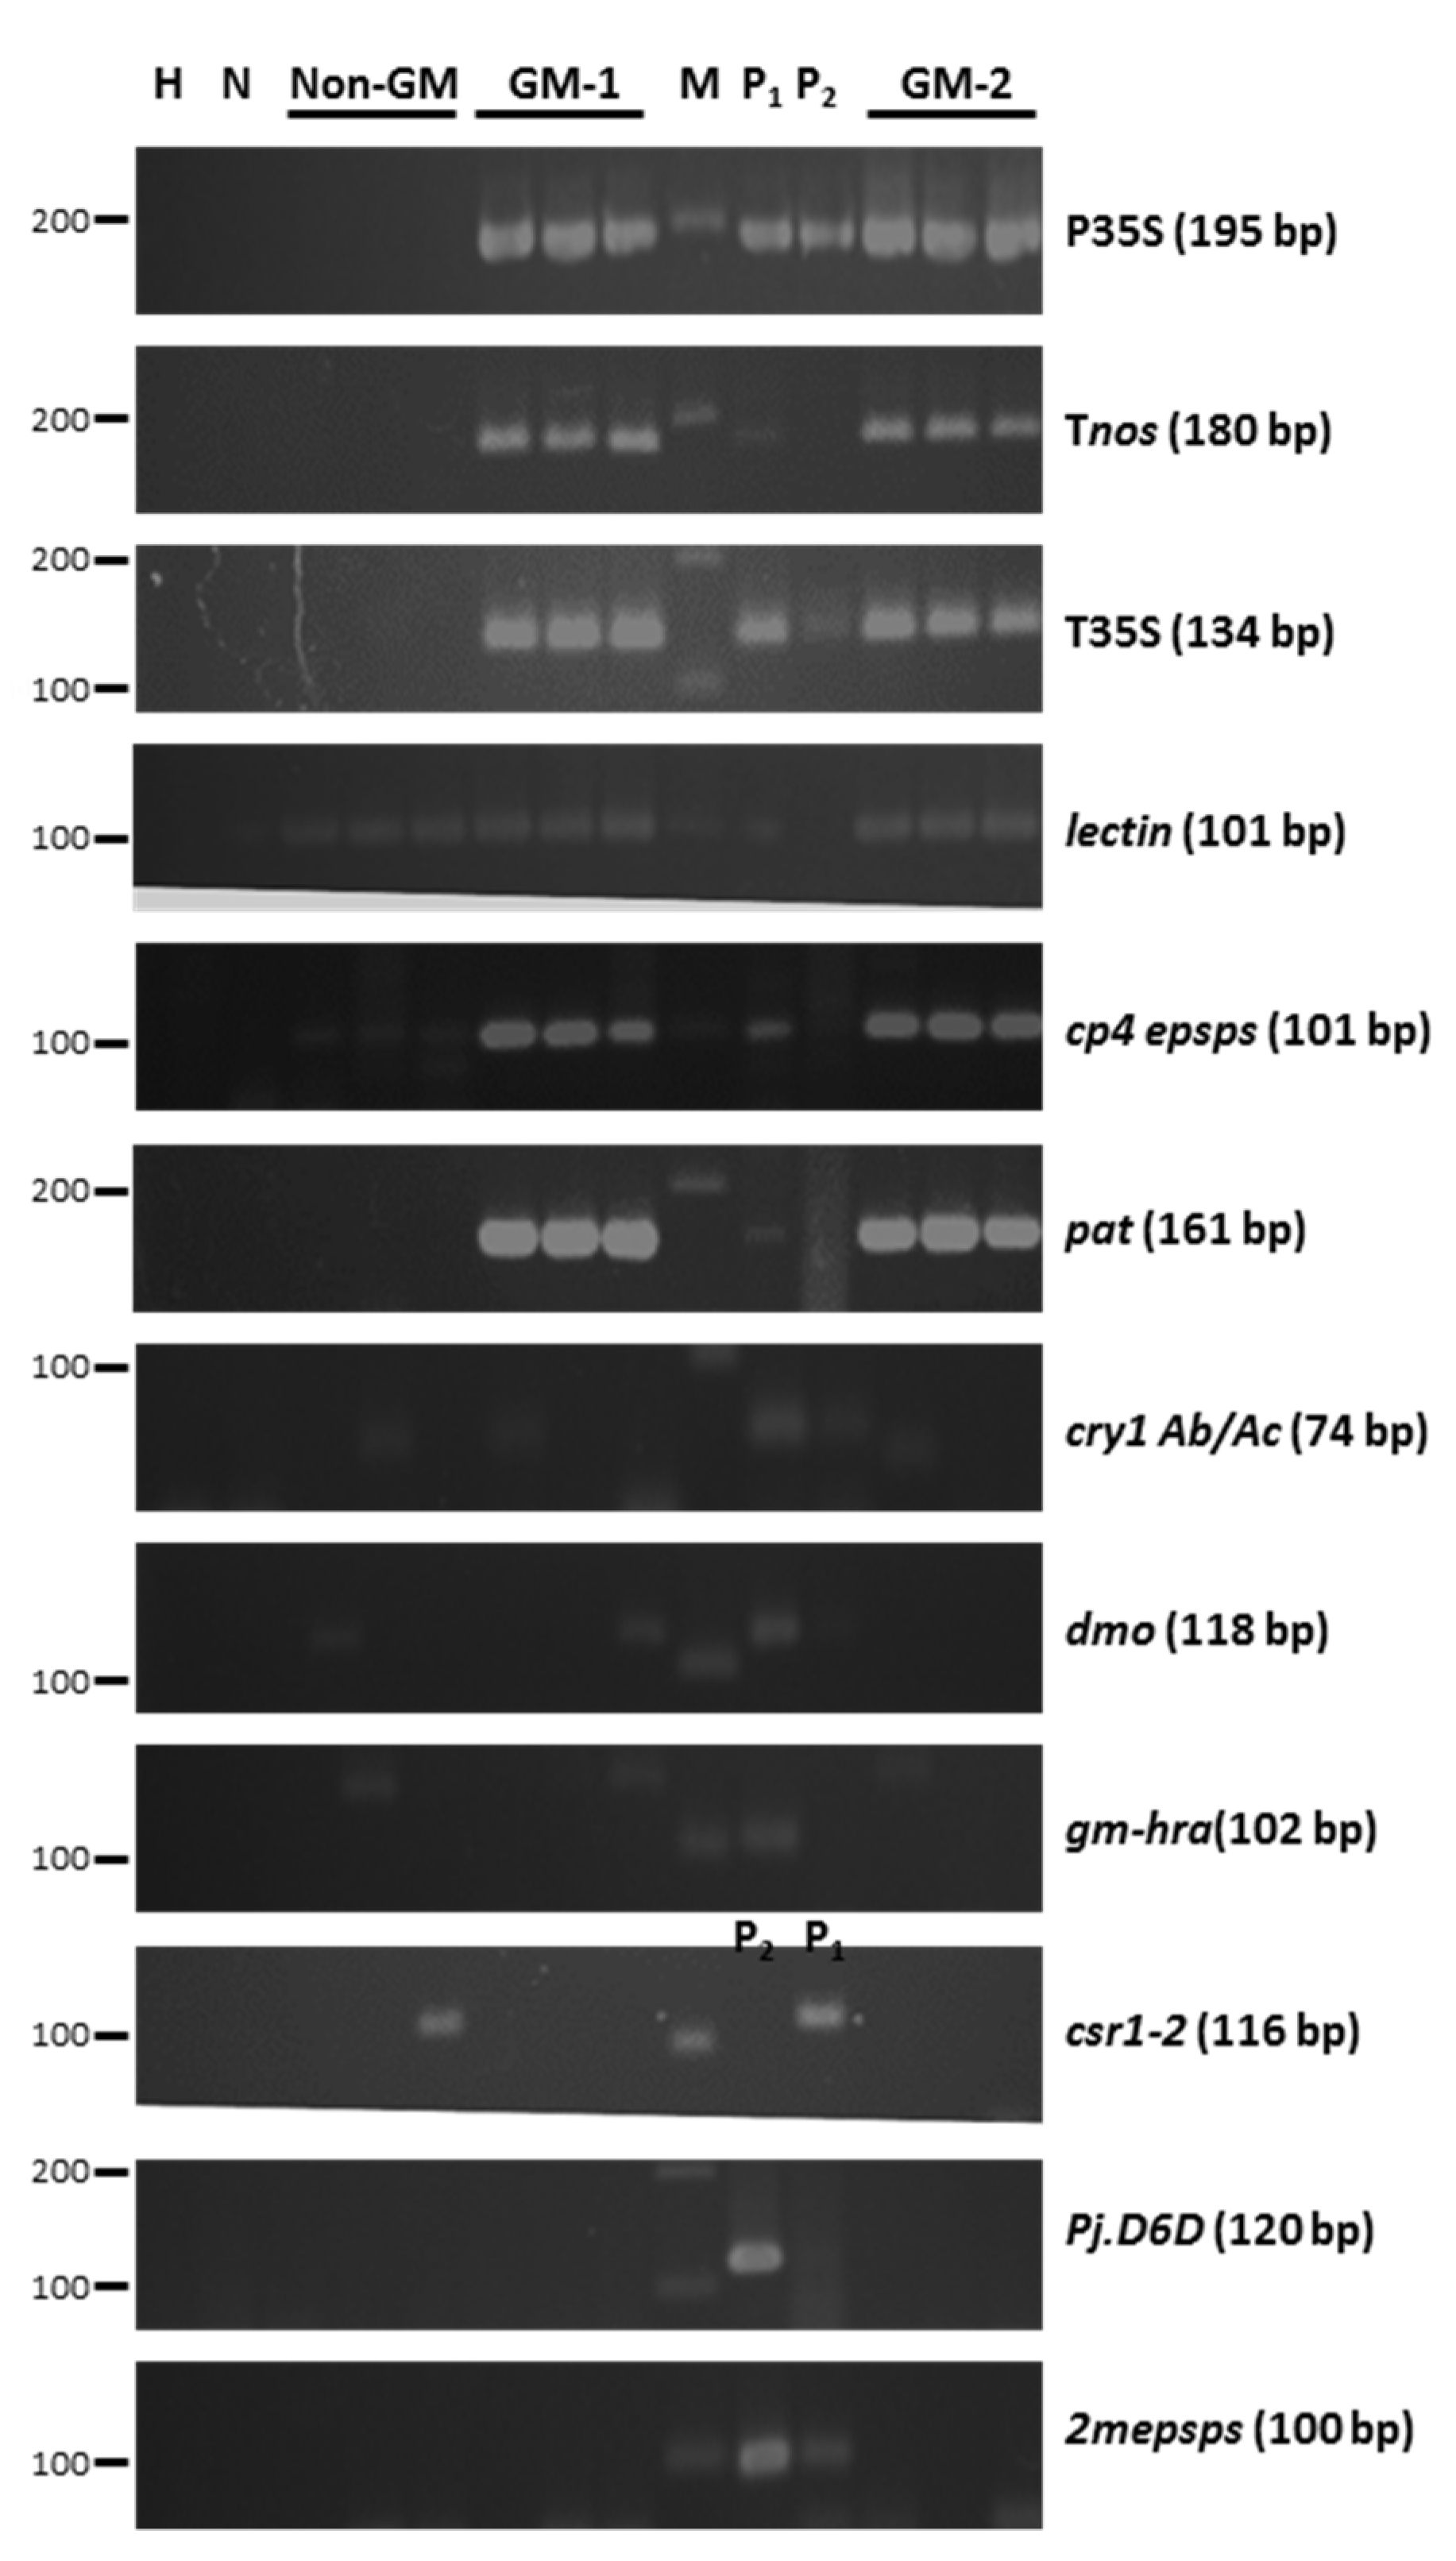
3.1. GM Soybean Confirmed by PCR for Transgenic Genes
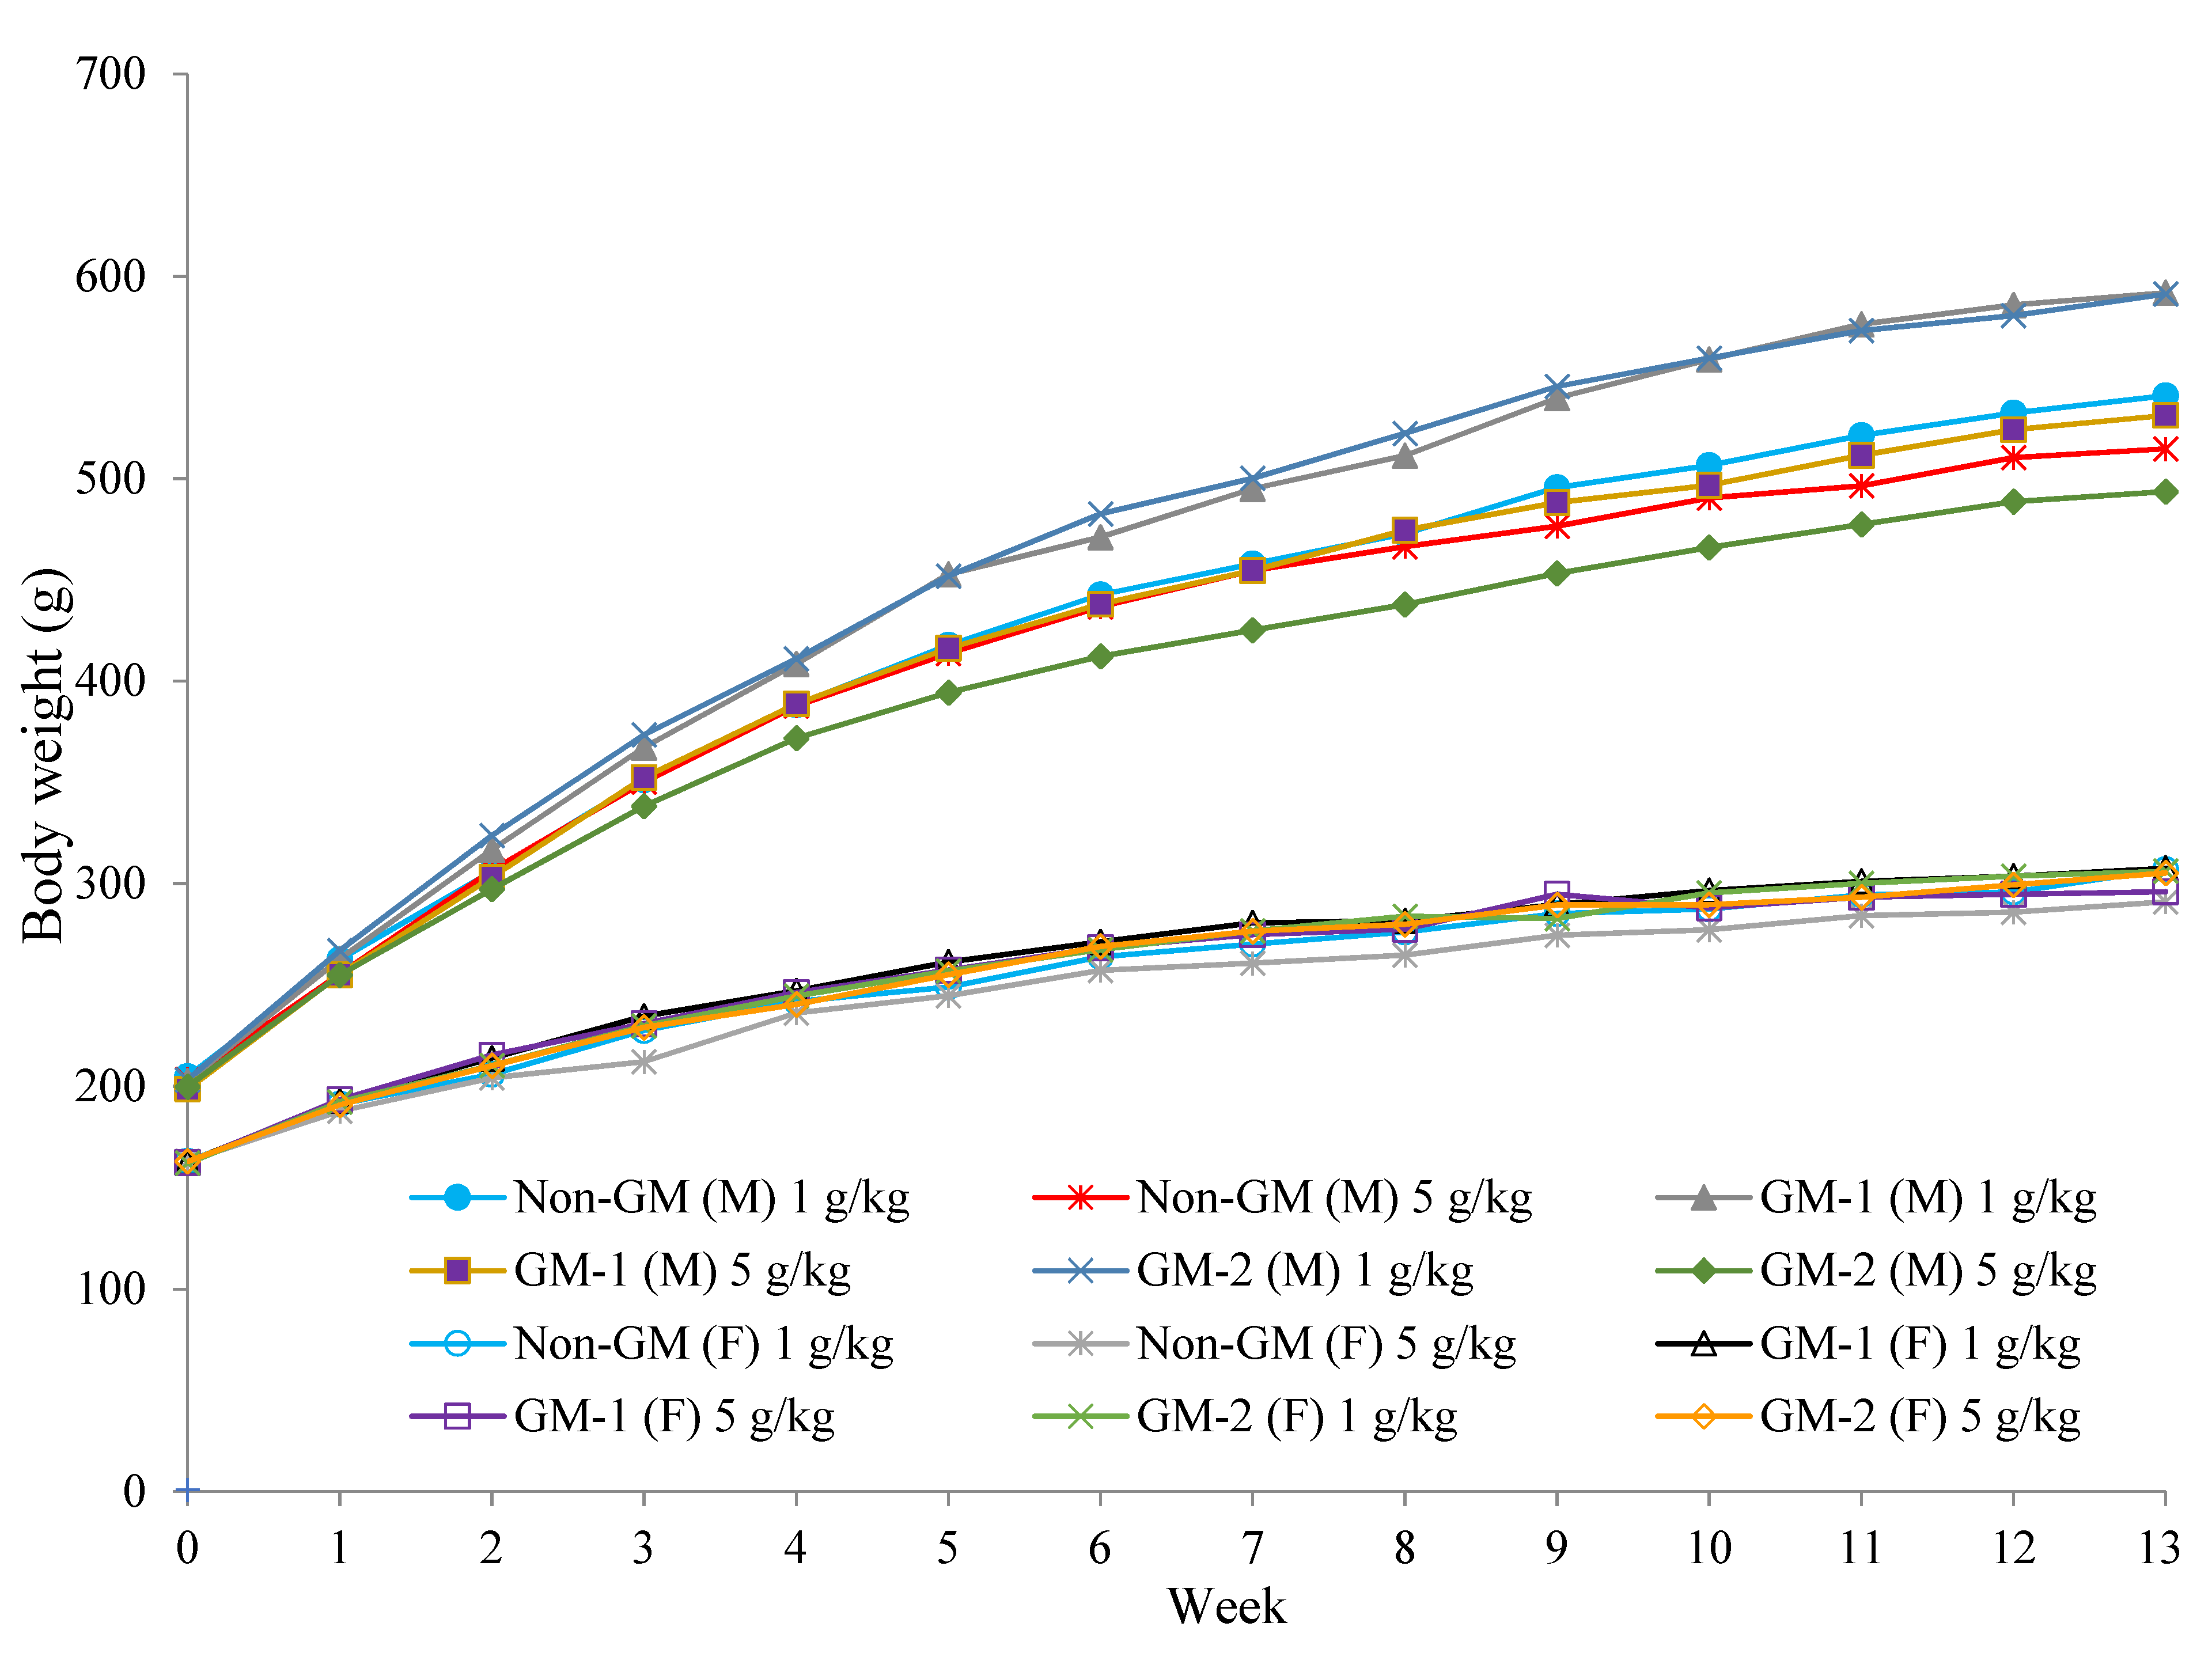
3.2. Signs, Body Weight and Food Consumption
3.3. Hematology and Blood Coagulation Examinations
3.4. Clinical Biochemistry and Urine Chemistry Examinations
3.5. Organ Weight and Pathological Examinations
4. Discussion
5. Conclusions
Author Contributions
Funding
Institutional Review Board Statement
Informed Consent Statement
Acknowledgments
Conflicts of Interest
Abbreviations
References
- Clive, J. 20th Anniversary (1996 to 2015) of the global commercialization of biotech crops and biotech crop highlights in 2015. In ISAAA Brief 51; International Service for the Acquisition of Agri-biotech Applications (ISAAA): Ithaca, NY, USA, 2015; ISBN 978-1-892456-65-6. [Google Scholar]
- Lusas, E.W.; Riaz, M.N. Soy protein products: Processing and use. J. Nutr. 1995, 125, 573S–580S. [Google Scholar] [CrossRef]
- Council of Agriculture (COA). Food Supply and Utilization Yearbook 2020. Taiwan. Available online: https://agrstat.coa.gov.tw/sdweb/public/book/Book.aspx (accessed on 10 January 2022).
- Clarke, D.B.; Lloyd, A.S. Dietary exposure estimate of isoflavones from the 1998 UK Total Diet Study. Food Addit. Contam. 2004, 21, 305–316. [Google Scholar] [CrossRef] [PubMed]
- FAO; WHO. Biotechnology and Food Safety. In Report of a Joint FAO/WHO Consultation; FAO Food and nutrition paper 61; Food and Agriculture Organization: Rome, Italy, 1996; ISBN 92-5-103911-9. [Google Scholar]
- OECD. Safety Evaluation of Foods Derived by Modern Biotechnology, Concepts and Principles; Organization for Economic Cooperation and Development: Paris, France, 1993. [Google Scholar]
- EFSA. Panel on Genetically Modified Organisms (GMO)—Guidance for risk assessment of food and feed from genetically modified plants. EFSA J. 2011, 9, 2150. [Google Scholar] [CrossRef]
- EFSA. Workshop on key allergens and compositional analysis in the allergenicity assessment of genetically modified plants. EFSA J. 2012, 9, 289. [Google Scholar] [CrossRef]
- Fernandez, A.; Mills, E.N.C.; Lovik, M.; Spoek, A.; Germini, A.; Mikalsen, A.; Wal, J.M. Endogenous allergens and compositional analysis in the allergenicity assessment of genetically modified plants. Food Chem. Toxicol. 2013, 62, 1–6. [Google Scholar] [CrossRef]
- Spok, A.; Gaugitsch, H.; Laffer, S.; Pauli, G.; Saito, H.; Sampson, H.; Sibanda, E.; Thomas, W.; van Hage, M.; Valenta, R. Suggestions for the assessment of the allergenic potential of genetically modified organisms. Int. Arch. Allergy Immunol. 2005, 137, 167–180. [Google Scholar] [CrossRef]
- Savage, J.H.; Kaeding, A.J.; Matsui, E.C.; Wood, R.A. The natural history of soy allergy. J. Allergy Clin. Immunol. 2010, 125, 683–686. [Google Scholar] [CrossRef]
- Stevenson, S.E.; Woods, C.A.; Hong, B.; Kong, X.; Thelen, J.J.; Ladics, G.S. Environmental effects on allergen levels in commercially grown non-genetically modified soybeans: Assessing variation across North America. Front. Plant Sci. 2012, 3, 196. [Google Scholar] [CrossRef] [Green Version]
- Houston, N.L.; Lee, D.G.; Stevenson, S.E.; Ladics, G.S.; Bannon, G.A.; McClain, S.; Privalle, L.; Stagg, N.; Herouet-Guicheney, C.; MacIntosh, S.C.; et al. Quantitation of soybean allergens using tandem mass spectrometry. J. Proteome Res. 2011, 10, 763–773. [Google Scholar] [CrossRef]
- Ladics, G.S.; Budziszewski, G.J.; Herman, R.A.; Herouet-Guicheney, C.; Joshi, S.; Lipscomb, E.A.; McClain, S.; Ward, J.M. Measurement of endogenous allergens in genetically modified soybeans--short communication. Regul. Toxicol. Pharmacol. 2014, 70, 75–79. [Google Scholar] [CrossRef]
- WHO; IUIS. Allergen Nomenclature. Available online: http://allergen.org/ (accessed on 24 December 2021).
- Graf, L.; Hayder, H.; Mueller, U. Endogenous allergens in the regulatory assessment of genetically engineered crops. Food Chem. Toxicol. 2014, 73, 17–20. [Google Scholar] [CrossRef]
- Tsai, J.J.; Chang, C.Y.; Liao, E.C. Comparison of Allergenicity at Gly m 4 and Gly m Bd 30K of Soybean after Genetic Modification. J. Agric. Food Chem. 2017, 65, 1255–1262. [Google Scholar] [CrossRef] [PubMed]
- Tsatsakis, A.M.; Nawaz, M.A.; Tutelyan, V.A.; Golokhvast, K.S.; Kalantzi, O.I.; Chung, D.H.; Kang, S.J.; Coleman, M.D.; Tyshko, N.; Yang, S.H.; et al. Impact on environment, ecosystem, diversity and health from culturing and using GMOs as feed and food. Food Chem. Toxicol. 2017, 107, 108–121. [Google Scholar] [CrossRef] [Green Version]
- Sartowska, K.E.; Korwin-Kossakowska, A.; Senderm, G. Genetically modified crops in a 10-generation feeding trial on Japanese quails—Evaluation of its influence on birds’ performance and body composition. Poult. Sci. 2015, 94, 2909–2916. [Google Scholar] [CrossRef]
- Taiwan Food and Drug Administration (TFDA). Current Approvals of Genetically Modified Foods in Taiwan. Available online: https://consumer.fda.gov.tw/Food/GmoInfoEn.aspx?nodeID=300&rand=1351460498 (accessed on 24 December 2021).
- Kok, E.J.; Kuiper, H.A. Comparative safety assessment for biotech crops. Trends Biotechnol. 2003, 21, 439–444. [Google Scholar] [CrossRef]
- Fu, T.T.; Lu, S.Y.; Huang, M.Y. Modelling and examining consumer attitudes toward genetically modified products in Taiwan using a generalized behavior framework. Sur. Res. Method Appl. 2013, 30, 98–127. (In Chinese) [Google Scholar]
- EFSA. Guidance on conducting repeated-dose 90-day oral toxicity study in rodents on whole food/feed. EFSA J. 2011, 9, 2438–2459. [Google Scholar] [CrossRef]
- Chen, J.T.; Wen, C.Y.; Chao, M.L.; Chu, W.S. Studies on DNA extraction and quantitation detection of genetically modified maize using referenced plasmid. Taiwan. J. Agric. Chem. Food Sci. 2005, 43, 139–148. (In Chinese) [Google Scholar]
- Yu, J.Y.L.; Cheng, C.K.; Chen, B.J.; Cheng, M.J.; Cheng, H.H.; Chang, W.J. A Guideline for the Care and Use of Laboratory Animals, 3rd ed.; The Chinese Society for the Laboratory Animal Science: Taipei, Taiwan, 2005. (In Chinese) [Google Scholar]
- Registry of Industrial Toxicology Animal-data (RITA); North American Control Animal Database (NACAD). Revised guides for organ sampling and trimming in rats and mice—Part 1. Exp. Toxicol. Pathol. 2003, 55, 91–106. [Google Scholar] [CrossRef] [Green Version]
- Shackelford, C.; Long, G.; Wolf, J.; Okerberg, C.; Herbert, R. Qualitative and quantitative analysis of nonneoplastic lesions in toxicology studies. Toxicol. Pathol. 2002, 30, 93–96. [Google Scholar] [CrossRef] [Green Version]
- Charles River Laboratories. Clinical Laboratory Parameters for Crl; WI (Han): Wilmington, MA, USA, 2008; pp. 1–14. [Google Scholar]
- Dona, A.; Arvanitoyannis, I.S. Health risks of genetically modified foods. Crit. Rev. Food Sci. Nutr. 2009, 49, 164–175. [Google Scholar] [CrossRef]
- Dong, W.; Yang, L.; Shen, K.; Kim, B.; Kleter, G.A.; Marvin, H.J.P. GMDD: A database of GMO detection methods. BMC Bioinform. 2008, 9, 260. [Google Scholar] [CrossRef] [PubMed] [Green Version]
- Holst-Jensen, A.; Bertheau, Y.; De Loose, M.; Grohmann, L.; Hamels, S.; Hougs, L. Detecting un-authorized genetically modified organisms (GMOs) and derived materials. Biotechnol. Adv. 2012, 30, 1318–1335. [Google Scholar] [CrossRef] [PubMed]
- D’Cruz, S.C.; Vaithinathan, S.; Jubendradass, R.; Mathur, P.P. Effects of plants and plant products on the testis. Asian J. Androl. 2010, 12, 468–479. [Google Scholar] [CrossRef] [PubMed] [Green Version]
- Guo, Q.Y.; He, L.X.; Zhu, H.; Shang, J.L.; Zhu, L.Y.; Wang, J.B.; Li, Y. Effects of 90-day feeding of transgenic maize BT799 on the reproductive system in male Wistar rats. Int. J. Environ. Res. Public Health 2015, 12, 15309–15320. [Google Scholar] [CrossRef] [PubMed]
- Appenzeller, L.M.; Malley, L.; Mackenzie, S.A.; Hoban, D.; Delaney, B. Subchronic feeding study with genetically modified stacked trait lepidopteran and coleopteran resistant (DAS-Ø15Ø7-1x DAS-59122-7) maize grain in Sprague-Dawley rats. Food Chem. Toxicol. 2009, 7, 1512–1520. [Google Scholar] [CrossRef]
- Appenzeller, L.M.; Munley, S.M.; Hoban, D.; Sykes, G.P.; Malley, L.A.; Delaney, B. Subchronic feeding study of herbicide-tolerant soybean DP-356Ø43-5 in Sprague-Dawley rats. Food Chem. Toxicol. 2008, 46, 2201–2213. [Google Scholar] [CrossRef]
- Tang, M.; Xie, T.; Cheng, W.; Qian, L.; Yang, S.; Yang, D.; Cui, W.; Li, K. A 90-day safety study of genetically modified rice expressing rhIGF-1 protein in C57BL/6J rats. Transgenic Res. 2012, 21, 499–510. [Google Scholar] [CrossRef]
- Ricroch, A.E.; Boisron, A.; Kuntz, M. Looking back at safety assessment of GM food/feed: An exhaustive review of 90-day animal feeding studies. Int. J. Biotechnol. 2014, 13, 230–256. [Google Scholar] [CrossRef]
- Zhang, W.; Shi, F. Do genetically modified crops affect animal reproduction? A review of the ongoing debate. Animal 2011, 5, 1048–1059. [Google Scholar] [CrossRef] [Green Version]
- Yen, J.T.; Jensen, A.H.; Simon, J. Effect of dietary raw soybean and soybean trypsin inhibitor on trypsin and chymotrypsin activities in the pancreas and in small intestinal juice of growing swine. J. Nutr. 1977, 107, 156–165. [Google Scholar] [CrossRef] [PubMed]
- Liu, X.Q.; Zhu, X.M.; Han, D.; Jin, J.Y.; Yang, Y.X.; Xie, S.Q. Effect of different temperatures and durations of heating on trypsin inhibitor activities and protein solubility in transgenic and nontransgenic soybean. Siliao Gongye 2013, 34, 32–37. (In Chinese) [Google Scholar]


| Group/Week | Feed Consumption (g/day) a | |||||
|---|---|---|---|---|---|---|
| Non-GM | GM-1 | GM-2 | ||||
| 1 g/kg | 5 g/kg | 1 g/kg | 5 g/kg | 1 g/kg | 5 g/kg | |
| Male | ||||||
| 1 | 25.5 ± 2.5 | 23.7 ± 3.2 | 25.9 ± 2.1 | 24.8 ± 2.0 | 27.1 ± 2.1 | 25.0 ± 2.0 |
| 2 | 26.1 ± 1.9 | 24.5 ± 2.8 | 26.9 ± 2.4 | 24.1 ± 4. | 28.3 ± 1.9 * | 24.1 ± 3.7 |
| 3 | 26.3 ± 3.1 | 25.9 ± 2.9 | 28.3 ± 2.1 | 27.5 ± 3.7 | 29.4 ± 1.9 * | 25.3 ± 3.4 |
| 4 | 27.1 ± 2.4 | 26.0 ± 2.6 | 29.2 ± 1.6 * | 27.1 ± 3.4 | 30.1 ± 1.7 * | 26.2 ± 2.9 |
| 5 | 27.6 ± 2.8 | 26.1 ± 2.3 | 30.2 ± 1.0 * | 26.6 ± 3.0 | 30.8 ± 2.6 * | 26.9 ± 4.2 |
| 6 | 28.8 ± 2.4 | 25.3 ± 2.0 | 31.0 ± 1.3 * | 26.6 ± 3.4 | 31.3 ± 2.3 * | 25.9 ± 3.4 |
| 7 | 27.4 ± 3.3 | 24.0 ± 1.9 | 27.6 ± 1.0 | 24.9 ± 3.3 | 27.8 ± 2.4 | 24.5 ± 2.8 |
| 8 | 27.7 ± 2.6 | 24.4 ± 2.2 | 29.5 ± 1.0 | 26.3 ± 3.0 | 29.3 ± 1.5 | 25.4 ± 2.1 |
| 9 | 28.4 ± 4.7 | 23.6 ± 2.3 | 29.5 ± 2.3 | 25.5 ± 3.5 | 30.5 ± 3.1 | 24.3 ± 2.3 |
| 10 | 26.9 ± 3.9 | 25.4 ± 4.1 | 29.6 ± 1.3 | 26.7 ± 4.9 | 30.9 ± 3.2 * | 24.8 ± 2.4 |
| 11 | 27.4 ± 3.9 | 23.8 ± 2.8 | 29.1 ± 1.1 | 24.8 ± 2.8 | 30.0 ± 2.8 | 24.2 ± 4.1 |
| 12 | 28.5 ± 3.4 | 24.5 ± 2.7 | 26.7 ± 9.5 | 26.0 ± 2.9 | 30.1 ± 2.4 | 23.8 ± 1.7 |
| 13 | 24.3 ± 4.2 | 20.3 ± 2.3 | 26.1 ± 2.8 | 21.9 ± 3.1 | 27.6 ± 4.3 | 20.7 ± 2.3 |
| Feed efficiency (%) b | 13.9 ± 0.9 | 14.4 ± 0.8 | 15.1 ± 1.4 * | 14.4 ± 2.0 | 14.6 ± 0.7 | 13.2 ± 2.0 |
| Female | ||||||
| 1 | 20.1 ± 1.4 | 18.9 ± 1.5 | 21.8 ± 2.3 * | 20.3 ± 2.5 | 20.7 ± 1.6 | 20.0 ± 1.8 |
| 2 | 20.0 ± 3.0 | 17.3 ± 2.4 | 18.4 ± 4.9 | 19.4 ± 3.4 | 18.8 ± 2.0 | 19.9 ± 2.6 |
| 3 | 20.5 ± 2.0 | 18.2 ± 2.6 | 21.0 ± 2.9 | 19.8 ± 2.8 | 20.2 ± 2.8 | 20.0 ± 2.3 |
| 4 | 21.7 ± 2.5 | 20.5 ± 4.6 | 21.4 ± 4.3 | 22.9 ± 4.5 | 19.7 ± 3.2 | 19.9 ± 1.8 |
| 5 | 22.2 ± 4.5 | 19.6 ± 2.3 | 21.9 ± 3.0 | 21.3 ± 4.3 | 19.7 ± 2.0 | 20.1 ± 2.3 |
| 6 | 26.1 ± 2.0 | 25.3 ± 2.4 | 28.9 ± 2.8 | 26.6 ± 2.6 | 24.4 ± 4.3 | 26.8 ± 1.5 |
| 7 | 27.4 ± 3.1 | 25.1 ± 2.4 | 26.9 ± 2.1 | 25.5 ± 1.7 | 25.9 ± 1.9 | 25.3 ± 1.9 |
| 8 | 26.0 ± 1.6 | 24.4 ± 2.5 | 25.4 ± 2.4 | 24.7 ± 1.9 | 24.9 ± 2.1 | 23.4 ± 2.5 |
| 9 | 27.6 ± 2.4 | 26.4 ± 2.5 | 27.3 ± 2.5 | 26.7 ± 3.0 | 26.7 ± 2.0 | 26.7 ± 1.3 |
| 10 | 26.6 ± 2.2 | 24.2 ± 3.1 | 27.3 ± 2.3 | 24.7 ± 2.0 | 25.6 ± 2.0 | 24.8 ± 2.5 |
| 11 | 26.6 ± 1.3 | 25.2 ± 2.0 | 26.4 ± 1.9 | 24.5 ± 2.0 | 24.9 ± 2.1 * | 24.9 ± 2.2 |
| 12 | 26.4 ± 2.5 | 24.6 ± 3.2 | 26.3 ± 2.2 | 24.9 ± 2.2 | 26.6 ± 2.0 | 25.6 ± 2.7 |
| 13 | 23.9 ± 3.1 | 22.4 ± 2.2 | 23.6 ± 1.5 | 21.4 ± 1.4 | 22.5 ± 2.1 | 23.2 ± 1.3 |
| Feed efficiency (%) | 6.5 ± 1.4 | 6.4 ± 0.9 | 6.8 ± 1.2 | 6.4 ± 1.0 | 6.8 ± 1.0 | 6.8 ± 1.1 |
| Group/Items a | Non-GM (g/kg) | GM-1 (g/kg) | GM-2 (g/kg) | |||
|---|---|---|---|---|---|---|
| 1 | 5 | 1 | 5 | 1 | 5 | |
| Male | ||||||
| RBC (106/μL) | 8.7 ± 0.5 | 8.5 ± 0.4 | 8.5 ± 0.6 | 8.7 ± 0.2 | 9.0 ± 0.3 | 9.2 ± 0.3 * |
| HGB (g/dL) | 16.0 ± 0.5 | 15.2 ± 0.4 | 15.8 ± 1.0 | 15.7 ± 0.5 * | 16.5 ± 0.7 | 16.7 ± 0.5 * |
| HCT (%) | 46.4 ± 1.5 | 44.4 ± 1.2 | 45.8 ± 2.7 | 46.2 ± 1.6 * | 48.6 ± 2.0 * | 48.8 ± 2.7 * |
| MCV (fL) | 53.5 ± 1.9 | 52.6 ± 2.2 | 53.7 ± 1.6 | 53.4 ± 1.2 | 54.1 ± 2.6 | 53.0 ± 2.1 |
| MCH (pg) | 18.5 ± 0.8 | 17.9 ± 0.7 | 18.6 ± 0.9 | 18.1 ± 0.4 | 18.4 ± 0.9 | 18.2 ± 0.5 |
| MCHC (g/dL) | 34.5 ± 0.6 | 34.1 ± 1.0 | 34.6 ± 1.7 | 34.0 ± 1.4 | 34.0 ± 0.9 | 34.3 ± 1.1 |
| PLT (103/μL) | 674 ± 77 | 651 ± 103 | 686 ± 166 | 711 ± 161 | 636 ± 112 | 640 ± 90 |
| PT (s) | 10.9 ± 0.2 | 11.5 ± 1.8 | 10.7 ± 0.5 | 12.4 ± 3.3 | 11.6 ± 2.2 | 11.7 ± 1.1 |
| APTT (s) | 23.5 ± 3.9 | 28.6 ± 11.3 | 26.3 ± 4.9 | 31.6 ± 11.2 | 30.4 ± 6.5 * | 26.8 ± 3.5 |
| FBG (mg/dL) | 223.9 ± 18.7 | 187.1 ± 48.0 | 233.2 ± 34.3 | 207.6 ± 26.1 | 219.8 ± 51.2 | 205.2 ± 57.7 |
| Female | ||||||
| RBC (106/μL) | 8.0 ± 0.2 | 7.9 ± 0.4 | 8.3 ± 0.4 | 8.3 ± 0.4 * | 8.0 ± 0.3 | 8.2 ± 0.4 |
| HGB (g/dL) | 15.2 ± 0.5 | 15.2 ± 0.7 | 15.5 ± 0.6 | 15.5 ± 0.6 | 15.0 ± 0.7 | 15.4 ± 1.2 |
| HCT (%) | 44.8 ± 1.5 | 45.4 ± 1.7 | 46.5 ± 2.4 | 46.7 ± 1.9 | 44.9 ± 2.3 | 46.8 ± 2.3 |
| MCV (fL) | 56.0 ± 1.0 | 57.7 ± 2.0 | 56.2 ± 2.0 | 56.4 ± 2.4 | 56.4 ± 2.7 | 57.1 ± 2.1 |
| MCH (pg) | 18.9 ± 0.5 | 19.3 ± 0.7 | 18.7 ± 0.5 | 18.7 ± 0.9 | 18.8 ± 0.7 | 18.8 ± 1.6 |
| MCHC (g/dL) | 33.8 ± 0.6 | 33.4 ± 0.8 | 33.3 ± 0.8 | 33.1 ± 1.2 | 33.4 ± 0.7 | 32.8 ± 2.6 |
| PLT (103/μL) | 625.0 ± 105.0 | 619.1 ± 149.9 | 650.3 ± 137.8 | 488.6 ± 169.2 | 578.7 ± 113.7 | 556.7 ± 164.5 |
| PT (s) | 9.8 ± 0.3 | 10.3 ± 1.4 | 10.0 ± 0.5 | 10.8 ± 1.6 | 10.0 ± 0.4 | 10.2 ± 0.3 |
| APTT (s) | 21.5 ± 3.1 | 23.6 ± 5.0 | 23.4 ± 2.6 | 30.3 ± 8.6 | 25.5 ± 6.1 | 28.6 ± 5.3 * |
| FBG (mg/dL) | 184.2 ± 19.4 | 154.8 ± 31.3 | 172.1 ± 27.1 | 158.0 ± 22.2 | 177.9 ± 37.9 | 147.2 ± 35.3 |
| Group a/Items | Non-GM (g/kg) | GM-1 (g/kg) | GM-2 (g/kg) | |||
|---|---|---|---|---|---|---|
| 1 | 5 | 1 | 5 | 1 | 5 | |
| Male | ||||||
| WBC (103/μL) | 7.3 ± 1.8 | 4.5 ± 1.4 | 5.6 ± 1.3 * | 4.7 ± 0.9 | 5.1 ± 1.6 * | 5.9 ± 1.7 |
| Lymphocyte (%) | 84.6 ± 9.3 | 77.4 ± 8.0 | 79.2 ± 12.0 | 81.0 ± 10.7 | 76.9 ± 11.0 | 84.3 ± 9.7 |
| Neutrophil | ||||||
| Band (%) | 0.0 ± 0.0 | 0.1 ± 0.3 | 0.0 ± 0.0 | 0.0 ± 0.0 | 0.0 ± 0.0 | 0.0 ± 0.0 |
| Segment (%) | 11.8 ± 7.7 | 19.6 ± 7.3 | 17.3 ± 12.7 | 16.2 ± 10.1 | 19.8 ± 11.2 | 12.9 ± 8.7 |
| Monocyte (%) | 2.4 ± 1.6 | 1.7 ± 1.5 | 2.2 ± 1.4 | 1.6 ± 1.3 | 2.8 ± 1.4 | 2.2 ± 1.6 |
| Eosinophil (%) | 1.2 ± 1.1 | 1.2 ± 0.8 | 0.9 ± 0.8 | 1.2 ± 1.5 | 0.5 ± 0.7 | 0.4 ± 0.7 * |
| Basophil (%) | 0.0 ± 0.0 | 0.0 ± 0.0 | 0.0 ± 0.0 | 0.0 ± 0.0 | 0.0 ± 0.0 | 0.0 ± 0.0 |
| Female | ||||||
| WBC (103/μL) | 4.7 ± 1.8 | 4.0 ± 1.3 | 3.9 ± 0.9 | 3.8 ± 1.5 | 4.6 ± 1.5 | 4.1 ± 2.0 |
| Lymphocyte (%) | 80.6 ± 9.8 | 81.0 ± 5.8 | 80.0 ± 4.3 | 84.5 ± 10.2 | 80.5 ± 8.3 | 75.5 ± 6.5 |
| Neutrophil | ||||||
| Band (%) | 0.0 ± 0.0 | 0.0 ± 0.0 | 0.0 ± 0.0 | 0.1 ± 0.3 | 0.0 ± 0.0 | 0.1 ± 0.3 |
| Segment (%) | 16.5 ± 9.3 | 16.9 ± 5.3 | 16.7 ± 3.8 | 12.9 ± 9.4 | 15.7 ± 8.9 | 20.8 ± 6.0 |
| Monocyte (%) | 2.5 ± 1.2 | 2.0 ± 0.7 | 2.3 ± 1.3 | 2.0 ± 1.2 | 2.9 ± 0.9 | 3.0 ± 1.2 * |
| Eosinophil (%) | 0.4 ± 0.4 | 0.1 ± 0.3 | 1.0 ± 1.2 | 0.4 ± 0.8 | 0.3 ± 0.7 | 0.6 ± 0.7 * |
| Basophil (%) | 0.0 ± 0.0 | 0.0 ± 0.0 | 0.0 ± 0.0 | 0.0 ± 0.0 | 0.0 ± 0.0 | 0.0 ± 0.0 |
| Group/Items a | Non-GM (g/kg) | GM-1 (g/kg) | GM-2 (g/kg) | |||
|---|---|---|---|---|---|---|
| 1 | 5 | 1 | 5 | 1 | 5 | |
| Male | ||||||
| Albumin (g/dL) | 3.7 ± 0.1 | 3.5 ± 0.3 | 3.7 ± 0.1 | 3.7 ± 0.2 * | 3.7 ± 0.1 | 3.7 ± 0.3 |
| ALP (U/L) | 91.0 ± 18.5 | 99.9 ± 35.9 | 95.1 ± 22.9 | 94.0 ± 34.8 | 81.4 ± 23.0 | 91.6 ± 23.5 |
| Amylase (U/L) | 1965.6 ± 359.2 | 1455.0 ± 397.1 | 1903.9 ± 425.2 | 1648.5 ± 345.9 | 1818.6 ± 241.7 | 1589.6 ± 307.9 |
| ALT (U/L) | 158.7 ± 40.4 | 150.6 ± 72.6 | 140.6 ± 42.2 | 150.7 ± 41.9 | 143.3 ± 52.4 | 164.3 ± 56.4 |
| AST (U/L) | 42.0 ± 27.3 | 41.4 ± 7.5 | 36.4 ± 7.4 | 43.1 ± 8.9 | 34.2 ± 5.6 | 39.4 ± 9.0 |
| BUN (mg/dL) | 18.2 ± 3.9 | 19.8 ± 4.7 | 19.8 ± 4.5 | 18.7 ± 3.5 | 20.3 ± 5.0 | 21.0 ± 6.6 |
| Creatinine (mg/dL) | 0.3 ± 0.1 | 0.4 ± 0.2 | 0.3 ± 0.1 | 0.4 ± 0.1 | 0.4 ± 0.1 * | 0.4 ± 0.1 |
| CK (U/L) | 1046.3 ± 257.8 | 678.0 ± 273.1 | 922.8 ± 548.1 | 795.1 ± 216.2 | 808.7 ± 482.8 | 919.7 ± 398.5 |
| Glucose (mg/dL) | 127.3 ± 32.4 | 128.1 ± 34.6 | 116.9 ± 32.4 | 143.4 ± 57.3 | 113.2 ± 38.0 | 104.1 ± 40.8 |
| LDH (U/L) | 2201 ± 707 | 1235 ± 377 | 1732 ± 711 | 1337 ± 346 | 1729 ± 1034 | 1991 ± 854 * |
| TC (mg/dL) | 62.0 ± 17.2 | 51.9 ± 7.5 | 68.0 ± 14.9 | 59.4 ± 16.4 | 70.3 ± 15.6 | 52.9 ± 13.5 |
| TG (mg/dL) | 46.4 ± 29.5 | 25.2 ± 8.8 | 32.2 ± 10.1 | 33.8 ± 12.9 | 41.1 ± 10.9 | 37.4 ± 10.2 * |
| TP (g/dL) | 5.8 ± 0.3 | 5.5 ± 0.5 | 6.0 ± 0.4 | 5.8 ± 0.3 | 5.9 ± 0.2 | 5.9 ± 0.5 |
| Ca2+ (mg/dL) | 9.6 ± 0.7 | 9.5 ± 0.5 | 9.5 ± 0.6 | 9.7 ± 0.5 | 9.9 ± 0.5 | 9.9 ± 0.3 |
| Cl− (mEq/dL) | 103.3 ± 4.4 | 103.8 ± 3.0 | 104.1 ± 2.6 | 103.7 ± 3.2 | 104.7 ± 2.8 | 105.2 ± 3.9 |
| K+ (mEq/dL) | 9.7 ± 1.8 | 10.0 ± 1.3 | 9.5 ± 1.6 | 10.0 ± 1.4 | 9.8 ± 1.3 | 9.7 ± 1.2 |
| Mg2+ (mEq/dL) | 2.3 ± 0.4 | 2.2 ± 0.3 | 2.4 ± 0.4 | 2.3 ± 0.3 | 2.6 ± 0.4 | 2.4 ± 0.4 |
| Na+ (mEq/dL) | 140.6 ± 1.5 | 140.1 ± 2.2 | 140.6 ± 1.7 | 140.9 ± 2.6 | 141.8 ± 2.7 | 141.4 ± 3.1 |
| P3− (mg/dL) | 7.9 ± 1.8 | 8.0 ± 1.1 | 8.6 ± 2.3 | 8.1 ± 1.4 | 9.1 ± 1.2 | 8.8 ± 1.6 |
| Group/Items a | Non-GM (g/kg) | GM-1 (g/kg) | GM-2 (g/kg) | |||
|---|---|---|---|---|---|---|
| 1 | 5 | 1 | 5 | 1 | 5 | |
| Female | ||||||
| Albumin (g/dL) | 3.7 ± 0.4 | 3.5 ± 0.2 | 3.8 ± 0.2 | 3.7 ± 0.2 * | 3.8 ± 0.3 | 3.7 ± 0.2 * |
| ALP (U/L) | 53.7 ± 9.8 | 69.0 ± 26.7 | 61.2 ± 12.1 | 49.7 ± 19.6 | 47.6 ± 11.2 | 62.0 ± 24.7 |
| Amylase (U/L) | 1253.4 ± 285.6 | 1098.3 ± 123.8 | 1272.5 ± 315.2 | 1145.9 ± 162.9 | 1184.8 ± 246.5 | 1248.8 ± 262.8 |
| ALT (U/L) | 116.3 ± 20.4 | 99.2 ± 26.4 | 120.0 ± 15.1 | 164.6 ± 126.2 | 120.4 ± 35.0 | 126.7 ± 32.0 |
| AST (U/L) | 44.3 ± 26.2 | 27.6 ± 6.2 | 27.9 ± 4.5 | 30.3 ± 12.4 | 38.3 ± 23.9 | 31.3 ± 6.4 |
| BUN (mg/dL) | 18.3 ± 4.3 | 21.2 ± 3.9 | 18.5 ± 2.6 | 22.4 ± 4.0 | 20.2 ± 4.5 | 20.4 ± 3.4 |
| Creatinine (mg/dL) | 0.4 ± 0.1 | 0.4 ± 0.1 | 0.4 ± 0.1 | 0.5 ± 0.1 * | 0.4 ± 0.0 | 0.5 ± 0.1 * |
| CK (U/L) | 479.9 ± 195.4 | 477.1 ± 261.8 | 663.7 ± 239.1 | 1069.2 ± 1451.9 | 503.4 ± 168.5 | 648.8 ± 437.6 |
| Glucose (mg/dL) | 97.0 ± 22.0 | 95.1 ± 15.3 | 81.3 ± 14.1 | 84.1 ± 15.5 | 94.5 ± 28.2 | 77.5 ± 21.6 * |
| LDH (U/L) | 898.9 ± 350.4 | 929.7 ± 557.5 | 1174.2 ± 308.9 | 1357.4 ± 796.3 | 987.9 ± 356.4 | 1176.0 ± 730.9 |
| TC (mg/dL) | 69.6 ± 9.6 | 49.5 ± 10.5 | 61.1 ± 11.1 | 60.9 ± 10.2 | 69.7 ± 21.1 | 71.1 ± 21.0 * |
| TG (mg/dL) | 33.1 ± 9.7 | 29.9 ± 8.5 | 29.8 ± 7.6 | 34.3 ± 8.9 | 35.5 ± 10.4 | 32.4 ± 10.4 |
| TP (g/dL) | 6.0 ± 0.5 | 5.7 ± 0.3 | 6.0 ± 0.4 | 5.9 ± 0.3 | 5.9 ± 0.4 | 5.9 ± 0.3 |
| Ca2+ (mg/dL) | 9.6 ± 0.6 | 9.8 ± 0.4 | 9.7 ± 0.3 | 9.6 ± 0.3 | 9.7 ± 0.4 | 9.7 ± 0.2 |
| Cl− (mEq/dL) | 106.2 ± 2.4 | 106.1 ± 3.7 | 105.8 ± 3.3 | 105.6 ± 3.1 | 105.5 ± 2.6 | 103.9 ± 2.8 |
| K+ (mEq/dL) | 8.8 ± 1.7 | 8.3 ± 1.2 | 8.6 ± 1.5 | 8.4 ± 1.4 | 8.9 ± 1.3 | 7.7 ± 1.2 |
| Mg2+ (mEq/dL) | 2.3 ± 0.3 | 2.3 ± 0.3 | 2.4 ± 0.3 | 2.5 ± 0.3 | 2.7 ± 0.3 * | 2.5 ± 0.2 |
| Na+ (mEq/dL) | 140.2 ± 3.0 | 139.9 ± 3.0 | 139.2 ± 3.6 | 139.7 ± 3.1 | 139.0 ± 3.1 | 138.3 ± 2.3 |
| P3− (mg/dL) | 7.0 ± 1.4 | 9.2 ± 2.2 | 7.6 ± 1.4 | 9.2 ± 2.2 | 8.7 ± 1.9 * | 8.3 ± 1.4 |
| Group/Organ a | Non-GM (g/kg) | GM-1 (g/kg) | GM-2 (g/kg) | |||
|---|---|---|---|---|---|---|
| 1 | 5 | 1 | 5 | 1 | 5 | |
| Male | ||||||
| Adrenal (%) | 0.08 ± 0.02 | 0.08 ± 0.01 | 0.08 ± 0.01 | 0.10 ± 0.02 * | 0.08 ± 0.02 | 0.11 ± 0.02 * |
| Brain (%) | 0.4 ± 0.0 | 0.4 ± 0.0 | 0.4 ± 0.0 | 0.4 ± 0.0 | 0.4 ± 0.0 | 0.4 ± 0.0 |
| Heart (%) | 0.3 ± 0.0 | 0.3 ± 0.0 | 0.3 ± 0.0 | 0.3 ± 0.0 | 0.3 ± 0.0 | 0.3 ± 0.0 |
| Liver (%) | 2.4 ± 0.3 | 2.2 ± 0.2 | 2.4 ± 0.1 | 2.4 ± 0.2 | 2.3 ± 0.2 | 2.2 ± 0.2 |
| Kidney (%) | 0.6 ± 0.0 | 0.7 ± 0.1 | 0.6 ± 0.0 | 0.6 ± 0.1 | 0.6 ± 0.0 | 0.6 ± 0.1 |
| Spleen (%) | 0.1 ± 0.0 | 0.1 ± 0.0 | 0.1 ± 0.0 | 0.1 ± 0.0 | 0.1 ± 0.0 | 0.1 ± 0.0 |
| Thymus (%) | 0.1 ± 0.0 | 0.1 ± 0.0 | 0.1 ± 0.0 | 0.1 ± 0.0 | 0.1 ± 0.0 | 0.1 ± 0.0 |
| Testes (%) | 0.6 ± 0.0 | 0.7 ± 0.1 | 0.6 ± 0.0 | 0.7 ± 0.1 | 0.6 ± 0.1 | 0.7 ± 0.1 |
| Female | ||||||
| Adrenal (%) | 0.18 ± 0.01 | 0.2 ± 0.05 | 0.18 ± 0.06 | 0.18 ± 0.06 | 0.20 ± 0.05 | 0.19 ± 0.05 |
| Brain (%) | 0.7 ± 0.1 | 0.7 ± 0.1 | 0.7 ± 0.1 | 0.7 ± 0.1 | 0.7 ± 0.1 | 0.6 ± 0.1 |
| Heart (%) | 0.3 ± 0.0 | 0.3 ± 0.1 | 0.3 ± 0.1 | 0.3 ± 0.1 | 0.3 ± 0.0 | 0.3 ± 0.0 |
| Liver (%) | 2.4 ± 0.3 | 2.3 ± 0.4 | 2.3 ± 0.4 | 2.4 ± 0.5 | 2.4 ± 0.3 | 2.2 ± 0.4 |
| Kidney (%) | 0.6 ± 0.0 | 0.7 ± 0.1 | 0.6 ± 0.1 | 0.6 ± 0.1 | 0.7 ± 0.1 | 0.6 ± 0.1 |
| Spleen (%) | 0.2 ± 0.0 | 0.1 ± 0.0 | 0.2 ± 0.0 | 0.2 ± 0.0 | 0.2 ± 0.0 | 0.2 ± 0.1 |
| Thymus (%) | 0.1 ± 0.0 | 0.1 ± 0.0 | 0.1 ± 0.0 | 0.1 ± 0.0 | 0.1 ± 0.0 | 0.1 ± 0.0 |
| Ovary (%) | 0.02 ± 0.0 | 0.03 ± 0.0 | 0.02 ± 0.0 | 0.02 ± 0.0 | 0.03 ± 0.0 | 0.02 ± 0.0 |
| Organ | Histopathological Findings | Group (5 g/kg) | |||||
|---|---|---|---|---|---|---|---|
| Male | Female | ||||||
| Non- GM | GM -1 | GM -2 | Non -GM | GM -1 | GM -2 | ||
| Adrenal gland | - | - | - | - | - | - | |
| Aorta | - | - | - | - | - | - | |
| Brain | |||||||
| Fore | - | - | - | - | - | - | |
| Middle | - | - | - | - | - | - | |
| Cerebellum | - | - | - | - | - | - | |
| Stem | - | - | - | - | - | - | |
| Bone, femur | - | - | - | - | - | - | |
| Bone marrow | |||||||
| Femur and sternum | - | - | - | - | - | - | |
| Cervix | N | N | N | - | - | - | |
| Epididymis | - | - | - | - | - | - | |
| Esophagus | - | - | - | - | - | - | |
| Eyes | - | - | - | - | - | - | |
| Harderian gland | |||||||
| Infiltration, mononuclear cell, focal, minimal to slight a | - | - | 1/9 b | 1/10 | - | - | |
| Heart | |||||||
| Infiltration, mononuclear cell, focal, minimal to slight | - | - | 1/9 | - | - | - | |
| Intestine, small | |||||||
| Duodenum | - | - | - | - | - | - | |
| Jejunum | - | - | - | - | - | - | |
| Ileum | - | - | - | - | - | - | |
| Intestine, large | |||||||
| Caecum | - | - | - | - | - | - | |
| Colon | - | - | - | - | - | - | |
| Rectum | - | - | - | - | - | - | |
| Kidney | |||||||
| Cyst, tubule, focal, slight to moderate | 2/9 | - | - | - | - | - | |
| Liver | - | - | - | - | - | - | |
| Lung | |||||||
| Granuloma, foreign body, focal, slight | 1/9 | - | - | - | - | - | |
| Lymph node | |||||||
| Cervical | - | - | - | - | - | - | |
| Mesenteric | - | - | - | - | - | - | |
| Mammary gland | N | N | N | - | - | - | |
| Optic nerve | - | - | - | - | - | - | |
| Ovary | N | N | N | - | - | - | |
| Oviduct | N | N | N | - | - | - | |
| Pancreas | |||||||
| Fibrosis, islet, focal, slight | - | - | 1/9 | - | - | - | |
| Pituitary | - | - | - | - | - | - | |
| Parathyroid gland | - | - | - | - | - | - | |
| Prostate gland | N | N | N | ||||
| Infiltration, mononuclear cell, focal, minimal to moderate | 4/9 | 1/10 | 2/9 | ||||
| Salivary gland | |||||||
| Mandibular lobe | - | - | - | - | - | - | |
| Sublingual lobe | - | - | - | - | - | - | |
| Sciatic nerve | - | - | - | - | - | - | |
| Seminal vesicle | - | - | - | N | N | N | |
| Skeletal muscle | - | - | - | - | - | - | |
| Skin | - | - | - | - | - | - | |
| Spinal cord | |||||||
| Cervical | - | - | - | - | - | - | |
| Lumbar | - | - | - | - | - | - | |
| Thoracic | - | - | - | - | - | - | |
| Spleen | |||||||
| Fibrosis, serosa, focal, minimal | - | 1/10 | - | - | 1/10 | - | |
| Stomach | - | - | - | - | - | - | |
| Testes | - | - | - | - | - | - | |
| Thymus | - | - | - | - | - | - | |
| Thyroid gland | - | - | - | - | - | - | |
| Tongue | - | - | - | - | - | - | |
| Trachea | - | - | - | - | - | - | |
| Urinary bladder | - | - | - | - | - | - | |
| Uterus | N | N | N | - | - | - | |
| Vagina | N | N | N | - | - | - | |
Publisher’s Note: MDPI stays neutral with regard to jurisdictional claims in published maps and institutional affiliations. |
© 2022 by the authors. Licensee MDPI, Basel, Switzerland. This article is an open access article distributed under the terms and conditions of the Creative Commons Attribution (CC BY) license (https://creativecommons.org/licenses/by/4.0/).
Share and Cite
Lin, H.-Y.; Liao, J.-W.; Chen, R.-S.; Chang, C.-H.; Chang, H.-W.; Chang, S.-C.; Chu, W.-S.; Lin, C.-K.; Lin, H.-T. Food Safety Assessment of Commercial Genetically Modified Soybeans in Rats. Foods 2022, 11, 496. https://doi.org/10.3390/foods11040496
Lin H-Y, Liao J-W, Chen R-S, Chang C-H, Chang H-W, Chang S-C, Chu W-S, Lin C-K, Lin H-T. Food Safety Assessment of Commercial Genetically Modified Soybeans in Rats. Foods. 2022; 11(4):496. https://doi.org/10.3390/foods11040496
Chicago/Turabian StyleLin, Huan-Yu, Jiunn-Wang Liao, Ruo-Shiuan Chen, Chia-Hua Chang, Hui-Wen Chang, Shih-Chieh Chang, Wen-Shen Chu, Chien-Ku Lin, and Hsin-Tang Lin. 2022. "Food Safety Assessment of Commercial Genetically Modified Soybeans in Rats" Foods 11, no. 4: 496. https://doi.org/10.3390/foods11040496
APA StyleLin, H.-Y., Liao, J.-W., Chen, R.-S., Chang, C.-H., Chang, H.-W., Chang, S.-C., Chu, W.-S., Lin, C.-K., & Lin, H.-T. (2022). Food Safety Assessment of Commercial Genetically Modified Soybeans in Rats. Foods, 11(4), 496. https://doi.org/10.3390/foods11040496