
Insights into the Metabolomic Diversity of Latilactobacillus sakei

 , ,
, , 
Abstract
:1. Introduction
2. Materials and Methods
2.1. Microbial Strains
2.2. Growth Media
2.3. Microbiological Analyses and pH
2.4. Untargeted Metabolomics Analysis by 1H-NMR
2.5. Statistical Analysis
3. Results
3.1. Microbial Counts and pH
3.2. Metabolomic Analyses
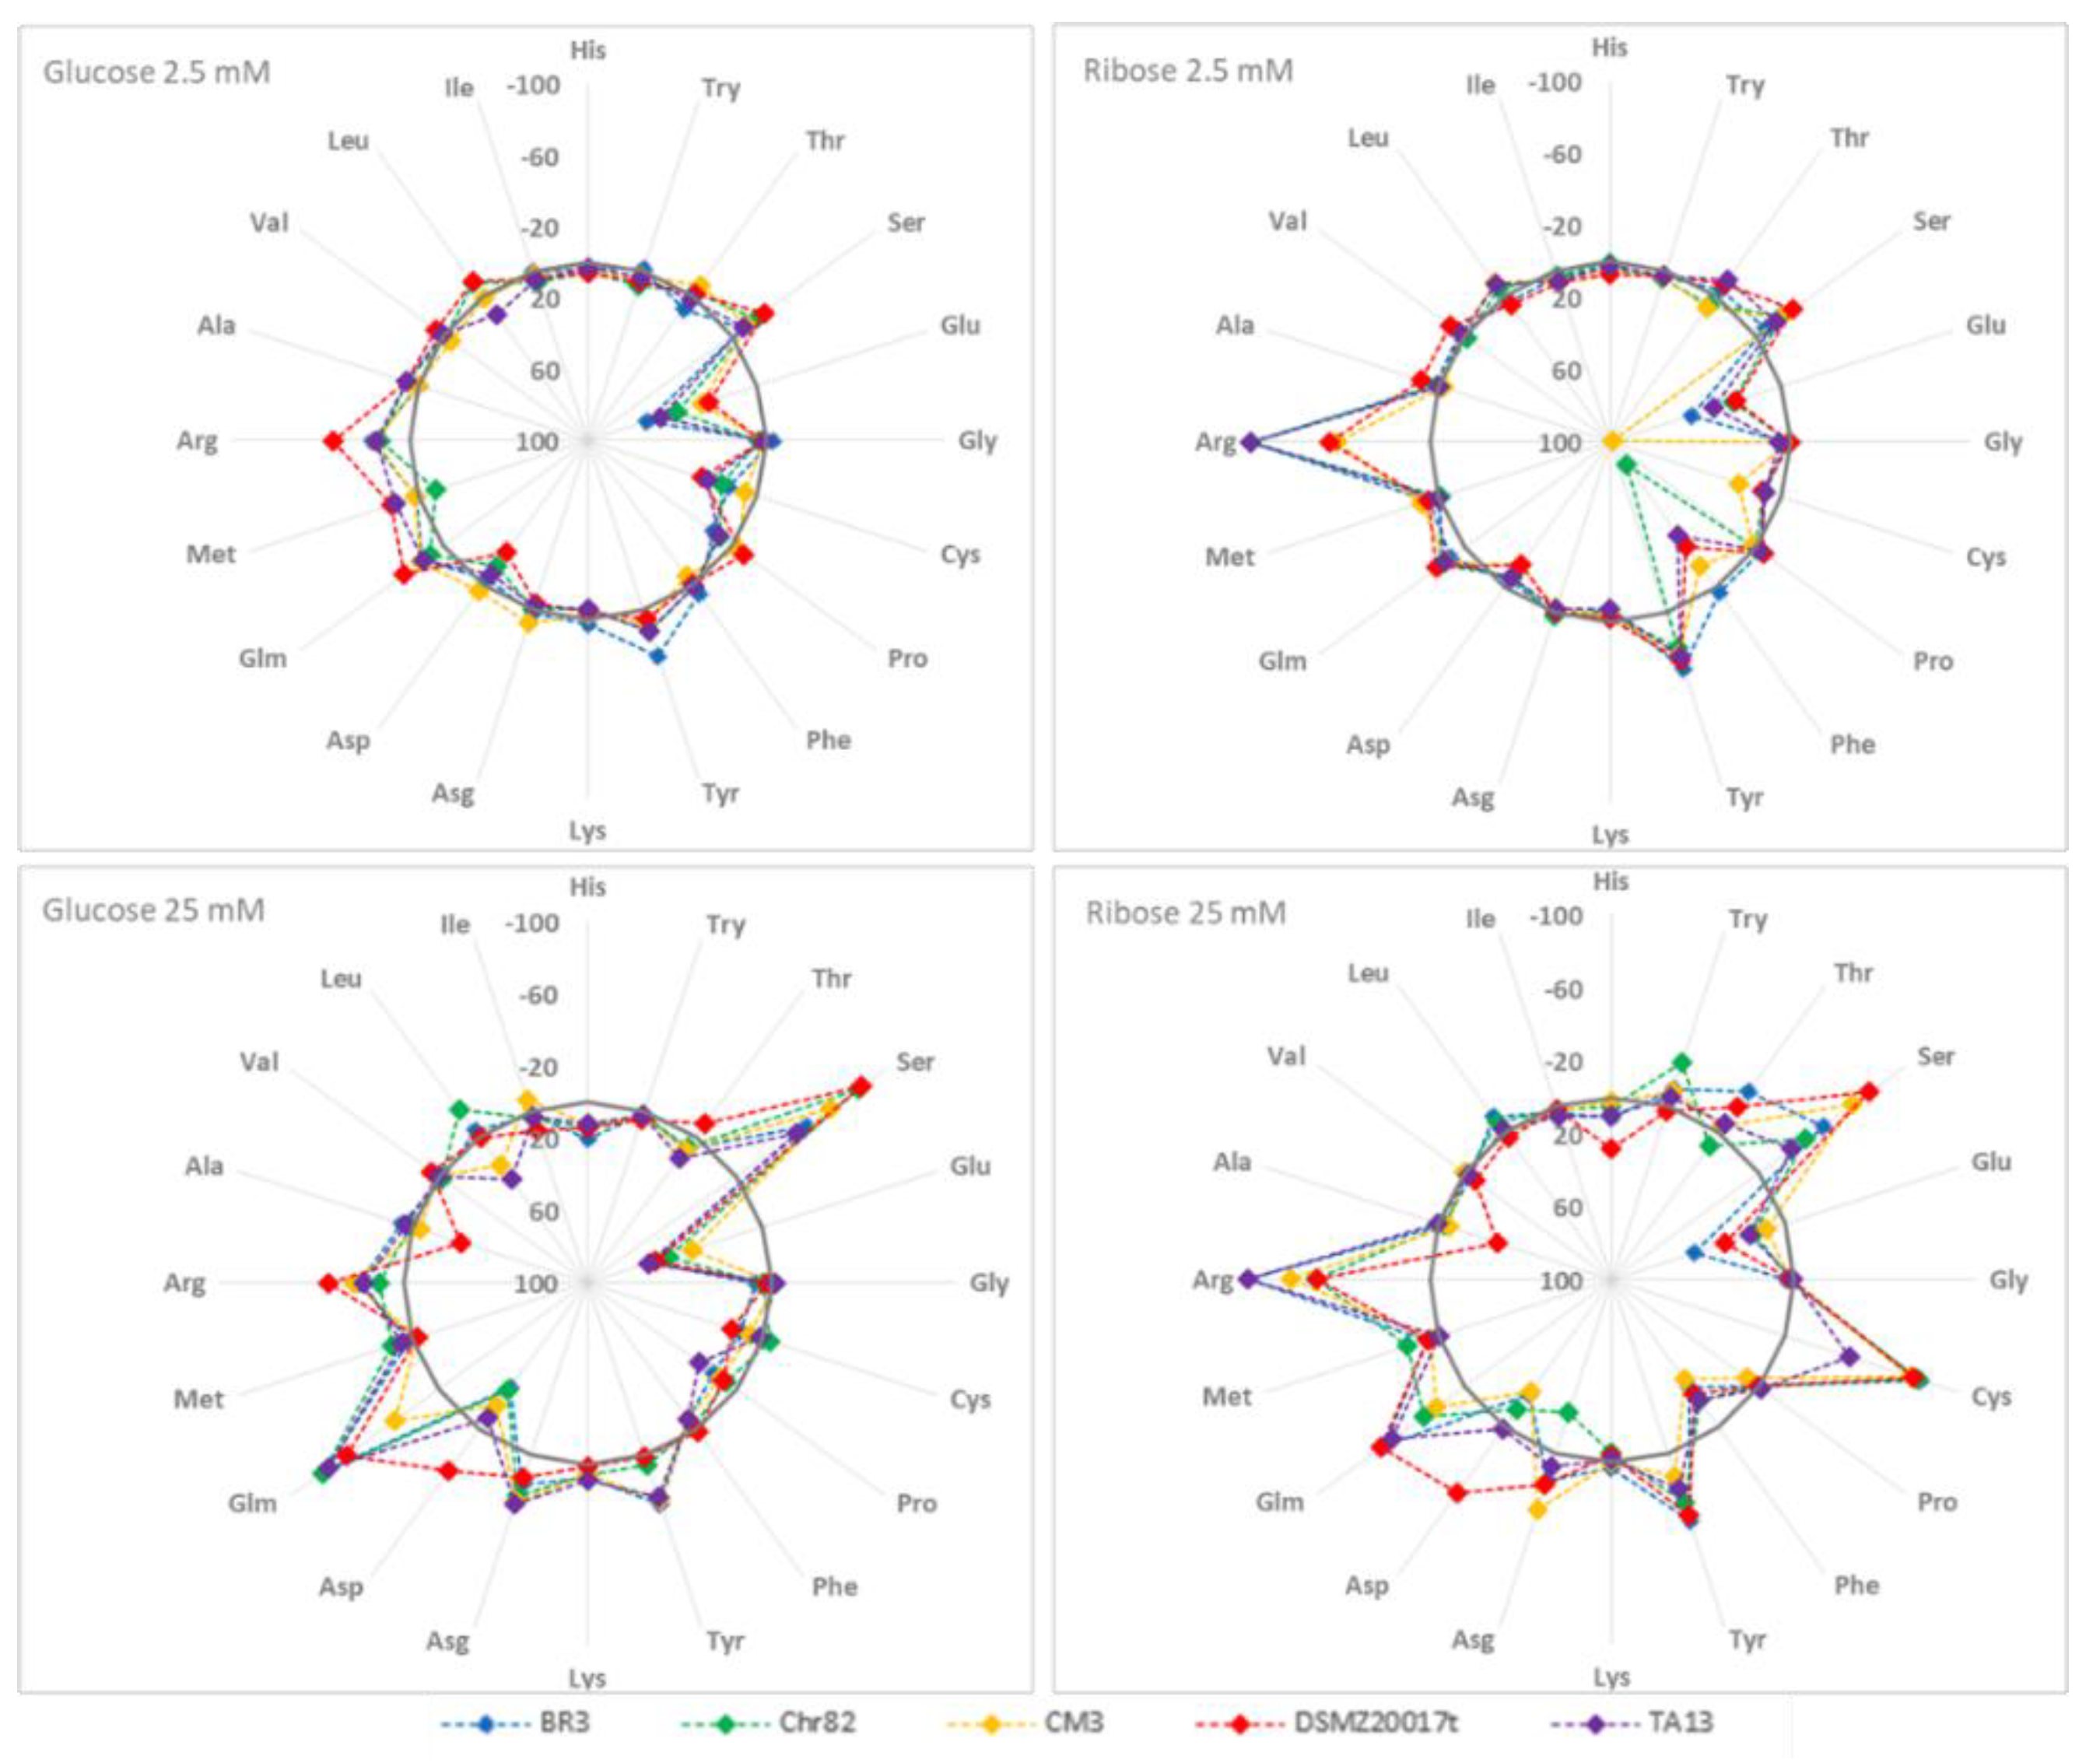
3.2.1. Amino Acid Variation
3.2.2. Accumulation of Other Metabolites
4. Conclusions
Author Contributions
Funding
Conflicts of Interest
References
- Fontana, C.; Fadda, S.; Cocconcelli, P.S.; Vignolo, G. Lactic acid bacteria in meat fermentation. In Lactic Acid Bacteria Microbiological and Functional Aspects, 4th ed.; Lahtinen, S., Ouwehand, A.C., Salminen, S., von Wright, A., Eds.; CRC Press: Boca Raton, FL, USA, 2012; pp. 247–264. [Google Scholar]
- Barbieri, F.; Tabanelli, G.; Montanari, C.; Dall’Osso, N.; Šimat, V.; Smole Možina, S.; Baños, A.; Özogul, F.; Bassi, D.; Fontana, C.; et al. Mediterranean Spontaneously Fermented Sausages: Spotlight on Microbiological and Quality Features to Exploit Their Bacterial Biodiversity. Foods 2021, 10, 2691. [Google Scholar] [CrossRef] [PubMed]
- McLeod, A.; Zagorec, M.; Champomier-Vergès, M.-C.; Naterstad, K.; Axelsson, L. Primary Metabolism in Lactobacillus sakei Food Isolates by Proteomic Analysis. BMC Microbiol. 2010, 10, 120. [Google Scholar] [CrossRef] [PubMed] [Green Version]
- Guilbaud, M.; Zagorec, M.; Chaillou, S.; Champomier-Vergès, M.-C. Intraspecies Diversity of Lactobacillus sakei Response to Oxidative Stress and Variability of Strain Performance in Mixed Strains Challenges. Food Microbiol. 2012, 29, 197–204. [Google Scholar] [CrossRef]
- Oliveira, M.; Ferreira, V.; Magalhães, R.; Teixeira, P. Biocontrol Strategies for Mediterranean-Style Fermented Sausages. Food Res. Int. 2018, 103, 438–449. [Google Scholar] [CrossRef] [PubMed]
- Zagorec, M.; Champomier-Vergès, M.-C. Lactobacillus Sakei: A Starter for Sausage Fermentation, a Protective Culture for Meat Products. Microorganisms 2017, 5, 56. [Google Scholar] [CrossRef]
- Nyquist, O.L.; McLeod, A.; Brede, D.A.; Snipen, L.; Aakra, Å.; Nes, I.F. Comparative Genomics of Lactobacillus sakei with Emphasis on Strains from Meat. Mol. Genet. Genomics 2011, 285, 297–311. [Google Scholar] [CrossRef]
- Champomier-Vergès, M.-C.; Chaillou, S.; Cornet, M.; Zagorec, M. Lactobacillus sakei: Recent Developments and Future Prospects. Res. Microbiol. 2001, 152, 839–848. [Google Scholar] [CrossRef]
- Cocconcelli, P.S.; Fontana, C. Starter cultures for meat fermentation. In Handbook of Meat Processing; Toldrá, F., Ed.; Blackwell Publishing: Ames, IA, USA, 2010; pp. 199–218. [Google Scholar]
- Chaillou, S.; Champomier-Vergès, M.-C.; Cornet, M.; Crutz-Le Coq, A.-M.; Dudez, A.-M.; Martin, V.; Beaufils, S.; Darbon-Rongère, E.; Bossy, R.; Loux, V.; et al. The Complete Genome Sequence of the Meat-Borne Lactic Acid Bacterium Lactobacillus sakei 23K. Nat. Biotechnol. 2005, 23, 1527–1533. [Google Scholar] [CrossRef] [Green Version]
- McLeod, A.; Nyquist, O.L.; Snipen, L.; Naterstad, K.; Axelsson, L. Diversity of Lactobacillus sakei Strains Investigated by Phenotypic and Genotypic Methods. Syst. Appl. Microbiol. 2008, 31, 393–403. [Google Scholar] [CrossRef]
- Chaillou, S.; Daty, M.; Baraige, F.; Dudez, A.-M.; Anglade, P.; Jones, R.; Alpert, C.-A.; Champomier-Vergès, M.-C.; Zagorec, M. Intraspecies Genomic Diversity and Natural Population Structure of the Meat-Borne Lactic Acid Bacterium Lactobacillus sakei. Appl. Environ. Microbiol. 2009, 75, 970–980. [Google Scholar] [CrossRef] [Green Version]
- Rimaux, T.; Vrancken, G.; Vuylsteke, B.; Vuyst, L.D.; Leroy, F. The Pentose Moiety of Adenosine and Inosine Is an Important Energy Source for the Fermented-Meat Starter Culture Lactobacillus sakei CTC 494. Appl. Environ. Microbiol. 2011, 77, 6539–6550. [Google Scholar] [CrossRef] [PubMed] [Green Version]
- McLeod, A.; Mosleth, E.F.; Rud, I.; dos Santos, F.B.; Snipen, L.; Liland, K.H.; Axelsson, L. Effects of Glucose Availability in Lactobacillus sakei; Metabolic Change and Regulation of the Proteome and Transcriptome. PLoS ONE 2017, 12, e0187542. [Google Scholar] [CrossRef] [PubMed]
- Montanari, C.; Barbieri, F.; Magnani, M.; Grazia, L.; Gardini, F.; Tabanelli, G. Phenotypic Diversity of Lactobacillus sakei Strains. Front. Microbiol. 2018, 9, 2003. [Google Scholar] [CrossRef]
- McLeod, A.; Snipen, L.; Naterstad, K.; Axelsson, L. Global Transcriptome Response in Lactobacillus sakei during Growth on Ribose. BMC Microbiol. 2011, 11, 145. [Google Scholar] [CrossRef] [Green Version]
- Barbieri, F.; Laghi, L.; Gardini, F.; Montanari, C.; Tabanelli, G. Metabolism of Lactobacillus sakei Chr82 in the Presence of Different Amounts of Fermentable Sugars. Foods 2020, 9, 720. [Google Scholar] [CrossRef]
- Fadda, S.; Anglade, P.; Baraige, F.; Zagorec, M.; Talon, R.; Vignolo, G.; Champomier-Vergès, M.C. Adaptive Response of Lactobacillus sakei 23K during Growth in the Presence of Meat Extracts: A Proteomic Approach. Int. J. Food Microbiol. 2010, 142, 36–43. [Google Scholar] [CrossRef] [PubMed]
- Rimaux, T.; Rivière, A.; Hebert, E.M.; Mozzi, F.; Weckx, S.; De Vuyst, L.; Leroy, F. A Putative Transport Protein Is Involved in Citrulline Excretion and Re-Uptake during Arginine Deiminase Pathway Activity by Lactobacillus sakei. Res. Microbiol. 2013, 164, 216–225. [Google Scholar] [CrossRef]
- Rimaux, T.; Rivière, A.; Illeghems, K.; Weckx, S.; Vuyst, L.D.; Leroy, F. Expression of the Arginine Deiminase Pathway Genes in Lactobacillus sakei Is Strain Dependent and Is Affected by the Environmental PH. Appl. Environ. Microbiol. 2012, 78, 4874–4883. [Google Scholar] [CrossRef] [Green Version]
- Bruinenberg, P.G.; Roo, G.D.; Limsowtin, G. Purification and Characterization of Cystathionine (Gamma)-Lyase from Lactococcus lactis Subsp. Cremoris SK11: Possible Role in Flavor Compound Formation during Cheese Maturation. Appl. Environ. Microbiol. 1997, 63, 561–566. [Google Scholar] [CrossRef] [Green Version]
- Liu, S.-Q.; Holland, R.; McJarrow, P.; Crow, V.L. Serine Metabolism in Lactobacillus plantarum. Int. J. Food Microbiol. 2003, 89, 265–273. [Google Scholar] [CrossRef]
- Fernández, M.; Zúñiga, M. Amino Acid Catabolic Pathways of Lactic Acid Bacteria. Crit. Rev. Microbiol. 2006, 32, 155–183. [Google Scholar] [CrossRef] [PubMed]
- Latorre-Moratalla, M.L.; Bover-Cid, S.; Bosch-Fusté, J.; Veciana-Nogués, M.T.; Vidal-Carou, M.C. Amino Acid Availability as an Influential Factor on the Biogenic Amine Formation in Dry Fermented Sausages. Food Control 2014, 36, 76–81. [Google Scholar] [CrossRef]
- Gänzle, M.G. Lactic Metabolism Revisited: Metabolism of Lactic Acid Bacteria in Food Fermentations and Food Spoilage. Curr. Opin. Food Sci. 2015, 2, 106–117. [Google Scholar] [CrossRef]
- Lopez de Felipe, F.; Starrenburg, M.J.C.; Hugenholtz, J. The Role of NADH-Oxidation in Acetoin and Diacetyl Production from Glucose in Lactococcus lactis Subsp. Lactis MG1363. FEMS Microbiol. Lett. 1997, 156, 15–19. [Google Scholar] [CrossRef]

| Strains | DM | Cell Counts (log CFU/mL) | pH | ||||
|---|---|---|---|---|---|---|---|
| T0 | Δlog 24 h | Δlog 48 h | T0 | ΔpH 24 h | ΔpH 48 h | ||
| Chr82 | 2.5 G | 6.68 ± 0.05 | 0.71 Aa* ± 0.05 | −0.28 aA ± 0.04 | 6.48 ± 0.01 | −0.75 aA ± 0.04 | −0.71 aA ± 0.02 |
| 2.5 R | 6.80 ± 0.04 | 0.82 aA ± 0.11 | −0.90 aB± 0.08 | 6.47 ± 0.03 | −0.46 aB ± 0.02 | −0.47 aB ± 0.03 | |
| 25 G | 6.68 ± 0.05 | 1.77 aB± 0.23 b | −0.58 aC ± 0.10 | 6.50 ± 0.01 | −2.57 aC ± 0.05 | −2.62 aC ± 0.02 | |
| 25 R | 6.80 ± 0.04 | 0.87 aA ± 0.09 | ND ** | 6.47 ± 0.02 | −2.13 aD ± 0.02 | −2.17 aD ± 0.02 | |
| DSMZ 20017t | 2.5 G | 6.69 ± 0.03 | 0.16 bA ± 0.05 | ND | 6.48 ± 0.01 | −0.75 aA ± 0.03 | −0.77 aA± 0.02 |
| 2.5 R | 6.54 ± 0.04 | 0.63 aB ± 0.07 | −0.60 bA± 0.12 | 6.47 ± 0.03 | −0.66 bB ± 0.05 | −0.66 bB ± 0.02 | |
| 25 G | 6.69 ± 0.03 | 0.65 bB ± 0.09 | 0.09 bB ± 0.03 | 6.50 ± 0.01 | −2.59 aC ± 0.03 | −2.60 aC ± 0.04 | |
| 25 R | 6.54 ± 0.04 | 0.98 aB ± 0.22 | −0.60 aA ± 0.12 | 6.47 ± 0.02 | −2.26 bD ± 0.02 | −2.25 bD ± 0.02 | |
| CM3 | 2.5 G | 6.75 ± 0.03 | 0.83 aA ± 0.08 | −0.27 aA ± 0.03 | 6.48 ± 0.01 | −0.65 bA ± 0.04 | −0.61 bA ± 0.03 |
| 2.5 R | 6.70 ± 0.02 | 1.21 bB ± 0.28 | 0.85 cB ± 0.04 | 6.47 ± 0.03 | −0.41 aB ± 0.03 | −0.44 aB ± 0.02 | |
| 25 G | 6.75 ± 0.03 | 1.48 aB ± 0.31 | 0.87 cB ± 0.08 | 6.50 ± 0.01 | −2.62 aC ± 0.03 | −2.59 aC ± 0.04 | |
| 25 R | 6.70 ± 0.02 | 1.32 bB ± 0.24 | 0.48 bC ± 0.10 | 6.47 ± 0.02 | −2.24 bD ± 0.02 | −2.22 bD ± 0.02 | |
| TA13 | 2.5 G | 6.54 ± 0.06 | 1.33 cA ± 0.11 | 0.13 bA ± 0.03 | 6.48 ± 0.01 | −0.79 aA ± 0.02 | −0.76 aA ± 0.02 |
| 2.5 R | 6.63 ± 0.04 | 1.43 cA ± 0.20 | 0.80 cB ± 0.05 | 6.47 ± 0.03 | −0.48 aB ± 0.02 | −0.46 aB ± 0.03 | |
| 25 G | 6.54 ± 0.06 | 1.03 cB ± 0.09 | 0.26 dC ± 0.02 | 6.50 ± 0.01 | −2.65 aC ± 0.04 | −2.63 aC ± 0.03 | |
| 25 R | 6.63 ± 0.04 | 1.86 cC ± 0.25 | 0.32 bC ± 0.05 | 6.47 ± 0.02 | −2.00 cD ± 0.04 | −2.23 bD ± 0.03 | |
| BR3 | 2.5 G | 6.64 ± 0.03 | 1.38 cA ± 0.13 | 0.13 bA ± 0.02 | 6.48 ± 0.01 | −0.71 aA ± 0.05 | −0.67 aA ± 0.02 |
| 2.5 R | 6.62 ± 0.02 | 1.60 cB ± 0.20 | 1.26 dB ± 0.08 | 6.47 ± 0.03 | −0.38 cB ± 0.02 | −0.38 cB ± 0.03 | |
| 25 G | 6.64 ± 0.03 | 1.22 aA ± 0.11 | −0.34 eC ± 0.03 | 6.50 ± 0.01 | −2.59 aC ± 0.03 | −2.59 aC ± 0.04 | |
| 25 R | 6.62 ± 0.02 | 1.83 cC ± 0.32 | 0.33 bD± 0.02 | 6.47 ± 0.02 | −2.21 bD ± 0.02 | −2.22 bD ± 0.05 | |
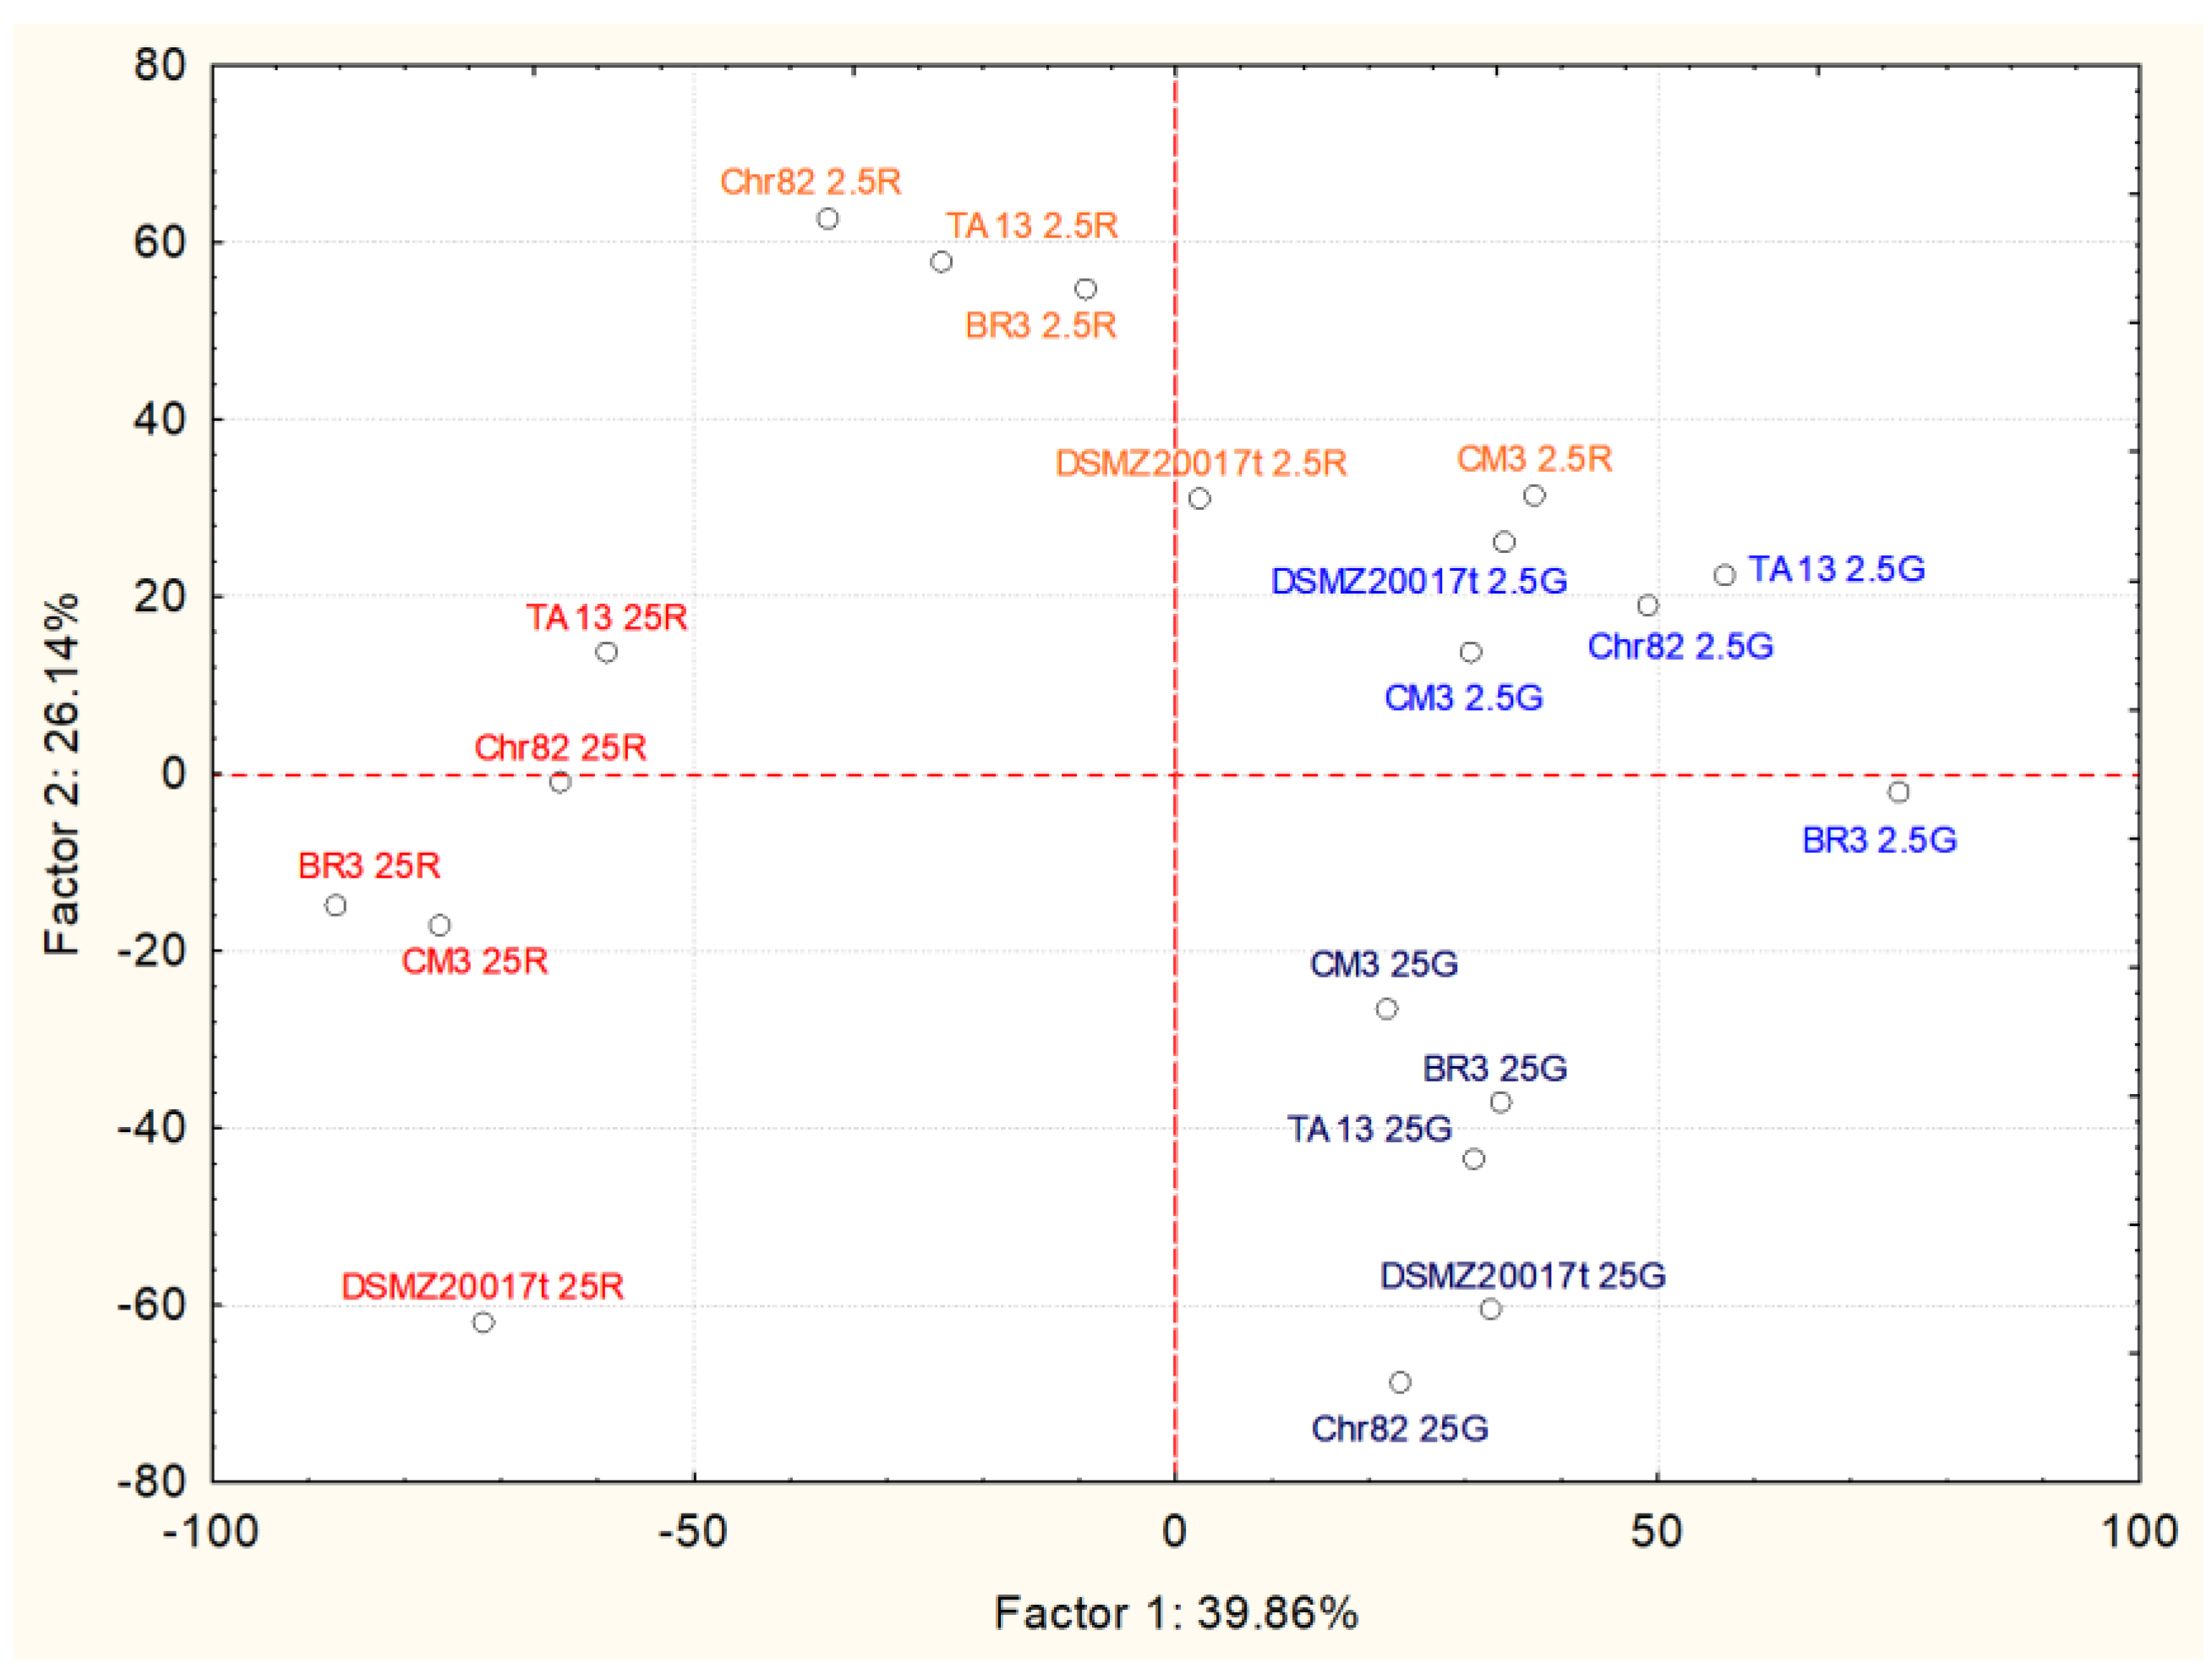
| Amino Acid | Factor 1 | Factor 2 |
|---|---|---|
| Histidine | −0.1238 | −0.7889 |
| Tryptophane | 0.6167 | 0.1225 |
| Threonine | 0.5234 | −0.0476 |
| Serine | 0.2388 | 0.8619 |
| Glutamate | 0.5965 | −0.1495 |
| Glycine | −0.1867 | −0.0860 |
| Cysteine | 0.8737 | 0.3374 |
| Proline | 0.3787 | −0.5586 |
| Phenylalanine | −0.6023 | 0.3606 |
| Tyrosine | 0.4433 | −0.1023 |
| Lysine | −0.1854 | 0.7236 |
| Asparagine | 0.0910 | 0.6615 |
| Aspartate | 0.1229 | 0.2250 |
| Glutamine | 0.0948 | 0.8150 |
| Methionine | 0.1111 | 0.0362 |
| Arginine | 0.8125 | −0.4604 |
| Alanine | −0.3494 | −0.5333 |
| Valine | −0.3874 | −0.3328 |
| Leucine | 0.1979 | −0.1536 |
| Isoleucine | 0.0593 | 0.1395 |
| Strains | DM * | Lactate | Acetate | Ribose | Glucose | Pyruvate | Acetoin | Diacetyl | Ethanol | 1,3 Dihydroxy Acetone | Ornithine | Pyro Glutamate | Formate | Fumarate |
|---|---|---|---|---|---|---|---|---|---|---|---|---|---|---|
| Chr82 | 2.5 G | 4.14 | 1.62 | - ** | - | - | 0.03 | - | 0.03 | - | - | 0.04 | 0.01 | - |
| 2.5 R | 0.79 | 2.20 | - | - | - | 0.34 | 0.17 | 0.04 | - | 0.69 | 0.10 | 0.04 | - | |
| 25 G | 42.33 | 3.74 | - | 2.45 | - | 0.11 | 0.03 | 0.04 | 0.03 | - | 0.02 | - | 0.01 | |
| 25 R | 19.19 | 21.44 | 2.11 | - | 0.06 | 0.21 | 0.30 | 0.04 | 0.02 | 0.28 | 0.04 | 0.04 | 0.02 | |
| DSMZ20017t | 2.5 G | 3.89 | 0.34 | - | - | - | - | - | 0.03 | - | - | 0.04 | - | - |
| 2.5 R | 0.92 | 1.52 | - | - | - | 0.15 | 0.09 | 0.04 | - | - | 0.09 | 0.10 | - | |
| 25 G | 43.35 | 4.83 | - | - | - | - | 0.04 | 0.05 | 0.05 | - | 0.11 | 0.10 | 0.02 | |
| 25 R | 24.79 | 26.16 | 0.31 | - | 0.01 | 0.10 | 0.31 | 0.05 | 0.05 | - | 0.12 | 0.10 | 0.03 | |
| CM3 | 2.5 G | 3.57 | 1.63 | - | - | - | 0.05 | 0.02 | 0.02 | - | - | 0.00 | 0.01 | - |
| 2.5 R | 1.57 | 0.88 | - | - | - | 0.05 | 0.02 | 0.03 | - | 0.05 | 0.01 | 0.01 | - | |
| 25 G | 38.54 | 1.48 | - | 0.44 | - | 0.02 | 0.13 | 0.06 | 0.06 | - | 0.06 | 0.01 | 0.01 | |
| 25 R | 18.93 | 22.39 | 0.30 | - | 0.02 | 0.41 | 0.57 | 0.06 | 0.06 | 0.23 | 0.06 | 0.10 | 0.01 | |
| TA13 | 2.5 G | 3.51 | 1.43 | - | - | - | 0.04 | 0.01 | 0.03 | - | - | 0.09 | 0.01 | - |
| 2.5 R | 1.23 | 3.00 | - | - | - | 0.11 | 0.06 | 0.04 | - | 0.90 | 0.11 | 0.04 | - | |
| 25 G | 46.58 | 3.49 | - | 0.43 | - | - | 0.10 | 0.05 | 0.03 | - | 0.06 | 0.12 | 0.03 | |
| 25 R | 17.40 | 14.75 | 6.90 | - | 0.01 | 0.05 | 0.33 | 0.06 | 0.02 | 0.37 | 0.10 | 0.10 | 0.06 | |
| BR3 | 2.5 G | 3.87 | 0.90 | - | - | - | 0.03 | - | 0.03 | - | - | 0.02 | - | - |
| 2.5 R | 1.39 | 2.90 | - | - | - | 0.11 | 0.07 | 0.04 | - | 0.10 | 0.07 | 0.04 | - | |
| 25 G | 43.27 | 5.67 | - | 0.38 | 0.01 | 0.06 | 0.07 | 0.10 | 0.05 | - | 0.01 | - | 0.02 | |
| 25 R | 19.82 | 17.82 | 0.21 | - | 0.05 | 0.16 | 0.30 | 0.08 | 0.08 | 0.43 | 0.03 | - | 0.02 |
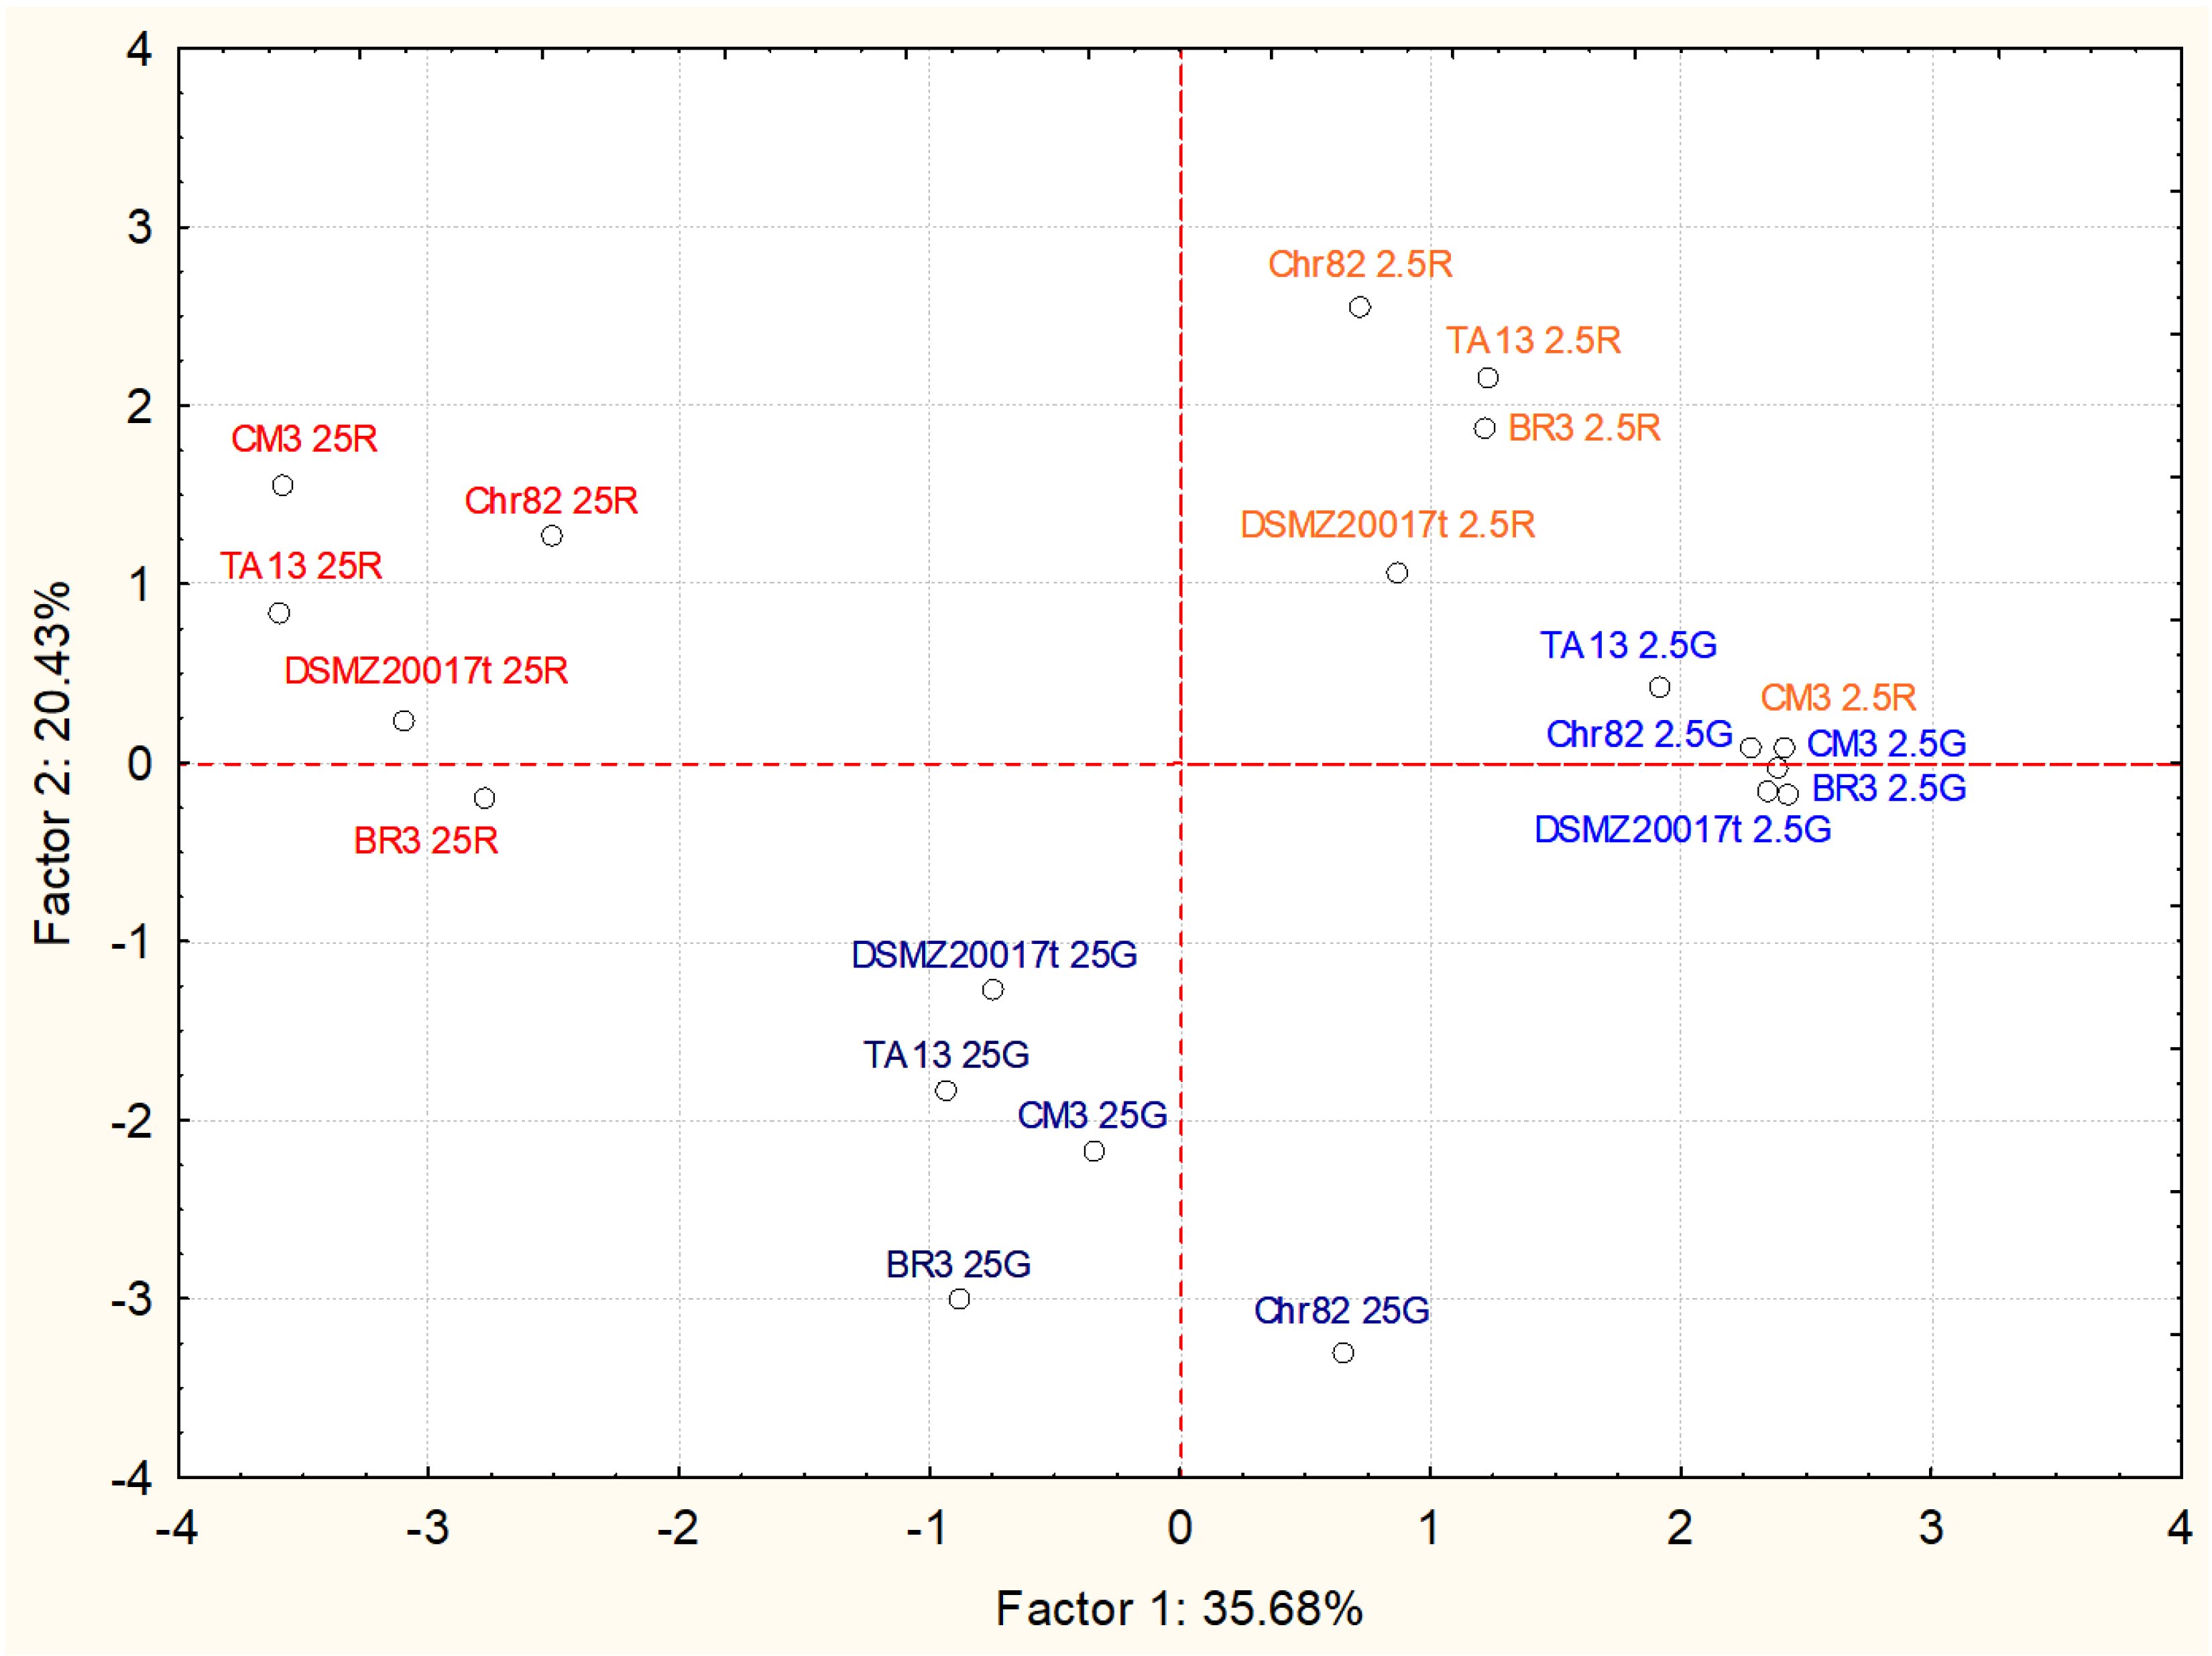
| Compound | Factor 1 | Factor 2 |
|---|---|---|
| Fumarate | −0.7609 | −0.2549 |
| 1,3 dihydroxy acetone | −0.7428 | −0.4562 |
| Lactate | −0.5128 | −0.7815 |
| Ribose | −0.5056 | 0.1840 |
| Glucose | 0.0302 | −0.6402 |
| Pyruvate | −0.6218 | 0.1667 |
| Acetoin | −0.4050 | 0.5419 |
| Ethanol | −0.6923 | −0.4185 |
| Diacetyl | −0.8770 | 0.3222 |
| Ornithine | −0.0828 | 0.6543 |
| Acetate | −0.8773 | 0.1989 |
| Pyroglutamate | −0.3227 | 0.4526 |
| Formate | −0.5544 | 0.2356 |
Publisher’s Note: MDPI stays neutral with regard to jurisdictional claims in published maps and institutional affiliations. |
© 2022 by the authors. Licensee MDPI, Basel, Switzerland. This article is an open access article distributed under the terms and conditions of the Creative Commons Attribution (CC BY) license (https://creativecommons.org/licenses/by/4.0/).
Share and Cite
Barbieri, F.; Laghi, L.; Montanari, C.; Lan, Q.; Levante, A.; Gardini, F.; Tabanelli, G. Insights into the Metabolomic Diversity of Latilactobacillus sakei. Foods 2022, 11, 477. https://doi.org/10.3390/foods11030477
Barbieri F, Laghi L, Montanari C, Lan Q, Levante A, Gardini F, Tabanelli G. Insights into the Metabolomic Diversity of Latilactobacillus sakei. Foods. 2022; 11(3):477. https://doi.org/10.3390/foods11030477
Chicago/Turabian StyleBarbieri, Federica, Luca Laghi, Chiara Montanari, Qiuyu Lan, Alessia Levante, Fausto Gardini, and Giulia Tabanelli. 2022. "Insights into the Metabolomic Diversity of Latilactobacillus sakei" Foods 11, no. 3: 477. https://doi.org/10.3390/foods11030477
APA StyleBarbieri, F., Laghi, L., Montanari, C., Lan, Q., Levante, A., Gardini, F., & Tabanelli, G. (2022). Insights into the Metabolomic Diversity of Latilactobacillus sakei. Foods, 11(3), 477. https://doi.org/10.3390/foods11030477