Article

Emotion and Wellness Profiles of Herbal Drinks Measured Using Different Questionnaire Designs

by
Pannapa Hanmontree
1,
Witoon Prinyawiwatkul
2 and
Amporn Sae-Eaw
1,*
1
Department of Food Technology, Faculty of Technology, Khon Kaen University, Khon Kaen 40002, Thailand
2
School of Nutrition and Food Sciences, Louisiana State University, Agricultural Center, Baton Rouge, LA 70803, USA
*
Author to whom correspondence should be addressed.
Foods 2022, 11(3), 348; https://doi.org/10.3390/foods11030348
Submission received: 10 December 2021 / Revised: 21 January 2022 / Accepted: 22 January 2022 / Published: 26 January 2022

Abstract

:
The emotion and wellness profiles of herbal drinks were assessed using six different questionnaire designs. The questionnaire designs were constructed from two formats of questionnaire items, including words and sentences, and three types of measuring scales, including a rating scale (5-point intensity; 1 = ‘not at all’, 5 = ‘extremely’), a checklist scale (check-all-that-apply, CATA), and a combination of CATA and rating scales (rate-all-that-apply, RATA; 5-point intensity; 1 = ‘slightly’, 5 = ‘extremely’). The 39 emotional terms of the EsSense Profile® and the 45 wellness terms of the WellSense ProfileTM were translated into Thai, then screened for relevance to herbal drinks. The seven positive emotional terms (active, energetic, good, happy, polite, satisfied, and warm), three negative emotional terms (bored, disgusted, and worried), and five wellness terms (comforted, healthy, invigorated, relaxed, and refreshed) were selected and included in the questionnaire. A central location test was performed to determine the emotion and wellness profiles of five herbal drinks: roselle (Hibiscus sabdariffa) drink, chrysanthemum (Chrysanthemum morifolium Ramat) drink, ginger (Zingiber officinale) drink, Jubliang (a mixture of eight herbs) drink, and Krachai Dam (Kaempferia parviflora) drink. For herbal drinks, measuring emotion and wellness with a questionnaire using full sentences did not show increased benefit over questionnaires using words alone. All three measuring methods—a rating scale, CATA, and RATA—produced similar emotion and wellness profiles. However, each method has different advantages and limitations, which researchers should carefully consider.

1. Introduction

In the last decade, emotional responses have been more frequently used in consumer research and food-product development because the use of liking data alone may not effectively predict product success in the market. Collecting emotional responses that offer insight into consumer experience can provide additional useful information for product development [1]. Several findings have noted that emotions influence consumers’ eating behavior and decision-making processes [2,3,4]. Understanding the emotions elicited by their products could be beneficial for food industries when considering packaging design, branding, and advertising [2].
Several methods for measuring emotions associated with foods have been developed and reported, such as EsSense Profile® [5], consumer-defined check-all-that-apply (CD-CATA) [6], EmoSemio [7], and EmoSensory® Wheel [8]. Furthermore, the health and wellness perception of food products has become an important aspect of consumers’ purchasing decisions. The WellSense ProfileTM, a questionnaire measuring wellness associated with foods from the consumer perspective, was recently developed [9] and was adapted in recent research to measure organic food-related wellbeing [10] in relation to the Krachai Dam drink [11]. Accordingly, the emotion and wellness responses of consumers should be considered in food-product development. Although the EsSense profile® and the WellSense ProfileTM methods have been widely used, the application of these methods in in countries with different cultures and languages should be appropriately performed. For this reason, cross-cultural studies of emotion elicited by food have gained attention [12,13,14]. However, research investigating the impact of questionnaire design and measurement scales on emotion and wellness profiles is scarce. In Thailand, methods for measuring emotional response elicited by food products have not been widely applied, so more research is required.
Herbs have been recognized as having health benefits [15]. Herbs and their extracts contain different bioactive compounds that can provide therapeutic effects, such as reducing cardiovascular problems, enhancing immune functions, and preventing cancer [16]. In Thailand, herbs have been used as medicine and food for a long time. Herbal drinks are becoming more popular, especially among health-conscious consumers, since these beverages are prepared with natural ingredients. The results obtained in a study by Jabeur et al. [17] highlighted the potential of Hibiscus sabdariffa L. (Hs), also known as roselle, as a source of bioactive and natural coloring ingredients destined for food and pharmaceutical industries. Roselle extracts showed antibacterial, antioxidant, anticholesterol, antidiabetic and antihypertensive effects, among others [18]. In recent years, the flowers of medicinal chrysanthemum (Chrysanthemum morifolium Ramat) were shown to act as common materials in functional and healthy tea or beverages due to their unique flavor, color, and health benefits, such as detoxification, improving liver function, decreasing inflammation, and improving eyesight [19]. Ginger (Zingiber officinale) rhizomes are commonly used in foods and beverages for their characteristic pungency and piquant flavor and have exhibited various pharmacological effects, such as antioxidant, anti-inflammatory, gastroprotective, antibacterial, and antidiabetic properties [20]. Jubliang is a mixture of eight herbs, namely Bombax ceiba L., Chrysanthemum morifolium, Imperata cylindrical (L.) P. Beauv., Lophatherum gracile Brogn., Nelumbo nucifera Gaertn, Oroxylum indicum L., Pragmites communis Trin, and Prunella vulgaris. Jubliang extract is a good source of water-soluble antioxidants, phenolic compounds, and antimutagens [21]. Kaempferia parviflora, or Krachai Dam (KD), is a Thai herb that belongs to the Zingiberaceae family. Its rhizomes have been reputed to have beneficial medicinal effects, owing to its major methoxyflavones, including anticancer, cardioprotective, neuroprotective, antioxidative, antimicrobial, and transdermal-permeable activity [22].
There are many kinds of commercial herbal drinks in Thailand, some of which are very popular; others are not popular, even though they have health-promotion benefits. There are many factors that have influence consumer perception and buying decisions. An important factor is the emotion and wellness responses of consumers. Additionally, different questionnaire designs may influence the results of emotion and wellness assessments. We hypothesized that using a questionnaire designed with full sentences and a rating-scale measurement method would have a greater influence on emotion and wellness profiles than that with words and a check-all-that-apply (CATA) measurement method. Therefore, in this research, we aimed to examine and compare the emotion and wellness responses associated with herbal drinks using questionnaires constructed according to two formats—words vs. full sentences—and three types of measurement methods, including a rating scale, a checklist scale (CATA), and a combination of the two scales (i.e., RATA).

2. Materials and Methods

2.1. Herbal Drink Samples

Five herbal drink samples commercially available in Thailand were used, including roselle drink, chrysanthemum drink, ginger drink, Jubliang drink, and Krachai Dam drink (Table 1). Roselle drink, chrysanthemum drink, Jubliang drink, and Krachai Dam drink were ready-to-drink products. After purchased, they were kept at 4 °C until used for consumer testing. Samples were presented to the participants in random 3-digit labelled cups at approximately 10 °C, except ginger drink, which was served at approximately 70 °C. The ginger drink was prepared immediately prior to sampling by adding 18 g of instant ginger powder to 150 mL of hot water and kept in an insulated bottle.

2.2. Screening of Emotion and Wellness Terms for Relevance to Herbal Drinks

The research protocol concerned with the use of human subjects was approved by the Khon Kaen University Ethics Committee for Human Research (KKUEC), Thailand (approval code, HE611230). Emotion and wellness terms were selected from the EsSence Profile® [5] and WellSense ProfileTM tests [9]. All terms were translated into Thai by a group of experienced linguists (n = 3) and back-translated into English by another experienced group (n = 3) for meaning validation (Table 2). Thai emotion and wellness terms relevant to five herbal drinks (Roselle drink, Chrysanthemum drink, Ginger drink, Jubliang drink, and Krachai Dam drink) were screened using online CATA questionnaires. Thai consumers (n = 1678; 43.1% males and 56.9% females) who regularly consume herbal drinks participated voluntarily. Participants were asked to select the emotion and wellness terms that they associate with when thinking about herbal drinks that they had consumed. Terms with at least 20% frequency of use were recommended as a criterion [2,5,23,24]. However, terms with least 15% frequency of use were adopted for development of the EmoSensory® Wheel, while negative emotion terms with a lower frequency of use (≤10%) were used to obtain a balance of positive and negative terms [8]. For our current research, terms with at least 18% frequency of use were used. First, the selected terms from all of five herbal drinks were collected. Then, the duplicated terms were removed before inclusion in the questionnaire. Based on the results, seven positive emotion terms (active, energetic, good, happy, polite, satisfied, and warm) and five wellness terms (comforted, healthy, invigorated, relaxed, and refreshed) were selected. To control the balance on both of positive and negative terms, three negative emotion terms (bored, disgusted, and worried) were added to the questionnaire (Table 3). Therefore, a total of 15 emotion and wellness terms were included in the questionnaire to measure the consumer responses elicited by the five herbal drinks.

2.3. Testing the Test Designs for Measurement of Emotion and Wellness Responses Elicited by Herbal Drinks

The proposed test designs for measurement of emotion and wellness responses were composed of 2 factors. Factor 1 was composed of two formats of questionnaire items, including words and full sentences (see the attached questionnaire file). The sentence format was used to reduce ambiguity within the questionnaire because including a context increases understanding of the specified emotion and wellness state. The full sentences were created using selected emotion and wellness terms, in consultation with a focus group of consumers (n = 29, average age = 45.76 ± 7.83 years old) (adapted from [7]). Factor 2 was composed of three types of measuring scales, including a rating scale (5-point intensity; 1 = ‘not at all’, 5 = ‘extremely’), a checklist scale (CATA), and a combination (rate-all-that-apply, RATA; 5-point intensity; 1 = ‘slightly’, 5 = ‘extremely’). Thus, the questionnaire designs comprised six test forms (Table 4).
The impact of the test designs (Test 1 to Test 6) was evaluated between 15 and 30 June 2018. Consumers were recruited by an accidental sampling method. According to Meilgaard et al. [25], 50–300 responses should be collected per location for the central location test (CLT). In this study, about 200 Thai consumers were recruited for each test design (a total of 1252; 49.3% males and 50.7% females) from 4 regions of Thailand (Table 4), with almost equal proportions of four age groups participating in the CLT. To be selected, consumers were required to be familiar with and frequently consumers of herbal drinks. Each consumer was randomly assigned to one of the six test designs. Five herbal drinks were coded with random 3-digit numbers. Each herbal drink sample (20 mL) was poured into a clear plastic cup and served under the corresponding condition/temperature described in Table 1. All five samples were served in a balanced order. All consumers received five herbal drink samples for tasting, along with water to cleanse their palates between samples. First, they were asked to taste and rate their overall liking of each sample using a 9-point hedonic scale (1 = extremely dislike, 9 = extremely like). Secondly, they indicated their emotion and wellness responses to each sample using the scales, as described above. Consumers were seated separately and were instructed not to interact with other participants.

2.4. Statistical Analysis

Analysis of variance (ANOVA) and Duncan’s multiple range test (DMRT) were performed on the overall liking scores to determine significant overall and pairwise differences among the five herbal drinks and six test designs.
For rating scores, the mean score of each emotion and wellness term was calculated from consumer responses. For CATA data, a frequency count was calculated by counting the number of consumers who chose the terms for each sample. RATA data were analyzed using one of two approaches [26]: frequency of selection (RATA frequency) or weighted frequency of selection (RATA score). RATA frequency was counted from the number of consumers who chose the terms for each sample. RATA scores were calculated by summing up the scores that the consumers rated for each selected term (0–5 scoring; 0 = ‘not selected’, 1 = ‘slightly’, and 5 = ‘extremely’) [27] and dividing by the number of participating consumers.
Both rating and RATA scores (when treated as a continuous outcome) were analyzed using ANOVA to determine the emotion and wellness terms with significant differences among the five herbal drinks. Next, the significant terms were analyzed using DMRT for multiple comparisons [28]. Principal component analysis (PCA) was performed to identify the emotion and wellness terms that contributed to overall differences among the herbal drinks and to classify the products based on emotion and wellness responses. Overall product differences were determined using multivariate analysis of variance (MANOVA) based on emotion and wellness responses, followed by discriminant analysis (DA) to identify the important terms of group discrimination.
CATA and RATA frequency counts were analyzed following the recommendation of Meyners et al. (2016) [27]. Cochran’s Q test was carried out to determine the differences among herbal drink samples for each emotion or wellness response, and the sign test was used for pairwise comparison. Correspondence analysis (CA) based on Chi-square distances was used to identify the emotion and wellness terms that correlated to overall differences among the sampled herbal drinks. DA was performed to identify the important terms of group discrimination.
All statistical analyses were performed at 5% significance level using the SPSS 19 software (SPSS Inc., Chicago, IL, USA), except DA, which was carried out using XLSTAT® Basic version 2019 software (Addinsoft; New York, NY, USA).

3. Results and Discussion

3.1. Overall Liking of Herbal Drink Samples

Regarding the overall liking scores of the five herbal drinks from six test designs, the data were analyzed by ANOVA and DMRT (Table 5). In each test, significant differences in overall liking were observed (p < 0.05) among the five herbal drinks, indicating that consumers liked the five herbal drinks to varying degrees. In general, roselle and chrysanthemum drinks were similarly well-liked (7.11–7.49) and were found to be more acceptable than the three other herbal drinks (6.48–6.87 for ginger and Jubliang; 6.62–7.06 for Krachai Dam). For overall liking evaluation, different groups of consumers participated in each test design. Homogeneity of hedonic perception should be determined before comparing the different questionnaire designs. When comparing the overall liking score of each herbal drink among different consumers from the six test-design groups, no significant differences were found. This implies that the consumer population in this study was homogenous in terms of hedonic perception of the test samples. Thus, the subsequent emotion and wellness results of the six test designs could be compared since overall liking and emotion terms may be correlated, depending on product, product category, demographics, and psychographics [5].

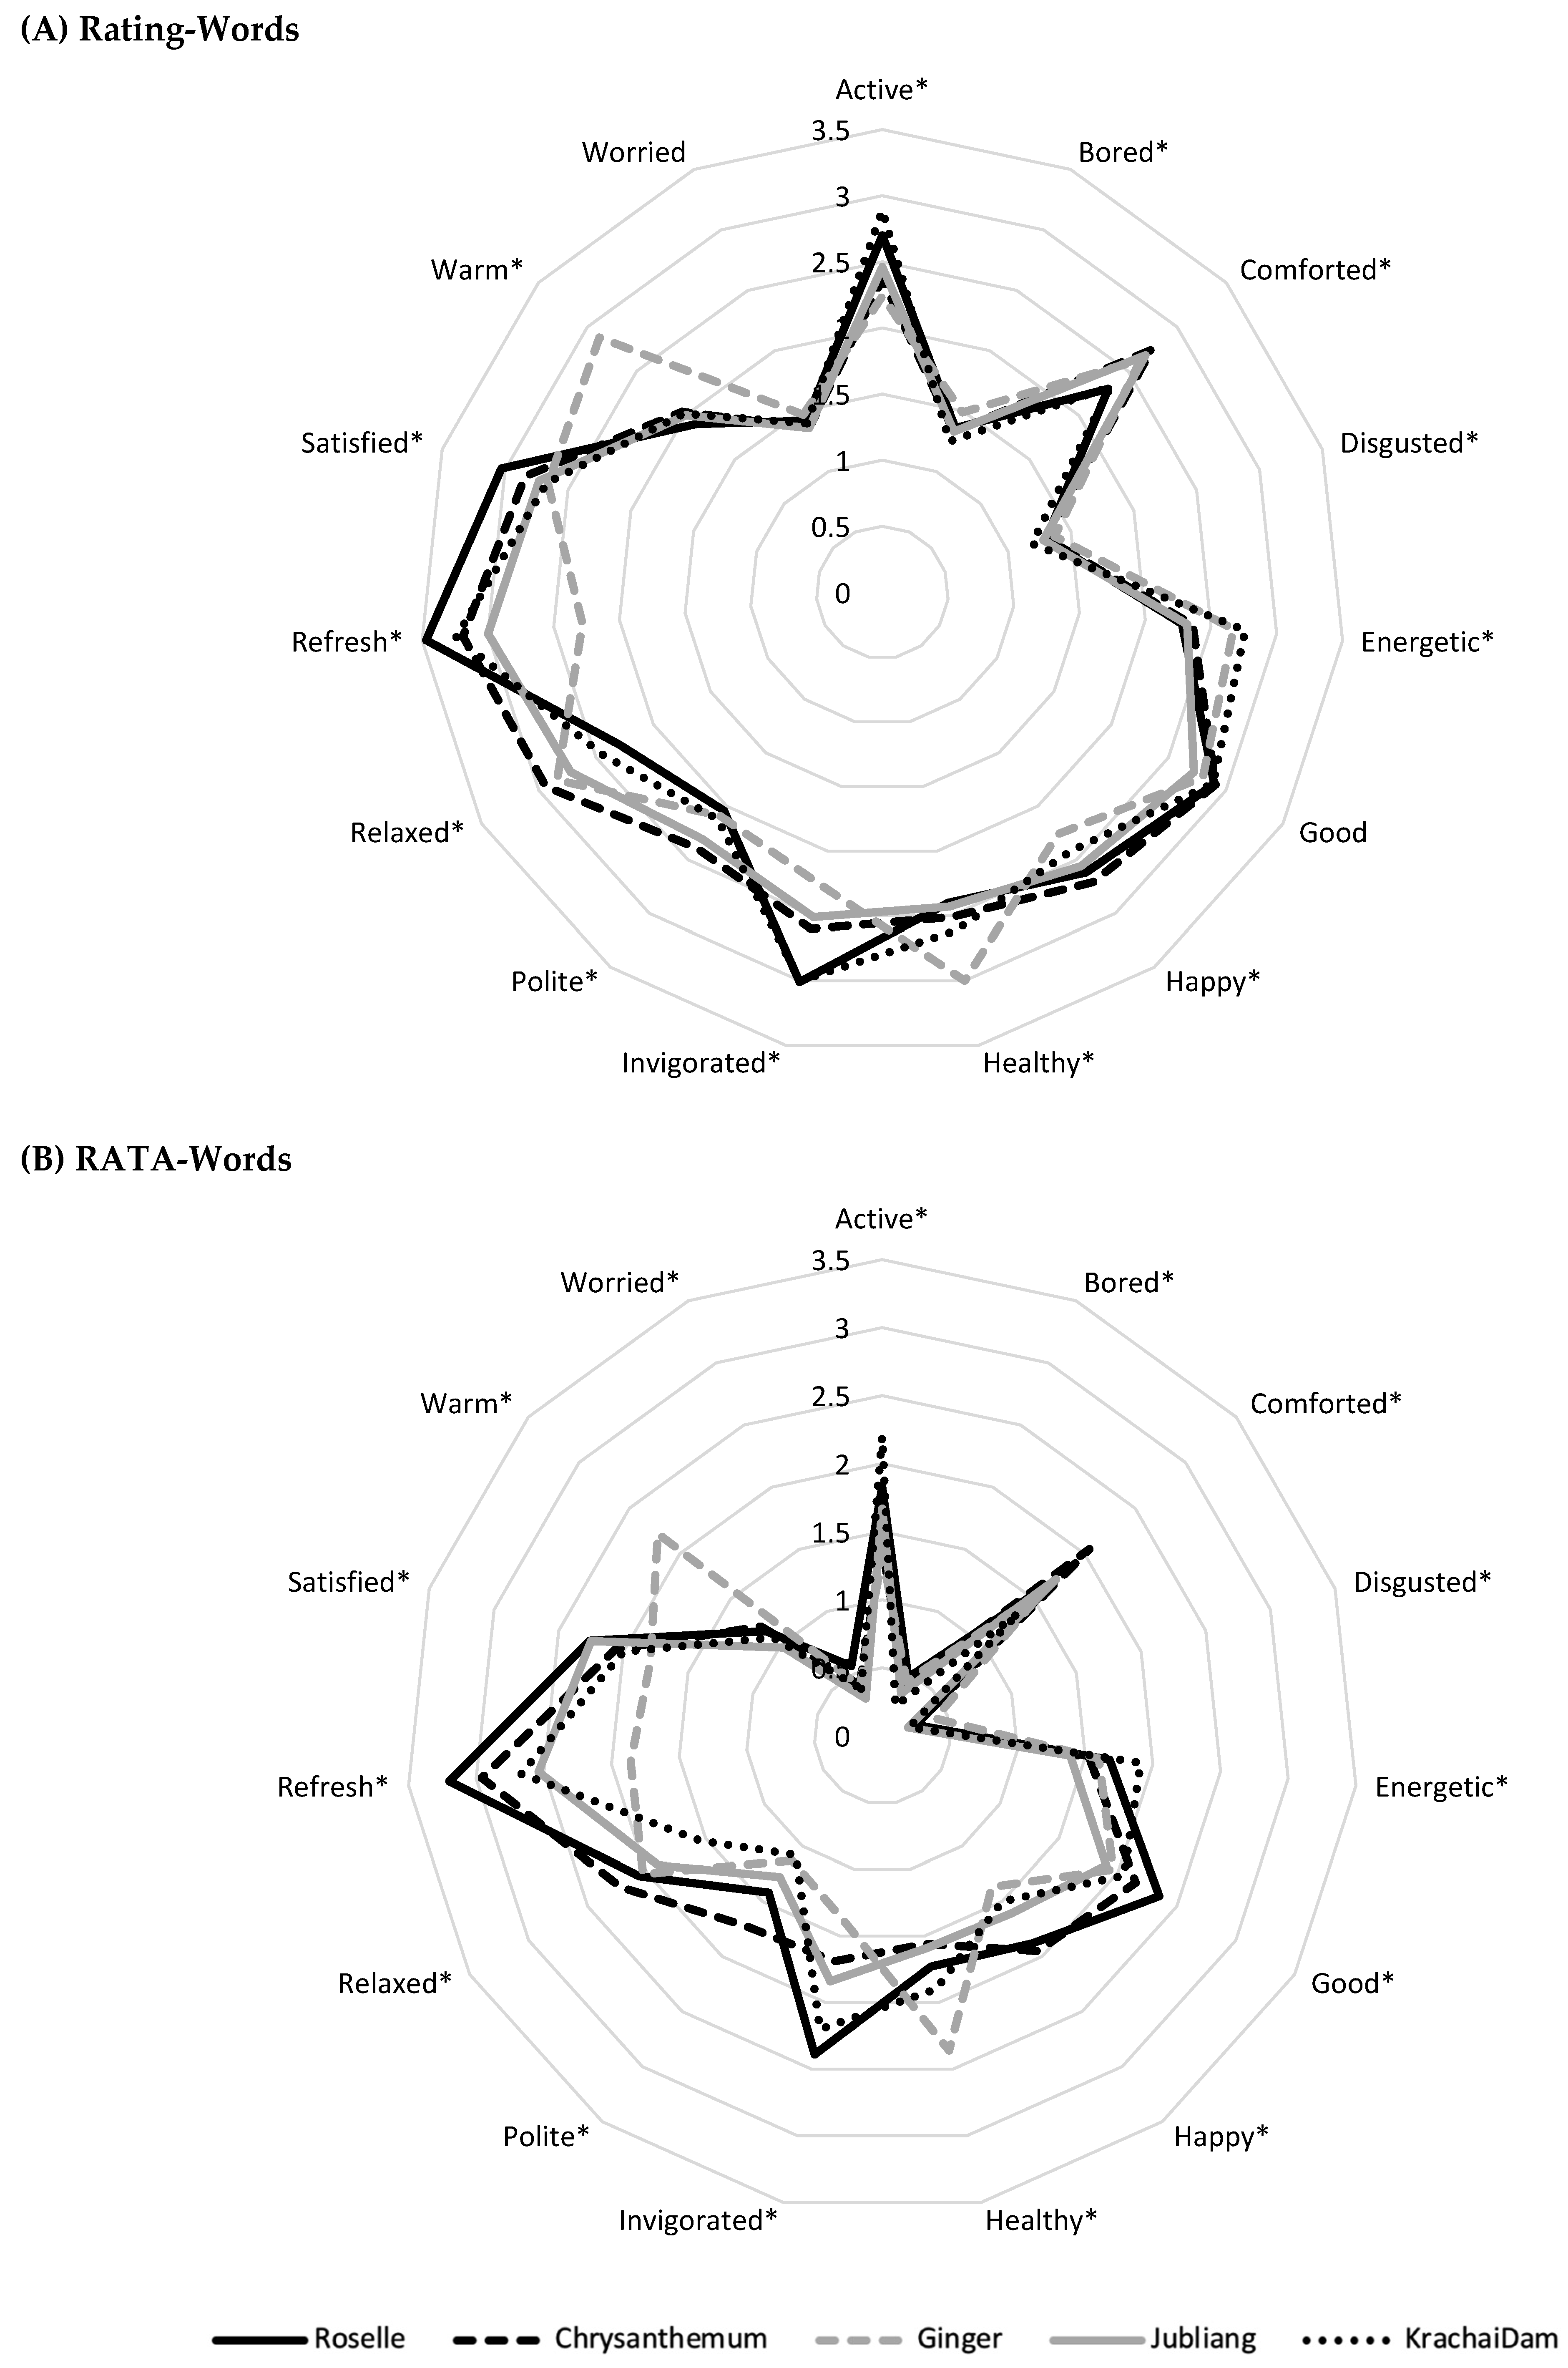
3.2. Emotion and Wellness Profiles of Herbal Drinks from Different Test Designs

As seen from Table 6 and Table 7, the type of herbal drink significantly affected most emotion (except “good”, “happy”, “bored”, “worried”, and “disgusted” in some cases) and all wellness responses of consumers. Generally, negative emotion responses were rated lower than positive emotion and wellness responses. These findings confirm and extend the positive asymmetry of emotions. According to the theory of positive asymmetry, previous research findings reported that consumers experience primarily positive emotions in response to food and food names [29,30,31]. In the case of beverages, Calve-Porral et al. [32] found positive asymmetry of emotions in beverage consumption, regardless of the type of beverage. Thus, our findings are in agreement with previous studies.
When comparing the two formats of questionnaire items—words vs. full sentences—some minor differences, in terms of the number of significant emotion and wellness terms, were observed, depending on the measurement scale used. The number of significant terms for test 1 (rating-words) vs. test 2 (rating-sentences) was 13 vs. 14 for test 5 (RATA/scores-words) vs. test 6 (RATA/scores-sentences) was 15 vs. 14, for test 3 (CATA-words) vs. test 4 (CATA-sentences) was 12 vs. 13, and for test 5 (RATA/frequency-words) vs. test 6 (RATA/frequency-sentences) was 15 vs. 12. A greater difference was observed between words and sentences in the RATA frequency test format. However, overall, sentence format may not reduce ambiguity over the word-only format in the questionnaire. For terms unfamiliar to consumers (such as “polite”), including a context may help to increase understanding of the specified emotion or wellness state. However, the emotion and wellness terms used in the questionnaire in this study were pre-screened by consumers who regularly consume the herbal drink products. Consumers selected the terms that they were familiar with; therefore, a full sentence in the questionnaire may not provide much more clarity under the conditions of the current study.
The results from three types of measurement methods, including a rating scale, CATA, and RATA, were compared. The RATA data consisted of two types: RATA frequency and RATA score. Hence, the RATA scores were compared with rating scores, and RATA frequencies were compared with CATA frequencies.
To compare rating scores (test 1) and RATA scores (test 5) from the word-format questionnaire, mean scores of emotion and wellness responses were plotted on a spider web, as shown in Figure 1. The overall profiles were visually similar, but the ratings from the rating scores were higher than those from the RATA scores. The rating-words profile (test 1) in Figure 1A reveals that significant product differences were observed for 13 terms (p < 0.05), except for “worried” (1.36–1.47 scores) and “good” (2.72–2.91 scores) terms (Table 6). Interestingly, the “refreshed” term showed higher scores of four herbal drinks (roselle, Jubliang, chrysanthemum, and Krachai Dam drink) (3.47, 3.00, 3.19, and 3.24, respectively) than other emotion and wellness terms. Meanwhile, the score of the “warm” term (2.88) was higher for ginger drink than other terms, with a maximum mean-difference value of 0.98. King et al. [29] suggested that a mean emotional difference of ≥ 0.2 units (on a 5-point scale) may be of practical value. For the rata-words profile (test 5) in Figure 1B, all 15 terms had significant differences among the five products. Therefore, using the RATA scale with words (Test 5) showed better discrimination ability than the rating scale with words (15 vs. 13) in terms of improving the number of significantly different terms.
To compare the CATA frequency (test 3) and RATA frequency (test 5) from the word-format questionnaire, emotion and wellness responses, in terms of percentage of the frequency count, were plotted on a line chart, as shown in Figure 2. The two profiles were visually similar, but the frequency counts of the RATA-Words format was higher than those of the CATA-Words format. For CATA-Words in Figure 2A, the “refreshed” term was popular among consumers for roselle (74.64%), Jubliang (65.55%), chrysanthemum (68.42%), and Krachai Dam drink (54.55%), while “good”, “happy”, and “worried” terms were not significantly different among the five herbal drinks (p > 0.05; Table 7). For RATA-Words in Figure 2B, all 15 terms were significantly different among the five products. Thus, the RATA-Words show a slight improvement in the number of significantly different terms. Therefore, using the RATA scale with words (Test 5) showed slightly better discrimination ability than the CATA scale with words (15 vs. 12) in terms of increasing the number of significant terms.
Soares et al. [33] mentioned that the word-association (WA) method is used in consumer and marketing research to provide insights on perceptions and attitudes to achieve a deeper understanding of what consumers really think and feel about a product. Many researchers have studied the benefit of herbs, such as roselle, ginger and chrysanthemum, and found that they are a good source of vitamins and minerals and rich in phenolic compounds known to have free-radical-scavenging abilities [34,35,36,37,38]. In this study, consumers selected the “active” and “energetic” emotion terms, as well as the “invigorated”, “refreshed”, and “relaxed” wellness terms for these five herbal drink products. It is possible that some participants realized the important benefits of these herbal drink; thus, they chose those emotion and wellness terms based on their prior knowledge and consumption experiences. It is known that characteristics of an individual participant may affect the emotion profile of foods [2]; these characteristics include personal preference, past experience, frequency of consumption [30], and culture [39].

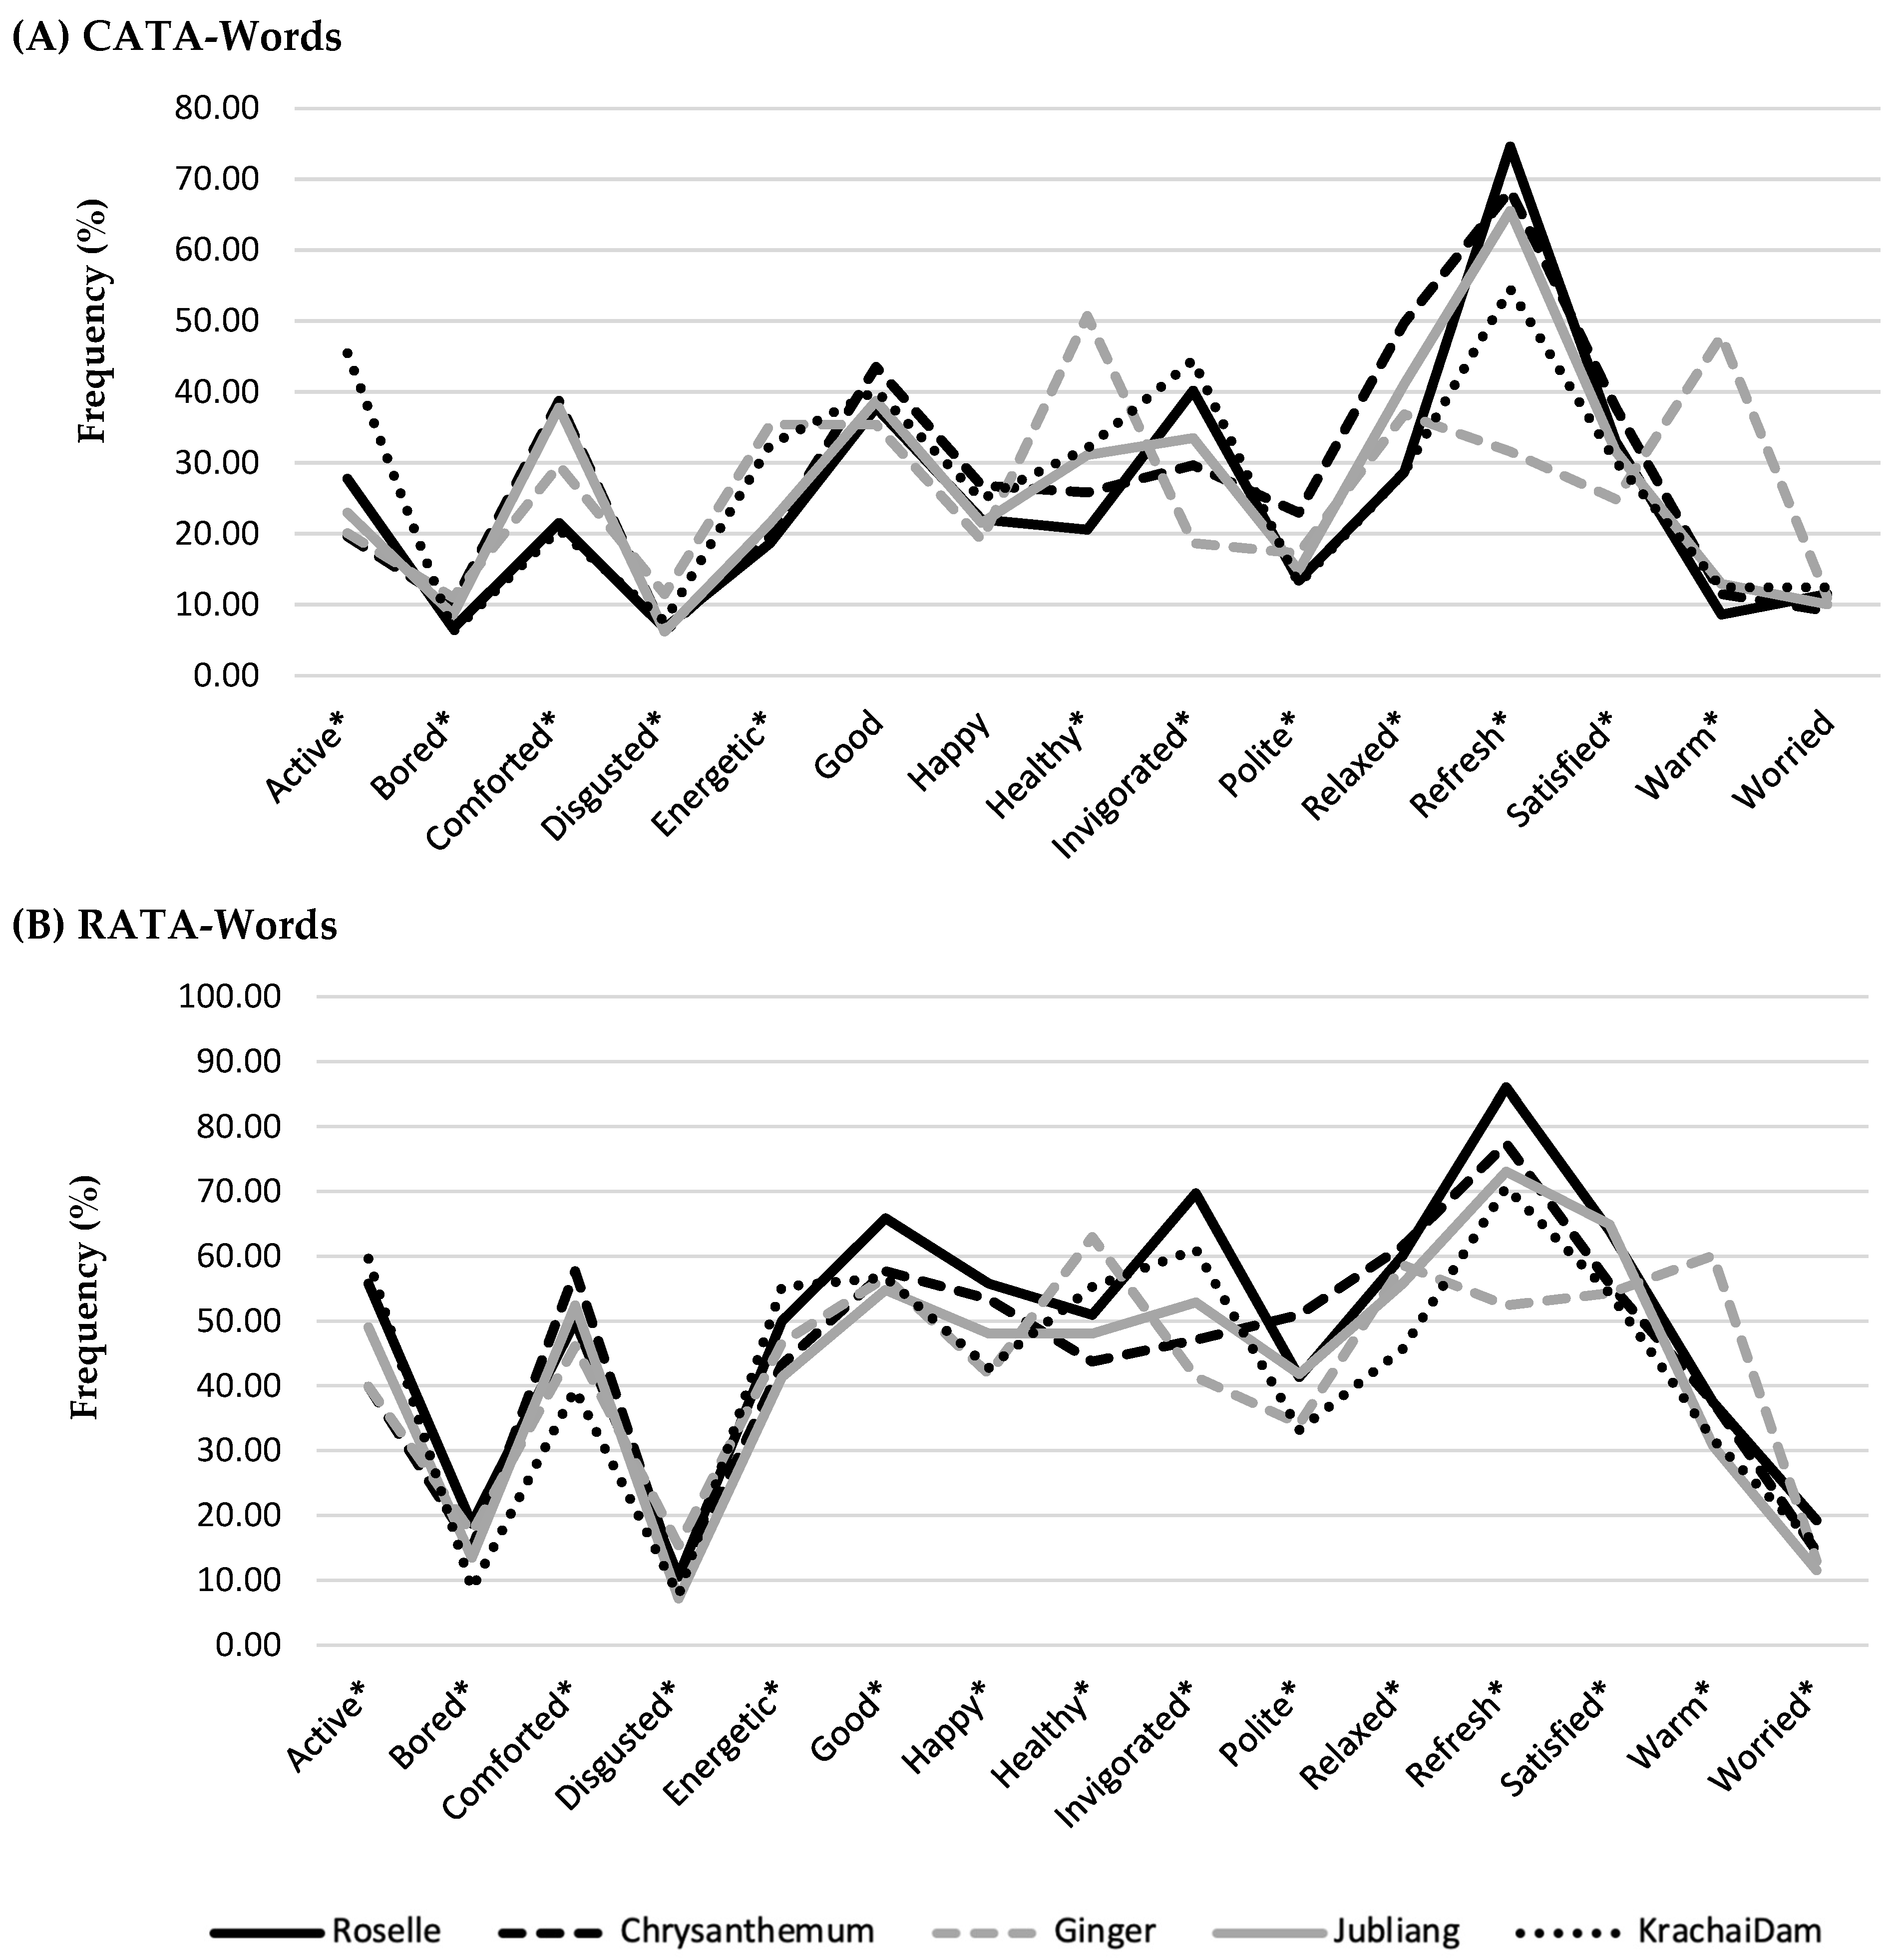
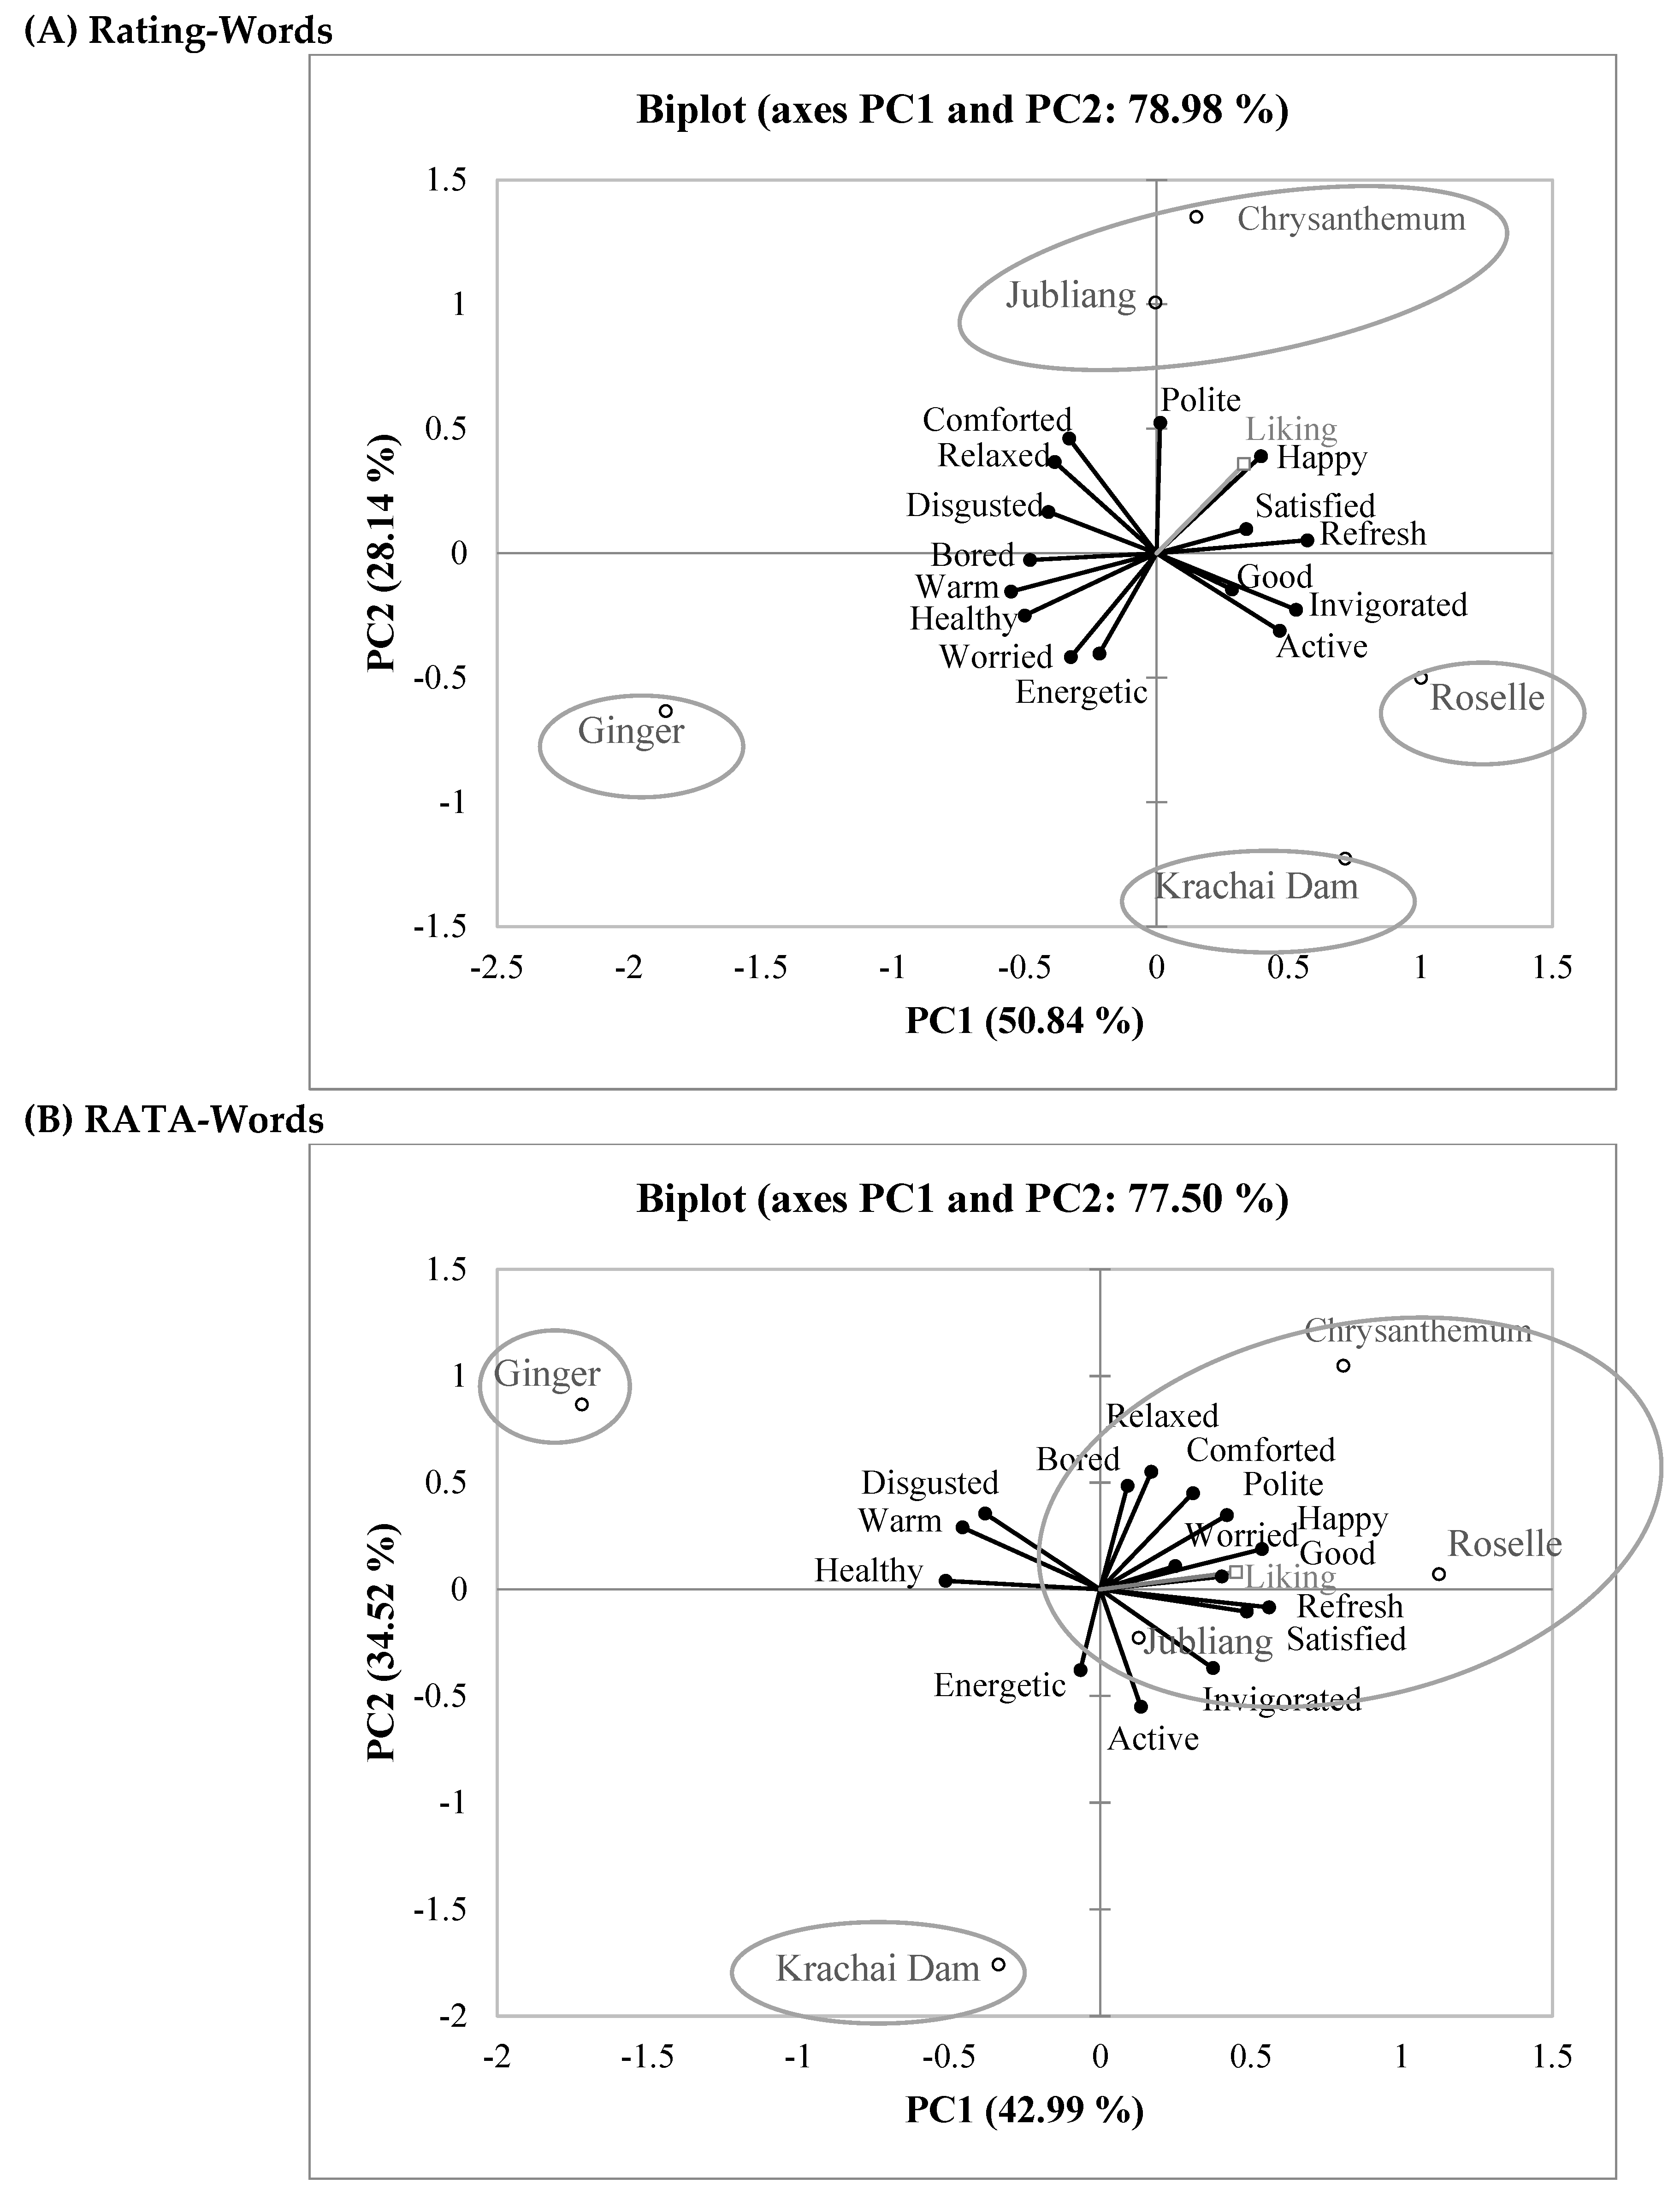
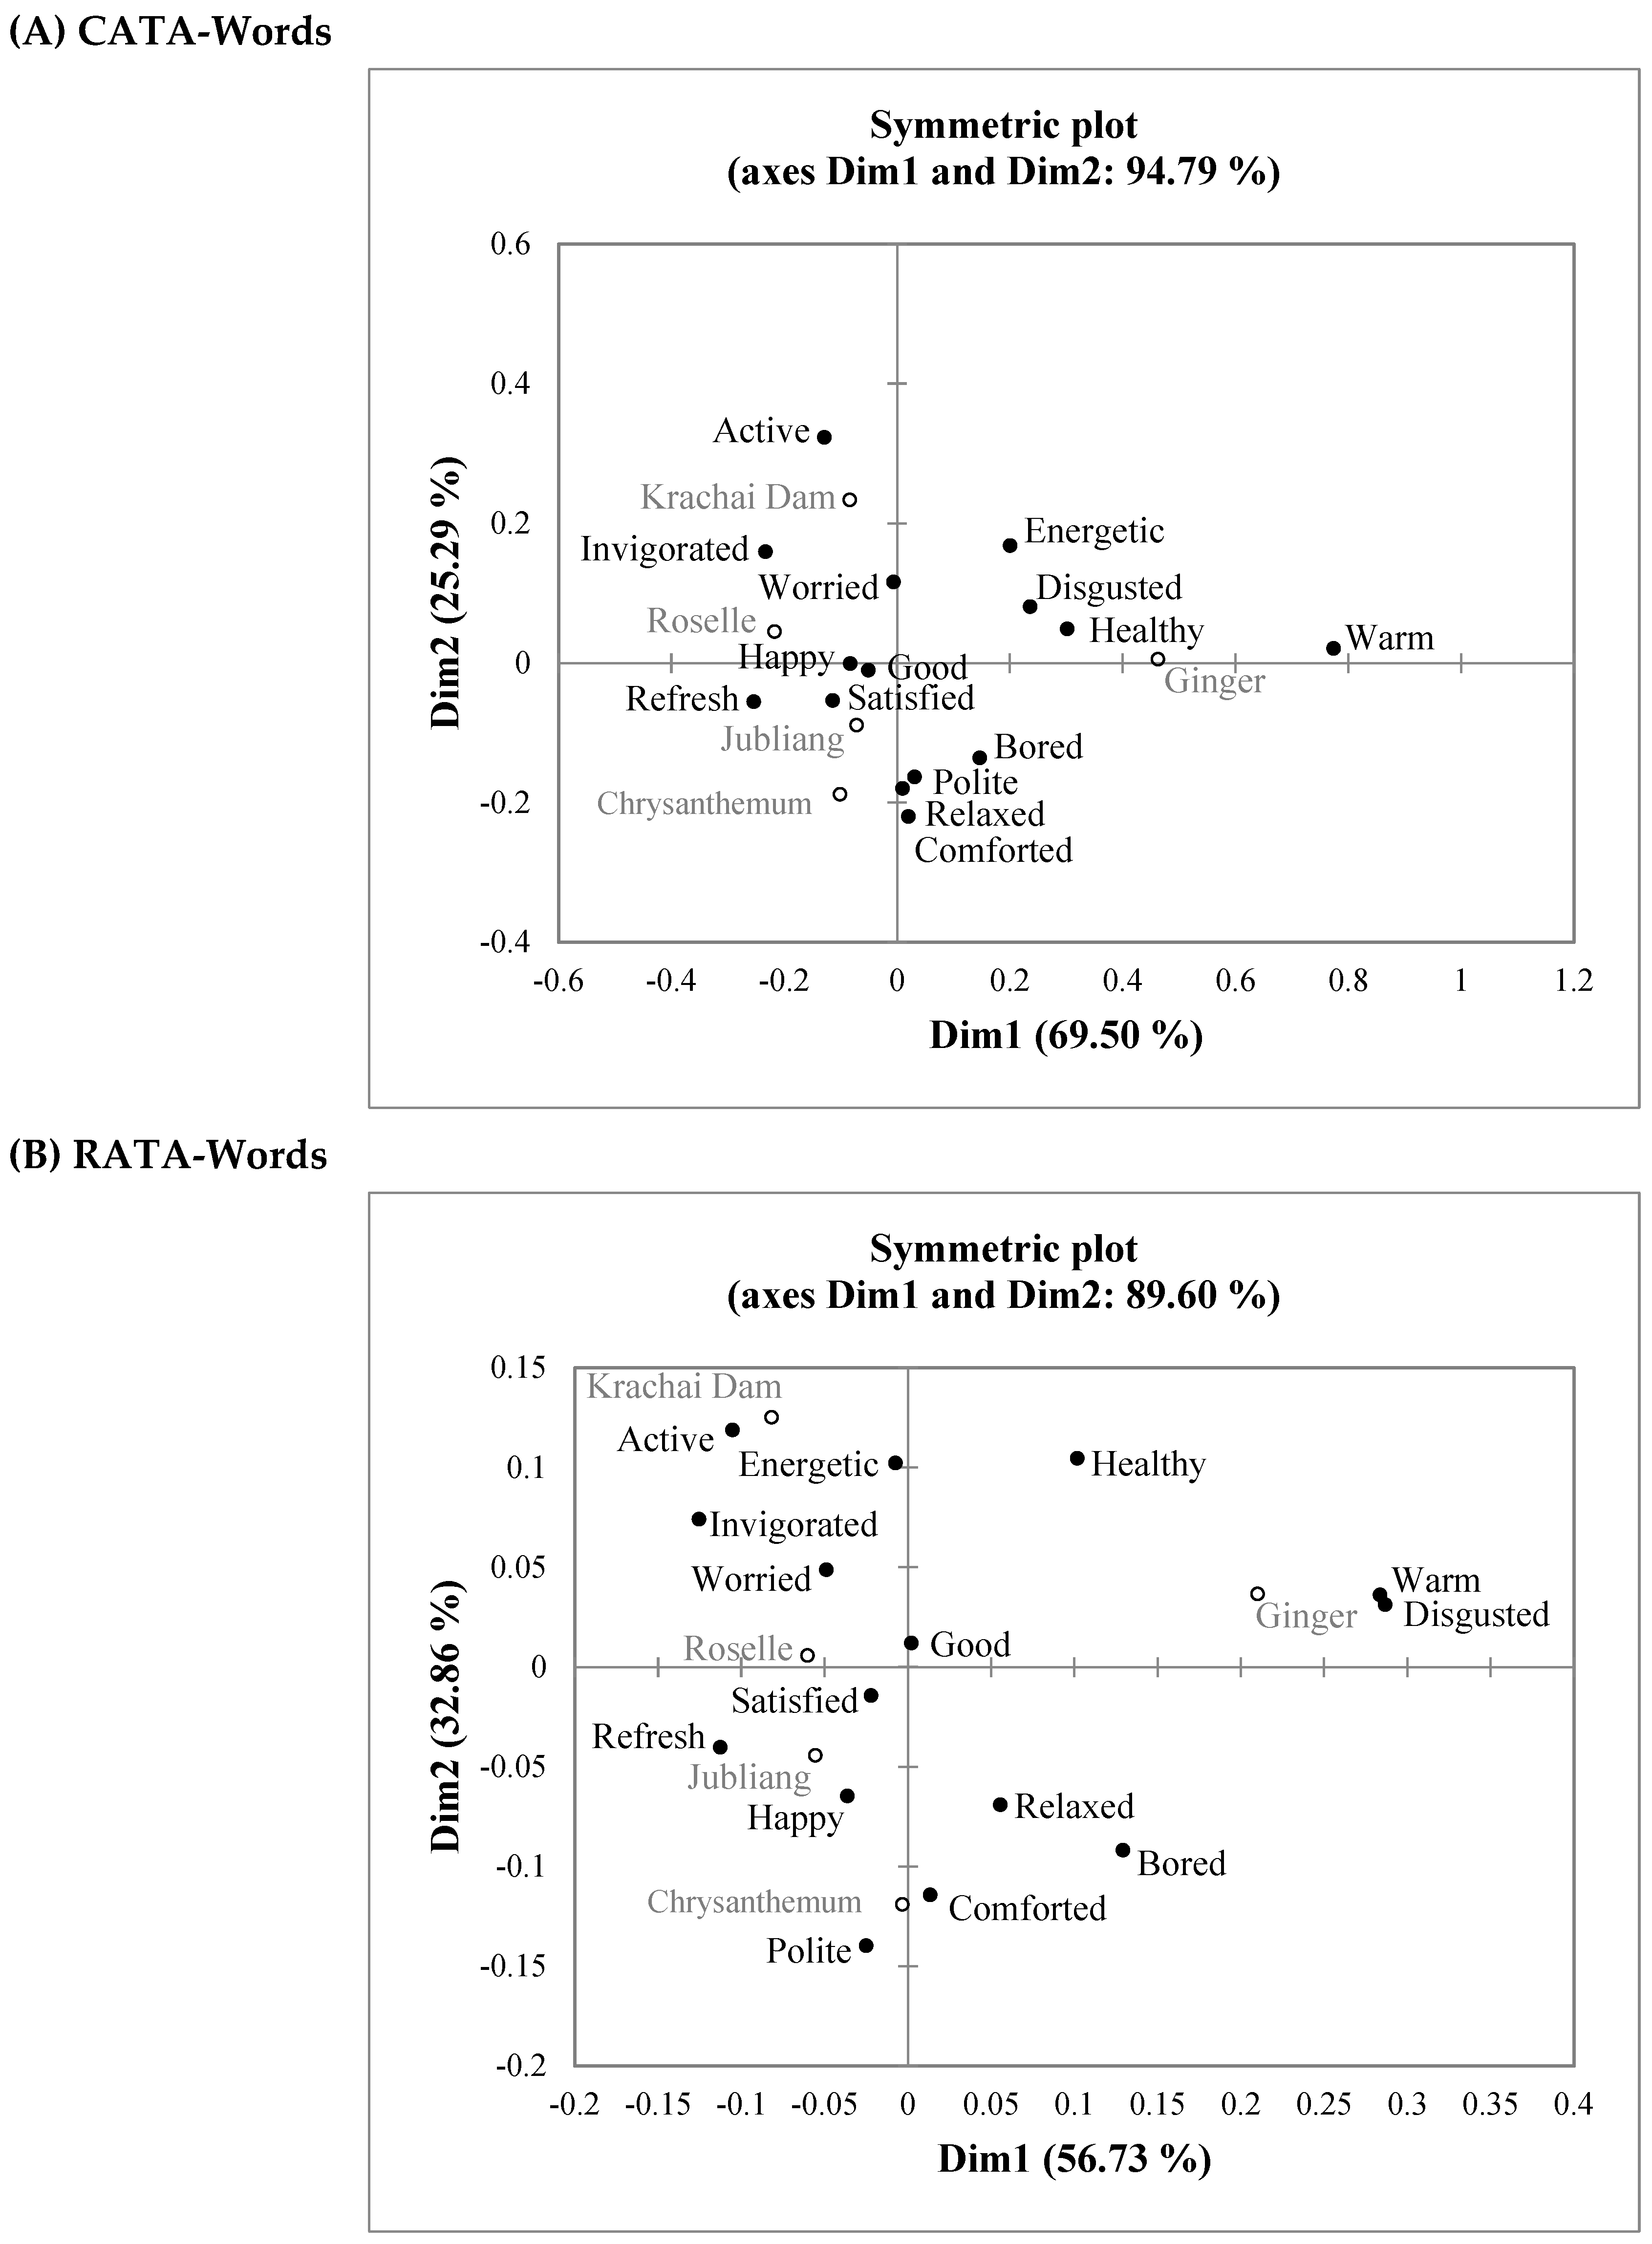
3.3. Discriminating Herbal Drinks Based on Emotion and Wellness Responses

To determine the overall product differences and which emotion and wellness attributes were mainly responsible for product discrimination, MANOVA and DA were performed (Table 8). When considering the MANOVA results of rating scores and RATA scores, significant differences were observed among the five herbal drinks in terms of emotion and wellness responses (p < 0.0001). Based on the first canonical dimension (Can 1), DA identified the “warm” emotion and the “refreshed” wellness terms as the two most discriminating terms among the herbal drinks based on questionnaire responses. However, one additional wellness term (“healthy”) was identified in Can 1 for the CATA frequency questionnaire. When considering Can 2, “active” and “comforted” terms significantly contributed to overall product differences. However, RATA scores identified one more wellness term (“relaxed”), while rating scores and CATA frequencies identified two more wellness terms (“relaxed” and “invigorated”). In summary, DA of CATA data revealed the greatest number of terms that discriminated the products, including two positive emotion terms (“warm” and “active”) and all five wellness terms (“refreshed”, “healthy”, “comforted”, “relaxed”, and “invigorated”) with greatest explained variance (93.6%). This finding (Table 8) is not in agreement with that previously reported based on the results from Table 6 and Table 7. One possible explanation is that the former data analysis took into account intercorrelations among emotion and wellness attributes, while the latter did not.
PCA was performed to investigate the relationship between the five herbal drinks and emotion and wellness responses. PCA biplots of rating scores and RATA scores were compared (Figure 3A,B) with the first two PCs (PC1 and PC2), explaining 78.98% and 77.50% of total variance, respectively. For rating-words data, the PCA biplots identified four groups of herbal drinks: I-ginger drink, II-Krachai Dam drink, III-roselle drink, and IV-chrysanthemum-Jubliang drink (Figure 3A). Ginger drink and roselle drink corresponded with PC1 but in the opposite quadrant, while Krachai Dam drink and chrysanthemum-Jubliang drink corresponded with PC2 but in the opposite quadrant as well. Ginger drink correlated with “warm”, “healthy”, “disgusted”, and “bored”. Roselle drink correlated with “refreshed”, ”invigorated”, and “active”. Krachai Dam drink correlated with “energetic” and “worried”. Chrysanthemum and Jubliang drinks correlated with “polite” and “comforted”.
For RATA-words data, the PCA biplots revealed three groups of herbal drinks: I-ginger drink, II-Krachai Dam drink, and III-roselle, chrysanthemum, and Jubliang drinks (Figure 3B). Ginger drink and roselle drink corresponded with PC1, and Krachai Dam drink and Chrysanthemum drink corresponded with PC2, in opposite directions. Jubliang drink corresponded with PC3 (not shown in Figure 3), as it could not be explained using PC1 and PC2. Ginger drink correlated with “warm”, “healthy”, and “disgusted”. Roselle drink correlated with “refreshed”, ”invigorated”, “happy”, “satisfied”, and “polite”. Krachai Dam drink correlated with “energetic” and “active”. Chrysanthemum drink correlated with “polite”, “comforted”, and “bored”. Obviously, the “warm” emotion term and the “refreshed” wellness term were the most important terms differentiating the hot ginger drink from the cold herbal drinks (Table 8 and Figure 3).
The CA symmetric plots of CATA frequency and RATA frequency were compared (Figure 4A,B). The first two dimensions (Dim1 and Dim2) accounted for 94.79% and 89.60% of variance, respectively. CA configuration revealed four groups of herbal drinks: I-ginger drink, II-Krachai Dam drink, III-roselle drink, and IV-chrysanthemum-Jubliang drink. The ginger drink and the other four herbal drinks were clearly separated, on the opposite sides of Dim1 in both CA configurations. However, the CA configurations of CATA data vs. RATA data revealed some slightly different relationships between herbal drinks and emotion and wellness profiles. For CATA data (Figure 4A), ginger drink correlated with “warm”, “healthy”, and “disgusted”. Roselle drink correlated with “refreshed” and “invigorated”. Krachai Dam drink correlated with “active”. Chrysanthemum and Jubliang drinks correlated with “polite”, “relaxed”, and “comforted”. For RATA data (Figure 4B), ginger drink correlated with “warm” and “disgusted”. Roselle drink correlated with “refreshed” and “invigorated”. Krachai Dam drink correlated with “energetic” and “active”. Chrysanthemum and Jubliang drinks correlated with “polite”, “comforted”, “relaxed”, and ”happy”.
King et al. [31] evaluated the impact of rating scale and CATA on measurement of emotional responses. They found that the rating scale provided differentiation for more attributes at lower levels of emotional response, while CATA provided greater differentiation at higher levels of emotional frequency for a few select emotions. The rating scale was more sensitive than CATA, but both were found to be acceptable approaches, depending on the objective of the test [31]. In addition, Ng et al. [6] evaluated the effectiveness of the CATA approach compared to intensity scaling for the EsSense® Profile. They reported that the qualitative nature of the data obtained from CATA limited the extent of statistical analysis, making it difficult to draw clear inferential conclusions from the data obtained with the EsSense Profile®. Therefore, using a combination of both approaches, RATA was proposed.
Meyners et al. [27] mentioned that compared to CATA questions, the use of a RATA variant was found to increase the number of attribute terms selected to describe samples and led to a slight increase in the percentage of terms for which significant differences among samples were identified. Jaeger et al. [40] compared the CATA and RATA question formats using an emoji questionnaire. They found that neither CATA nor RATA emoji-questions were regarded by consumers as difficult or tedious. Their recommendation for method selection was to use CATA emoji questions when samples have distinct emotional associations, whereas RATA seems to better discriminate between samples with more similar emotional profiles. However, in this study, the CA configurations of CATA data vs. RATA data revealed only slightly different relationships between herbal drinks and emotion and wellness profiles (Figure 4).

3.4. Overall Discussion

Overall, all types of data (rating, RATA, and CATA) showed similar results in terms of emotion and wellness profiles of the five herbal drinks studied. The “warm” and “healthy” terms were important and relevant to ginger drink, and the negative emotion term “disgusted” was elicited. “Refreshed” and “invigorated” were the important wellness terms for roselle drink. “Active”, “energetic”, and “worried” emotion terms were often elicited by Krachai Dam drink. Additionally, “comforted”, “relaxed”, and “bored” were significant terms for describing the chrysanthemum and Jubliang drinks. Although chrysanthemum drink had the highest overall liking scores (Table 5), some consumers expressed a “bored” emotion. It is a challenge of product developers to reduce the negative emotions associated with products. Elicited negative emotion terms should be carefully considered when developing or improving products. In the case of herbal drinks, ginger drink was associated with “disgusted” by some consumers, possibly because of its natural spicy flavor. Krachai Dam drink was associated with “worried” because it is not well-known by many Thai consumers and it normally imparts a pungent and sour flavor. “Bored” was elicited by chrysanthemum, possibly because it is a well-known traditional product that has not changed for a long time (i.e., not much product innovation applied to this drink).
When the three types of measuring methods—a rating scale, CATA question, and RATA question—were compared, they all produced similar emotion and wellness profiles, though there were advantages and limitations for each method. For a rating scale, the participants needed more time to complete the questionnaire than for other methods. However, a rating scale is appropriate for measuring intensity of attributes. The PCA and CA of rating scores were able to differentiate five herbal drinks into four groups with a higher percentage explained variance (78.98%) when compared with the RATA score (three groups; 77.50%). The CATA questionnaire was the most consumer-friendly method and was found to be appropriate for use for measurement of the presence or absence of the selected attributes. DA of CATA data identified the important terms discriminating the overall differences among the herbal tested drinks with the highest percentage of explained variance (93.6% total for Can1 and Can2). Additionally, CA of CATA data separated the five herbal drinks into four groups, similar to those of the rating data, with a higher percentage of explained variance (94.79%) when compared with the RATA frequency (four groups, 89.60%). However, the RATA score and RATA frequency from the RATA-Words question seemed to show better discrimination ability in term of improving the number of significant terms among the five herbal drinks.

4. Conclusions

In this study, we demonstrated the effects of two factors in designing a questionnaire for measurement of emotion and wellness responses elicited by herbal drinks consumed by Thai consumers. The first factor was questionnaire items in the form of words vs. full sentences. Results indicate that measuring emotion and wellness using full sentences did not provide a clear benefit over using words alone. When using familiar terms clearly understood by consumers, a full sentence in the questionnaire is not needed. For the second factor, three types of measuring methods, including a rating scale, CATA question, and RATA question were compared for their ability to discriminate among five herbal drinks. All three measuring methods produced similar emotion and wellness profiles. However, each method has advantages and limitations that researchers should carefully consider. Overall, this study provides some useful options in terms of questionnaire-item formats and measurement methods in the design of questionnaire to measuring consumers’ emotion and wellness responses to herbal drinks. The information elucidated in this study is applicable to other food products and beverages. In the future, the impact of health-benefit statements on consumer perception and purchase intent with regard to herbal drinks formulated in our lab will be assessed by product tasting and with an appropriate sample size representing the target population. We also plan to collaborate with a medical school for human clinical trials to determine the health benefits of these herbal drinks.

Author Contributions

Conceptualization, W.P. and A.S.-E.; methodology, W.P., A.S.-E. and P.H.; formal analysis, A.S.-E. and P.H.; investigation, A.S.-E. and P.H.; writing—original draft preparation, P.H.; writing—review and editing, A.S.-E. and W.P.; visualization, P.H.; supervision, A.S.-E. and W.P.; project administration, A.S.-E.; funding acquisition, A.S.-E. and P.H. All authors have read and agreed to the published version of the manuscript.

Funding

This research receives funding from Sakon Nakhon Rajabhat University (grant no. 0213).

Institutional Review Board Statement

The study was reviewed and approved by the Ethics Committee of Khon Kaen University (HE611230, approved on 7 June 2018).

Informed Consent Statement

Informed consent was obtained from all subjects involved in the study.

Data Availability Statement

The data presented in this study are available in the manuscript.

Acknowledgments

The authors express their grateful appreciation to Sakon Nakhon Rajabhat University for financial support. The department of Food Technology, Faculty of Technology, Khon Kaen University, Thailand and the School of Nutrition and Food Sciences, Louisiana State University, Agricultural Center, Baton Rouge, LA, USA, are also gratefully acknowledged for their support. We would also like to thank the consumers who participated in this research.

Conflicts of Interest

The authors declare no conflict of interest. The funders had no role in the design of the study; in the collection, analyses, or interpretation of data; in the writing of the manuscript, or in the decision to publish the results.

References

  1. Spinelli, S.; Niedziela, M. Chapter 5 Emotion Measurements and Application to Product and Packaging Development. In Integrating the Packaging and Product Experience in Food and Beverages: A Road-Map to Consumer Satisfaction; Burgess, P., Ed.; Woodhead: Publishing, UK, 2016; pp. 77–119. [Google Scholar]
  2. Jiang, Y.; King, J.M.; Prinyawiwatkul, W. A review of measurement and relationships between food, eating behavior and emotion. Trends Food Sci. Technol. 2014, 36, 15–28. [Google Scholar] [CrossRef]
  3. Köster, E.P.; Mojet, J. From mood to food and from food to mood: A psychological perspective on the measurement of food-related emotions in consumer research. Food Res. Int. 2015, 76, 180–191. [Google Scholar] [CrossRef]
  4. Volz, K.G.; Hertwig, R. Emotions and decisions: Beyond conceptual vagueness and the rationality muddle. Perspect. Psychol. Sci. 2016, 11, 101–116. [Google Scholar] [CrossRef] [PubMed]
  5. King, S.C.; Meiselman, H.L.; Carr, B.T. Measuring emotions associated with foods in consumer testing. Food Qual. Prefer. 2010, 21, 1114–1116. [Google Scholar] [CrossRef]
  6. Ng, M.; Chaya, C.; Hort, J. Beyond liking: Comparing the measurement of emotional response using EsSense Profile and consumer defined check-all-that-apply methodologies. Food Qual. Prefer. 2013, 28, 193–205. [Google Scholar] [CrossRef]
  7. Spinelli, S.; Masi, C.; Dinnella, C.; Zoboli, G.P.; Monteleone, E. How does it make you feel? A new approach to measuring emotions in food product experience. Food Qual. Prefer. 2014, 37, 109–122. [Google Scholar] [CrossRef]
  8. Schouteten, J.J.; Steur, H.D.; Pelsmaeker, S.D.; Lagast, S.; Bourdeaudhuij, I.D.; Gellynck, X. An integrated method for the emotional conceptualization and sensory characterization of food products: EmoSensory® Wheel. Food Res. Int. 2015, 78, 96–107. [Google Scholar] [CrossRef]
  9. King, S.C.; Snow, J.; Meiselman, H.L.; Sainsbury, J.; Carr, B.T.; McCafferty, D.; Serrano, D.; Gillette, M.; Millard, L.; Li, Q. Development of a questionnaire to measure consumer wellness associated with foods: The WellSense Profile™. Food Qual. Prefer. 2015, 39, 82–94. [Google Scholar] [CrossRef]
  10. Apaolaza, V.; Hartmann, P.; D’Souza, C.; López, M. Eat organic—Feel good? The relationship between organic food consumption, health concern and subjective wellbeing. Food Qual. Prefer. 2018, 63, 51–62. [Google Scholar] [CrossRef]
  11. Hanmontree, P.; Sae-Eaw, A. Krachai Dam (Kaempferia parviflora) drinks: Physicochemical properties, consumer acceptance, purchase intent, and emotion and wellness responses. Ital. J. Food Sci. 2020, 32, 631–644. [Google Scholar]
  12. Jang, J.A.; Oh, J.E.; Na, Y.; Yeo, G.E.; Cho, M.S. Emotions evoked by colors and health functionality information of colored rice: A cross-cultural study. Foods 2021, 10, 231. [Google Scholar] [CrossRef] [PubMed]
  13. Hu, X.; Lee, J. Emotions elicited while drinking coffee: A cross-cultural comparison between Korean and Chinese consumers. Food Qual. Prefer. 2019, 76, 160–168. [Google Scholar] [CrossRef]
  14. Gunaratne, T.M.; Viejo, C.G.; Fuentes, S.; Torrico, D.D.; Gunaratne, N.M.; Ashman, H.; Dunshea, F.R. Development of emotion lexicons to describe chocolate using the Check-All- That-Apply (CATA) methodology across Asian and Western groups. Food Res. Int. 2019, 115, 526–534. [Google Scholar] [CrossRef] [PubMed]
  15. Farzaneh, V.; Carvalho, I.S. A review of the health benefit potentials of herbal plant infusions and their mechanism of actions. Ind. Crops Prod. 2015, 65, 247–258. [Google Scholar] [CrossRef]
  16. Craig, W.J. Health-promoting properties of common herbs. Am. J. Clin. Nutr. 1999, 70, 491s–499s. [Google Scholar] [CrossRef]
  17. Jabeur, I.; Pereira, E.; Barros, L.; Calhelha, R.C.; Soković, M.; Oliveira, M.B.P.P.; Ferreira, I.C.F.R. Hibiscus sabdariffa L. as a source of nutrients, bioactive compounds and colouring agents. Food Res. Int. 2017, 100, 717–723. [Google Scholar] [CrossRef] [Green Version]
  18. Da-Costa-Rocha, I.; Bonnlaender, B.; Sievers, H.; Pischel, I.; Heinrich, M. Hibiscus sabdariffa L.—A phytochemical and pharmacological review. Food Chem. 2014, 165, 424–443. [Google Scholar] [CrossRef] [Green Version]
  19. Shi, X.-F.; Chu, J.-Z.; Zhang, Y.-F.; Liu, C.-Q.; Yao, X.-Q. Nutritional and active ingredients of medicinal chrysanthemum flower heads affected by different drying methods. Ind. Crops Prod. 2017, 104, 45–51. [Google Scholar] [CrossRef]
  20. Pratap, S.R.; Gangadharappa, H.V.; Mruthunjaya, K. Ginger: A potential neutraceutical, an updated review. Int. J. Pharmacogn. Phytochem. Res. 2017, 9, 1227–1238. [Google Scholar] [CrossRef]
  21. Kruawan, K.; Kangsadalampai, K. Antioxidant activity, phenolic compound contents and antimutagenic activity of some water extract of herbs. Thai J. Pharm. Sci. 2006, 30, 28–35. [Google Scholar]
  22. Chen, D.; Li, H.; Li, W.; Feng, S.; Deng, D. Kaempferia parviflora and Its Methoxyflavones: Chemistry and Biological Activities. Evid.-Based Complement. Alternat. Med. 2018, 2018, 4057456. [Google Scholar] [CrossRef] [PubMed] [Green Version]
  23. Poonnakasem, N.; Pujols, K.D.; Chaiwanichsiri, S.; Laohasongkram, K.; Prinyawiwatkul, W. Different oils and health benefit statements affect physicochemical properties, consumer liking, emotion, and purchase intent: A case of sponge cake. J. Food Sci. 2016, 81, S165–S173. [Google Scholar] [CrossRef] [PubMed]
  24. Wardy, W.; Jack, A.R.; Chonpracha, P.; Alonso, J.R.; King, J.M.; Prinyawiwatkul, W. Gluten-free muffins: Effects of sugar reduction and health benefit information on consumer liking, emotion, and purchase intent. Int. J. Food Sci. Technol. 2018, 53, 262–269. [Google Scholar] [CrossRef]
  25. Meilgaard, M.C.; Civille, G.V.; Carr, B.T. Sensory Evaluation Techniques, 5th ed.; CRC Press: Boca Raton, FL, USA, 2016; p. 589. [Google Scholar]
  26. Ares, G.; Bruzzone, F.; Vidal, L.; Cadena, R.S.; Giménez, A.; Pineau, B.; Hunter, D.C.; Paisley, A.G.; Jaeger, S.R. Evaluation of a rating-based variant of check-all-that-apply questions: Rate-all-that-apply (RATA). Food Qual. Prefer. 2014, 36, 87–95. [Google Scholar] [CrossRef]
  27. Meyners, M.; Jaeger, S.R.; Ares, G. On the analysis of Rate-All-That-Apply (RATA) data. Food Qual. Prefer. 2016, 49, 1–10. [Google Scholar] [CrossRef]
  28. Ngoenchai, P.; Alonso, J.R.; Suwonsichon, T.; Suwonsichon, S.; Prinyawiwatkul, W. Effects of visual cues on consumer expectation, emotion and wellness responses, and purchase intent of red chili powders. J. Food Sci. 2019, 84, 3018–3026. [Google Scholar] [CrossRef]
  29. King, S.C.; Meiselman, H.L. Development of a method to measure consumer emotions associated with foods. Food Qual. Prefer. 2010, 21, 168–177. [Google Scholar] [CrossRef]
  30. Cardello, A.V.; Meiselman, H.L.; Schutz, H.G.; Craig, C.; Given, Z.; Lesher, L.L.; Eicher, S. Measuring emotional responses to foods and food names using questionnaires. Food Qual. Prefer. 2012, 24, 243–250. [Google Scholar] [CrossRef]
  31. King, S.C.; Meiselman, H.L.; Carr, B.T. Measuring emotions associated with foods: Important elements of questionnaire and test design. Food Qual. Prefer. 2013, 28, 8–16. [Google Scholar] [CrossRef]
  32. Calvo-Porral, C.; Rivaroli, S.; Orosa-González, J. The asymmetric emotional associations to beverages: An approach through the theory of positive asymmetry. Foods 2021, 10, 794. [Google Scholar] [CrossRef]
  33. Soares, E.K.B.; Esmerino, E.A.; Ferreira, M.V.S.; da Silva, M.A.A.P.; Freitas, M.Q.; Cruz, A.G. What are the cultural effects on consumers’ perceptions? A case study covering coalho cheese in the Brazilian northeast and southeast area using word association. Food Res. Int. 2017, 102, 553–558. [Google Scholar] [CrossRef] [PubMed]
  34. Cao, X.; Xiong, X.; Xu, Z.; Zeng, Q.; He, S.; Yuan, Y.; Wang, Y.; Yang, X.; Su, D. Comparison of phenolic substances and antioxidant activities in different varieties of chrysanthemum flower under simulated tea making conditions. J. Food Meas. Charact. 2020, 14, 1443–1450. [Google Scholar] [CrossRef]
  35. Chen, S.; Liu, J.; Dong, G.; Zhang, X.; Liu, Y.; Sun, W.; Liu, A. Flavonoids and caffeoylquinic acids in Chrysanthemum morifolium Ramat flowers: A potentially rich source of bioactive compounds. Food Chem. 2021, 344, 128733. [Google Scholar] [CrossRef] [PubMed]
  36. Ghafoor, K.; Juhaimi, F.A.; Özcan, M.M.; Uslu, N.; Babiker, E.E.; Ahmed, I.A.M. Total phenolics, total carotenoids, individual phenolics and antioxidant activity of ginger (Zingiber officinale) rhizome as affected by drying methods. Food Sci. Technol. 2020, 126, 109354. [Google Scholar] [CrossRef]
  37. Nguyen, Q.V.; Chuyen, H.V. Processing of herbal tea from roselle (Hibiscus sabdariffa L.): Effects of drying temperature and brewing conditions on total soluble solid, phenolic content, antioxidant capacity and sensory quality. Beverages 2020, 6, 2. [Google Scholar] [CrossRef] [Green Version]
  38. Riaz, G.; Chopra, R. A review on phytochemistry and therapeutic uses of Hibiscus sabdariffa L. Biomed. Pharmacother. 2018, 102, 575–586. [Google Scholar] [CrossRef]
  39. Olegario, L.S.; Estevéz, M.; González-Mohino, A.; Madruga, M.S.; Ventanas, S. Cross-cultural emotional response to food stimuli: Influence of consumption context. Food Res. Int. 2021, 142, 110194. [Google Scholar] [CrossRef]
  40. Jaeger, S.R.; Lee, S.M.; Kim, K.-O.; Chheang, S.L.; Roigard, C.M.; Ares, G. CATA and RATA questions for product-focused emotion research: Five case studies using emoji questionnaires. Food Qual. Prefer. 2018, 68, 342–348. [Google Scholar] [CrossRef]
Figure 1. Emotion and wellness profiles of five herbal drinks from the (A) Rating-Words (score 1–5; n = 209) and (B) RATA-Words (score 0–5; n = 208) questionnaires. * indicates significant differences among the five herbal drinks (p < 0.05).
Foods 11 00348 g001
Figure 2. Emotion and wellness profiles of the five herbal drinks from the (A) CATA-Words (test 3; n = 209) and (B) RATA-Words (test 5; n = 208). * indicates significant differences among five herbal drinks (p < 0.05).
Foods 11 00348 g002
Figure 3. PCA biplots of emotion and wellness responses of the five herbal drinks in the (A) Rating-Words and (B) RATA-Words questionnaires. Symbols (○) and (●) indicate the position of herbal drinks and emotion-wellness terms, respectively.
Foods 11 00348 g003
Figure 4. CA symmetric plots of emotion and wellness responses of the five herbal drinks in the (A) CATA-Words and (B) RATA-Words questionnaires. Symbols (○) and (●) indicate the position of herbal drinks and emotion and wellness terms, respectively.
Foods 11 00348 g004
Table 1. The description of five herbal drink samples.
Herbal DrinksMain IngredientsServing Condition/Temperature
Roselle drink
Ready to drink,
200 mL/box
Roselle extract 94%, sucrose 6%Cold/10 °C
Chrysanthemum drink
Ready to drink,
350 mL/bottle
Chrysanthemum extract 90.00%, fructose syrup 4.00%, sucrose 4.00%Cold/10 °C
Ginger drink
Instant powder 1,
18 g/sachet
Ginger extract 8.03%, sugar 10.47%, vitamin B1 0.0003%, vitamin B2 0.0003%, vitamin B6 0.0009%Hot/70 °C
Jubliang drink
Ready to drink,
300 mL/box
Jubliang extract 94.68%, fructose 4.0%, sugar 1.0%Cold/10 °C
Krachai Dam drink
Ready to drink,
90 mL/bottle
Krachai Dam extract 20%, fructose 18%, honey 1.5%, citric acid 0.5%, vitamin C 0.12%, vitamin A 0.012%, vitamin B6 0.004%Cold/10 °C
1 ginger drink was prepared by diluting 18 g of instant ginger powder in 150 mL of hot water.
Table 2. Thai translation of emotion and wellness terms obtained from the EsSense Profile® and the WellSense ProfileTM.
EsSense Profile® (39 Terms)
Activeรู้สึกกระฉับกระเฉงGladยินดี/ดีใจPleasedพึงพอใจ
AdventurousชอบผจญภัยGoodดีPoliteสุภาพ
Affectionateรักใคร่Good-naturedมีใจเมตตาQuietเงียบ
Aggressiveก้าวร้าวGuiltyรู้สึกผิดSatisfiedพึงพอใจ
Boredเบื่อHappyมีความสุขSecureปลอดภัย
CalmสงบInterestedรู้สึกสนใจSteadyคงเส้นคงวา
Daringกล้าหาญJoyfulร่าเริงTameจืดชืด/ไม่น่าสนใจ
Disgustedน่ารังเกียจ/ขยะแขยงLovingรู้สึกรักTenderนุ่มนวล
Eagerกระตือรือร้นMerryรู้สึกครึกครื้นUnderstandingมีความเข้าอกเข้าใจ
Energeticรู้สึกมีพลังMildอ่อนโยนWarmอบอุ่น
Enthusiasticกระตือรือร้นNostalgicระลึกถึงความหลังWholeรู้สึกสมบูรณ์ครบถ้วน
Freeเป็นอิสระPeacefulสงบWildคึกคะนอง
Friendlyเป็นมิตรPleasantรู้สึกเพลิดเพลินWorriedรู้สึกกังวล
WellSense ProfileTM (45 Terms)
Acceptedได้รับการยอมรับEnergeticเต็มไปด้วยพลังResilientยืดหยุ่น
Accomplishedบรรลุเป้าหมายFatiguedเหนื่อยล้าRestedได้พักผ่อน
Activeรู้สึกกระฉับกระเฉงFocusedตั้งใจจดจ่อSadเศร้า
Affectionateรักใคร่Friendlyเป็นมิตรSatisfiedพึงพอใจ
Alertตื่นตัวFulfilledรู้สึกได้รับการเติมเต็มSecureปลอดภัย
Approachableเข้าถึงได้Gratefulกตัญญูรู้คุณSociableชอบเข้าสังคม
Attentiveเอาใจใส่HappyมีความสุขStimulatedถูกกระตุ้น
CalmสงบHealthyมีสุขภาพดีStressedเครียด
Comfortedรู้สึกสบายInvigoratedมีชีวิตชีวาSupportedได้รับการสนับสนุน
Compassionateเห็นอกเห็นใจJoyfulร่าเริงUnfulfilledยังไม่ได้รับการเติมเต็ม
Concerned for othersมีความห่วงใยต่อผู้อื่นLonelyเหงาUninspiredไม่มีแรงบันดาลใจ
ConnectedผูกพันLovedรู้สึกได้รับความรักUninterestedไม่สนใจ
Creativeสร้างสรรค์PeacefulสงบTenseเครียด
Curiousอยากรู้อยากเห็นRefreshed สดชื่นTiredเหนื่อยล้า
Disconnectedไม่ผูกพันRelaxedรู้สึกผ่อนคลายWholeรู้สึกสมบูรณ์ครบถ้วน
Table 3. Selected emotional and wellness terms relevant to herbal drinks.
Term CategoriesEnglishThai
Positive emotional termsActiveรู้สึกกระฉับกระเฉง
(7 terms)Energeticรู้สึกมีพลัง
Goodรู้สึกดี
Happyรู้สึกมีความสุข
Politeรู้สึกสุภาพ
Satisfiedรู้สึกพึงพอใจ
Warmรู้สึกอบอุ่น
Negative emotional termsBoredรู้สึกเบื่อ
(3 terms)Disgustedรู้สึกน่ารังเกียจ
Worriedรู้สึกกังวล
Wellness termsComfortedรู้สึกสบาย
(5 terms)Healthyมีสุขภาพดี
Invigoratedมีชีวิตชีวา
Relaxedรู้สึกผ่อนคลาย
Refreshedรู้สึกสดชื่น
Table 4. Demographic characteristics of participants for the six test designs.
Test DesignTest 1Test 2Test 3Test 4Test 5Test 6Total
Emotion and wellness itemsWordsSentencesWordsSentencesWordsSentences
Measurement methodRatingRatingCATACATARATARATA
Number of participants2092082092072082111252
Gender (%) 1
Male49.849.549.349.349.048.849.3
Female50.250.550.750.751.051.250.7
Age (%) 1
18–21 years24.924.524.426.625.227.525.6
22–40 years24.926.025.824.226.524.625.2
41–59 years25.425.525.825.124.424.225.1
≥60 years24.824.024.024.123.923.724.1
Region of Thailand (%) 1
Northern20.120.221.118.820.719.420.1
Central22.520.719.124.225.026.623.0
Northeastern34.036.033.536.731.734.634.4
Southern23.423.126.320.322.619.422.5
1 Percentage within each test design.
Table 5. The mean overall liking scores of the five herbal drinks in each test design.
Test Design 1RoselleChrysanthemumGingerJubliangKrachai DamF-Value 3p-Value 3
17.11 a ± 1.337.32 a ± 1.356.48 c ± 2.036.81 b ± 1.286.65 bc ± 1.8211.8670.000
27.14 a ± 1.257.29 a ± 1.236.55 b ± 1.986.76 b ± 1.396.62 b ± 1.7912.8700.000
37.13 a ± 1.387.41 a ± 1.456.59 b ± 2.196.81 b ± 1.416.85 b ± 1.839.9830.000
47.13 b ± 1.407.46 a ± 1.216.48 c ± 2.086.48 c ± 1.736.74 c ± 1.8119.8660.000
57.18 a ± 1.337.35 a ± 1.426.81 b ± 2.046.87 b ± 1.517.06 ab ± 1.744.8410.001
67.23 a ± 1.287.49 a ± 1.226.86 b ± 1.966.79 b ± 1.596.64 c ± 2.0113.3350.000
F-value20.1790.7531.4391.4781.184--
p-value20.9700.5840.2080.1950.315--
Mean ± SD from 1252 consumer responses based on a 9-point hedonic scale. a–c Different letters in the same row indicate significant differences across samples according to Duncan’s multiple range test (p < 0.05). 1 Test 1 rating, words; Test 2 rating, sentences; Test 3 CATA, words; Test 4 CATA, sentences; Test 5 RATA, words; Test 6 RATA, sentences. 2 F-value and p-value in ANOVA were used to assess whether there is a difference among the six test designs. 3 F-value and p-value in ANOVA were used to assess whether there is a difference among the five herbal drinks.
Table 6. Mean ± standard deviations of overall liking 1 and emotion/wellness responses elicited by five herbal drinks in rating 2 and RATA 3 questionnaires.
AttributesTest Samplesp-Value
RCGJK
Test design 1: Rating-Words (n = 209)
Overall liking7.11 ± 1.33 a7.32 ± 1.35 a6.48 ± 2.03 c6.81 ± 1.28 b6.65 ± 1.82 bc<0.001
Emotion
Active2.70 ± 1.29 a2.37 ± 1.33 bc2.24 ± 1.36 c2.46 ± 1.33 b2.89 ± 1.38 a<0.001
Energetic2.28 ± 1.32 b2.36 ± 1.35 b2.67 ± 1.34 a2.32 ± 1.32 b2.76 ± 1.36 a<0.001
Good2.90 ± 1.312.91 ± 1.372.80 ± 1.412.72 ± 1.332.89 ± 1.340.311
Happy2.62 ± 1.31 a2.71 ± 1.32 a2.26 ± 1.34 c2.56 ± 1.26 ab2.42 ± 1.37 bc<0.001
Polite2.04 ± 1.26 b2.36 ± 1.29 a2.09 ± 1.28 b2.31 ± 1.14 a2.12 ± 1.33 b<0.001
Satisfied3.03 ± 1.25 a2.84 ± 1.34 ab2.66 ± 1.33 b2.73 ± 1.23 b2.67 ± 1.44 b0.003
Warm1.90 ± 1.15 b2.04 ± 1.31 b2.88 ± 1.34 a2.00 ± 1.15 b2.02 ± 1.26 b<0.001
Bored1.36 ± 0.81 b1.33 ± 0.74 bc1.49 ± 0.88 a1.33 ± 0.77 bc1.25 ± 0.66 c<0.001
Disgusted1.30 ± 0.81 ab1.31 ± 0.80 a1.37 ± 0.83 a1.28 ± 0.71 ab1.19 ± 0.58 b0.020
Worried1.42 ± 1.021.36 ± 0.861.47 ± 0.901.36 ± 0.781.40 ± 0.790.403
Wellness
Comforted2.30 ± 1.31 b2.74 ± 1.33 a2.63 ± 1.40 a2.68 ± 1.22 a2.32 ± 1.33 b<0.001
Healthy2.40 ± 1.26 c2.51 ± 1.33 bc3.00 ± 1.32 a2.43 ± 1.27 bc2.62 ± 1.35 b<0.001
Invigorated3.01 ± 1.30 a2.60 ± 1.43 b2.26 ± 1.35 c2.51 ± 1.33 b3.00 ± 1.25 a<0.001
Relaxed2.30 ± 1.28 c2.94 ± 1.21 a2.84 ± 1.30 ab2.72 ± 1.27 b2.45 ± 1.38 c<0.001
Refreshed3.47 ± 1.18 a3.19 ± 1.31 bc2.28 ± 1.32 d3.00 ± 1.19 c3.24 ± 1.15 b<0.001
Test design 2: Rating-Sentences (n = 208)
Overall liking7.14 ± 1.25 a7.29 ± 1.23 a6.55 ± 1.98 b6.76 ± 1.39 b6.62 ± 1.79 b<0.001
Emotion
Active2.58 ± 1.24 ab2.41 ± 1.26 b2.18 ± 1.24 c2.43 ± 1.38 ab2.61 ± 1.28 a<0.001
Energetic2.32 ± 1.16 b2.28 ± 1.20 b2.38 ± 1.31 b2.22 ± 1.15 b2.73 ± 1.27 a<0.001
Good2.97 ± 1.24 a2.98 ± 1.35 a2.57 ± 1.33 c2.75 ± 1.22 bc2.81 ± 1.34 ab<0.001
Happy2.63 ± 1.24 b2.85 ± 1.26 a2.35 ± 1.27 c2.55 ± 1.30 b2.51 ± 1.34 bc<0.001
Polite2.08 ± 1.17 c2.49 ± 1.31 a2.03 ± 1.15 c2.27 ± 1.18 b2.00 ± 1.17 c<0.001
Satisfied2.94 ± 1.26 a2.89 ± 1.26 a2.49 ± 1.22 b2.78 ± 1.26 a2.74 ± 1.38 a<0.001
Warm2.11 ± 1.19 b2.19 ± 1.23 b2.81 ± 1.30 a2.08 ± 1.16 b2.08 ± 1.20 b<0.001
Bored1.47 ± 0.94 a1.29 ± 0.68 b1.34 ± 0.71 ab1.43 ± 0.83 a1.43 ± 0.87 a0.034
Disgusted1.31 ± 0.74 bc1.24 ± 0.62 c1.42 ± 0.85 a1.27 ± 0.65 c1.39 ± 0.85 ab0.002
Worried1.40 ± 0.831.37 ± 0.811.38 ± 0.781.43 ± 0.831.50 ± 0.860.119
Wellness
Comforted2.54 ± 1.27 c3.07 ± 1.28 a2.54 ± 1.31 c2.75 ± 1.17 b2.43 ± 1.37 c<0.001
Healthy2.53 ± 1.26 b2.56 ± 1.29 b2.99 ± 1.26 a2.47 ± 1.30 b2.63 ± 1.26 b<0.001
Invigorated3.08 ± 1.15 a2.88 ± 1.32 b2.27 ± 1.23 c2.70 ± 1.25 b2.87 ± 1.28 b<0.001
Relaxed2.46 ± 1.26 b2.79 ± 1.27 a2.56 ± 1.28 b2.51 ± 1.29 b2.25 ± 1.30 c<0.001
Refreshed3.32 ± 1.12 a3.52 ± 1.16 a2.45 ± 1.27 c3.03 ± 1.19 b3.06 ± 1.19 b<0.001
Test design 5: RATA-Words (n = 208)
Overall liking7.18 ± 1.33 a7.35 ± 1.42 a6.81 ± 2.04 b6.87 ± 1.51 b7.06 ± 1.74 ab<0.001
Emotion
Active1.83 ± 1.73 b1.40 ± 1.81 c1.33 ± 1.73 c1.67 ± 1.85 b2.20 ± 1.97 a<0.001
Energetic1.68 ± 1.79 ab1.53 ± 1.85 bc1.60 ± 1.82 bc1.39 ± 1.75 c1.91 ± 1.89 a0.001
Good2.35 ± 1.80 a2.15 ± 1.96 ab1.96 ± 1.86 c1.90 ± 1.83 c2.05 ± 1.94 ab0.023
Happy1.88 ± 1.77 a1.95 ± 1.92 a1.37 ± 1.71 b1.61 ± 1.78 b1.50 ± 1.83 b<0.001
Polite1.42 ± 1.79 b1.72 ± 1.79 a1.13 ± 1.63 c1.28 ± 1.64 bc1.08 ± 1.62 c<0.001
Satisfied2.26 ± 1.80 a2.06 ± 1.92 ab1.79 ± 1.76 b2.25 ± 1.79 a2.00 ± 1.96 ab0.008
Warm1.15 ± 1.56 b1.20 ± 1.66 b2.22 ± 1.98 a0.97 ± 1.52 b1.08 ± 1.66 b<0.001
Bored0.47 ± 1.01 a0.41 ± 1.04 a0.44 ± 0.99 a0.34 ± 0.89 ab0.24 ± 0.80 b0.004
Disgusted0.26 ± 0.81 b0.26 ± 0.86 b0.41 ± 1.01 a0.20 ± 0.75 b0.21 ± 0.76 b0.009
Worried0.56 ± 1.22 a0.41 ± 1.05 b0.40 ± 1.09 b0.30 ± 0.87 b0.38 ± 0.95 b0.014
Wellness
Comforted1.71 ± 1.80 b2.05 ± 1.87 a1.59 ± 1.82 bc1.72 ± 1.74 b1.35 ± 1.79 c<0.001
Healthy1.73 ± 1.78 bc1.56 ± 1.86 c2.36 ± 1.94 a1.59 ± 1.78 c1.90 ± 1.84 b<0.001
Invigorated2.39 ± 1.71 a1.69 ± 1.89 b1.38 ± 1.74 c1.84 ± 1.86 b2.20 ± 1.90 a<0.001
Relaxed2.06 ± 1.79 ab2.22 ± 1.85 a2.03 ± 1.85 ab1.90 ± 1.82 b1.54 ± 1.81 c<0.001
Refreshed3.20 ± 1.46 a2.96 ± 1.74 ab1.86 ± 1.90 d2.54 ± 1.71 c2.67 ± 1.86 bc<0.001
Test design 6: RATA-Sentences (n = 211)
Overall liking7.23 ± 1.28 a7.49 ± 1.22 a6.86 ± 1.96 b6.79 ± 1.59 b6.64 ± 2.01 b<0.001
Emotion
Active1.97 ± 1.76 a1.71 ± 1.79 b1.49 ± 1.68 b1.54 ± 1.67 b1.93 ± 1.76 a<0.001
Energetic1.78 ± 1.69 b1.47 ± 1.68 c1.68 ± 1.63 bc1.51 ± 1.68 c2.07 ± 1.70 a<0.001
Good2.56 ± 1.70 a2.43 ± 1.74 ab2.40 ± 1.71 ab2.26 ± 1.71 c2.17 ± 1.76 c0.039
Happy2.06 ± 1.72 a2.14 ± 1.81 a1.65 ± 1.74 b2.08 ± 1.69 a1.41 ± 1.67 c<0.001
Polite1.36 ± 1.59 b1.62 ± 1.63 a1.29 ± 1.62 b1.48 ± 1.61 ab1.31 ± 1.70 b0.008
Satisfied2.57 ± 1.69 a2.42 ± 1.77 a2.28 ± 1.72 ab2.37 ± 1.65 a2.05 ± 1.84 b0.007
Warm1.40 ± 1.66 b1.31 ± 1.64 b2.39 ± 1.75 a1.27 ± 1.65 b1.27 ± 1.62 b<0.001
Bored0.47 ± 1.04 ab0.34 ± 0.91 b0.48 ± 1.14 ab0.38 ± 0.95 b0.54 ± 1.18 a0.039
Disgusted0.35 ± 0.960.23 ± 0.790.39 ± 1.100.25 ± 0.790.32 ± 0.930.089
Worried0.34 ± 0.90 c0.36 ± 1.03 c0.44 ± 1.16 bc0.54 ± 1.15 ab0.64 ± 1.18 a0.001
Wellness
Comforted1.94 ± 1.76 b2.13 ± 1.79 ab1.98 ± 1.74 b2.27 ± 1.66 a1.61 ± 1.72 c<0.001
Healthy1.86 ± 1.76 c1.74 ± 1.78 c2.64 ± 1.71 a1.72 ± 1.78 c2.19 ± 1.80 b<0.001
Invigorated2.52 ± 1.67 a1.88 ± 1.78 b1.58 ± 1.71 c2.02 ± 1.73 b2.36 ± 1.74 a<0.001
Relaxed1.80 ± 1.73 bc2.14 ± 1.73 a2.00 ± 1.61 ab1.75 ± 1.65 c1.50 ± 1.71 d<0.001
Refreshed3.09 ± 1.44 a3.07 ± 1.52 a1.93 ± 1.81 c2.79 ± 1.36 b2.90 ± 1.55 ab<0.001
1 Mean ± SD of overall liking scores based on a 9-points hedonic scale (1 = extremely dislike to 5 = extremely like). 2 Mean ± SD of rating scores based on a 5-points scale (1 = not at all to 5 = extremely). 3 Mean ± SD of RATA rating scores based on a 5-points scale (1 = slightly to 5 = extremely). a–d Mean values in the same row followed by different letters are significantly different (p < 0.05). Note: R = Roselle drink; C = Chrysanthemum drink; G = Ginger drink; J = Jubliang drink; K = Krachai Dam drink.
Table 7. Mean ± standard deviations of overall liking 1 and frequency counts of emotion/wellness responses elicited by five herbal drinks in CATA 2 and RATA 2 questionnaires.
AttributesTest SamplesCochran’s Qp-Value
RCGJK
Test design 3: CATA-Words (n = 209)
Overall liking7.13 ± 1.38 a7.41 ± 1.45 a6.59 ± 2.19 b6.81 ± 1.41 b6.85 ± 1.83 b <0.001
Emotion
Active584142489568.962<0.001
Energetic394174456845.305<0.001
Good79917481844.6030.331
Happy46564045528.0820.089
Polite284836312716.9940.002
Satisfied697952666313.3380.010
Warm18241002726222.749<0.001
Bored142123181314.6670.005
Disgusted141324131621.500<0.001
Worried24192321263.4760.482
Wellness
Comforted458162794342.904<0.001
Healthy4354106656771.609<0.001
Invigorated846239709352.529<0.001
Relaxed6010477866040.209<0.001
Refreshed15614366137114119.685<0.001
Test design 4: CATA-Sentences (n = 207)
Overall liking7.13 ± 1.40 b7.46 ± 1.21 a6.48 ± 2.08 c6.48 ± 1.73 c6.74 ± 1.81 c <0.001
Emotion
Active534740429068.784<0.001
Energetic443364307265.502<0.001
Good8510879898117.2270.002
Happy648246535336.553<0.001
Polite204732411645.342<0.001
Satisfied727349706714.9160.005
Warm2235824133106.995<0.001
Bored18192224214.7500.314
Disgusted171625232214.5710.006
Worried15182021225.5000.240
Wellness
Comforted7510276956627.069<0.001
Healthy6111569636865.954<0.001
Invigorated8177487910546.724<0.001
Relaxed717777584724.281<0.001
Refreshed1601417712312489.387<0.001
Test design 5: RATA-Words (n = 208)
Overall liking7.18 ± 1.33 a7.35 ± 1.42 a6.81 ± 2.04 b6.87 ± 1.51 b7.06 ± 1.74 ab <0.001
Emotion
Active116838310212452.089<0.001
Energetic10490978611521.243<0.001
Good13712011811411810.9190.027
Happy116111871008925.585<0.001
Polite8610671876939.768<0.001
Satisfied13311611313511315.9480.003
Warm7878125646694.646<0.001
Bored393136281821.387<0.001
Disgusted222032151617.8640.001
Worried403027243210.5900.032
Wellness
Comforted104120961098230.556<0.001
Healthy1069113110011534.691<0.001
Invigorated145988611012769.516<0.001
Relaxed1251281221169521.713<0.001
Refreshed17916110915214781.199<0.001
Test design 6: RATA-Sentences (n = 211)
Overall liking7.23 ± 1.28 a7.49 ± 1.22 a6.86 ± 1.96 b6.79 ± 1.59 b6.64 ± 2.01 b <0.001
Emotion
Active1271099810312634.400<0.001
Energetic1189911610113741.902<0.001
Good1571491511441396.6430.156
Happy1331301081359556.124<0.001
Polite96112881058822.218<0.001
Satisfied15814714415112520.266<0.001
Warm95901478489121.892<0.001
Bored38273531397.3530.118
Disgusted26182620244.9350.294
Worried282631425328.398<0.001
Wellness
Comforted12313212714810836.416<0.001
Healthy11911315810713764.692<0.001
Invigorated15812010412914765.381<0.001
Relaxed1161371361189939.635<0.001
Refreshed18418012218117596.239<0.001
1 Mean ± SD of overall liking scores based on a 9-point hedonic scale (1 = extremely dislike, 5 = extremely like). 2 Frequency counts of selected emotion/wellness terms were analyzed using Cochran’s Q test. a–c Mean values in the same row followed by different letters are significantly different (p < 0.05). Note: R = roselle drink; C = chrysanthemum drink; G = ginger drink; J = Jubliang drink; K = Krachai Dam drink.
Table 8. Canonical structure (r’s) 1 describing group differences among the five herbal drinks based on emotion and wellness responses obtained from the rating, CATA, and RATA questionnaires.
ResponsesRating Scores 2RATA Scores 2CATA
Frequencies 2
RATA
Frequencies 2
Can 1Can 2Can 1Can 2Can 1Can 2Can 1Can 2
Emotion
Active0.181−0.3190.148−0.4020.109−0.5310.177−0.349
Energetic−0.142−0.232−0.001−0.191−0.210−0.2340.003−0.224
Good0.037−0.0390.0790.0250.0590.0440.055−0.011
Happy0.1620.1590.1740.1730.0690.0140.1590.147
Polite0.0320.2280.1340.287−0.0170.2100.1390.284
Satisfied0.1170.0280.1480.0080.1200.1110.1140.035
Warm−0.457−0.020−0.4650.137−0.6480.036−0.4610.114
Bored−0.1220.041−0.0270.161−0.0710.127−0.0430.140
Disgusted−0.0720.092−0.1390.071−0.115−0.044−0.1650.053
Worried−0.049−0.0600.0300.010−0.005−0.0970.061−0.053
Wellness
Comforted−0.0910.3160.0750.316−0.0130.4090.0800.302
Healthy−0.259−0.088−0.267−0.112−0.348−0.045−0.222−0.177
Invigorated0.282−0.3150.264−0.2810.248−0.3030.293−0.284
Relaxed−0.1660.355−0.0030.313−0.0040.399−0.0160.259
Refreshed0.525−0.1100.4410.0510.4930.1920.4850.059
% Cumulative variance explained62.589.061.790.768.593.654.487.5
MANOVA; Wilks’ Lambda p-value<0.0001<0.0001
1 Based on the pooled within-group variance with p < 0.0001 for rating score, RATA score, CATA frequency, and RATA frequency. Can1 and Can2 refer to the first and second canonical discrimination function, respectively. 2 Rating scores from Rating-Words question, RATA scores; RATA frequencies from RATA-Words question; CATA frequencies from CATA-Words question.
Publisher’s Note: MDPI stays neutral with regard to jurisdictional claims in published maps and institutional affiliations.

