Author Contributions
Data curation, J.F. and L.L.; Formal analysis, X.J. and W.H.; Investigation, L.W. and Y.Z.; Methodology, X.J.; Project administration, B.J., W.H. and L.L.; Resources, Z.Y.; Supervision, B.J. and Z.Y.; Validation, L.W. and Y.Z.; Writing—original draft, J.F.; Writing—review & editing, X.J. and L.L. J.F. and X.J. contributed equally to this paper. All authors have read and agreed to the published version of the manuscript.
Figure 1.
‘NIR-S-G1′ miniature spectrum acquisition instrument.
Figure 1.
‘NIR-S-G1′ miniature spectrum acquisition instrument.
Figure 2.
Schematic diagram showing the acquisition points for spectral sampling.
Figure 2.
Schematic diagram showing the acquisition points for spectral sampling.
Figure 3.
Original spectral reflectance map (a) and average spectral reflectance map (b) of all tested ‘Huangguan’ pears.
Figure 3.
Original spectral reflectance map (a) and average spectral reflectance map (b) of all tested ‘Huangguan’ pears.
Figure 4.
Spectral graphs after transformation based on different preprocessing methods. (a) FD, (b) SD, (c) MSC, (d) SNV, (e) SG, (f) LG, (g) SG+MSC, (h) SG+SNV, (i) SG+MSC+FD, (j) SG+MSC+SD, (k) SG+SNV+FD, (l) SG+SNV+SD.
Figure 4.
Spectral graphs after transformation based on different preprocessing methods. (a) FD, (b) SD, (c) MSC, (d) SNV, (e) SG, (f) LG, (g) SG+MSC, (h) SG+SNV, (i) SG+MSC+FD, (j) SG+MSC+SD, (k) SG+SNV+FD, (l) SG+SNV+SD.
Figure 5.
Curves fitted for prediction of mineral elements in pear pulp and peel. (a) Distribution of calcium content in pear pulp; (b) distribution of boron content in pear pulp; (c) distribution of potassium content in pear pulp; (d) distribution of calcium content in pear peel; (e) distribution of boron content in pear peel; (f) distribution of potassium content in pear peel.
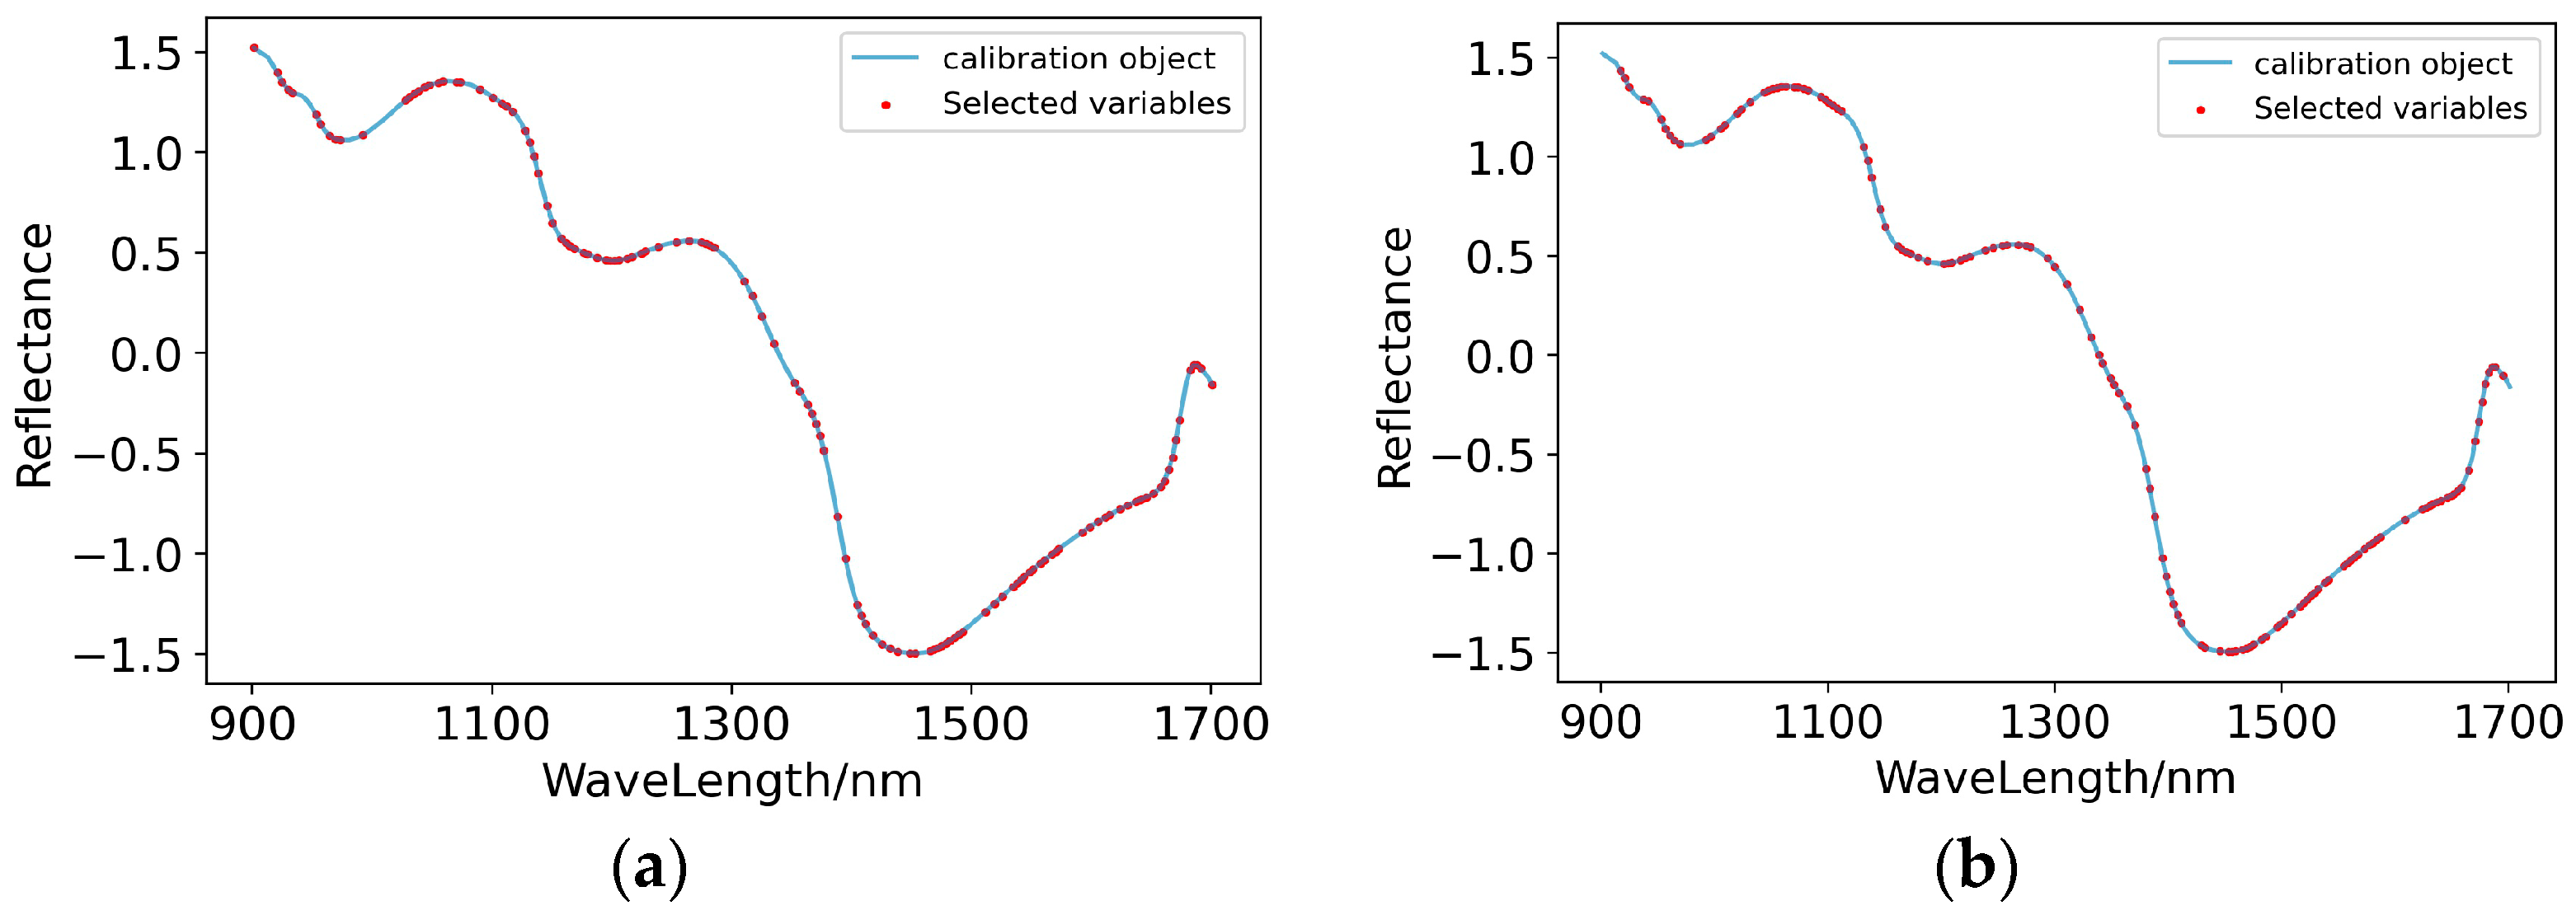
Figure 6.
Characteristic wavelengths’ distribution of prediction models for the content of calcium in pear pulp. (a) Raw-GA-PLSR; (b) SG-GA-PLSR.
Figure 6.
Characteristic wavelengths’ distribution of prediction models for the content of calcium in pear pulp. (a) Raw-GA-PLSR; (b) SG-GA-PLSR.
Figure 7.
Scatter plots of models’ prediction results of the content of calcium in pear pulp samples. (a) Raw-GA-PLSR; (b) SG-GA-PLSR.
Figure 7.
Scatter plots of models’ prediction results of the content of calcium in pear pulp samples. (a) Raw-GA-PLSR; (b) SG-GA-PLSR.
Figure 8.
Characteristic wavelengths’ distribution of prediction models for the content of boron in pear pulp. (a) Raw-GA-PLSR; (b) SG-GA-PLSR.
Figure 8.
Characteristic wavelengths’ distribution of prediction models for the content of boron in pear pulp. (a) Raw-GA-PLSR; (b) SG-GA-PLSR.
Figure 9.
Scatter plots of models’ prediction results of the content of boron in pear pulp samples. (a) Raw-GA-PLSR; (b) SG-GA-PLSR.
Figure 9.
Scatter plots of models’ prediction results of the content of boron in pear pulp samples. (a) Raw-GA-PLSR; (b) SG-GA-PLSR.
Figure 10.
Characteristic wavelengths’ distribution of prediction models for the content of potassium in pear pulp. (a) Raw-GA-PLSR; (b) SG-GA-PLSR.
Figure 10.
Characteristic wavelengths’ distribution of prediction models for the content of potassium in pear pulp. (a) Raw-GA-PLSR; (b) SG-GA-PLSR.
Figure 11.
Scatter plots of models’ prediction results of the content of potassium in pear pulp samples. (a) Raw-GA-PLSR; (b) SG-GA-PLSR.
Figure 11.
Scatter plots of models’ prediction results of the content of potassium in pear pulp samples. (a) Raw-GA-PLSR; (b) SG-GA-PLSR.
Figure 12.
Characteristic wavelengths’ distribution of prediction models for the content of calcium in pear peel. (a) SNV-GA-PLSR; (b) MSC-GA-PLSR; (c) SG-GA-PLSR; (d) LG-GA-PLSR; (e) SG+MSC-GA-PLSR; (f) SG+SNV-GA-PLSR.
Figure 12.
Characteristic wavelengths’ distribution of prediction models for the content of calcium in pear peel. (a) SNV-GA-PLSR; (b) MSC-GA-PLSR; (c) SG-GA-PLSR; (d) LG-GA-PLSR; (e) SG+MSC-GA-PLSR; (f) SG+SNV-GA-PLSR.
Figure 13.
Scatter plots of models’ prediction results of the content of calcium in pear peel samples. (a) SNV-GA-PLSR; (b) MSC-GA-PLSR; (c) SG-GA-PLSR; (d) LG-GA-PLSR; (e) SG+MSC-GA-PLSR; (f) SG+SNV-GA-PLSR.
Figure 13.
Scatter plots of models’ prediction results of the content of calcium in pear peel samples. (a) SNV-GA-PLSR; (b) MSC-GA-PLSR; (c) SG-GA-PLSR; (d) LG-GA-PLSR; (e) SG+MSC-GA-PLSR; (f) SG+SNV-GA-PLSR.
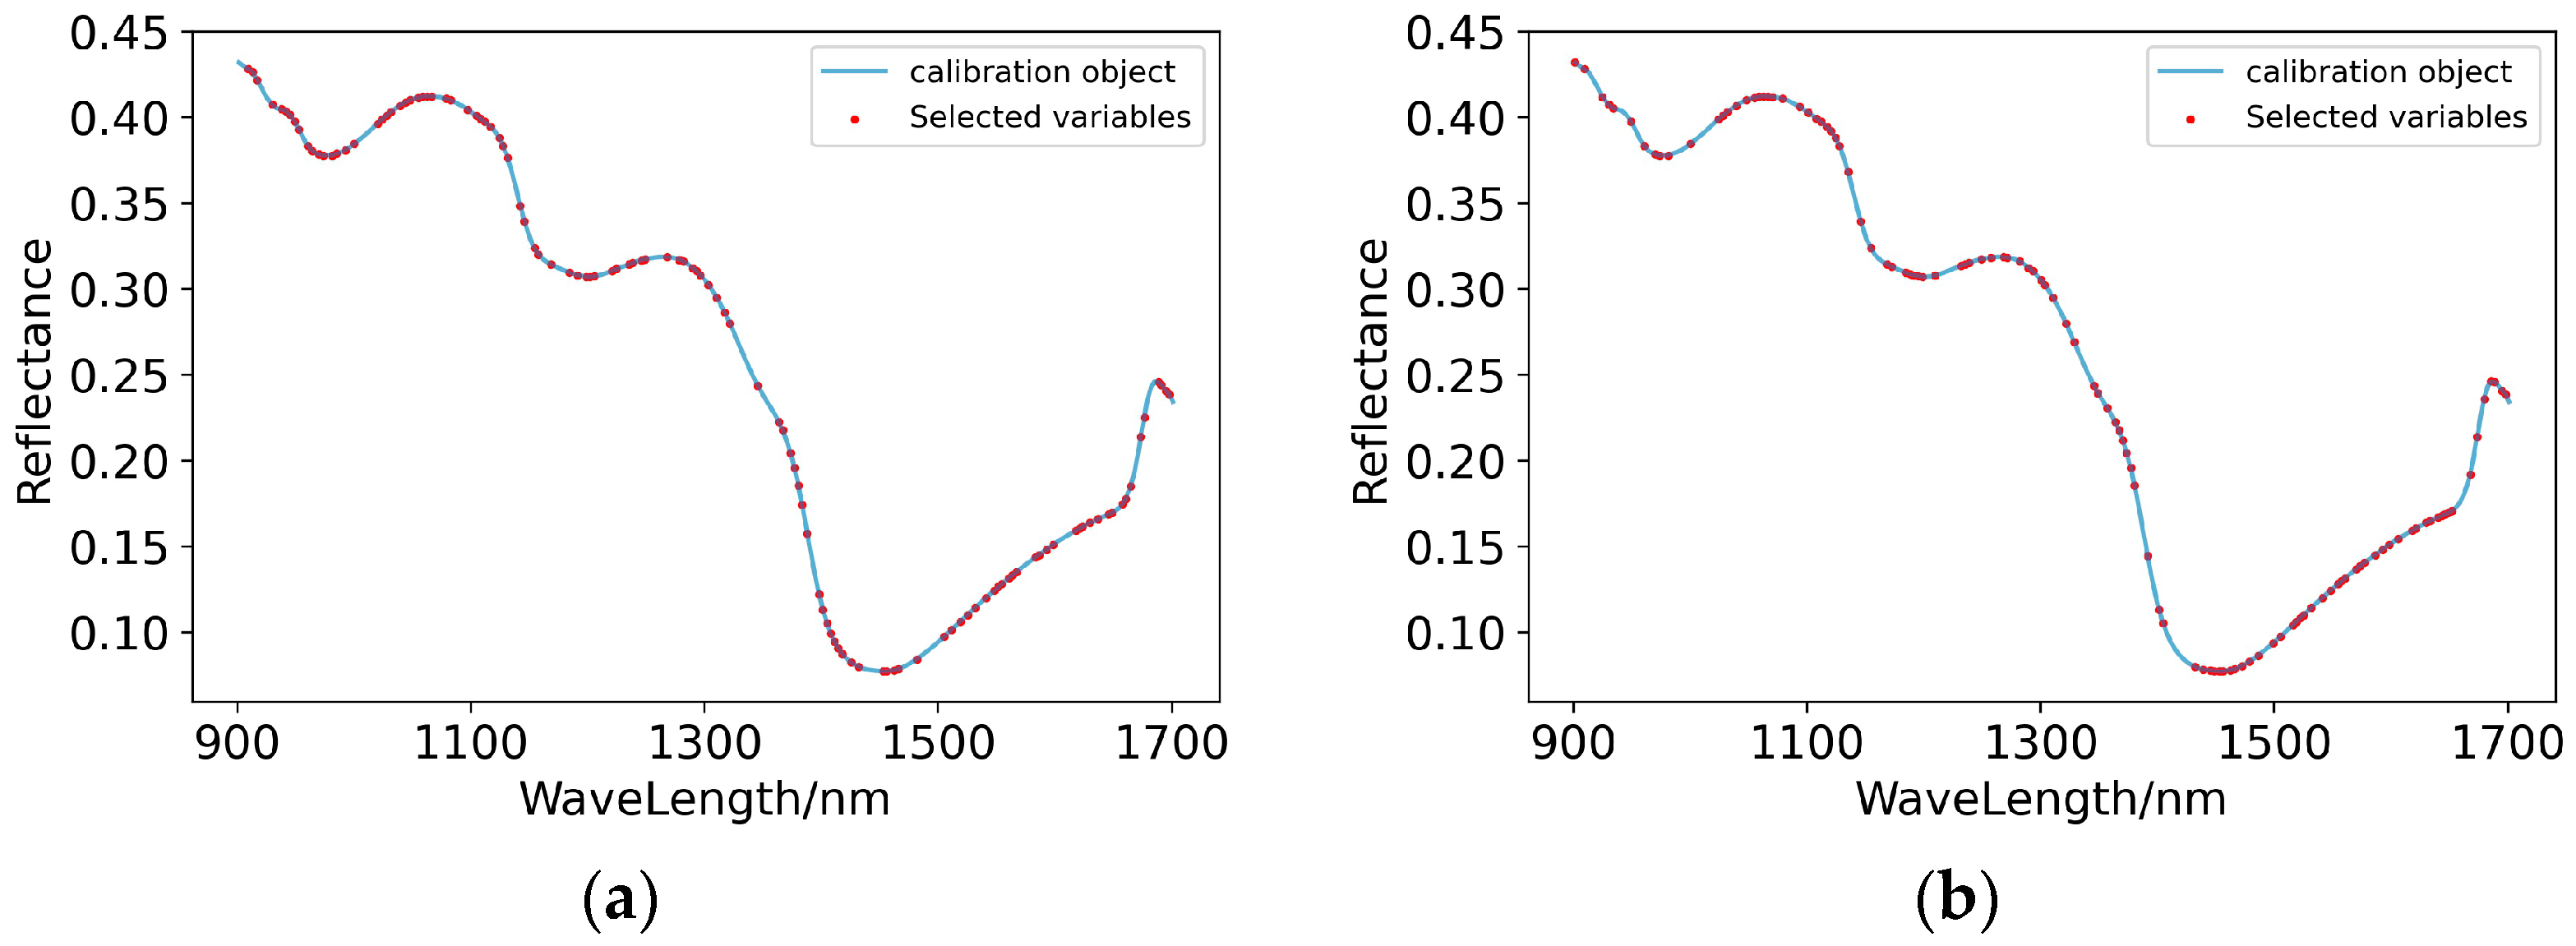
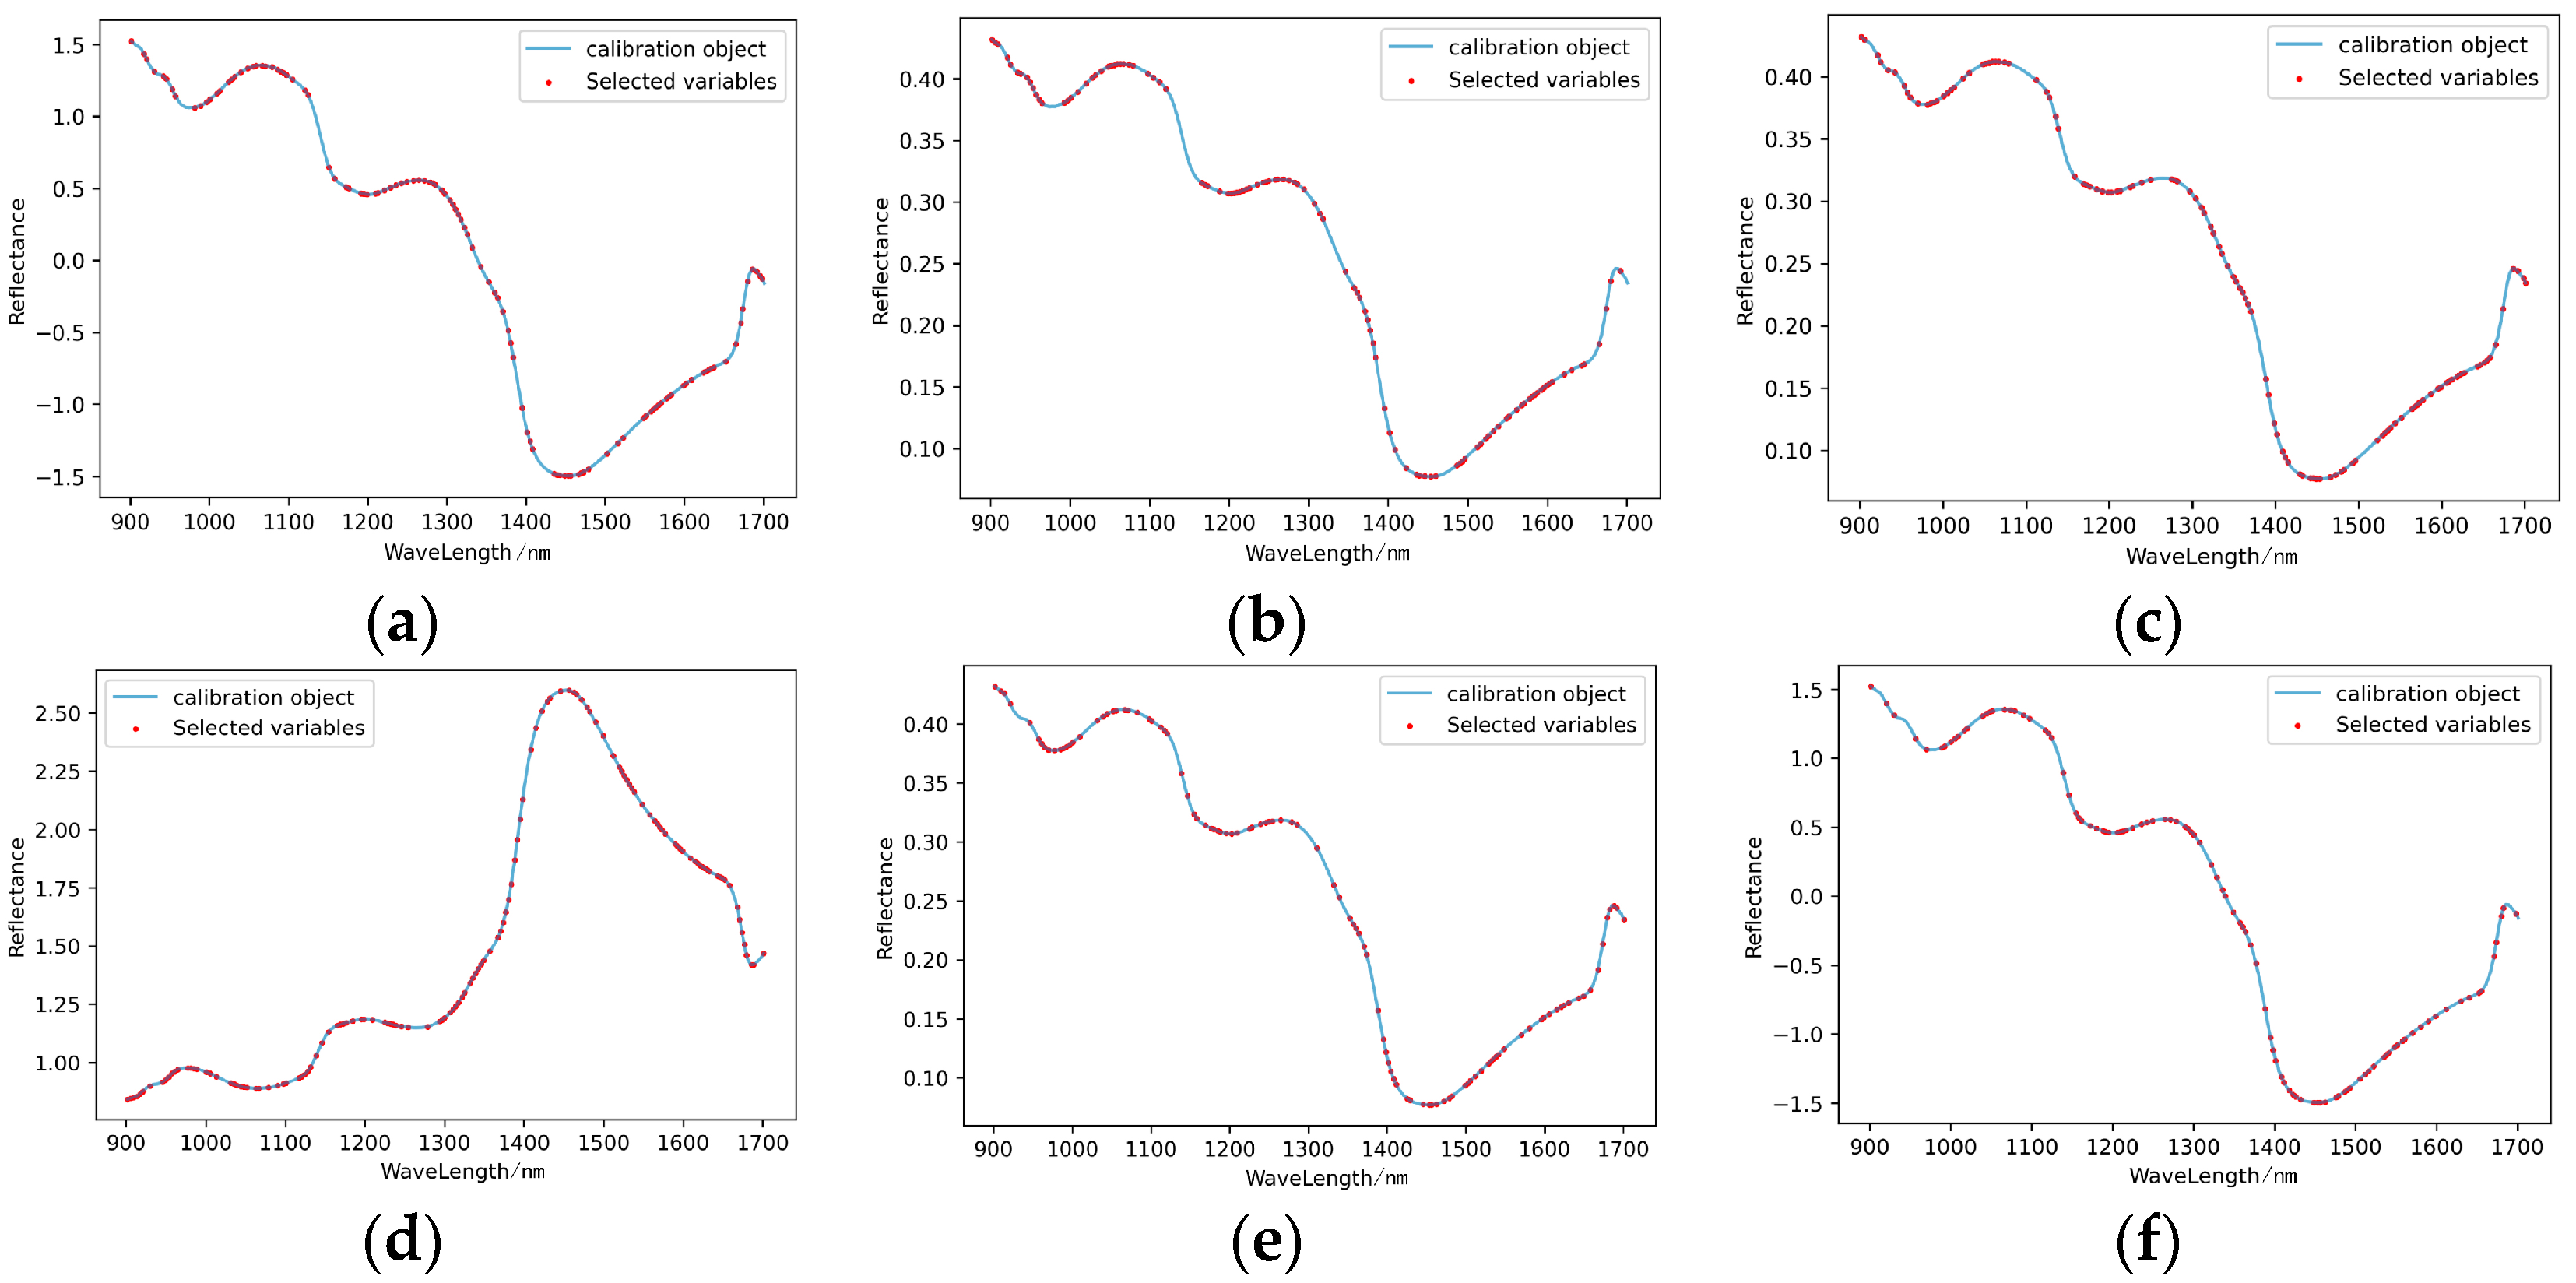
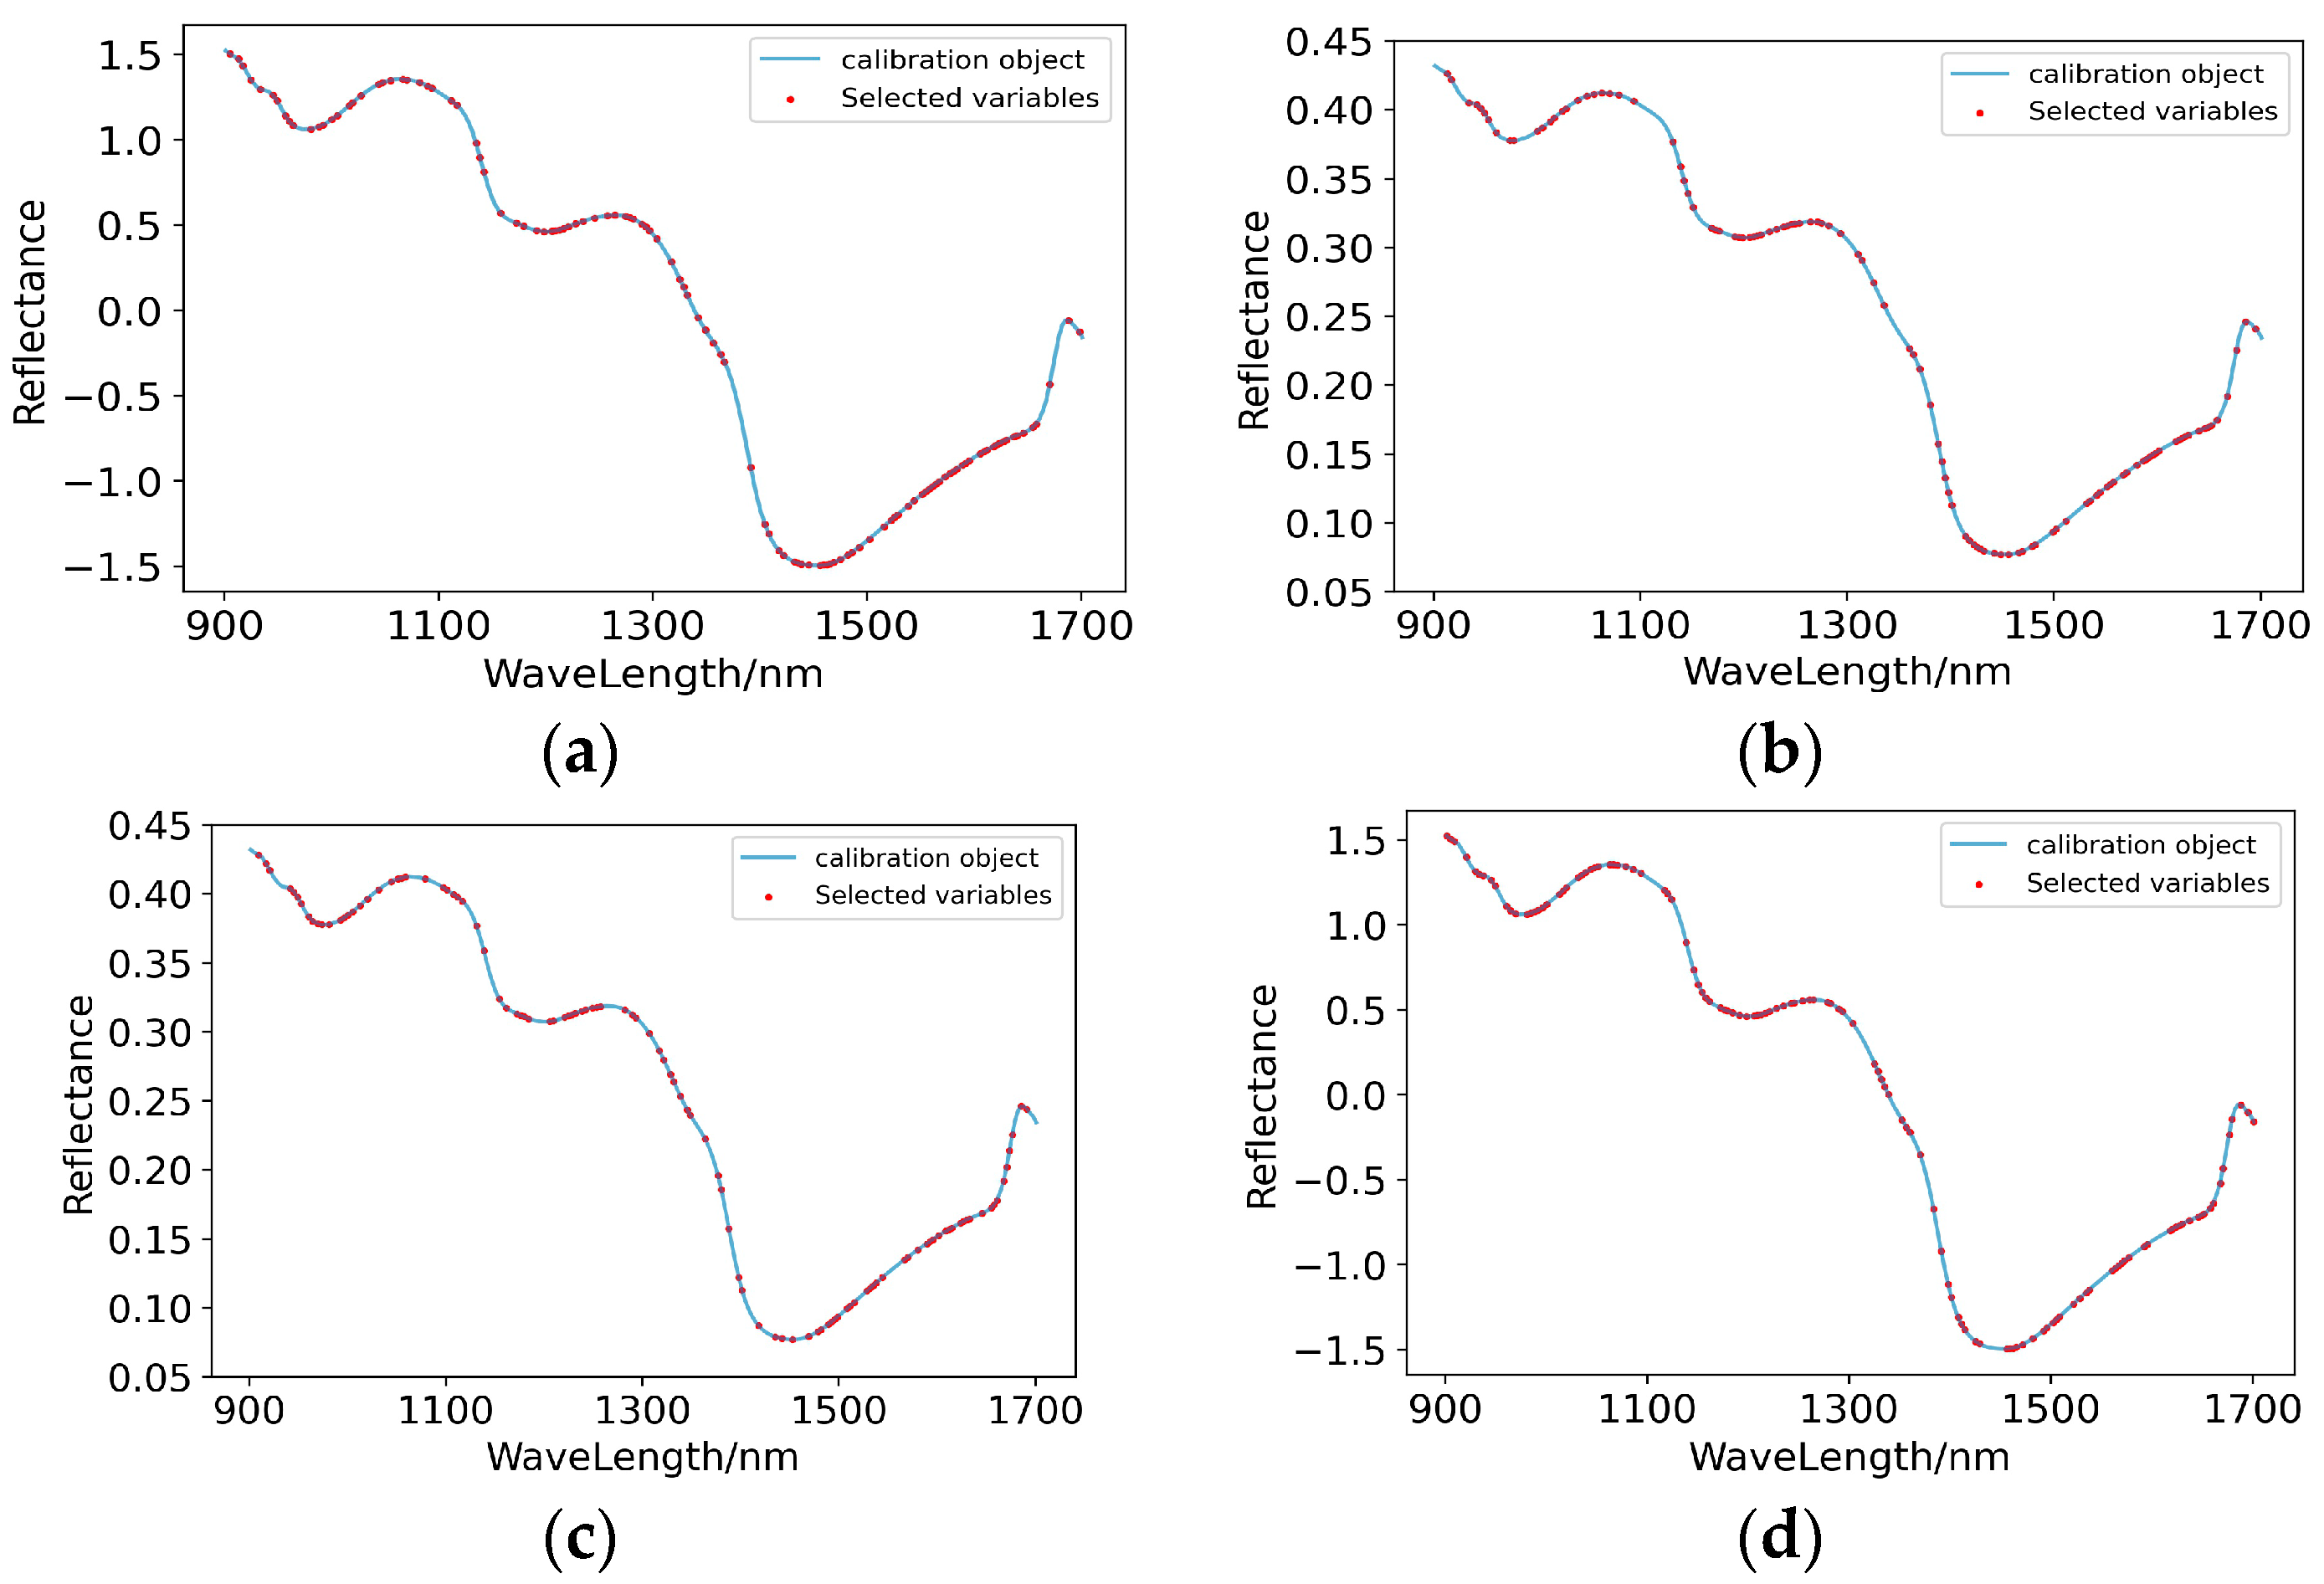
Figure 14.
Characteristic wavelengths’ distribution of prediction models for the content of boron in pear peel. (a) SNV-GA-PLSR; (b) MSC-GA-PLSR; (c) SG+MSC-GA-PLSR; (d) SG+SNV-GA-PLSR.
Figure 14.
Characteristic wavelengths’ distribution of prediction models for the content of boron in pear peel. (a) SNV-GA-PLSR; (b) MSC-GA-PLSR; (c) SG+MSC-GA-PLSR; (d) SG+SNV-GA-PLSR.
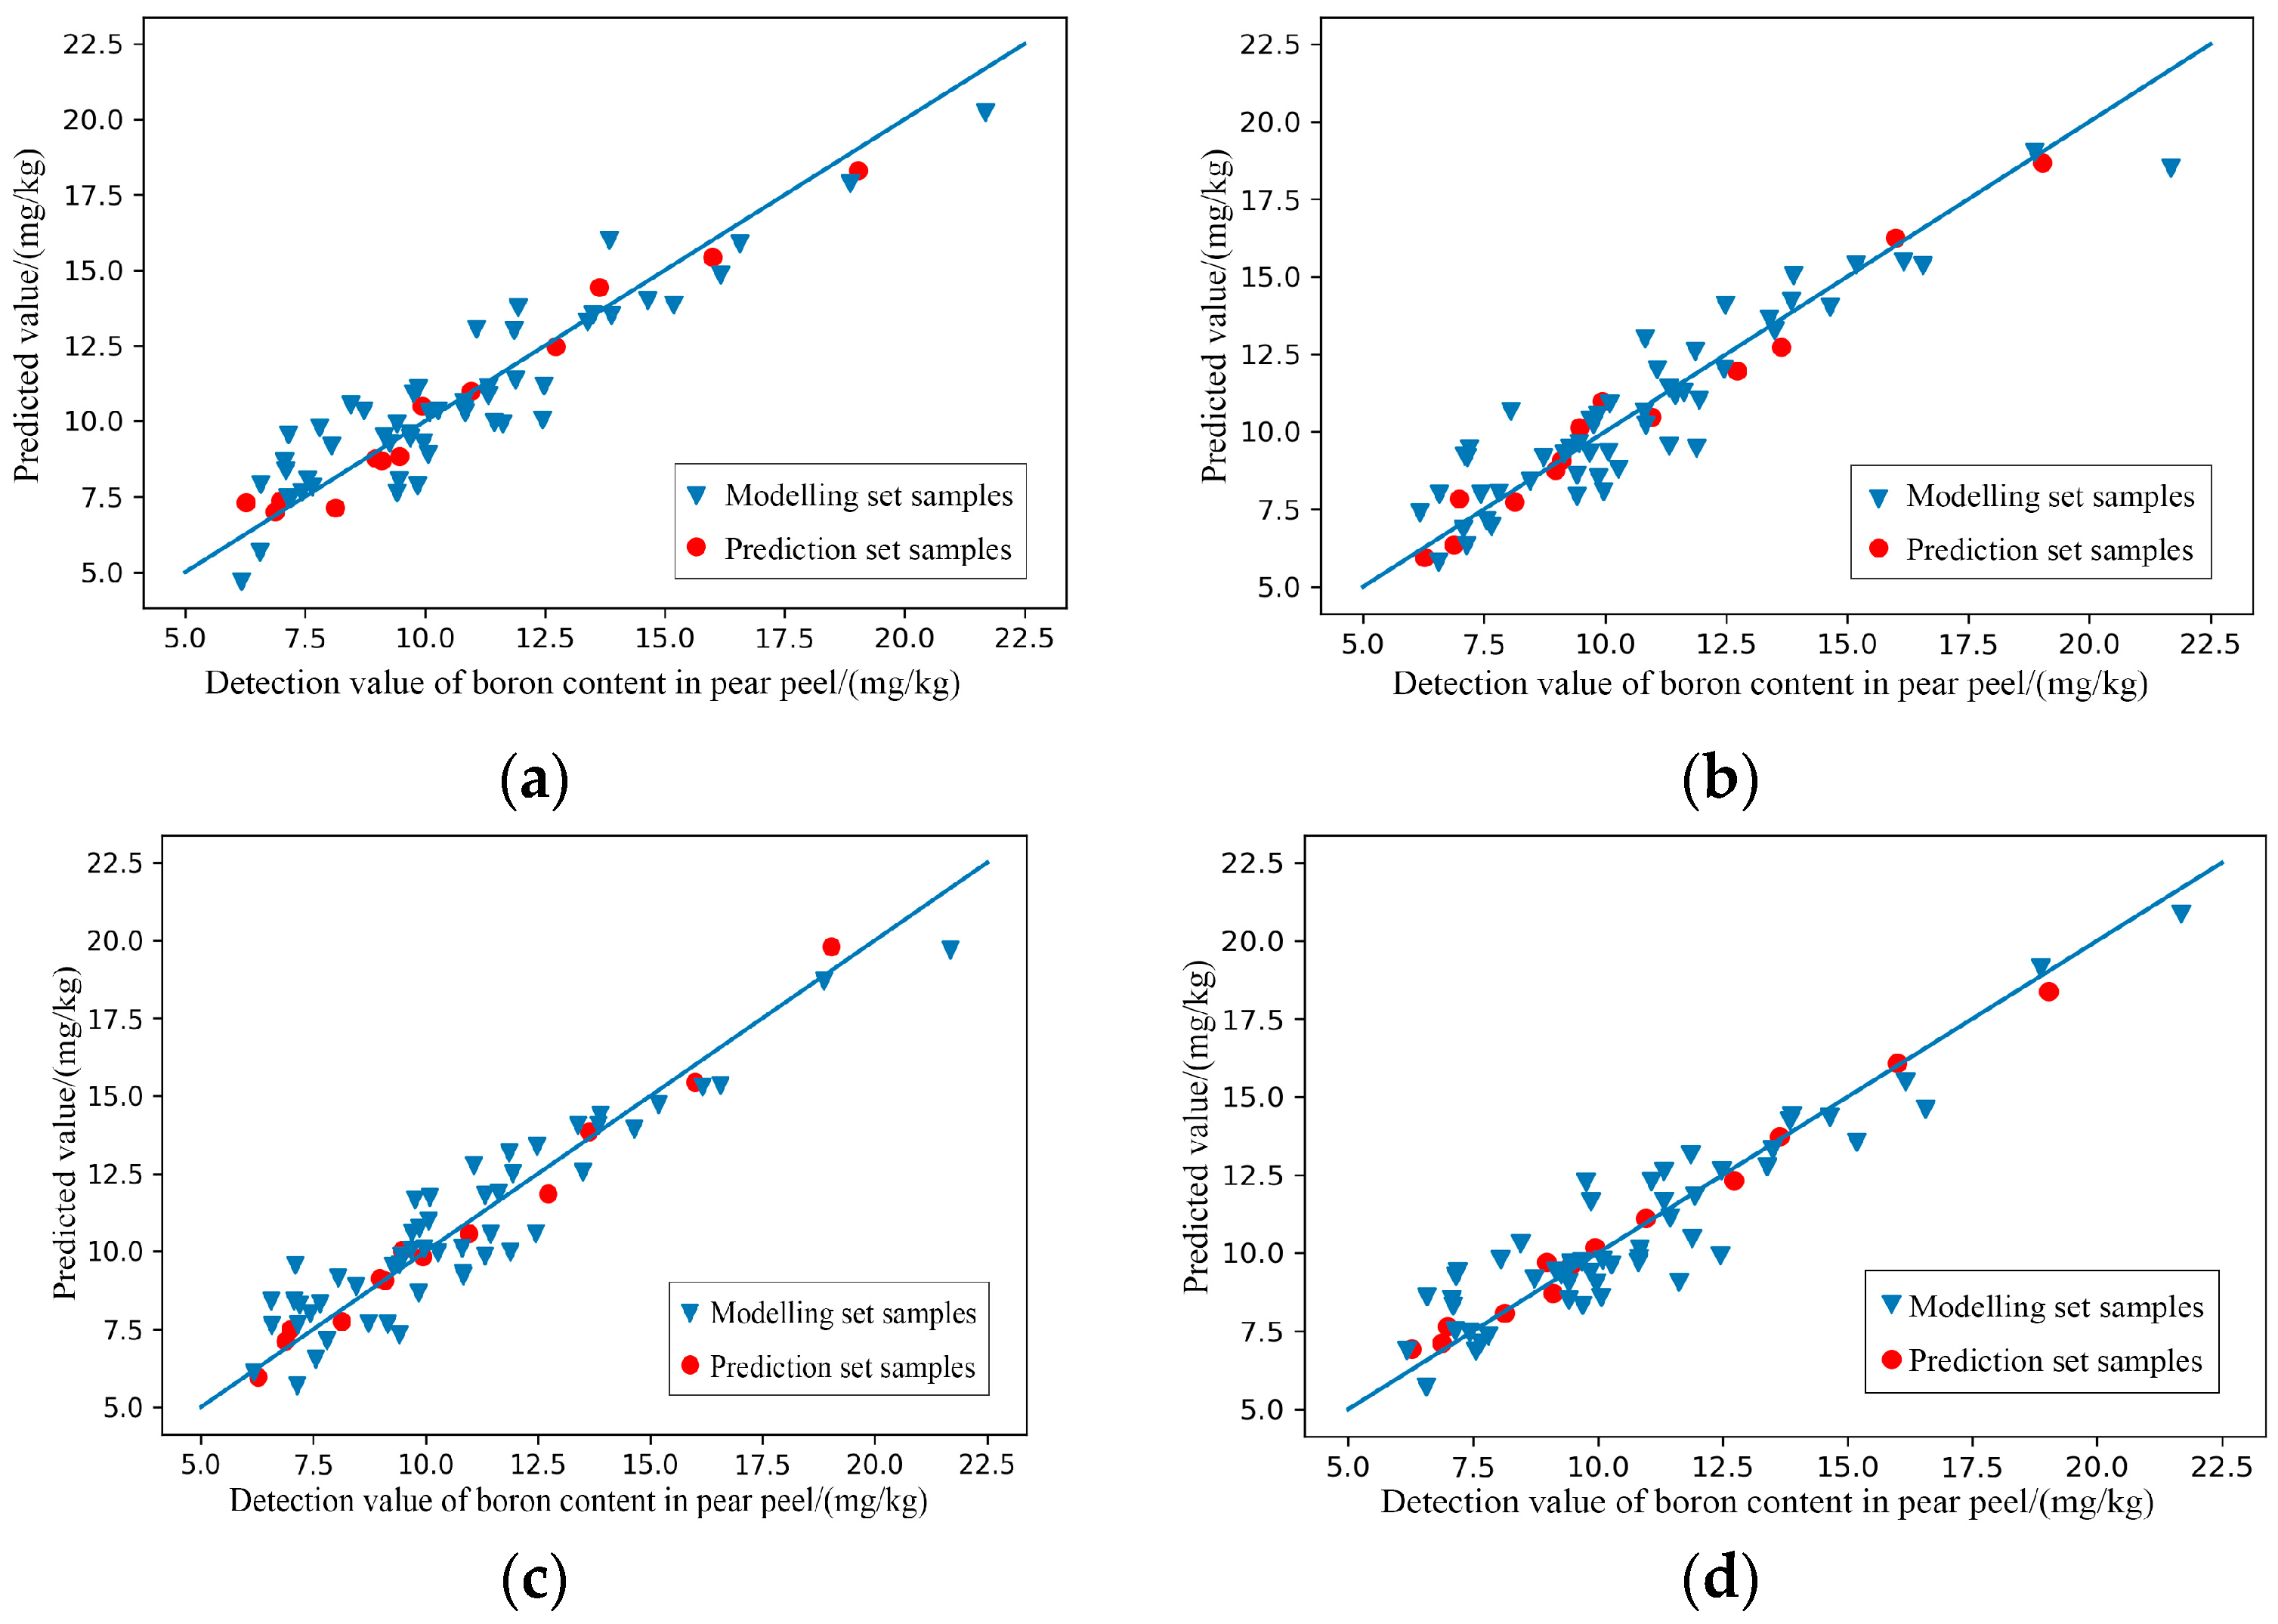
Figure 15.
Scatter plots of models’ prediction results of the content of boron in pear peel samples. (a) SNV-GA-PLSR; (b) MSC-GA-PLSR; (c) SG+MSC-GA-PLSR; (d) SG+SNV-GA-PLSR.
Figure 15.
Scatter plots of models’ prediction results of the content of boron in pear peel samples. (a) SNV-GA-PLSR; (b) MSC-GA-PLSR; (c) SG+MSC-GA-PLSR; (d) SG+SNV-GA-PLSR.
Figure 16.
Characteristic wavelengths’ distribution of prediction models for the content of potassium in pear peel. (a) SNV-GA-PLSR; (b) SG+SNV-GA-PLSR.
Figure 16.
Characteristic wavelengths’ distribution of prediction models for the content of potassium in pear peel. (a) SNV-GA-PLSR; (b) SG+SNV-GA-PLSR.
Figure 17.
Scatter plots of models’ prediction results of the content of potassium in pear peel samples. (a) SNV-GA-PLSR; (b) SG+SNV-GA-PLSR.
Figure 17.
Scatter plots of models’ prediction results of the content of potassium in pear peel samples. (a) SNV-GA-PLSR; (b) SG+SNV-GA-PLSR.
Table 1.
Overview of mineral elements’ content detection.
Table 1.
Overview of mineral elements’ content detection.
| | Calcium in Pulp | Boron in Pulp | Potassium in Pulp | Calcium in Peel | Boron in Peel | Potassium in Peel |
|---|
| Maximum (mg/kg) | 40.5 | 7.865 | 2308 | 1324.85 | 21.675 | 10,073 |
| Minimum (mg/kg) | 14 | 2.115 | 1365.8 | 281.15 | 6.175 | 2691.85 |
| Average (mg/kg) | 26.687 | 3.995 | 1783.7 | 653.44 | 10.646 | 5323.39 |
Table 2.
Comparison of the prediction and modelling sets for the content of calcium, boron and potassium in pear pulp based on full-wave band.
Table 2.
Comparison of the prediction and modelling sets for the content of calcium, boron and potassium in pear pulp based on full-wave band.
| Models | Prediction Results for the Content of Calcium in Pear Pulp | Prediction Results for the Content of Boron in Pear Pulp | Prediction Results for the Content of Potassium in Pear Pulp |
|---|
| R2 of Modelling Set | RPD of Modelling Set | R2 of Prediction Set | RPD of Modelling Set | R2 of Modelling Set | RPD of Modelling Set | R2 of Prediction Set | RPD of Prediction Set | R2 of Modelling Set | RPD of Modelling Set | R2 of Prediction Set | RPD of Prediction Set |
|---|
| Raw-PLSR | 0.92 | 2.574 | 0.716 | 1.431 | 0.904 | 2.344 | 0.734 | 1.472 | 0.86 | 1.97 | 0.767 | 1.557 |
| SNV-PLSR | 0.932 | 2.768 | 0.684 | 1.371 | 0.516 | 1.167 | 0.495 | 1.151 | 0.97 | 4.452 | 0.382 | 1.082 |
| FD-PLSR | 0.76 | 1.535 | 0.348 | 1.066 | 0.207 | 1.022 | 0.212 | 1.023 | 0.99 | 7.089 | 0.141 | 1.01 |
| MSC-PLSR | 0.936 | 2.832 | 0.651 | 1.317 | 0.568 | 1.215 | 0.492 | 1.149 | 0.99 | 7.089 | 0.141 | 1.01 |
| SD-PLSR | 0.694 | 1.388 | 0.304 | 1.05 | 0.712 | 1.424 | - | - | 0.97 | 4.452 | 0.382 | 1.082 |
| SG-PLSR | 0.921 | 2.574 | 0.717 | 1.433 | 0.904 | 2.344 | 0.735 | 1.475 | 0.86 | 1.973 | 0.767 | 1.558 |
| LG-PLSR | 0.991 | 7.376 | 0.582 | 1.23 | 0.871 | 2.036 | 0.497 | 1.152 | 0.86 | 1.975 | 0.658 | 1.328 |
| SG+MSC-PLSR | 0.936 | 2.832 | 0.651 | 1.317 | 0.568 | 1.215 | 0.492 | 1.149 | 0.99 | 7.089 | 0.141 | 1.01 |
| SG+SNV-PLSR | 0.932 | 2.768 | 0.684 | 1.371 | 0.516 | 1.167 | 0.495 | 1.151 | 1 | - | 0.31 | 1.053 |
| SG+MSC+FD-PLSR | 0.705 | 1.409 | 0.338 | 1.063 | 0.187 | 1.018 | 0.216 | 1.024 | 0.98 | 4.946 | 0.62 | 1.275 |
| SG+MSC+SD-PLSR | 0.676 | 1.356 | 0.301 | 1.048 | 0.705 | 1.41 | - | - | 0.74 | 1.487 | 0.432 | 1.109 |
| SG+SNV+FD-PLSR | 0.707 | 1.415 | 0.346 | 1.066 | 0.191 | 1.019 | 0.218 | 1.025 | 0.98 | 4.961 | 0.625 | 1.282 |
| SG+SNV+SD-PLSR | 0.678 | 1.36 | 0.299 | 1.048 | 0.705 | 1.411 | - | - | 0.98 | 4.961 | 0.625 | 1.282 |
| Raw-GBRT | 0.982 | 5.318 | 0.511 | 1.163 | 0.562 | 1.209 | 0.278 | 1.038 | 0.012 | 1 | - | - |
| SNV-GBRT | 0.979 | 4.938 | - | 0 | 0.975 | 4.477 | 0.448 | 1.119 | 0.014 | 1 | - | - |
| FD-GBRT | 0.99 | 7.089 | 0.411 | 1.097 | 0.989 | 7.063 | 0.131 | 1.009 | 0.017 | 1 | - | - |
| MSC-GBRT | 0.419 | 1.101 | - | 0 | 0.908 | 2.392 | 0.539 | 1.187 | 0.015 | 1 | - | - |
| SD-GBRT | 0.961 | 3.617 | - | 0 | 0.995 | 10.28 | 0.483 | 1.142 | 0.999 | 7.091 | 0.05 | 1.001 |
| SG-GBRT | 0.982 | 5.318 | 0.512 | 1.164 | 0.562 | 1.209 | 0.268 | 1.038 | 0.998 | 15.819 | 0.609 | 1.261 |
| LG-GBRT | 0.956 | 3.426 | 0.441 | 1.114 | 0.432 | 1.109 | 0.264 | 1.037 | 0.979 | 4.85 | 0.547 | 1.195 |
| SG+MSC-GBRT | 0.016 | 1 | - | 0 | 0.908 | 2.392 | 0.539 | 1.187 | 0.015 | 1 | - | - |
| SG+SNV-GBRT | 0.979 | 4.938 | - | 0 | 0.975 | 4.477 | 0.448 | 1.119 | 0.014 | 1 | - | - |
| SG+MSC+FD-GBRT | 0.983 | 5.385 | 0.6 | 1.244 | 0.949 | 3.165 | 0.436 | 1.111 | 0.016 | 1 | - | - |
| SG+MSC+SD-GBRT | 0.999 | 7.089 | - | 0 | 0.858 | 1.948 | 0.276 | 1.04 | 0.989 | 6.705 | 0.293 | 1.046 |
| SG+SNV+FD-GBRT | 0.999 | 7.09 | 0.362 | 1.073 | 0.987 | 6.193 | 0.222 | 1.026 | 0.016 | 1 | - | - |
| SG+SNV+SD-GBRT | 0.996 | 10.659 | - | 0 | 0.858 | 1.948 | 0.276 | 1.04 | 0.989 | 6.705 | 0.293 | 1.046 |
Table 3.
Modelling prediction results of the content of calcium in pear pulp based on the selected characteristic wavelengths by using GA.
Table 3.
Modelling prediction results of the content of calcium in pear pulp based on the selected characteristic wavelengths by using GA.
| Models | Modelling Set | Prediction Set | Level of Models |
|---|
| R2 | RPD | R2 | RPD |
|---|
| Raw-GA-PLSR | 0.898 | 2.271 | 0.987 | 6.110 | A |
| SG-GA-PLSR | 0.895 | 2.246 | 0.973 | 4.325 | A |
Table 4.
Modelling prediction results of the content of boron in pear pulp based on the selected characteristic wavelengths.
Table 4.
Modelling prediction results of the content of boron in pear pulp based on the selected characteristic wavelengths.
| Methods of Extracting Characteristic Wavelengths | Models | Modelling Set | Prediction Set | Level of Models |
|---|
| R2 | RPD | R2 | RPD |
|---|
| GA | Raw-GA-PLSR | 0.768 | 1.560 | 0.984 | 5.560 | A |
| SG-GA-PLSR | 0.846 | 1.878 | 0.986 | 6.033 | A |
Table 5.
Modelling prediction results of the content of potassium in pear pulp based on the selected characteristic wavelengths.
Table 5.
Modelling prediction results of the content of potassium in pear pulp based on the selected characteristic wavelengths.
| Methods of Extracting Characteristic Wavelengths | Models | Modelling Set | Prediction Set | Level of Models |
|---|
| R2 | RPD | R2 | RPD |
|---|
| GA | Raw-GA-PLSR | 0.823 | 1.760 | 0.978 | 4.756 | A |
| SG-GA-PLSR | 0.834 | 1.810 | 0.985 | 5.833 | A |
Table 6.
Comparison of the prediction and modelling sets for the content of calcium, boron and potassium in pear peel based on full-wave band.
Table 6.
Comparison of the prediction and modelling sets for the content of calcium, boron and potassium in pear peel based on full-wave band.
| Models | Prediction Results for the Content of Calcium in Pear Peel | Prediction Results for the Content of Boron in Pear Peel | Prediction Results for the Content of Potassium in Pear Peel |
|---|
| R2 of Modelling Set | RPD of Modelling Set | R2 of Prediction Set | RPD of Modelling Set | R2 of Modelling Set | RPD of Modelling Set | R2 of Prediction Set | RPD of Prediction Set | R2 of Modelling Set | RPD of Modelling Set | R2 of Prediction Set | RPD of Prediction Set |
|---|
| Raw-PLSR | 0.81 | 1.705 | 0.708 | 1.416 | 0.829 | 1.79 | 0.186 | 1.018 | 0.097 | 1.005 | 0.12 | 1.007 |
| SNV-PLSR | 0.76 | 1.53 | 0.811 | 1.711 | 0.897 | 2.257 | 0.707 | 1.414 | 0.895 | 2.241 | 0.756 | 1.529 |
| FD-PLSR | 0.15 | 1.011 | 0.456 | 1.124 | 0.996 | 11.154 | 0.155 | 1.012 | 0.512 | 1.164 | 0.274 | 1.04 |
| MSC-PLSR | 0.78 | 1.603 | 0.78 | 1.599 | 0.942 | 2.989 | 0.701 | 1.402 | 0.718 | 1.436 | 0.472 | 1.135 |
| SD-PLSR | 0.61 | 1.258 | 0.12 | 1.007 | 0.665 | 1.338 | 0.038 | 1.001 | 0.669 | 1.345 | 0.095 | 1.005 |
| SG-PLSR | 0.91 | 2.458 | 0.808 | 1.696 | 0.829 | 1.79 | 0.186 | 1.018 | 0.097 | 1.005 | 0.12 | 1.007 |
| LG-PLSR | 0.96 | 3.437 | 0.796 | 1.651 | 0.857 | 1.94 | 0.221 | 1.025 | 0.521 | 1.171 | 0.117 | 1.007 |
| SG+MSC-PLSR | 0.78 | 1.603 | 0.78 | 1.599 | 0.942 | 2.989 | 0.701 | 1.402 | 0.718 | 1.436 | 0.472 | 1.135 |
| SG+SNV-PLSR | 0.76 | 1.53 | 0.812 | 1.713 | 0.897 | 2.257 | 0.709 | 1.415 | 0.895 | 2.241 | 0.757 | 1.531 |
| SG+MSC+FD-PLSR | 0.14 | 1.01 | 0.421 | 1.103 | 0.833 | 1.808 | 0.145 | 1.011 | 0.825 | 1.771 | 0.036 | 1.001 |
| SG+MSC+SD-PLSR | 0.6 | 1.248 | 0.104 | 1.005 | 0.848 | 1.885 | 0.006 | 1 | 0.999 | 7.089 | 0.064 | 1.002 |
| SG+SNV+FD-PLSR | 0.14 | 1.01 | 0.421 | 1.102 | 0.849 | 1.895 | 0.148 | 1.011 | 0.582 | 1.23 | 0.041 | 1.001 |
| SG+SNV+SD-PLSR | 0.6 | 1.248 | 0.104 | 1.005 | 0.849 | 1.895 | 0.148 | 1.011 | 0.999 | 7.089 | 0.064 | 1.002 |
| Raw-GBRT | 0.99 | 7.16 | 0.423 | 1.104 | 0.54 | 1.188 | 0.075 | 1.003 | 0.884 | 2.143 | 0.24 | 1.03 |
| SNV-GBRT | 0.99 | 15.802 | 0.431 | 1.295 | 0.103 | 1.005 | −0.05 | - | 0.258 | 1.035 | −0.007 | - |
| FD-GBRT | 0.99 | 7.089 | 0.499 | 1.154 | 0.827 | 1.777 | 0.345 | 1.065 | 0.711 | 1.422 | 0.065 | 1.002 |
| MSC-GBRT | 0.99 | 7.089 | 0.512 | 1.164 | 0.014 | 1 | −0.007 | - | 0.411 | 1.097 | −0.057 | - |
| SD-GBRT | 0.93 | 2.691 | 0.411 | 1.097 | 0.991 | 7.532 | 0.236 | 1.029 | 0.063 | 1.002 | −0.037 | - |
| SG-GBRT | 0.99 | 7.089 | 0.423 | 1.104 | 0.54 | 1.188 | 0.075 | 1.003 | 0.884 | 2.143 | 0.24 | 1.03 |
| LG-GBRT | 0.99 | 7.089 | 0.48 | 1.14 | 0.826 | 1.776 | 0.039 | 1.001 | 0.884 | 2.143 | 0.245 | 1.031 |
| SG+MSC-GBRT | 0.99 | 7.089 | 0.512 | 1.164 | 0.014 | 1 | −0.007 | - | 0.073 | 1.003 | −0.023 | - |
| SG+SNV-GBRT | 0.99 | 7.089 | 0.431 | 1.108 | 0.103 | 1.005 | −0.05 | - | 0.258 | 1.035 | −0.007 | - |
| SG+MSC+FD-GBRT | 0.99 | 18.101 | 0.509 | 1.162 | 0.931 | 2.747 | 0.071 | 1.003 | 0.913 | 2.447 | 0.263 | 1.037 |
| SG+MSC+SD-GBRT | 0.99 | 7.089 | 0.351 | 1.068 | 0.971 | 4.179 | 0.232 | 1.028 | 0.929 | 2.693 | −0.006 | - |
| SG+SNV+FD-GBRT | 0.99 | 7.089 | 0.498 | 1.153 | 0.998 | 15.819 | 0.135 | 1.009 | 0.681 | 1.366 | 0.168 | 1.014 |
| SG+SNV+SD-GBRT | 0.99 | 7.089 | 0.367 | 1.113 | 0.915 | 2.483 | 0.167 | 1.014 | 0.205 | 1.022 | −0.011 | - |
Table 7.
Modelling prediction results of the content of calcium in pear peel based on the selected characteristic wavelengths.
Table 7.
Modelling prediction results of the content of calcium in pear peel based on the selected characteristic wavelengths.
| Methods of Extracting Characteristic Wavelengths | Models | Modelling Set | Predicting Set | Level of Models |
|---|
| R2 | RPD | R2 | RPD |
|---|
| GA | SNV-GA-PLSR | 0.73 | 1.454 | 0.989 | 6.837 | A |
| MSC-GA-PLSR | 0.80 | 1.675 | 0.992 | 8.119 | A |
| SG-GA-PLSR | 0.87 | 2.054 | 0.989 | 6.672 | A |
| LG-GA-PLSR | 0.93 | 2.671 | 0.989 | 6.951 | A |
| SG+MSC-GA-PLSR | 0.79 | 1.654 | 0.991 | 7.282 | A |
| SG+SNV-GA-PLSR | 0.74 | 1.481 | 0.989 | 6.858 | A |
Table 8.
Modelling prediction results of the content of boron in pear peel based on the selected characteristic wavelengths.
Table 8.
Modelling prediction results of the content of boron in pear peel based on the selected characteristic wavelengths.
| Methods of Extracting Characteristic Wavelengths | Models | Modelling Set | Predicting Set | Level of Models |
|---|
| R2 | RPD | R2 | RPD |
|---|
| GA | SNV-GA-PLSR | 0.855 | 1.926 | 0.973 | 4.301 | A |
| MSC-GA-PLSR | 0.860 | 1.962 | 0.973 | 4.344 | A |
| SG+MSC-GA-PLSR | 0.870 | 2.027 | 0.984 | 5.598 | A |
| SG+SNV-GA-PLSR | 0.859 | 1.953 | 0.986 | 6.077 | A |
Table 9.
Modelling prediction results of the content of potassium in pear peel based on the selected characteristic wavelengths.
Table 9.
Modelling prediction results of the content of potassium in pear peel based on the selected characteristic wavelengths.
| Methods of Extracting Characteristic Wavelengths | Models | Modelling Set | Prediction Set | Level of Models |
|---|
| R2 | RPD | R2 | RPD |
|---|
| GA | SNV-GA-PLSR | 0.873 | 2.052 | 0.971 | 4.148 | A |
| SG+SNV-GA-PLSR | 0.888 | 2.175 | 0.973 | 4.294 | A |

 ,
, 


