
Quality of Low-Allergy Wheat (‘O-Free’) Flour and Optimization of Its Bread-Baking Performance


Abstract
:1. Introduction
2. Materials and Methods
2.1. Materials
2.2. Evaluation of Flour Quality Characteristics
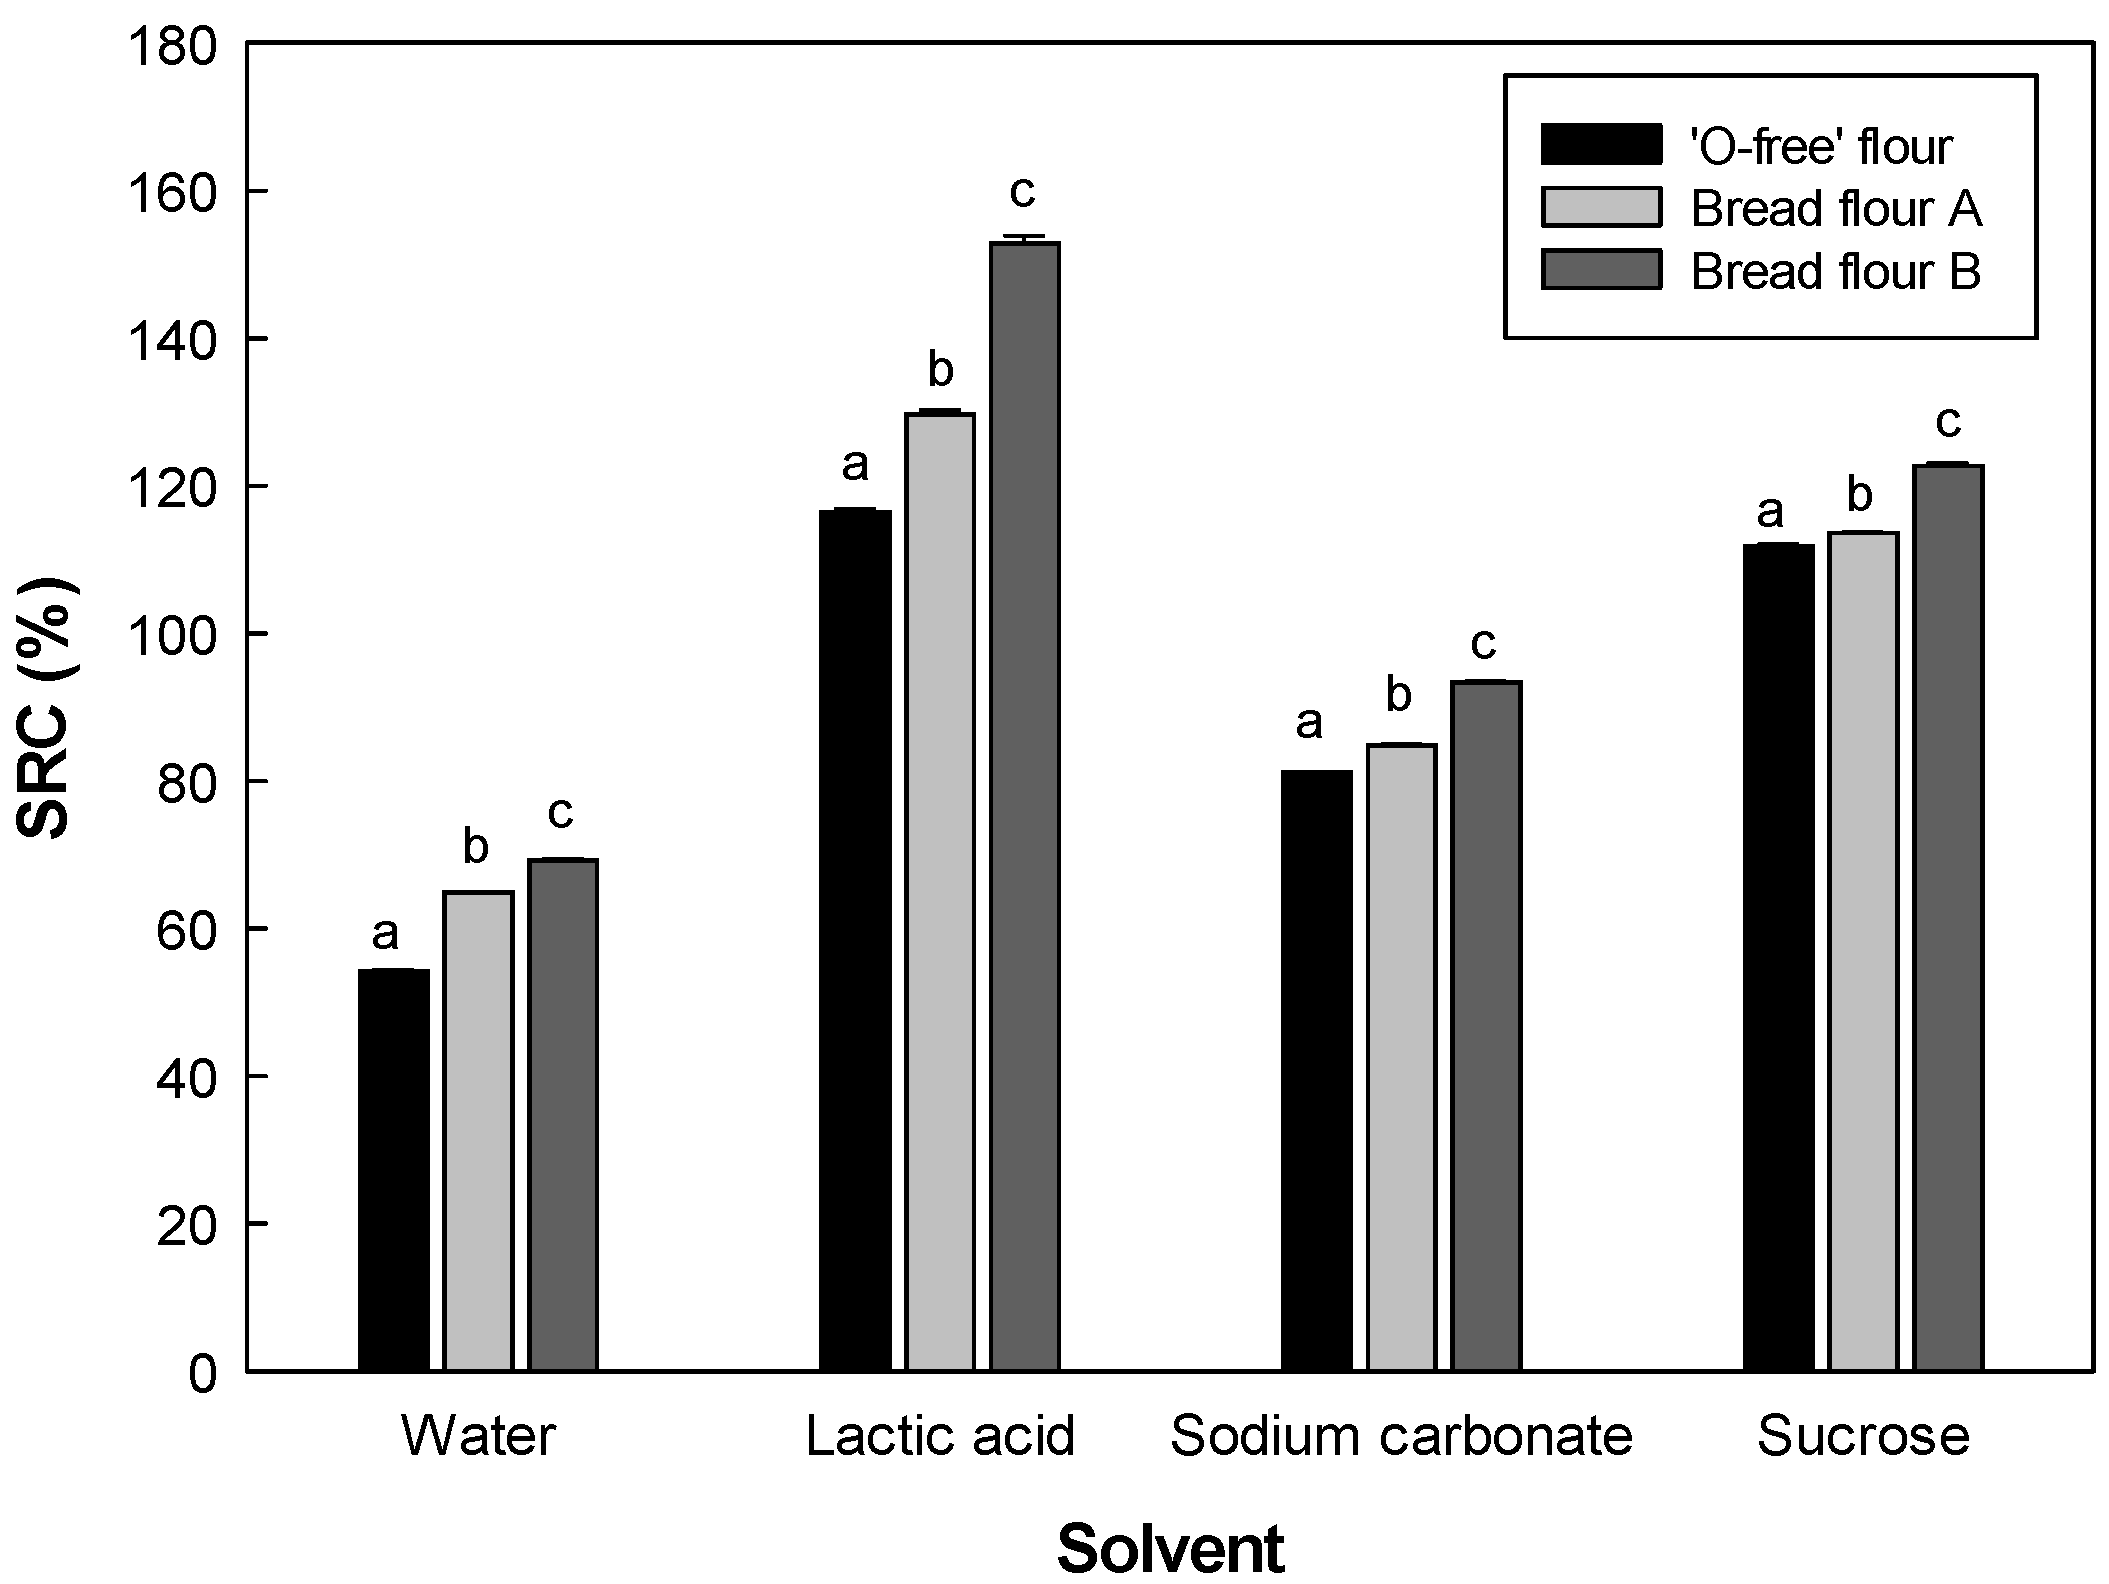
2.2.1. SRC Analysis of Flour
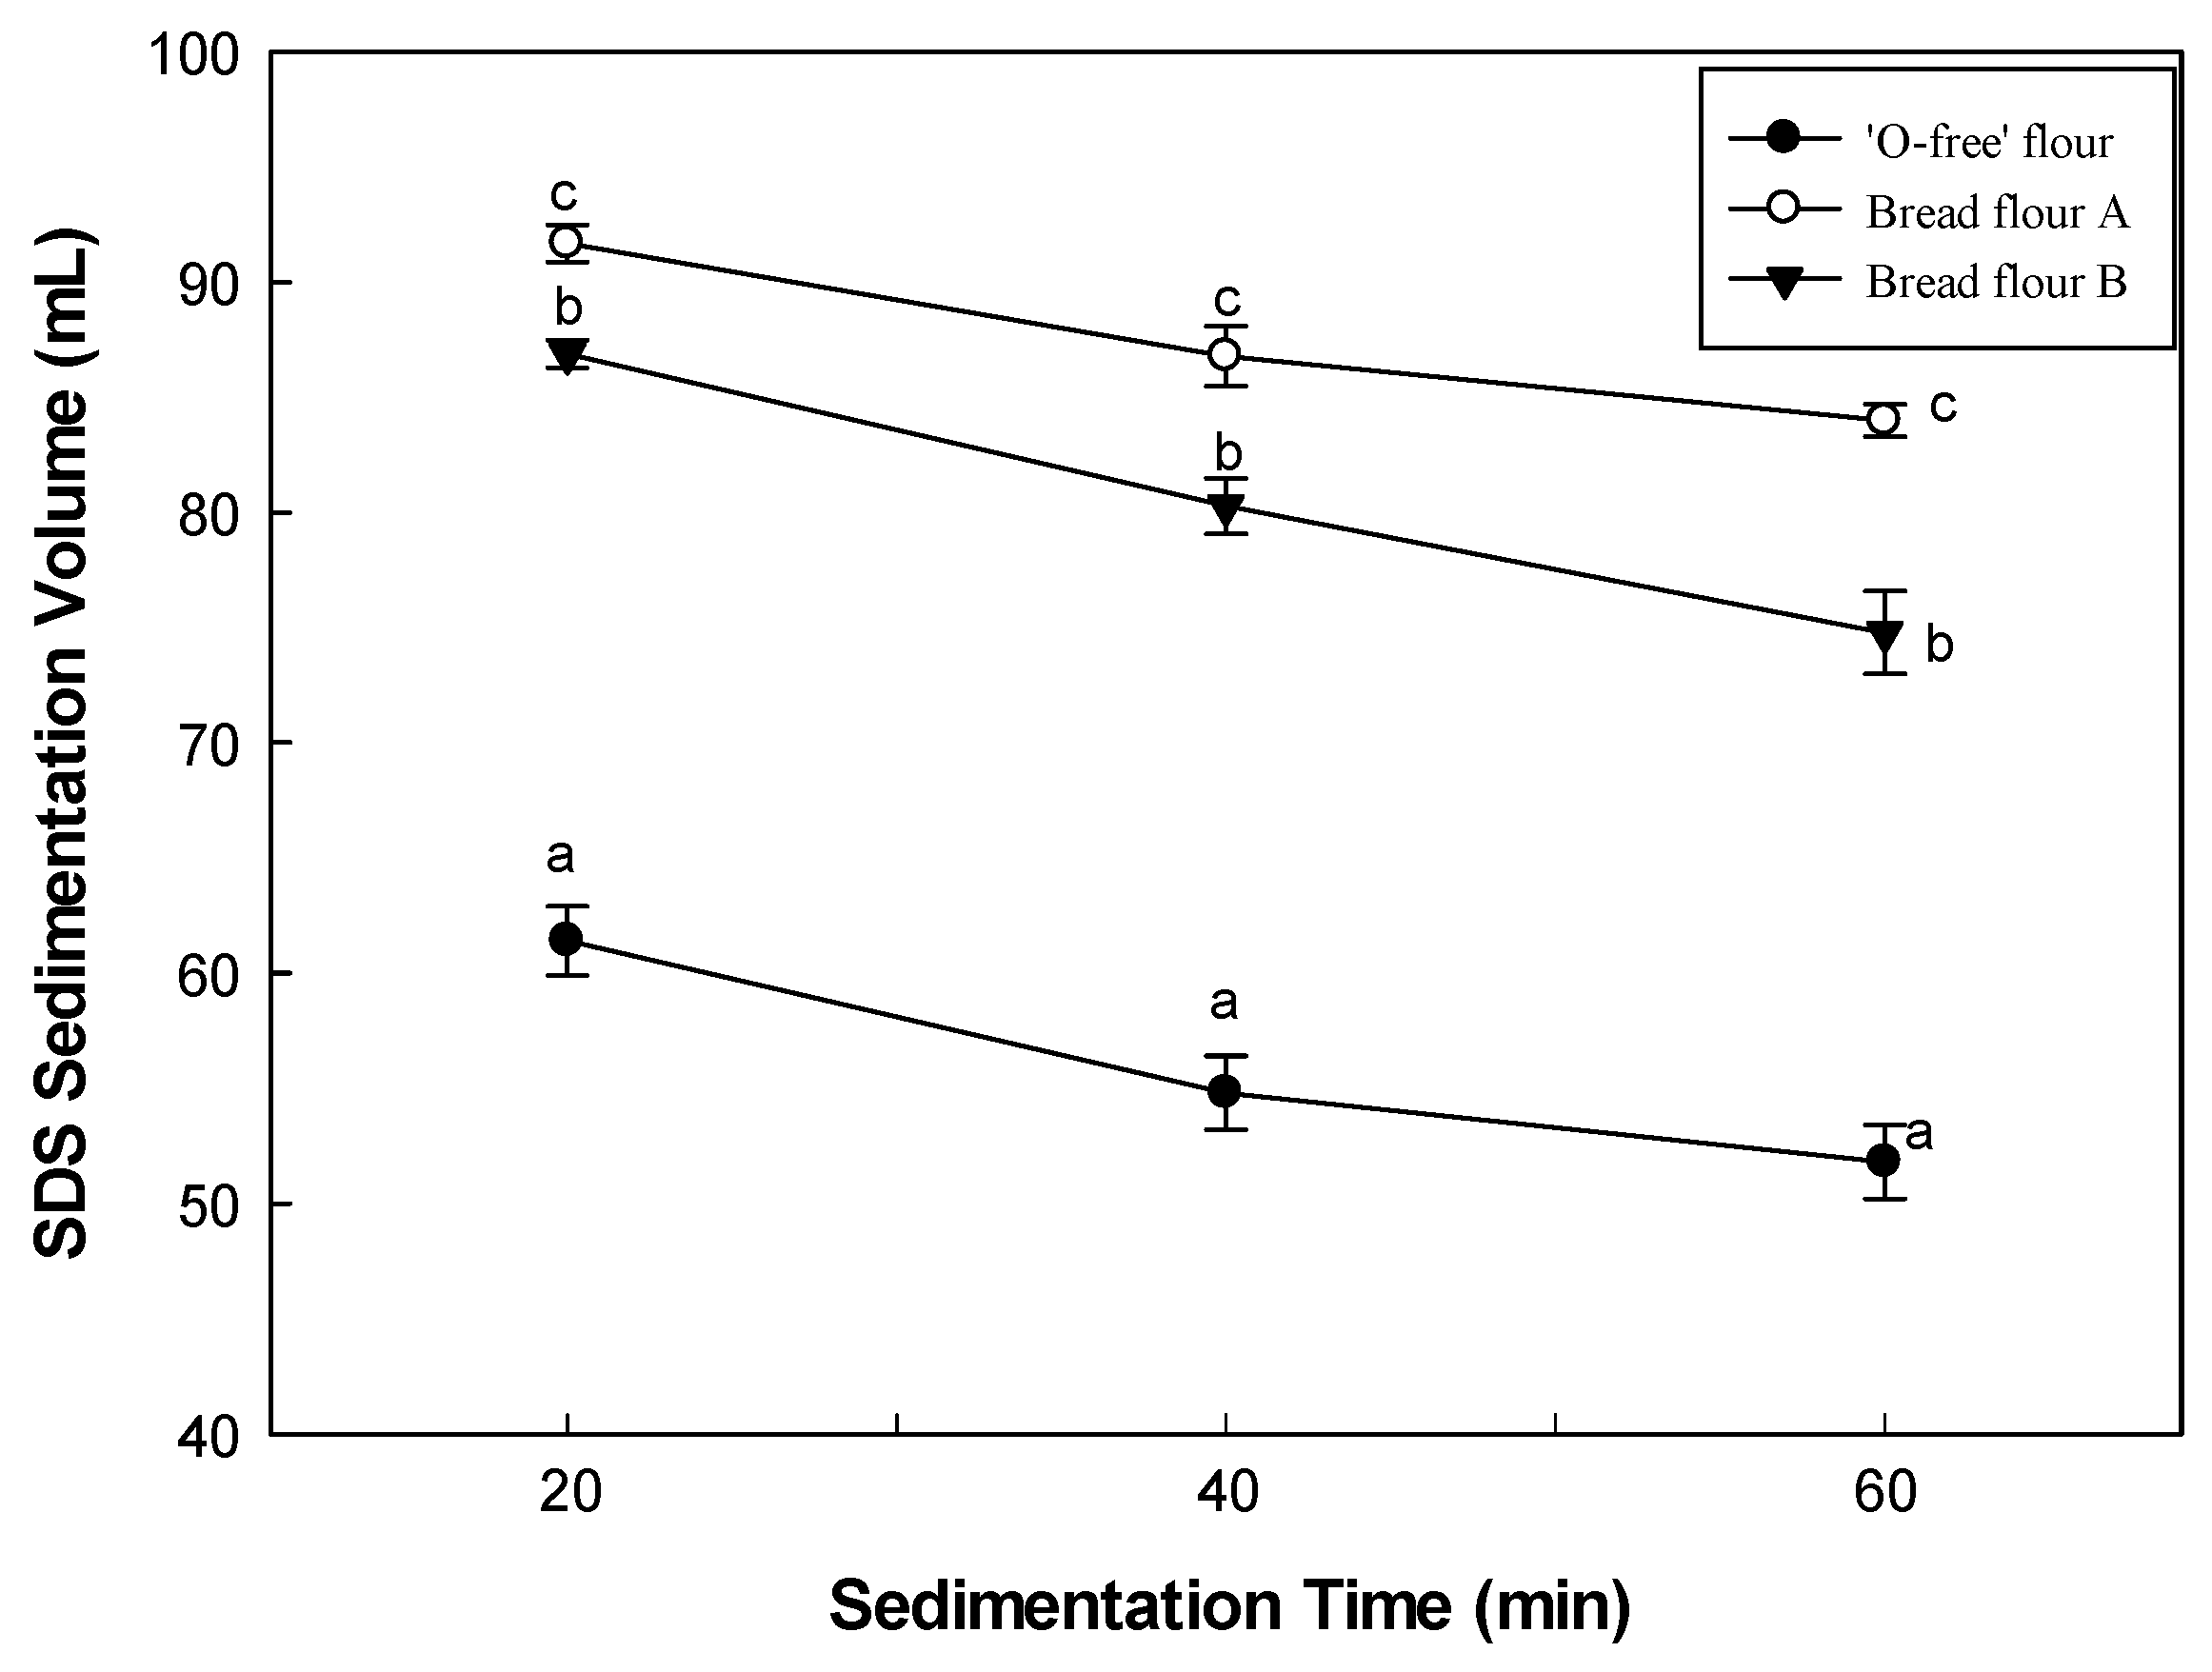
2.2.2. Measurement of SDS-Sedimentation Volume of Flours
2.2.3. Measurement of Dough Mixing Property
2.3. Bread Making and Quality Evaluation
2.3.1. Preparation of Bread
2.3.2. Evaluation of Bread Quality Characteristics
2.4. Design for Optimizing Formula and Processing Conditions of Bread
2.5. Statistical Analysis
3. Results and Discussion
3.1. SRC of the Flours
3.2. SDS-Sedimentation Volume of Flours
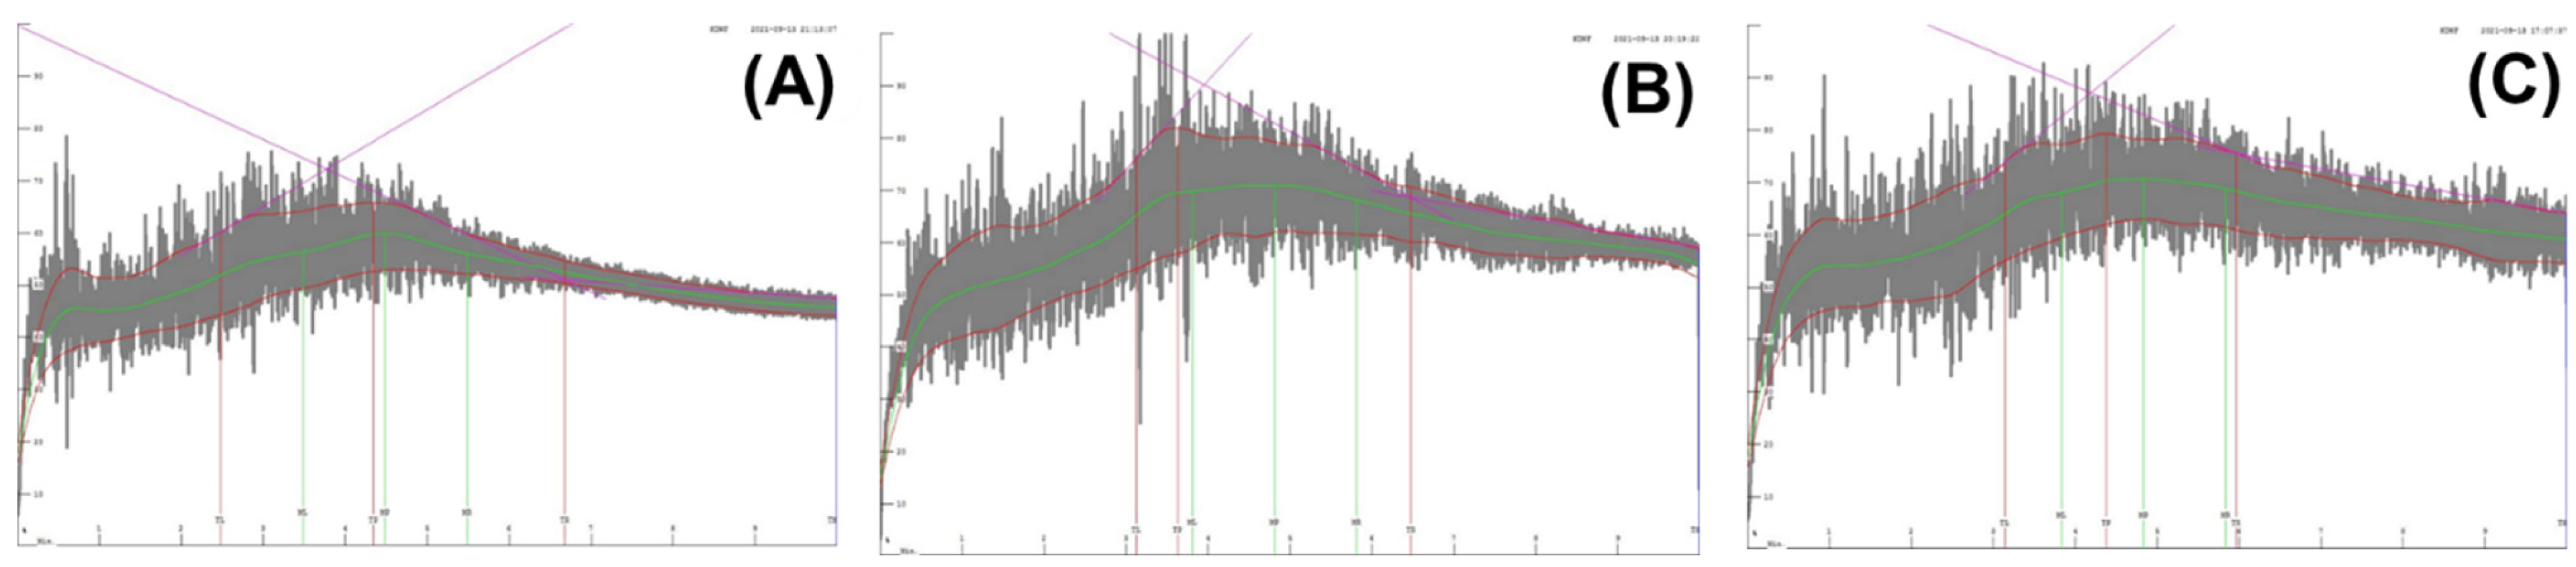
3.3. Dough Mixing Property of Flours
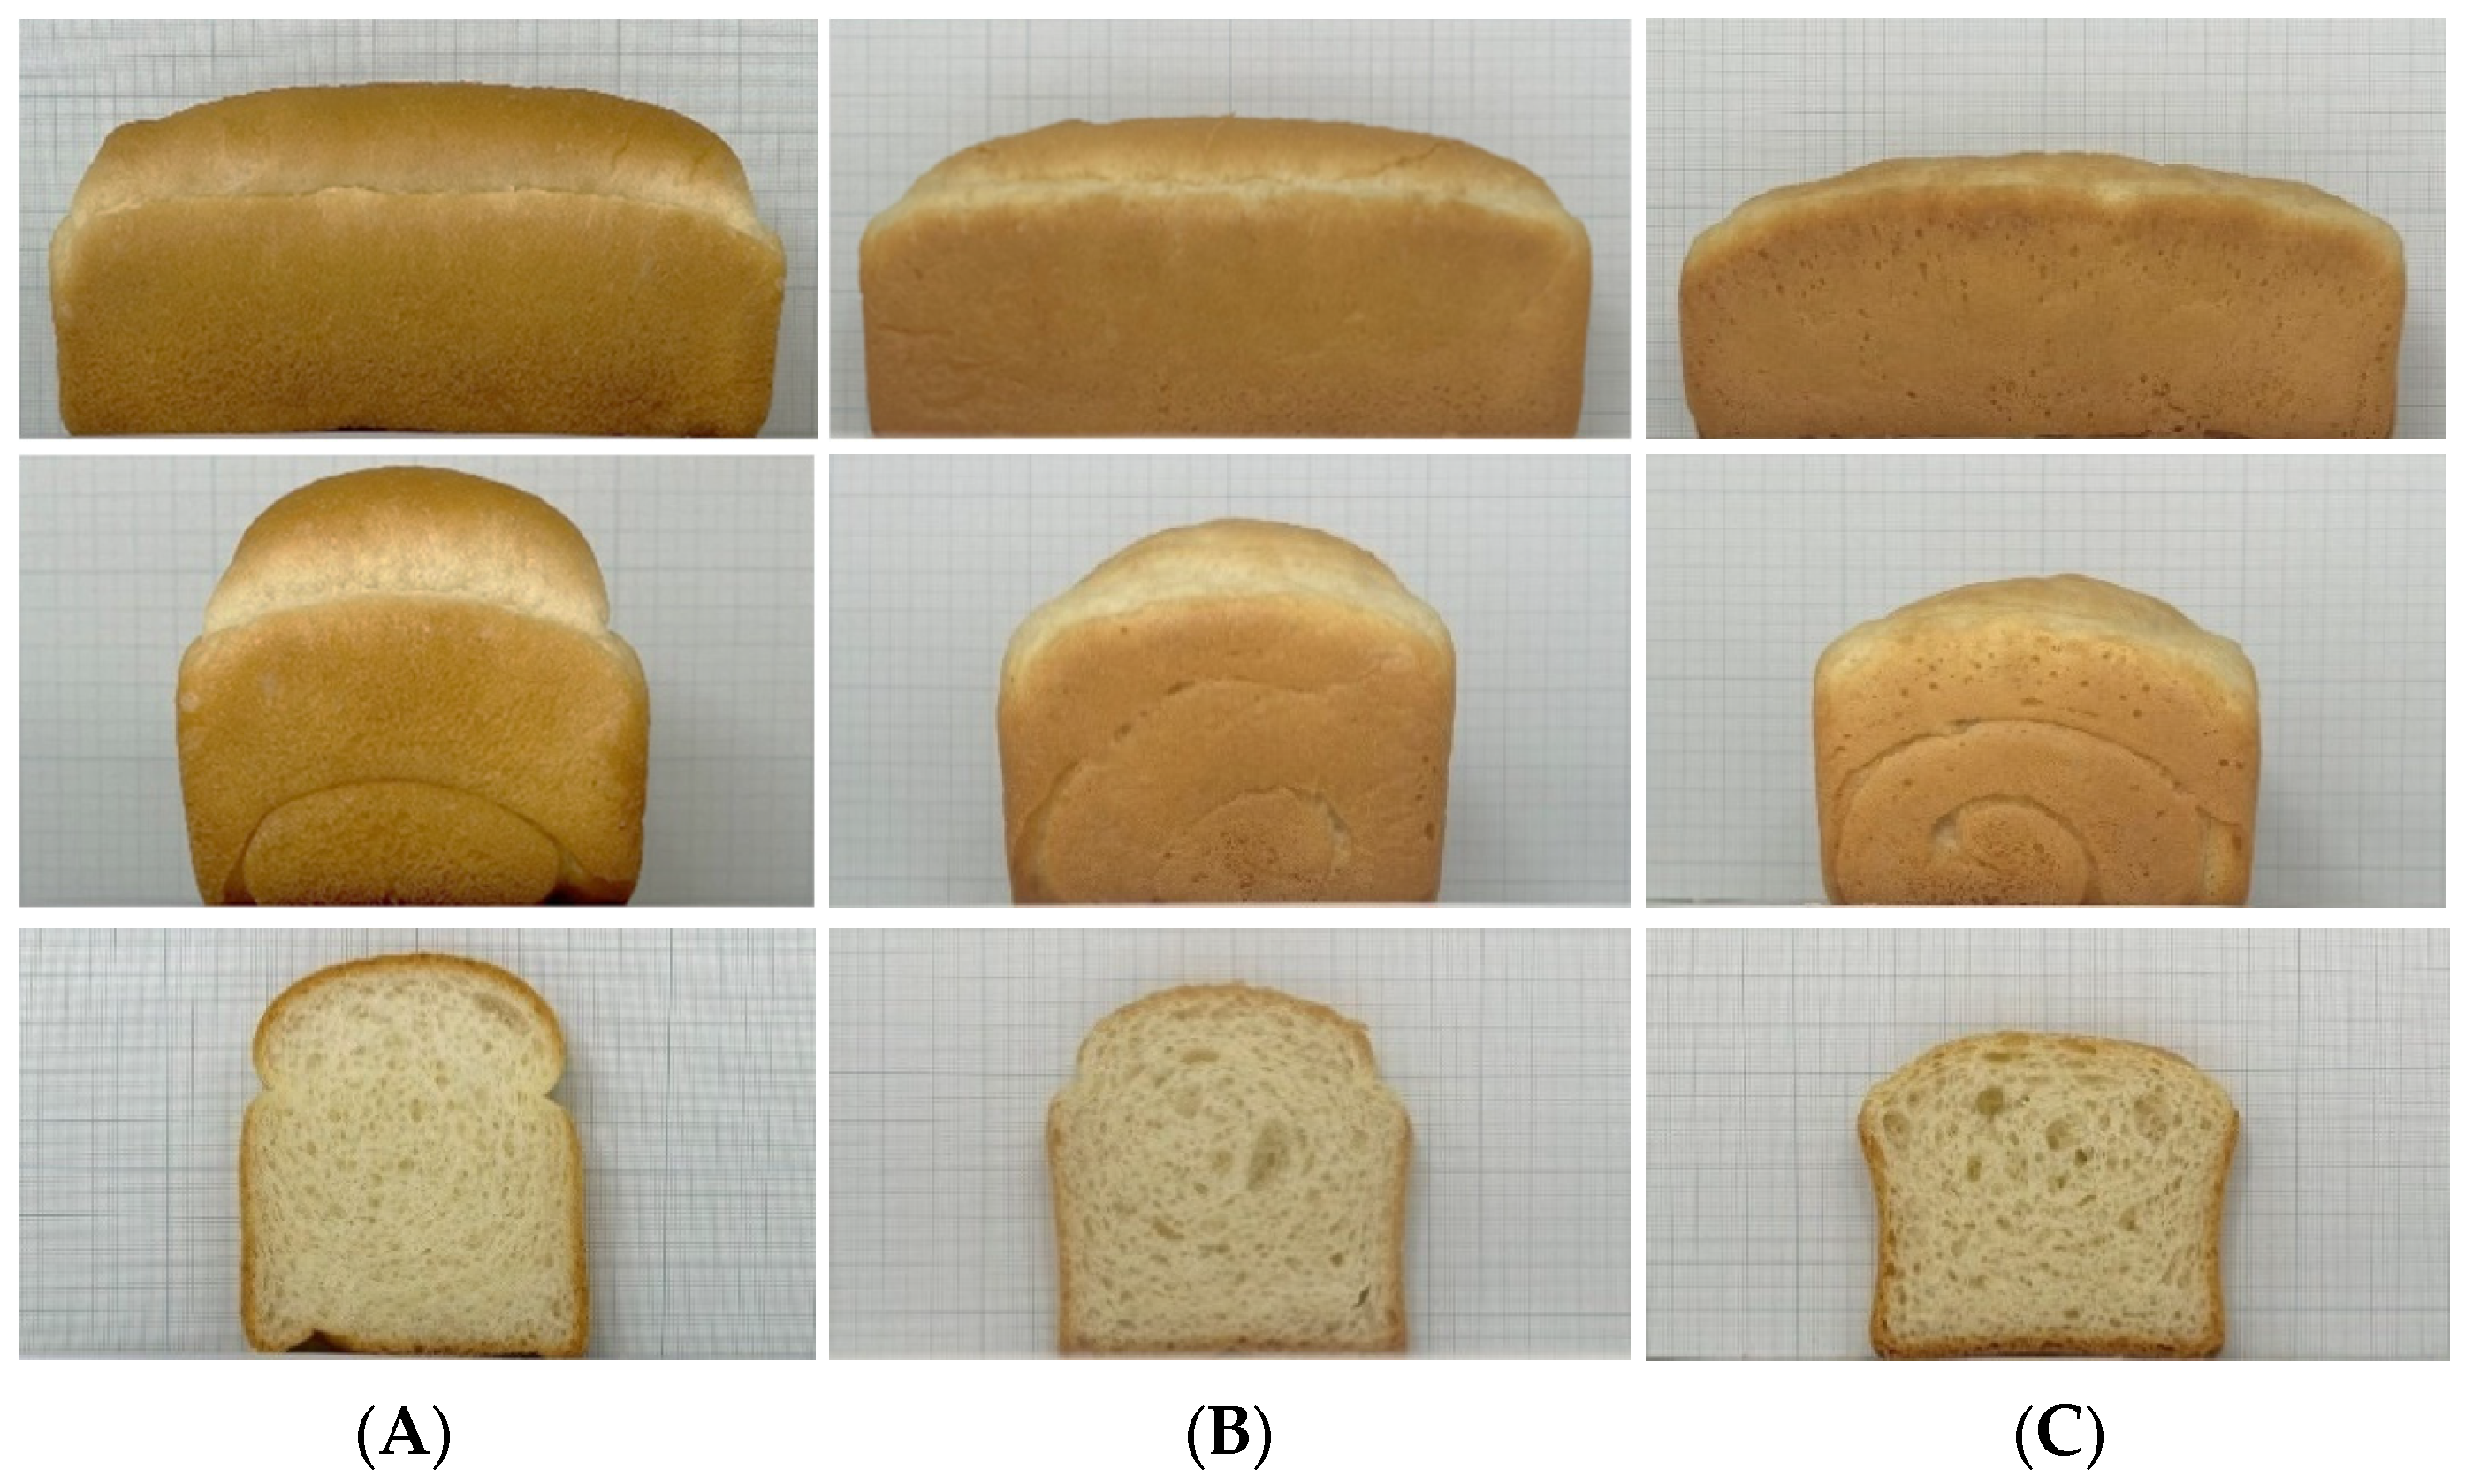
3.4. Quality Characteristics of Bread Prepared with Flours
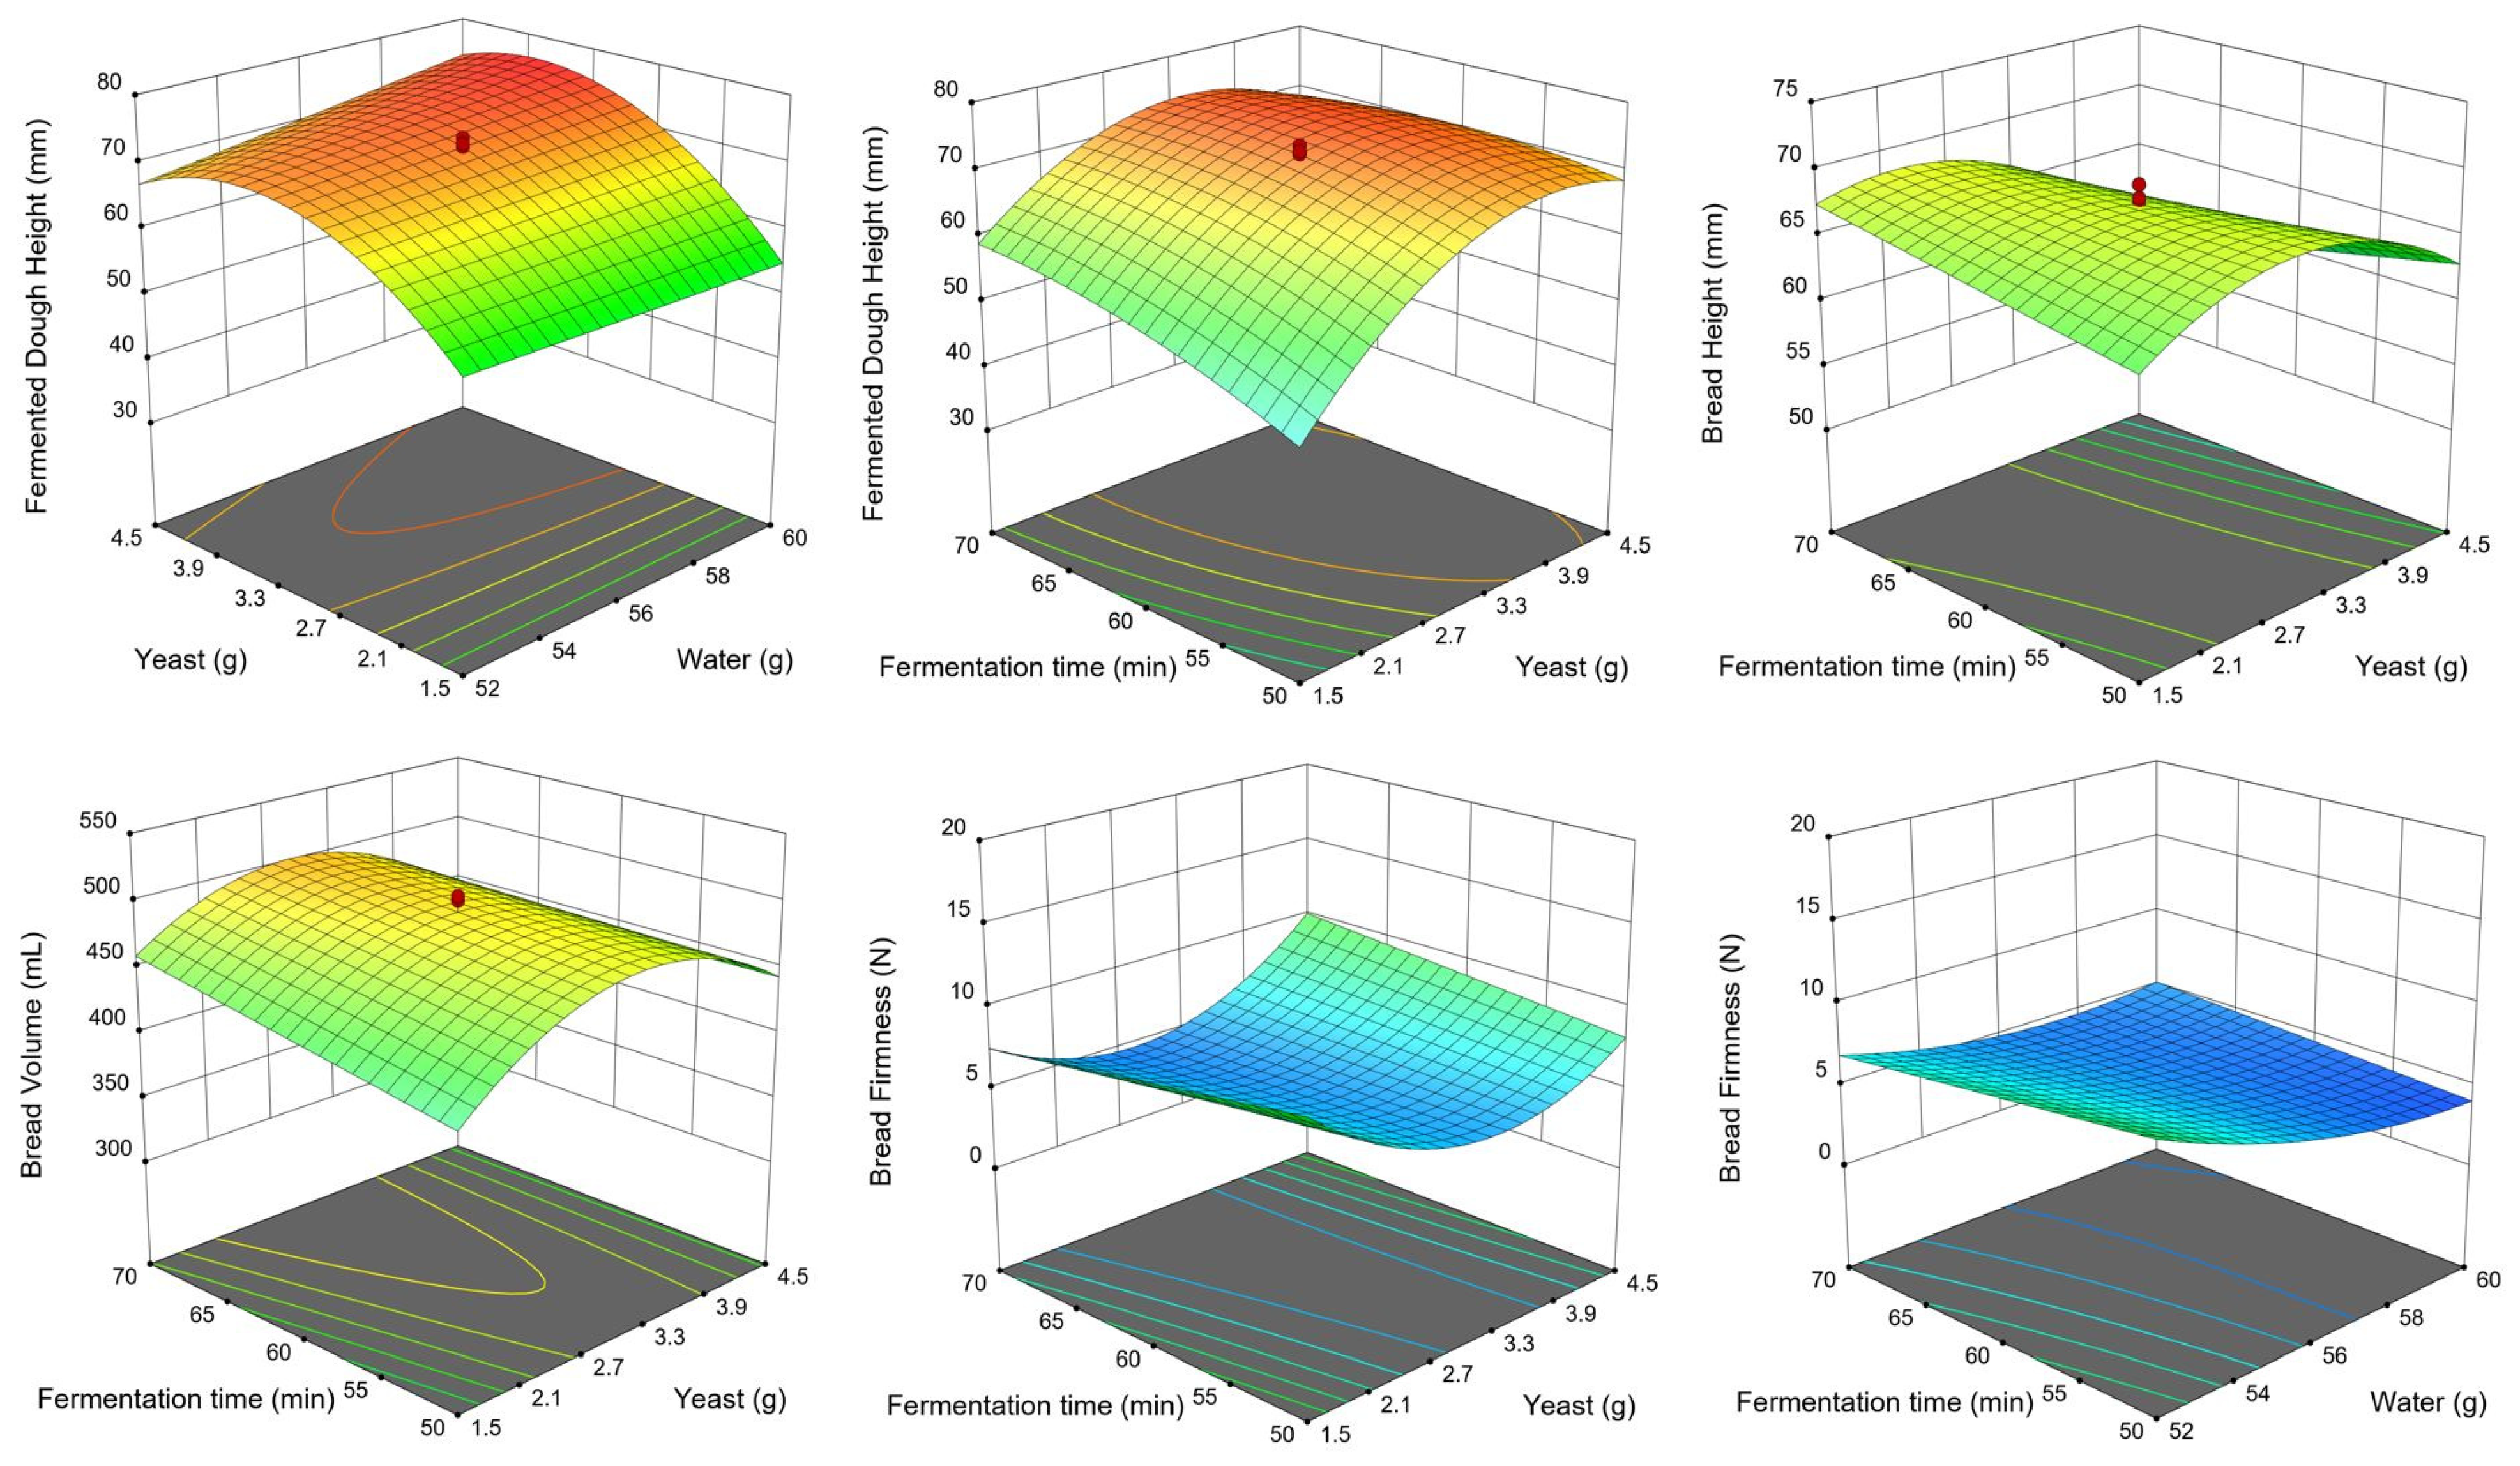
3.5. Quality Analysis of Bread Made with ‘O-Free’ Flour Based on Response Surface Methodology
3.6. Optimizing Formula and Processing Conditions of Bread Made with ‘O-Free’ Flour
4. Conclusions
Author Contributions
Funding
Data Availability Statement
Acknowledgments
Conflicts of Interest
References
- Korean Flour Millers Industrial Association. Available online: http://www.kofmia.org/data/stat_idx01.jsp (accessed on 3 August 2021).
- Lee, Y.G.; Choi, S.C.; Kang, Y.; Kang, C.S.; Kim, C. Genomics approach to identify the cause of the missing omega-5 gliadin protein in O-free wheat. Plant Breed. Biotechnol. 2018, 6, 413–425. [Google Scholar] [CrossRef]
- Kang, C.S.; Yun, Y.M.; Choi, C.H.; Son, J.H.; Lee, J.Y.; Jeong, H.Y.; Kim, Y.J.; Cheong, Y.K.; Park, T.I. Gluten Intolerance and Reduced Wheat-Dependent Exercise-Induced Anaphylaxis (WDEIA) Wheat ‘O-Free’ Abstract No PC-13. In Proceedings of the 2019 Annual Meeting of the Korean Society of Crop Science, Jinju, Korea, 18–19 April 2019. [Google Scholar]
- Kang, C.S.; Lee, J.R.; Park, C.S.; Jung, Y.K.; Kim, K.H.; Son, J.H.; Park, J.C.; Park, K.K.; Park, K.H.; Kim, Y.M.; et al. Wheat for Preventing or Improving Gluten Intolerance and Wheat-Dependent Exercise-Induced Anaphylaxis. Korean Patent 10-1983446, 22 May 2019. [Google Scholar]
- Veraverbeke, W.S.; Delcour, J.A. Wheat protein composition and properties of wheat glutenin in relation to breadmaking functionality. Crit. Rev. Food Sci. Nutr. 2002, 42, 179–208. [Google Scholar] [CrossRef] [PubMed]
- Green, P.H.R.; Jabri, B. Coeliac disease. Lancet 2003, 362, 383–391. [Google Scholar] [CrossRef]
- Green, P.H.R.; Cellier, C. Celiac disease. N. Engl. J. Med. 2007, 357, 1731–1743. [Google Scholar] [CrossRef] [PubMed]
- Kupper, C. Dietary guidelines and implementation for celiac disease. Gastroenterology 2005, 128, S121–S127. [Google Scholar] [CrossRef] [PubMed]
- Joung, K.Y.; Song, K.Y.; Oh, H.B.; Zhang, Y.; Shin, S.Y.; Kim, Y.S. Effect of various gluten-free flours on quality characteristics and antioxidant activities of cookies. Korean J. Food Cook. Sci. 2017, 3, 127–136. [Google Scholar] [CrossRef] [Green Version]
- Yano, H. Recent practical researches in the development of gluten-free breads. npj Sci. Food 2019, 3, 7. [Google Scholar] [CrossRef] [Green Version]
- Roman, L.; Belorie, M.; Gomez, M. Gluten-free breads: The gap between research and commercial reality. Compr. Rev. Food Sci. Food Saf. 2019, 18, 690–702. [Google Scholar] [CrossRef] [Green Version]
- Bender, D.; Schönlechner, R. Innovative approaches towards improved gluten-free bread properties. J. Cereal Sci. 2020, 91, 102904. [Google Scholar] [CrossRef]
- Gallagher, E.; Gormley, T.R.; Arendt, E.K. Recent advances in the formulation of gluten-free cereal-based products. Trends Food Sci. Technol. 2004, 15, 143–152. [Google Scholar] [CrossRef]
- Day, L.; Augustin, M.A.; Batey, I.L.; Wrigley, C.W. Wheat-gluten uses and industry needs. Trends Food Sci. Technol. 2006, 17, 82–90. [Google Scholar] [CrossRef]
- Liu, R.; Sun, W.; Zhang, Y.; Huang, Z.; Hu, H.; Zhao, M.; Li, W. Development of a novel model dough based on mechanically activated cassava starch and gluten protein: Application in bread. Food Chem. 2019, 300, 125196. [Google Scholar] [CrossRef]
- Ryan, K.J.; Brewer, M.S. Model system analysis of wheat starch-soy protein interaction kinetics using polystyrene microspheres. Food Chem. 2005, 92, 325–335. [Google Scholar] [CrossRef]
- Lamacchia, C.; Camarca, A.; Picascia, S.; Di Luccia, A.; Gianfrani, C. Cereal-based gluten-free food: How to reconcile nutritional and technological properties of wheat proteins with safety for celiac disease patients. Nutrients 2014, 6, 575–590. [Google Scholar] [CrossRef] [Green Version]
- Wang, P.; Jin, Z.; Xu, X. Physicochemical alterations of wheat gluten proteins upon dough formation and frozen storage—A review from gluten, glutenin and gliadin perspectives. Trends Food Sci. Technol. 2015, 46, 189–198. [Google Scholar] [CrossRef]
- Seo, Y.; Moon, Y.; Kweon, M. Effect of purple-colored wheat bran addition on quality and antioxidant property of bread and optimization of bread-making conditions. Appl. Sci. 2021, 11, 4034. [Google Scholar] [CrossRef]
- AACC. Approved Method of Analysis, 11th ed.; Method 08-01.02, 10-53.01, 44-15.02, 56-11.02, 56-70.01; AACC International: St. Paul, MN, USA, 2010. [Google Scholar]
- Axford, D.W.E.; McDermott, E.E.; Redman, D.G. Note on the sodium dodecyl sulfate test of breadmaking quality: Comparison with pelshenke and zeleny tests. Cereal Chem. 1979, 56, 582–584. [Google Scholar]
- Kweon, M.; Slade, L.; Levine, H. Solvent retention capacity (SRC) testing of wheat flour: Principles and value in pre-dicting flour functionality in different wheat-based food processes, as well as in wheat breeding—A review. Cereal Chem. 2011, 88, 537–552. [Google Scholar] [CrossRef]
- Hammed, A.M.; Ozsisli, B.; Ohm, J.B.; Simsek, S. Relationship between solvent retention capacity and protein molecular weight distribution, quality characteristics, and breadmaking functionality of hard red spring wheat flour. Cereal Chem. 2015, 92, 466–474. [Google Scholar] [CrossRef]
- Xiao, Z.S.; Park, S.H.; Chung, O.K.; Caley, M.S.; Seib, P.A. Solvent retention capacity values in relation to hard winter wheat and flour properties and straight-dough breadmaking quality. Cereal Chem. 2006, 83, 465–471. [Google Scholar] [CrossRef] [Green Version]
- Boehm, J.D., Jr.; Ibba, M.I.; Kiszonas, A.M.; Morris, C.F. End-use quality of CIMMYT-derived soft-kernel durum wheat germplasm: I. Dough strength and pan bread quality. Crop. Sci. 2017, 57, 1485–1494. [Google Scholar] [CrossRef]
- Gaines, C.S. Report of the AACC committee on soft wheat flour. Method 56-11, Solvent retention capacity profile. Cereal Foods World 2000, 45, 303–306. [Google Scholar]
- Ram, S.; Dawar, V.; Singh, R.P.; Shoran, J. Application of solvent retention capacity test for the prediction of mixing properties of wheat flour. J. Cereal Sci. 2005, 42, 261–266. [Google Scholar] [CrossRef]
- Velu, G.; Singh, R.P. Phenotyping in Wheat Breeding. In Phenotyping for Plant Breeding; Springer: New York, NY, USA, 2013; pp. 47–71. [Google Scholar]
- Duyvejonck, A.E.; Lagrain, B.; Dornez, E.; Delcour, J.A.; Courtin, C.M. Suitability of solvent retention capacity tests to assess the cookie and bread making quality of European wheat flours. LWT Food Sci. Technol. 2012, 47, 56–63. [Google Scholar] [CrossRef]
- Hernández-Espinosa, N.; Guzmán, C.; Morales-Dorantes, A.S.; Crespo-Herrera, L.; Mondal, S.; Singh, R.; Ibba, M.I. Suitability of the current breadmaking quality test to predict the breadmaking potential of healthy bread formulations. Cereal Chem. 2021, 98, 1091–1100. [Google Scholar] [CrossRef]
- Moonen, J.H.; Scheepstra, A.; Graveland, A. Use of the SDS-sedimentation test and SDS-polyacrylamidegel electrophoresis for screening breeder’s samples of wheat for bread-making quality. Euphytica 1982, 31, 677–690. [Google Scholar] [CrossRef]
- Gil-Humanes, J.; Pistón, F.; Barro, F.; Rosell, C.M. The shutdown of celiac disease-related gliadin epitopes in bread wheat by RNAi provides flours with increased stability and better tolerance to over-mixing. PLoS ONE 2014, 9, e91931. [Google Scholar] [CrossRef] [Green Version]
- Issarny, C.; Cao, W.; Falk, D.; Seetharaman, K.; Bock, J.B. Exploring functionality of hard and soft wheat flour blends for impoved end-use quality protection. Cereal Chem. 2017, 94, 723–732. [Google Scholar] [CrossRef]
- Borla, O.P.; Motta, E.L.; Saiz, A.I.; Fritz, R. Quality parameters and baking performance of commercial gluten flours. LWT Food Sci. Technol. 2004, 37, 723–729. [Google Scholar] [CrossRef]
- Kotoki, D.; Deka, S.C. Baking loss of bread with special emphasis on increasing water holding capacity. J. Food Sci. Technol. 2010, 47, 128–131. [Google Scholar] [CrossRef] [Green Version]
- Mudgil, D.; Barak, S.; Khatkar, B.S. Optimization of bread firmness, specific loaf volume and sensory acceptability of bread with soluble fiber and different water levels. J. Cereal Sci. 2016, 70, 186–191. [Google Scholar] [CrossRef]
- Jo, Y.; Chun, A.; Sim, E.Y.; Park, H.Y.; Kwak, J.E.; Kim, M.J.; Lee, C.K. Effect of kneading and fermentation conditions on the quality of gluten-free rice bread. Korean J. Food Sci. Technol. 2020, 52, 510–515. [Google Scholar]
- Cardello, A.V. Consumer expectations and their role in food acceptance. In Measurement of Food Preferences; MacFie, H., Thomson, D., Eds.; Elsevier: London, UK, 1994; pp. 253–297. [Google Scholar]
- Lapčíková, B.; Burešová, I.; Lapčík, L.; Dabash, V.; Valenta, T. Impact of particle size on wheat dough and bread characteristics. Food Chem. 2019, 297, 124938. [Google Scholar] [CrossRef]
- Sahin, A.W.; Wiertz, J.; Arendt, E.K. Evaluation of a new method to determine the water addition level in gluten-free bread systems. J. Cereal Sci. 2020, 93, 102971. [Google Scholar] [CrossRef]
- Mondal, A.; Datta, A.K. Bread baking—A review. J. Food Eng. 2008, 86, 465–474. [Google Scholar] [CrossRef]
- Shewry, P.R.; Popineau, Y.; Lafiandra, D.; Belton, P. Wheat glutenin subunits and dough elasticity: Findings of the EUROWHEAT project. Trends Food Sci. Technol. 2001, 11, 433–441. [Google Scholar] [CrossRef] [Green Version]
- Barros, J.H.T.; Telis, V.R.N.; Taboga, S.; Franco, C.M.L. Resistant starch: Effect on rheology, quality, and staling rate of white wheat bread. J. Food Sci. Technol. 2018, 55, 4578–4588. [Google Scholar] [CrossRef]


| Ingredient | ‘O-Free’ Flour | Bread Flour A | Bread Flour B |
|---|---|---|---|
| Flour (g) | 100 | 100 | 100 |
| Non-fat dry milk (g) | 4 | 4 | 4 |
| Salt (g) | 1.5 | 1.5 | 1.5 |
| Shortening (g) | 3 | 3 | 3 |
| Sucrose (g) | 6 | 6 | 6 |
| Yeast (g) | 2 | 2 | 2 |
| Water (g) | 56 | 69 | 69 |
| Factor | Level | ||
|---|---|---|---|
| (−) | 0 | (+) | |
| Water (g) | 52 | 56 | 60 |
| Yeast (g) | 1.5 | 3 | 4.5 |
| Mixing time (min) | 2.5 | 3.75 | 5 |
| Fermentation time (min) | 50 | 60 | 70 |
| Quality Parameter | ‘O-Free’ Flour | Bread Flour A | Bread Flour B | |
|---|---|---|---|---|
| Moisture loss (%) | 8.7 ± 0.4 a,(1) | 9.9 ± 0.3 b | 10.2 ± 0.3 b | |
| Dough Height (mm) | BF (2) | 37.7 ± 1.4 a | 36.5 ± 1.9 a | 36.7 ± 1.6 a |
| AF | 66.5 ± 0.3 a | 69.2 ± 2.4 a | 72.9 ± 3.1 b | |
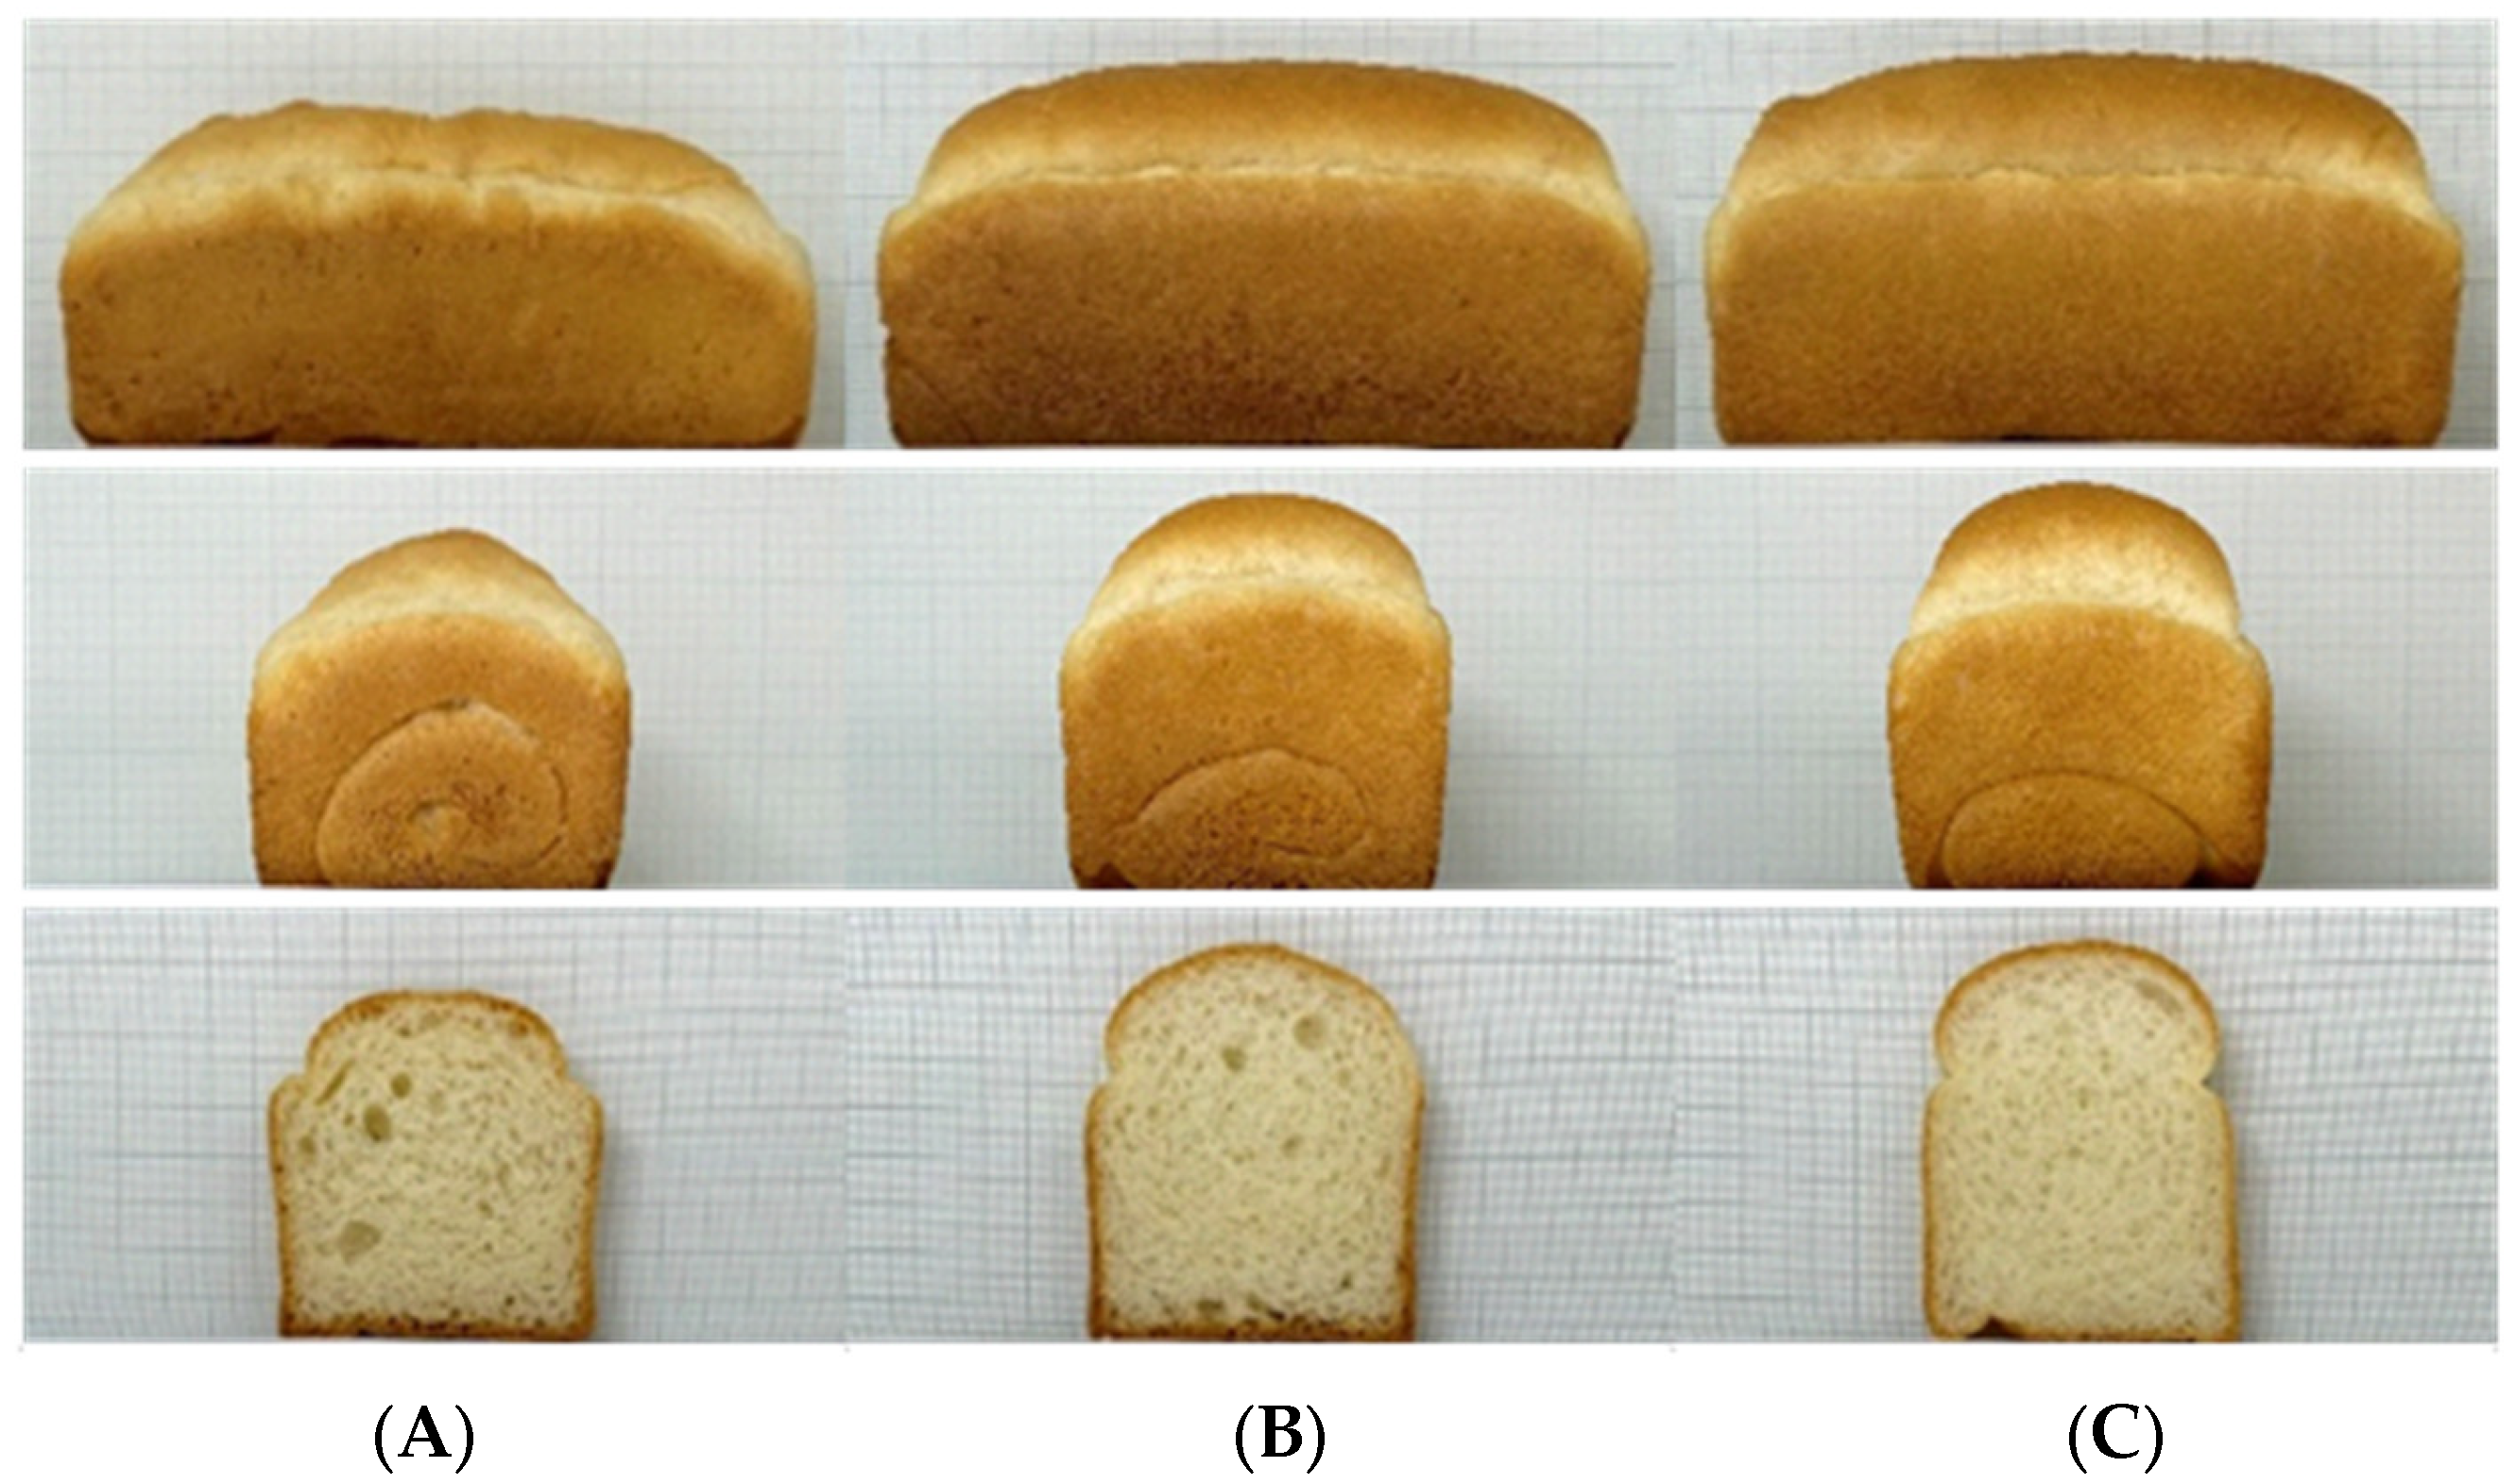
| Bread Height (mm) | 73.6 ± 0.3 a | 79.5 ± 2.9 b | 83.2 ± 1.8 c | |
| Bread Volume (mL) | 507.7 ± 11.8 a | 571.9 ± 21.2 b | 565.8 ± 9.3 b | |
| Bread Firmness (N) | 7.8 ± 1.3 b | 4.8 ± 0.5 a | 3.7 ± 0.8 a | |
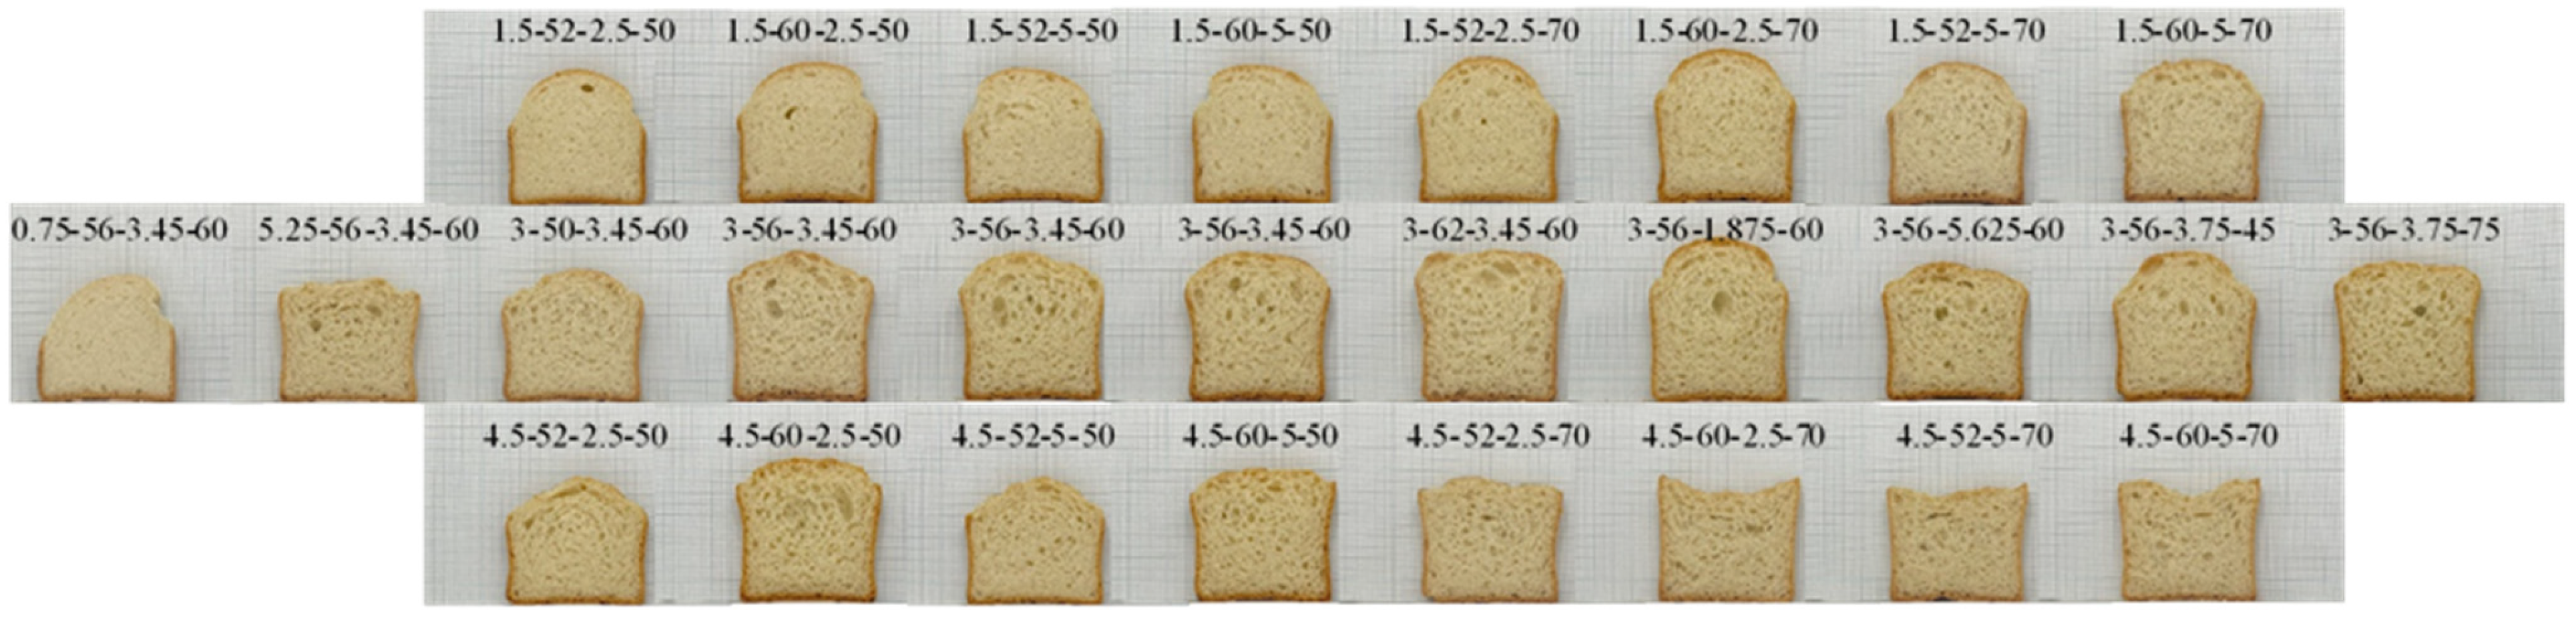
| Sample | Water (g) | Yeast (g) | Mixing Time (min) | Fermentation Time (min) | Responses | |||
|---|---|---|---|---|---|---|---|---|
| Fermented Dough Height (mm) | Bread Height (mm) | Bread Volume (mL) | Bread Firmness (N) | |||||
| 1 | 52 | 1.5 | 2.5 | 50 | 51.0 ± 0.1 | 63.9 ± 0.2 | 402.7 ± 1.0 | 12.1 ± 2.0 |
| 2 | 60 | 1.5 | 2.5 | 50 | 47.4 ± 0.1 | 64.9 ± 0.3 | 453.1 ± 3.1 | 9.0 ± 0.6 |
| 3 | 52 | 4.5 | 2.5 | 50 | 63.4 ± 0.4 | 59.3 ± 0.6 | 401.5 ± 2.1 | 14.7 ± 1.3 |
| 4 | 60 | 4.5 | 2.5 | 50 | 73.5 ± 0.4 | 67.1 ± 0.2 | 497.0 ± 1.1 | 4.9 ± 0.8 |
| 5 | 52 | 1.5 | 5 | 50 | 48.0 ± 0.1 | 62.9 ± 0.1 | 400.9 ± 0.5 | 12.5 ± 1.9 |
| 6 | 60 | 1.5 | 5 | 50 | 44.7 ± 0.3 | 63.1 ± 0.1 | 419.0 ± 0.3 | 12.4 ± 1.2 |
| 7 | 52 | 4.5 | 5 | 50 | 62.3 ± 0.3 | 58.3 ± 0.1 | 374.4 ± 0.2 | 14.3 ± 1.0 |
| 8 | 60 | 4.5 | 5 | 50 | 72.2 ± 0.3 | 63.2 ± 0.6 | 453.4 ± 3.4 | 7.7 ± 0.9 |
| 9 | 52 | 1.5 | 2.5 | 70 | 60.4 ± 0.3 | 67.5 ± 0.2 | 448.5 ± 0.3 | 7.4 ± 0.9 |
| 10 | 60 | 1.5 | 2.5 | 70 | 61.2 ± 0.2 | 71.3 ± 0.1 | 492.7 ± 0.3 | 6.4 ± 0.6 |
| 11 | 52 | 4.5 | 2.5 | 70 | 69.9 ± 0.3 | 59.4 ± 0.2 | 433.6 ± 7.6 | 10.6 ± 1.3 |
| 12 | 60 | 4.5 | 2.5 | 70 | 70.0 ± 1.4 | 58.8 ± 0.2 | 453.4 ± 2.0 | 10.2 ± 1.4 |
| 13 | 52 | 1.5 | 5 | 70 | 58.4 ± 0.2 | 66.0 ± 0.2 | 457.6 ± 5.0 | 10.1 ± 1.4 |
| 14 | 60 | 1.5 | 5 | 70 | 57.9 ± 0.1 | 67.6 ± 0.3 | 474.6 ± 0.8 | 7.4 ± 1.1 |
| 15 | 52 | 4.5 | 5 | 70 | 61.3 ± 1.0 | 52.3 ± 0.7 | 417.9 ± 0.7 | 13.9 ± 2.1 |
| 16 | 60 | 4.5 | 5 | 70 | 67.4 ± 0.3 | 58.4 ± 0.4 | 441.9 ± 4.2 | 12.2 ± 0.4 |
| 17 | 50 | 3 | 3.75 | 60 | 67.3 ± 0.2 | 61.8 ± 0.3 | 426.8 ± 7.0 | 10.7 ± 1.0 |
| 18 | 62 | 3 | 3.75 | 60 | 76.4 ± 0.1 | 70.8 ± 0.1 | 536.2 ± 6.1 | 4.2 ± 0.6 |
| 19 | 56 | 0.75 | 3.75 | 60 | 36.6 ± 0.2 | 58.4 ± 0.2 | 343.8 ± 0.6 | 17.1 ± 0.4 |
| 20 | 56 | 5.25 | 3.75 | 60 | 66.1 ± 0.4 | 56.7 ± 0.1 | 417.1 ± 1.8 | 10.3 ± 1.8 |
| 21 | 56 | 3 | 1.875 | 60 | 76.3 ± 0.2 | 74.5 ± 0.2 | 535.5 ± 1.8 | 3.1 ± 0.4 |
| 22 | 56 | 3 | 5.625 | 60 | 67.2 ± 1.0 | 64.9 ± 0.2 | 478.0 ± 1.2 | 6.2 ± 1.2 |
| 23 | 56 | 3 | 3.75 | 45 | 62.7 ± 0.5 | 67.8 ± 0.2 | 494.5 ± 3.0 | 5.1 ± 0.7 |
| 24 | 56 | 3 | 3.75 | 75 | 72.0 ± 0.5 | 64.2 ± 0.1 | 478.5 ± 0.6 | 7.4 ± 1.4 |
| 25 | 56 | 3 | 3.75 | 60 | 73.7 ± 0.3 | 68.9 ± 0.3 | 500.8 ± 2.0 | 4.4 ± 0.9 |
| 26 | 56 | 3 | 3.75 | 60 | 72.4 ± 0.5 | 67.6 ± 0.3 | 488.5 ± 1.7 | 4.8 ± 0.5 |
| 27 | 56 | 3 | 3.75 | 60 | 72.8 ± 0.5 | 67.9 ± 0.2 | 504.0 ± 1.1 | 4.9 ± 0.9 |
| Response | Source | DF | Sum of Squares | Mean Square | F Value | R2 |
|---|---|---|---|---|---|---|
| Fermented dough height | Model | 8 | 2690.54 | 336.32 | 59.05 *** | 0.963 |
| Residue | 18 | 102.51 | 5.70 | |||
| Total | 26 | 2793.05 | ||||
| Bread height | Model | 6 | 577.46 | 96.24 | 18.76 *** | 0.849 |
| Residue | 20 | 102.60 | 5.13 | |||
| Total | 26 | 680.06 | ||||
| Bread volume | Model | 6 | 47,689.33 | 7948.22 | 15.79 *** | 0.826 |
| Residue | 20 | 10,064.36 | 503.22 | |||
| Total | 26 | 57,753.69 | ||||
| Bread firmness | Model | 8 | 301.15 | 37.64 | 9.42 *** | 0.807 |
| Residue | 18 | 71.92 | 4.00 | |||
| Total | 26 | 373.06 |
| Factors | Confirmation Test | Center Point | |
|---|---|---|---|
| Predicted Value | Experimental Value | ||
| Water amount (g) | 60 | 60 | 56 |
| Yeast amount (g) | 3.1 | 3.1 | 3 |
| Mixing time (min) | 2.5 | 2.5 | 3.75 |
| Fermentation time (min) | 54.2 | 54.2 | 60 |
| Bread height (mm) | 71.2 | 78.7 | 67.9 |
| Bread volume (mL) | 522.9 | 562.5 | 504 |
| Bread firmness (N) | 3.3 | 3.7 | 4.9 |
Publisher’s Note: MDPI stays neutral with regard to jurisdictional claims in published maps and institutional affiliations. |
© 2022 by the authors. Licensee MDPI, Basel, Switzerland. This article is an open access article distributed under the terms and conditions of the Creative Commons Attribution (CC BY) license (https://creativecommons.org/licenses/by/4.0/).
Share and Cite
Xia, T.; Kim, K.; Kweon, M. Quality of Low-Allergy Wheat (‘O-Free’) Flour and Optimization of Its Bread-Baking Performance. Foods 2022, 11, 3399. https://doi.org/10.3390/foods11213399
Xia T, Kim K, Kweon M. Quality of Low-Allergy Wheat (‘O-Free’) Flour and Optimization of Its Bread-Baking Performance. Foods. 2022; 11(21):3399. https://doi.org/10.3390/foods11213399
Chicago/Turabian StyleXia, Tianyi, Kyeonghoon Kim, and Meera Kweon. 2022. "Quality of Low-Allergy Wheat (‘O-Free’) Flour and Optimization of Its Bread-Baking Performance" Foods 11, no. 21: 3399. https://doi.org/10.3390/foods11213399
APA StyleXia, T., Kim, K., & Kweon, M. (2022). Quality of Low-Allergy Wheat (‘O-Free’) Flour and Optimization of Its Bread-Baking Performance. Foods, 11(21), 3399. https://doi.org/10.3390/foods11213399