
Effects of Rearing Management Applied throughout the Charolais Young Bulls’ Life on Carcass and Meat Quality


Abstract
:1. Introduction
2. Materials and Methods
2.1. Animals and Rearing Factors
2.2. Rearing Factors
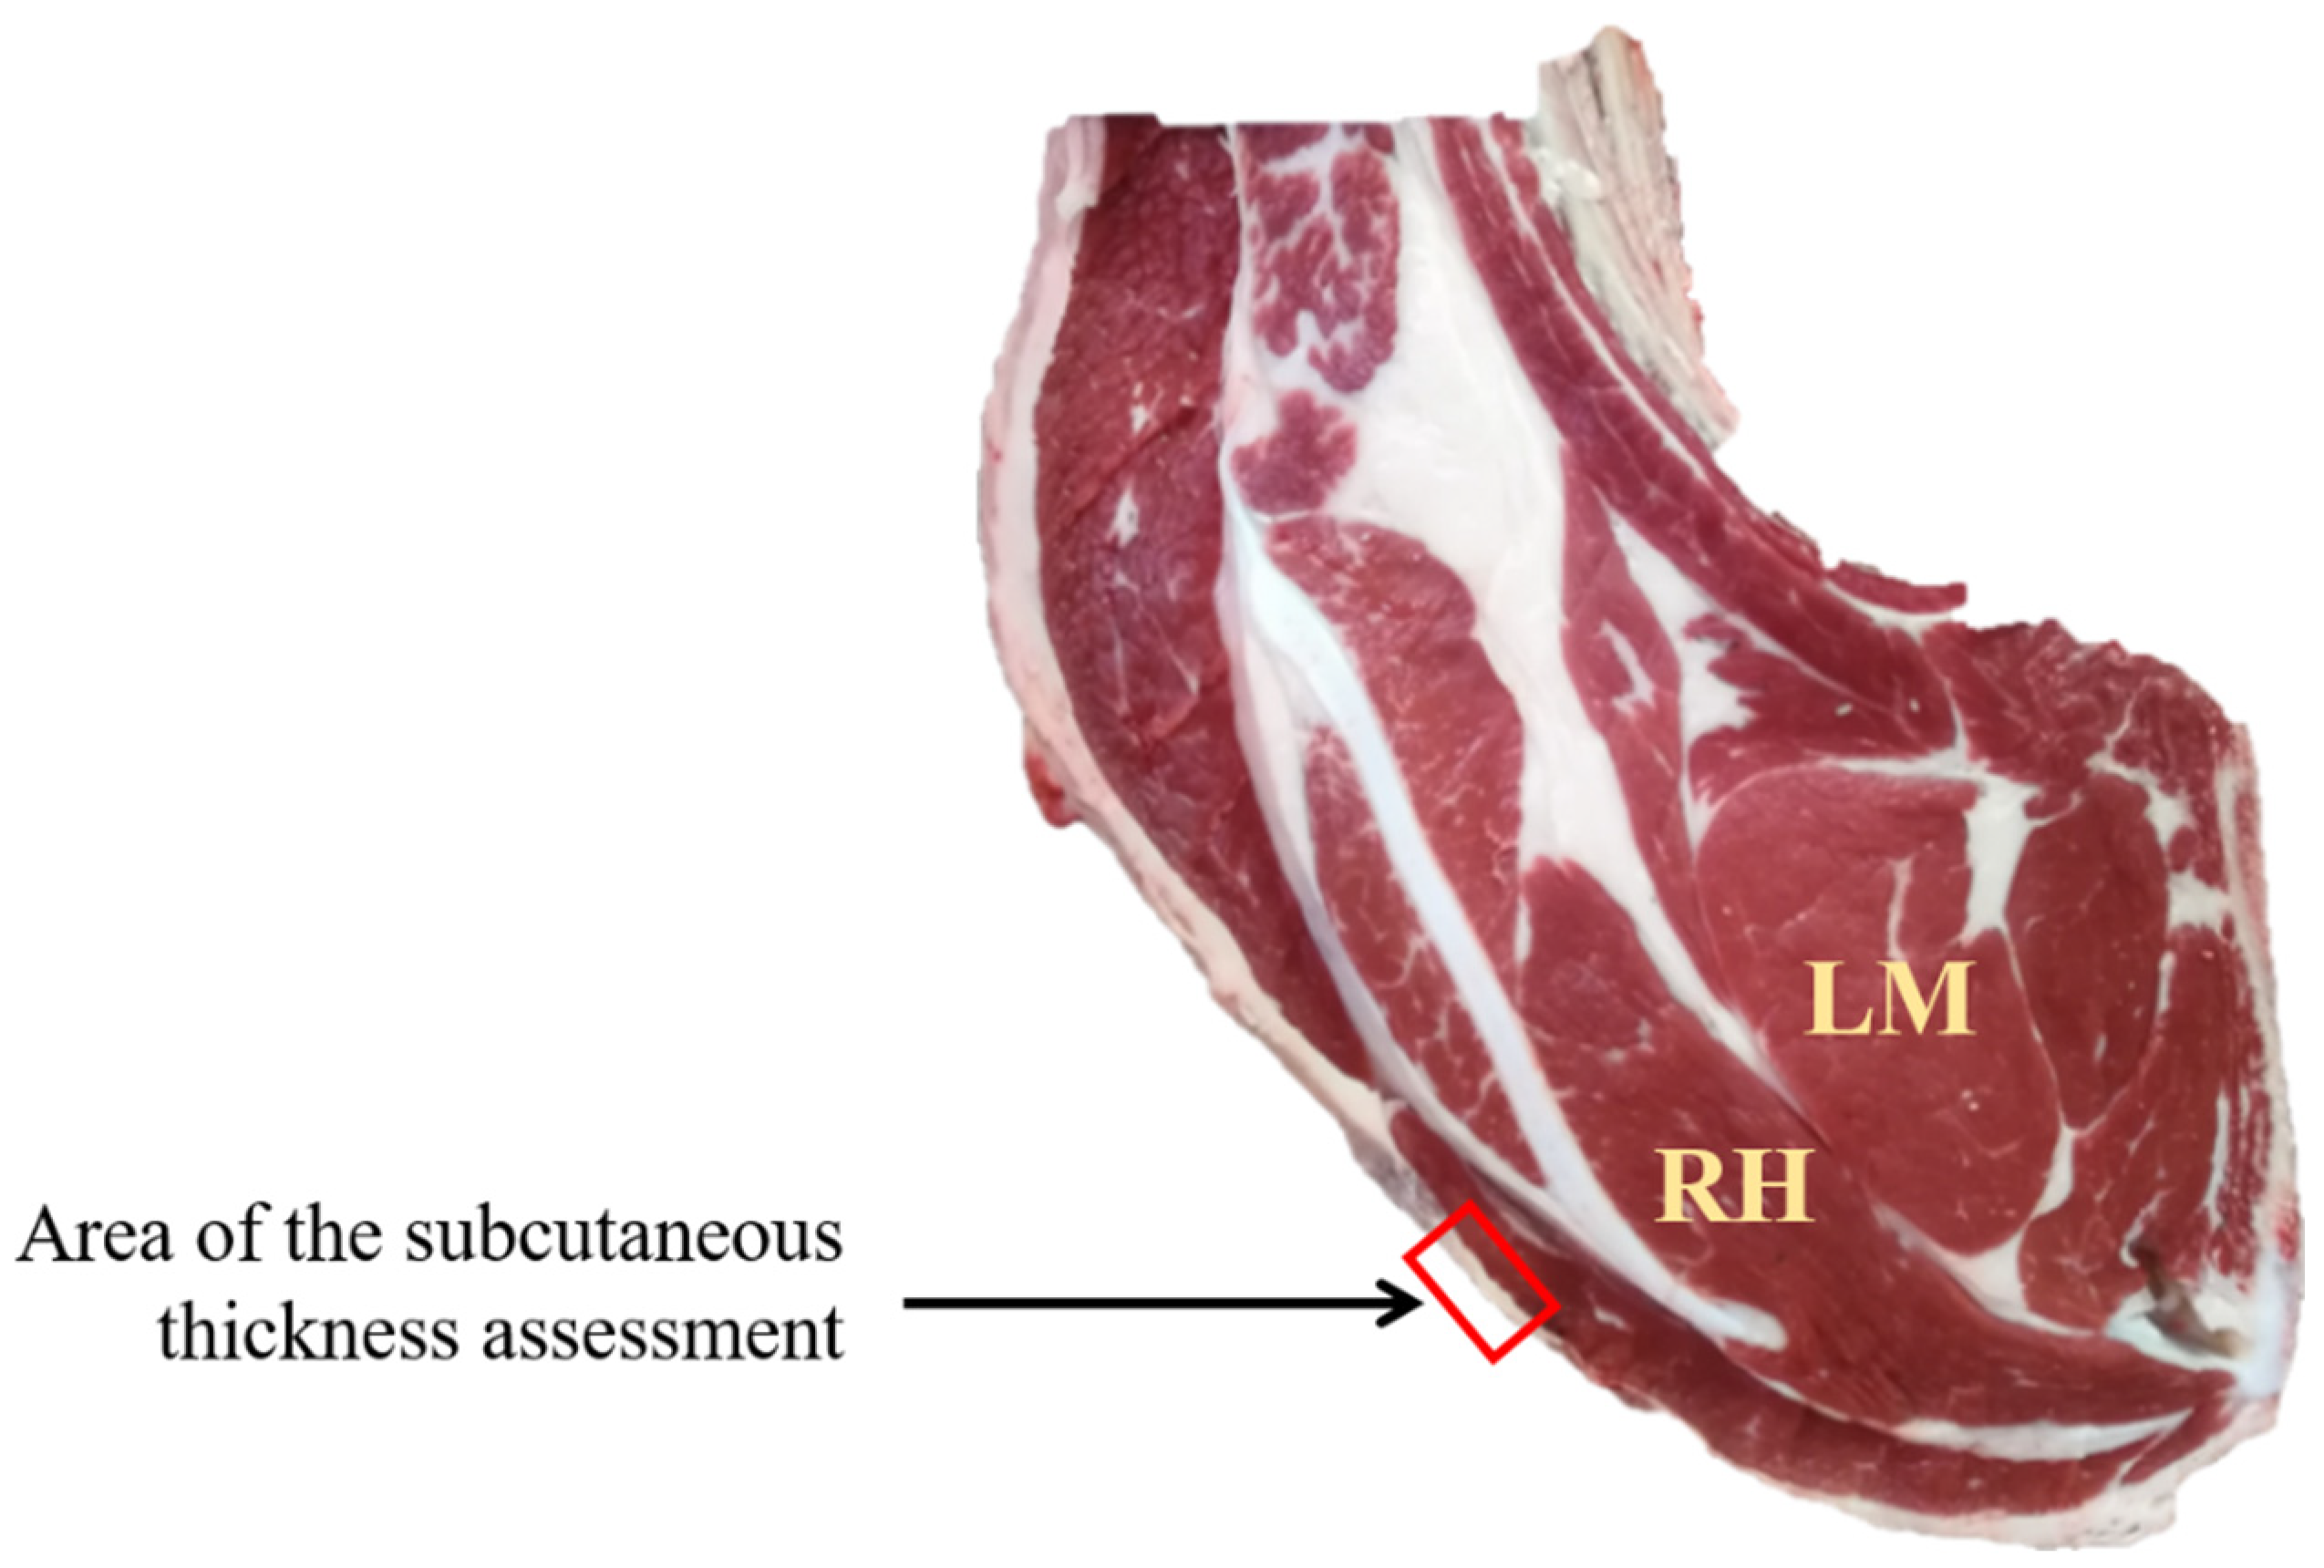
2.3. Slaughtering, Carcass Traits, and Sampling
2.4. Meat Quality Evaluation
2.5. Statistical Analyses
3. Results and Discussion
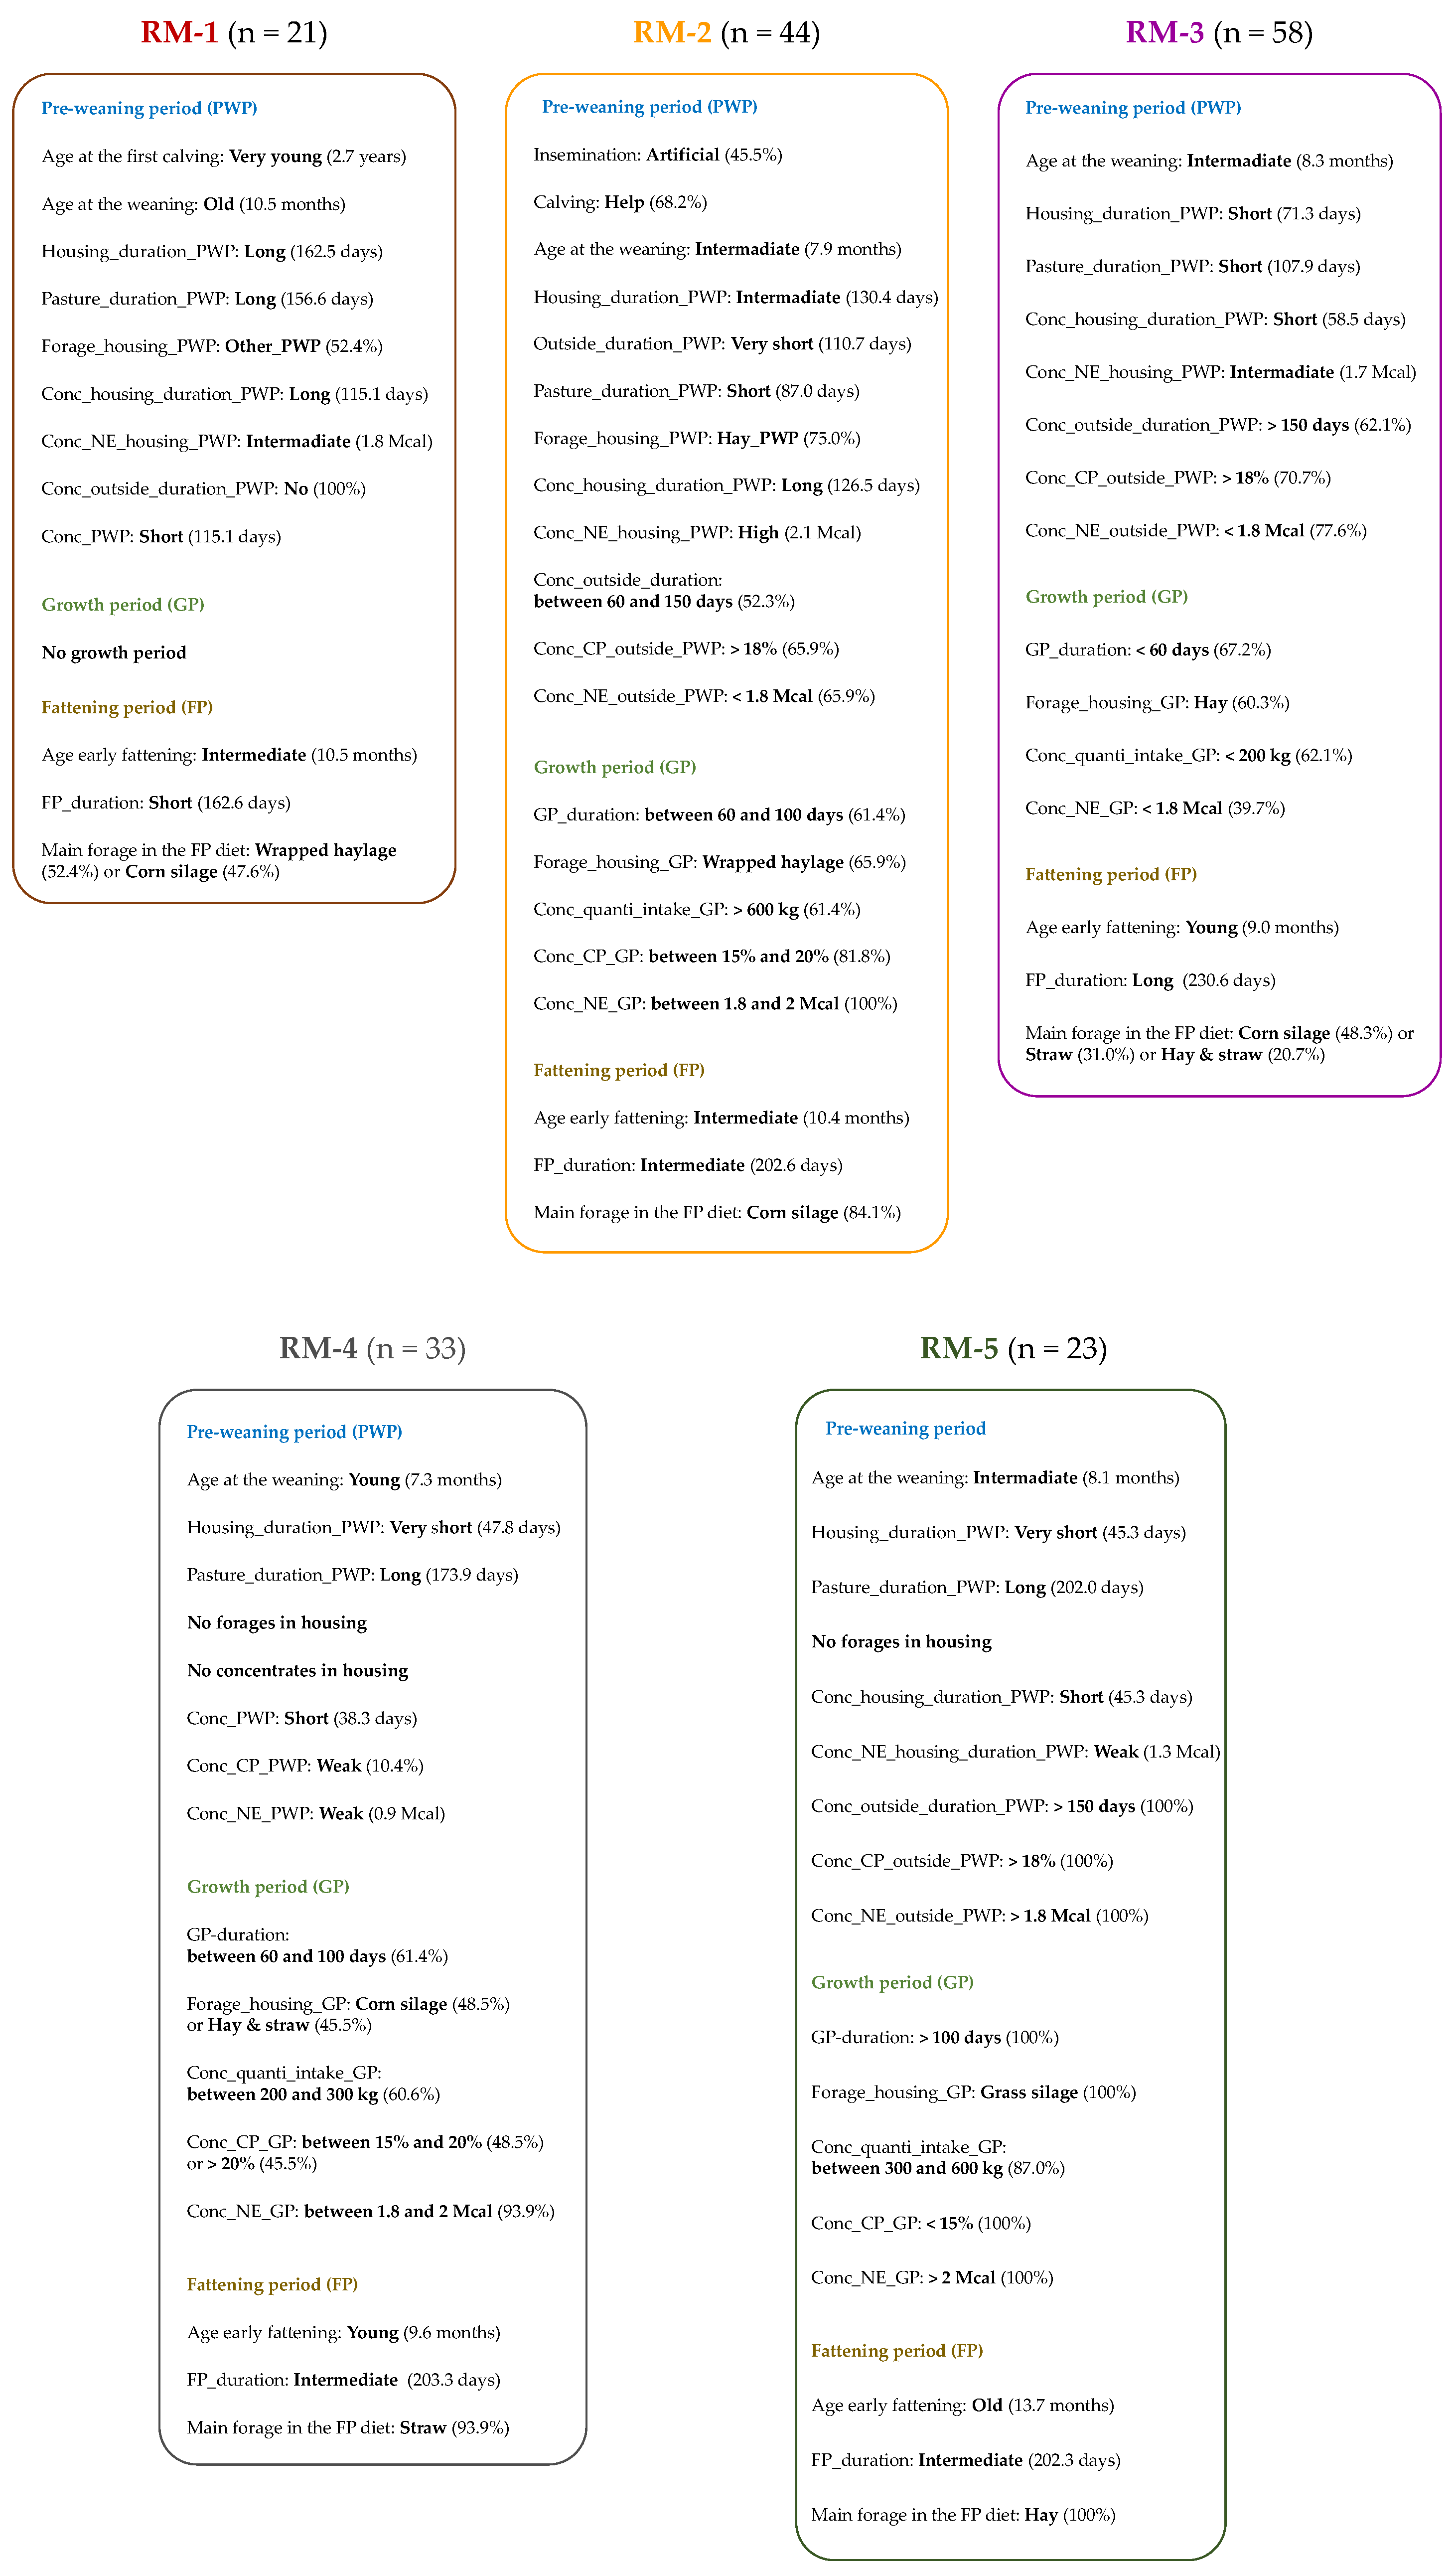
3.1. Characterization of the Rearing Managements
3.2. Effect of Rearing Managements on Carcass Traits
3.3. Effect of Rearing Managements on Meat Traits
4. Conclusions
Author Contributions
Funding
Institutional Review Board Statement
Informed Consent Statement
Data Availability Statement
Acknowledgments
Conflicts of Interest
Appendix A
References
- Interbev. L’essentiel de La Filière Bovine Française. 2021. Available online: https://www.interbev.fr/interbev/chiffres-cles/ (accessed on 5 July 2022).
- Institut de L’élevage. Marché Mondial Viande Bovine: Année 2021—Perspectives 2022. Dossier Economie de L’élevage. Available online: https://idele.fr/detail-article/marche-mondial-viande-bovine-annee-2021-perspectives-2022 (accessed on 5 July 2022).
- Blanco, M.; Ripoll, G.; Alberti, P.; Sanz, A.; Revilla, R.; Villalba, D.; Casasus, I. Effect of early weaning on performance, carcass and meat quality of spring-born bull calves raised in dry mountain areas. Livest. Sci. 2008, 115, 226–234. [Google Scholar] [CrossRef]
- Bures, D.; Barton, L. Growth performance, carcass traits and meat quality of bulls and heifers slaughtered at different ages. Czech J. Anim. Sci. 2012, 57, 34–43. [Google Scholar] [CrossRef]
- Cerdeño, A.; Vieira, C.; Serrano, E.; Lavín, P.; Mantecón, A.R. Effects of feeding strategy during a short finishing period on performance, carcass and meat quality in previously-grazed young bulls. Meat Sci. 2006, 72, 719–726. [Google Scholar] [CrossRef] [PubMed]
- Hennessy, D.W.; Morris, S.G.; Allingham, P.G. Improving the pre-weaning nutrition of calves by supplementation of the cow and/or the calf while grazing low quality pastures—2. calf growth, carcass yield and eating quality. Aust. J. Exp. Agric. 2001, 41, 715–724. [Google Scholar] [CrossRef]
- Oezluetuerk, A.; Esenbuga, N.; Yanar, M.; Uenlue, N.; Macit, M.; Kopuzlu, S. The effect of duration of finishing period on the performance, slaughter, carcass, and beef quality characteristics of eastern anatolian red bulls. Turk. J. Vet. Anim. Sci. 2008, 32, 441–448. [Google Scholar]
- Monteils, V.; Sibra, C. Rearing practices in each life period of beef heifers can be used to influence the carcass characteristics. Ital. J. Anim. Sci. 2019, 18, 734–745. [Google Scholar] [CrossRef]
- Soulat, J.; Picard, B.; Monteils, V. Influence of the rearing managements and carcass traits on the sensory properties of two muscles: Longissimus thoracis and rectus abdominis. Meat Sci. 2020, 169, 108204. [Google Scholar] [CrossRef]
- Ingrand, S.; Dedieu, B. Diversité des formules d’allotement en élevage bovin viande. Le cas d’exploitations du Limousin. Inrae Prod. Anim. 1996, 9, 189–199. [Google Scholar] [CrossRef]
- Soulat, J.; Picard, B.; Léger, S.; Monteils, V. Prediction of beef carcass and meat quality traits from factors characterising the rearing management system applied during the whole life of heifers. Meat Sci. 2018, 140, 88–100. [Google Scholar] [CrossRef]
- INRA. Alimentation des Bovins, Ovins et Caprins. Besoins des Animaux—Valeurs des Aliments; Quae: Versailles, France, 2010. [Google Scholar]
- Council Regulation (EC) No 1183/2006 of 24 July 2006 Concerning the Community Scale for the Classification of Carcasses of Adult Bovine Animals. Off. J. Eur. Union 2006, 214, 1–6.
- Ellies-Oury, M.P.; Durand, Y.; Delamarche, F.; Jouanno, M.; Lambert, J.; Micol, D.; Dumont, R. Relationships between the assessment of “grain of meat” and meat tenderness of charolais cattle. Meat Sci. 2013, 93, 397–404. [Google Scholar] [CrossRef] [PubMed]
- United Nations Economic Commission for Europ (UNECE). UNECE Standard: Standard Bovine Meat Carcases and Cuts; United Nations Publications: Geneva, Switzerland, 2016. [Google Scholar]
- Soulat, J.; Monteils, V.; Ellies-Oury, M.-P.; Papillon, S.; Picard, B. What is the impact of the rearing management applied during the heifers’ whole life on the toughness of five raw rib muscles in relation with carcass traits? Meat Sci. 2021, 179, 108533. [Google Scholar] [CrossRef] [PubMed]
- Commission International de l’Eclairage. Colorimetry, 2nd ed.; Commission International de l’Eclairage: Vienna, Austria, 1986. [Google Scholar]
- ISO 8586; General Guidelines for the Selection, Training and Monitoring of Selected Assessors and Expert Sensory Assessors. ISO: Geneva, Switzerland, 2014.
- Chinzorig, O.; Hwang, I. Mechanical Texture profile of Hanwoo muscles as a function of heating temperatures. J. Anim. Sci. Technol. 2018, 60, 22. [Google Scholar] [CrossRef] [PubMed]
- Texture Profile Analysis. Available online: http://texturetechnologies.com/resources/texture-profile-analysis (accessed on 5 July 2022).
- R core Team. R: A Language and Environment for Statistical Computing; R Foundation for Statistical Computing: Vienna, Austria, 2021. [Google Scholar]
- Le, S.; Josse, J.; Husson, F. FactoMineR: An R package for multivariate analysis. J. Stat. Softw. 2008, 25, 1–18. [Google Scholar] [CrossRef]
- de Mendiburu, F. Agricolae: Statistical Procedures for Agricultural Research. R Package Version 1.3-3. 2020. Available online: http://CRAN.R-project.org/package=agricolae (accessed on 5 July 2022).
- Graves, S.; Piepho, H.-P.; Selzer, L.; Dorai-Raj, S. MultcompView: Visualizations of Paired Comparisons. R Package Version 0.1-8. 2019. Available online: http://CRAN.R-project.org/package=multcompView (accessed on 5 July 2022).
- Hothorn, T.; Bretz, F.; Westfall, P. Simultaneous inference in general parametric models. Biom. J. 2008, 50, 346–363. [Google Scholar] [CrossRef]
- Kuznetsova, A.; Brockhoff, P.B.; Christensen, R.H.B. LmerTest Package: Tests in linear mixed effects models. J. Stat. Softw. 2017, 82, 1–26. [Google Scholar] [CrossRef]
- Lenth, R.V. Emmeans: Estimated Marginal Means, Aka Least-Squares Means. R Package Version 1.6.0. 2021. Available online: http://CRAN.R-project.org/package=emmeans (accessed on 5 July 2022).
- Marti, S.; Realini, C.E.; Bach, A.; Perez-Juan, M.; Devant, M. Effect of castration and slaughter age on performance, carcass, and meat quality traits of Holstein calves fed a high-concentrate diet. J. Anim. Sci. 2013, 91, 1129–1140. [Google Scholar] [CrossRef]
- do Prado, I.N.; Eiras, C.E.; Fugita, C.A.; Cortez Passetti, R.A.; Ornaghi, M.G.; Rivaroli, D.C.; Pinto, A.A.; Moletta, J.L. Animal performance and carcass characteristics of bulls (1/2 Puruna vs 1/2 Canchim) slaughtered at 16 and 22 months old, and three different weights. Asian-Australas. J. Anim. Sci. 2015, 28, 612–619. [Google Scholar] [CrossRef]
- Barton, L.; Kudrna, V.; Bures, D.; Zahradkova, R.; Teslik, V. Performance and carcass quality of Czech Fleckvieh, Charolais and Charolais x Czech Fleckvieh bulls fed diets based on different types of silages. Czech J. Anim. Sci. 2007, 52, 269–276. [Google Scholar] [CrossRef]
- Costa, A.S.H.; Costa, P.; Bessa, R.J.B.; Lemos, J.P.C.; Simoes, J.A.; Santos-Silva, J.; Fontes, C.M.G.A.; Prates, J.A.M. Carcass fat partitioning and meat quality of alentejana and barrosa young bulls fed high or low maize silage diets. Meat Sci. 2013, 93, 405–412. [Google Scholar] [CrossRef]
- Warren, H.E.; Scollan, N.D.; Enser, M.; Hughes, S.I.; Richardson, R.I.; Wood, J.D. Effects of breed and a concentrate or grass silage diet on beef quality in cattle of 3 ages. i: Animal performance, carcass quality and muscle fatty acid composition. Meat Sci. 2008, 78, 256–269. [Google Scholar] [CrossRef] [PubMed]
- Aydin, R.; Yanar, M.; Diler, A.; Kocyigit, H.; Tuzemen, N. Effects of different slaughter ages on the fattening performance, slaughter and carcass traits of brown swiss and holstein friesian young bulls. Indian J. Anim. Res. 2013, 47, 10–16. [Google Scholar]
- Keane, M.G.; Drennan, M.J.; Moloney, A.P. Comparison of supplementary concentrate levels with grass silage, separate or total mixed ration feeding, and duration of finishing in beef steers. Livest. Sci. 2006, 103, 169–180. [Google Scholar] [CrossRef]
- Guerrero, A.; Sanudo, C.; Alberti, P.; Ripoll, G.; Campo, M.M.; Olleta, J.L.; Panea, B.; Khliji, S.; Santolaria, P. Effect of production system before the finishing period on carcass, meat and fat qualities of beef. Animal 2013, 7, 2063–2072. [Google Scholar] [CrossRef]
- Keady, T.W.J.; Gordon, A.W.; Moss, B.W. Effects of replacing grass silage with maize silages differing in inclusion level and maturity on the performance, meat quality and concentrate-sparing effect of beef cattle. Animal 2013, 7, 768–777. [Google Scholar] [CrossRef] [PubMed]
- Wood, K.M.; Salim, H.; McEwen, P.L.; Mandell, I.B.; Miller, S.P.; Swanson, K.C. The Effect of corn or sorghum dried distillers grains plus solubles on growth performance and carcass characteristics of cross-bred beef steers. Anim. Feed Sci. Technol. 2011, 165, 23–30. [Google Scholar] [CrossRef]
- Dunne, P.G.; Monahan, F.J.; O’Mara, F.P.; Moloney, A.P. Colour of bovine subcutaneous adipose tissue: A review of contributory factors, associations with carcass and meat quality and its potential utility in authentication of dietary history. Meat Sci. 2009, 81, 28–45. [Google Scholar] [CrossRef]
- Aviles, C.; Martinez, A.L.; Domenech, V.; Pena, F. Effect of feeding system and breed on growth performance, and carcass and meat quality traits in two continental beef breeds. Meat Sci. 2015, 107, 94–103. [Google Scholar] [CrossRef]
- Moloney, A.P.; Keane, M.G.; Dunne, P.G.; Mooney, M.T.; Troy, D.J. Effect of concentrate feeding pattern in a grass silage/concentrate beef finishing system on performance, selected carcass and meat quality characteristics. Meat Sci. 2008, 79, 355–364. [Google Scholar] [CrossRef]
- Keady, T.W.J.; Lively, F.O.; Kilpatrick, D.J.; Moss, B.W. Effects of replacing grass silage with either maize or whole-crop wheat silages on the performance and meat quality of beef cattle offered two levels of concentrates. Animal 2007, 1, 613–623. [Google Scholar] [CrossRef]
- Pesonen, M.; Honkavaara, M.; Kamarainen, H.; Tolonen, T.; Jaakkola, M.; Virtanen, V.; Huuskonen, A. Effects of concentrate level and rapeseed meal supplementation on performance, carcass characteristics, meat quality and valuable cuts of hereford and Charolais bulls offered grass silage-barley-based rations. Agric. Food Sci. 2013, 22, 151–167. [Google Scholar] [CrossRef]
- Sargentini, C.; Bozzi, R.; Lorenzini, G.; Degl’Innocenti, P.; Martini, A.; Giorgetti, A. Productive performances of Maremmana young bulls reared following organic rules and slaughtered at 18 and 24 months of age. Ital. J. Anim. Sci. 2010, 9, 31. [Google Scholar] [CrossRef]
- Kerth, C.R.; Braden, K.W.; Cox, R.; Kerth, L.K.; Rankins, D.L., Jr. Carcass, sensory, fat color, and consumer acceptance characteristics of Angus-cross steers finished on ryegrass (Lolium multiflorum) forage or on a high-concentrate diet. Meat Sci. 2007, 75, 324–331. [Google Scholar] [CrossRef]
- Moloney, A.P.; Keane, M.G.; Mooney, M.T.; Rezek, K.; Smulders, F.J.M.; Troy, D.J. Energy supply patterns for finishing steers: Feed conversion efficiency, components of bodyweight gain and meat quality. Meat Sci. 2008, 79, 86–97. [Google Scholar] [CrossRef] [PubMed]
- Dransfield, E.; Martin, J.F.; Bauchart, D.; Abouelkaram, S.; Lepetit, J.; Culioli, J.; Jurie, C.; Picard, B. Meat quality and composition of three muscles from french cull cows and young bulls. Anim. Sci. 2003, 76, 387–399. [Google Scholar] [CrossRef]

| Pre-Weaning Period | ||
| Quantitative Rearing Factors | Description of the Rearing Factor | |
| Age of the cow (years) | Age of the young bull’s mother at the young bull’s birth. | |
| Age at first calving (years) | Age of the young bull’s mother at first calving. | |
| Age at weaning (months) | Age of the young bull at weaning. | |
| Housing_duration_PWP (days) | Number of days spent in stall during PWP. | |
| Outside_duration_PWP (days) | Number of days spent outside during PWP. | |
| Pasture_duration_PWP (days) | Number of days spent at pasture during PWP. | |
| Conc_housing_PWP (days) | Number of days of offered concentrates in the calf’s diet during housing. | |
| Conc_PWP (days) | Number of days of offered concentrates in the calf’s diet during PWP. | |
| Conc_CP_housing_PWP (%) | Calculated average of the concentrates’ crude protein in the housing diet during PWP. | |
| Conc_NE_housing_PWP (Mcal) | Calculated average of the concentrates’ net energy in the housing diet during PWP. | |
| Conc_CP_PWP (%) | Calculated average of the concentrates’ crude protein in the diet during PWP. | |
| Conc_NE_PWP (Mcal) | Calculated average of the concentrates’ net energy in the diet during PWP. | |
| Qualitative Rearing Factors | Modalities of the Rearing Factors | Description of the Rearing Factor |
| Insemination type | Artificial | Artificial insemination using frozen semen. |
| Natural | Insemination performed by a bull. | |
| Calving | Easy | Natural calving. |
| Help | Farmer intervention during the calving. | |
| Forage_housing_PWP | Other_PWP | The main forage in the housing diet of the calf during PWP was grass silage or corn silage or wrapped haylage or alfalfa hay. |
| Hay_PWP | Hay was the only forage in the housing diet of the calf during PWP. | |
| No | No offered forages in housing calf diet during PWP. | |
| Conc_outside_duration_PWP | No | No offered concentrates in outside calf diet during PWP. |
| [60 days; 150 days] | Offered concentrates in outside calf diet during PWP between 60 and 150 days. | |
| >150 days | Offered concentrates in outside calf diet during PWP above 150 days. | |
| Conc_CP_outside_PWP (%) | No | No offered concentrates in pasture calf diet during PWP. |
| <18% | Across the whole pasture of PWP, the calculated average of the concentrates’ crude protein content was below 18%. | |
| >18% | Across the whole pasture of PWP, the calculated average of the concentrates’ crude protein content was above 18%. | |
| Conc_NE_outside_PWP (Mcal) | No | No offered concentrates in pasture calf diet during PWP. |
| <1.8 Mcal | Across the whole pasture of PWP, the calculated average of the concentrates’ net energy content was below 1.8 Mcal. | |
| >1.8 Mcal | Across the whole pasture of PWP, the calculated average of the concentrates’ net energy content was above 1.8 Mcal. | |
| Growth Period | ||
| Qualitative Rearing Factors | Modalities of the Rearing Factors | Description of the Rearing Factor |
| GP_duration (days) | No | The young bulls had no GP. |
| <60 days | The GP duration was below 60 days. | |
| [60 days; 100 days] | The GP duration was between 60 and 100 days. | |
| >100 days | The GP duration was above 100 days. | |
| Forage_housing_GP | No | The young bulls had no GP. |
| Wrapped_haylage | Across the whole GP, the main forage in the housing diet was wrapped haylage (>80%). | |
| Corn_silage | Across the whole GP, the main forage in the housing diet was corn silage (>57%). | |
| Hay_GP | Across the whole GP, the main forage in the housing diet was hay (>75%). | |
| Straw_GP | Across the whole GP, the main forage in the housing diet was straw (>60%). | |
| Grass_silage_GP | Across the whole GP, the main forage in the housing diet was grass silage (>65%). | |
| Hay and Straw_GP | Across the whole GP, the main forage in the housing diet was hay and straw (100%). | |
| Conc_quanti_intake_GP (kg) | No | The young bulls had no GP. |
| <200 kg | The concentrate quantity intake during the GP was below 200 kg. | |
| [200 kg; 300 kg] | The concentrate quantity intake during the GP was between 300 and 600 kg. | |
| [300 kg; 600 kg] | The concentrate quantity intake during the GP was between 200 and 300 kg. | |
| >600 kg | The concentrate quantity intake during the GP was above 600 kg. | |
| Conc_CP_GP (%) | No | The young bulls had no GP. |
| <15% | Across the whole GP, the calculated average of the concentrates’ crude protein content was below 15%. | |
| [15%; 20%] | Across the whole GP, the calculated average of the concentrates’ crude protein content was between 15% and 20%. | |
| >20% | Across the whole GP, the calculated average of the concentrates’ crude protein content was above 20%. | |
| Conc_NE_GP (Mcal) | No | The young bulls had no GP. |
| <1.8 Mcal | Across the whole GP, the calculated average of the concentrates’ net energy content was below 1.8 Mcal. | |
| [1.8 Mcal; 2 Mcal] | Across the whole GP, the calculated average of the concentrates’ net energy content was between 1.8 Mcal and 2 Mcal. | |
| >2 Mcal | Across the whole GP, the calculated average of the concentrates’ net energy content was above 2 Mcal. | |
| Fattening Period | ||
| Quantitative Rearing Factors | Description of the Rearing Factor | |
| Age of early fattening (months) | Age of the young bull at the beginning of FP. | |
| Slaughter age (months) | Age of the young bull at slaughter. | |
| FP_duration (days) | Number of days between the beginning of FP and slaughter. | |
| Conc_quanti_intake_FP (kg) | Total concentrate quantity intake per heifer during the whole FP. | |
| Conc_CP_FP (%) | Calculated average of the concentrates’ crude protein content across the whole FP. | |
| Conc_NE_FP (Mcal) | Calculated average of the concentrates’ net energy content across the whole FP. | |
| Qualitative Rearing Factors | Modalities of the Rearing Factors | Description of the Rearing Factor |
| Main forage in the FP diet (%) | Wrapped_haylage_FP | The percentage of wrapped haylage in the FP diet was 100%. |
| Corn_silage_FP | The percentage of corn silage in the FP diet was above 76%. | |
| Hay_FP | The percentage of hay in the FP diet was above 80%. | |
| Straw_FP | The percentage of straw in the FP diet was above 75%. | |
| Hay&Straw_FP | The percentage of hay and straw in the FP diet was 100%. | |
| Descriptors | Definition |
|---|---|
| Red color intensity | Refers to the red color intensity of the meat sample after cooking (‘0 = light’ to ‘10 = dark’). |
| Initial tenderness | Facility to chew and cut the meat sample at the first bite (‘0 = tough’ to ‘10 = very tender’). |
| Overall tenderness | Time of chewing and number of chews required to masticate the meat sample, ready for swallowing (‘0 = tough’ to ‘10 = very tender’). |
| Overall juiciness | Perception of water content in the meat sample during the mastication (‘0 = dry’ to ‘10 = very juicy’). |
| Presence of nerves | Quantity of nerves perceived in the meat sample (‘0 = none’ to ‘10 = very important’). |
| Residue | Amount of residue after chewing (‘0 = none’ to ‘10 = very important’). |
| Flavor intensity | Global flavor intensity assessment of the beef meat (‘0 = none’ to ‘10 = very intense’). |
| Fat aroma | Fat aroma intensity (‘0 = none’ to ‘10 = very intense’). |
| Atypical flavor | Flavor associated with aromas that should not normally be present in meat (e.g., aftertaste, rancid) (‘0 = none’ to ‘10 = very intense’). |
| Flavor persistence | Refers to remnant beef flavor duration in the mouth, perceived after swallowing (‘0 = very quick’ to ‘10 = very long’). |
| Overall acceptability | Overall liking (hedonic perception) of the meat sample (‘0 = highly disliked’ to ‘10 = highly liked’). |
| Pre-Weaning Period | Overall (n = 179) | Rearing Managements | p | |||||
|---|---|---|---|---|---|---|---|---|
| RM-1 (n = 21) | RM-2 (n = 44) | RM-3 (n = 58) | RM-4 (n = 33) | RM-5 (n = 23) | ||||
| Quantitative Rearing Factors | Mean ± SE | Mean ± SE | Mean ± SE | Mean ± SE | Mean ± SE | Mean ± SE | ||
| Age of the cow (years) | 5.3 ± 0.1 | 5.1 ± 0.5 | 5.0 ± 0.3 | 5.8 ± 0.3 | 5.0 ± 0.4 | 5.0 ± 0.4 | 0.16 | |
| Age at first calving (years) | 2.9 ± 0.01 | 2.7 c ± 0.06 | 2.9 b ± 0.03 | 3.0 a ± 0.03 | 3.0 ab ± 0.02 | 2.9 ab ± 0.02 | <0.001 | |
| Age at weaning (months) | 8.3 ± 0.1 | 10.5 a ± 0.3 | 7.9 b ± 0.1 | 8.3 b ± 0.09 | 7.3 c ± 0.1 | 8.1 b ± 0.2 | <0.001 | |
| Housing_duration_PWP (days) | 88.8 ± 4.1 | 162.5 a ± 2.4 | 130.4 b ± 7.2 | 71.3 c ± 4.2 | 47.8 d ± 6.6 | 45.3 d ± 5.7 | <0.001 | |
| Outside_duration_PWP (days) | 162.4 ± 3.4 | 156.6 c ± 7.1 | 110.7 d ± 7.0 | 181.5 ab ± 3.7 | 173.9 bc ± 4.9 | 202.0 a ± 2.3 | <0.001 | |
| Pasture_duration_PWP (days) | 132.7 ± 5.7 | 156.6 a ± 7.1 | 87.0 b ± 10.6 | 107.9 b ± 11.7 | 173.9 a ± 4.9 | 202.0 a ± 2.3 | <0.001 | |
| Conc_housing_PWP (days) | 69.4 ± 4.1 | 115.1 a ± 8.9 | 126.5 a ± 6.6 | 58.5 b ± 3.1 | 0.0 c ± 0.0 | 45.3 b ± 5.7 | <0.001 | |
| Conc_PWP (days) | 167.2 ± 6.8 | 115.1 c ± 8.9 | 213.5 ab ± 6.5 | 192.5 b ± 11.5 | 38.3 d ± 7.0 | 247.4 a ± 5.0 | <0.001 | |
| Conc_CP_housing_PWP (%) | 13.1 ± 0.5 | 17.0 a ± 0.5 | 15.6 ab ± 0.4 | 16.9 a ± 0.4 | 0.0 c ± 0.0 | 13.9 b ± 1.1 | <0.001 | |
| Conc_NE_housing_PWP (Mcal) | 1.4 ± 0.06 | 1.8 b ± 0.002 | 2.1 a ± 0.07 | 1.7 b ± 0.05 | 0.0 d ± 0.0 | 1.3 c ± 0.1 | <0.001 | |
| Conc_CP_PWP (%) | 15.9 ± 0.4 | 17.0 a ± 0.5 | 17.3 a ± 0.3 | 17.5 a ± 0.1 | 10.4 b ± 1.9 | 15.7 a ± 0.001 | <0.001 | |
| Conc_NE_PWP (Mcal) | 1.7 ± 0.04 | 1.8 a ± 0.002 | 2.0 a ± 0.07 | 1.7 a ± 0.03 | 0.9 b ± 0.2 | 1.9 a ± 0.001 | <0.001 | |
| Qualitative Rearing Factors | Modalities of the Rearing Factors | n | ||||||
| Insemination type | Artificial | 43 | 33.3% | 45.5% | 5.2% | 39.4% | 0% | <0.001 |
| Natural | 136 | 66.7% | 54.5% | 94.8% | 60.6% | 100% | ||
| Calving | Easy | 125 | 66.7% | 31.8% | 84.5% | 87.9% | 82.6% | <0.001 |
| Help | 54 | 33.3% | 68.2% | 15.5% | 12.1% | 17.4% | ||
| Forage_housing_PWP | Other_PWP | 27 | 52.4% | 25.0% | 8.6% | 0% | 0% | <0.001 |
| Hay_PWP | 72 | 47.6% | 75.0% | 50.0% | 0% | 0% | ||
| No | 80 | 0% | 0% | 41.4% | 100% | 100% | ||
| Conc_outside_duration_PWP (days) | No | 66 | 100% | 34.1% | 22.4% | 51.5% | 0% | <0.001 |
| [60 days; 150 days] | 48 | 0% | 52.3% | 15.5% | 48.5% | 0% | ||
| >150 days | 65 | 0% | 13.6% | 62.1% | 0% | 100% | ||
| Conc_CP_outside_PWP (%) | No | 66 | 100% | 34.1% | 22.4% | 51.5% | 0% | <0.001 |
| <18% | 64 | 0% | 0% | 70.7% | 0% | 100% | ||
| >18% | 49 | 0% | 65.9% | 6.9% | 48.5% | 0% | ||
| Conc_NE_outside_PWP (Mcal) | No | 66 | 100% | 34.1% | 22.4% | 51.5% | 0% | <0.001 |
| <1.8 Mcal | 74 | 0% | 65.9% | 77.6% | 0% | 0% | ||
| >1.8 Mcal | 39 | 0% | 0% | 0% | 48.5% | 100% | ||
| Growth Period | Overall (n = 179) | Rearing Managements | p | |||||
|---|---|---|---|---|---|---|---|---|
| RM-1 (n = 21) | RM-2 (n = 44) | RM-3 (n = 58) | RM-4 (n = 33) | RM-5 (n = 23) | ||||
| Qualitative Rearing Factors | Modalities of the Rearing Factors | n | ||||||
| GP_duration (days) | No | 41 | 100% | 0% | 31.0% | 6.1% | 0% | <0.001 |
| <60 days | 53 | 0% | 20.5% | 67.2% | 15.2% | 0% | ||
| [60 days; 100 days] | 48 | 0% | 61.4% | 1.7% | 60.6% | 0% | ||
| >100 days | 37 | 0% | 18.2% | 0% | 18.2% | 100% | ||
| Forage_housing_GP | No | 43 | 100% | 4.5% | 31.0% | 6.1% | 0% | <0.001 |
| Wrapped_haylage | 29 | 0% | 65.9% | 0% | 0% | 0% | ||
| Corn_silage | 24 | 0% | 18.2% | 0% | 48.5% | 0% | ||
| Hay_GP | 37 | 0% | 4.5% | 60.3% | 0% | 0% | ||
| Straw_GP | 3 | 0% | 6.8% | 0% | 0% | 0% | ||
| Grass_silage_GP | 24 | 0% | 0% | 1.7% | 0% | 100% | ||
| Hay and Straw_GP | 19 | 0% | 0% | 6.9% | 45.5% | 0% | ||
| Conc_quanti_intake_GP (kg) | No | 41 | 100% | 0% | 31.0% | 6.1% | 0% | <0.001 |
| <200 kg | 44 | 0% | 6.8% | 62.1% | 15.2% | 0% | ||
| [200 kg; 300 kg] | 37 | 0% | 22.7% | 6.9% | 60.6% | 13.0% | ||
| [300 kg; 600 kg] | 30 | 0% | 9.1% | 0% | 18.2% | 87.0% | ||
| >600 kg | 27 | 0% | 61.4% | 0% | 0% | 0% | ||
| Conc_CP_GP (%) | No | 41 | 100% | 0% | 31.0% | 6.1% | 0% | <0.001 |
| <15% | 24 | 0% | 0% | 1.7% | 0% | 100% | ||
| [15%; 20%] | 71 | 0% | 81.8% | 32.8% | 48.5% | 0% | ||
| >20% | 43 | 0% | 18.2% | 34.5% | 45.5% | 0% | ||
| Conc_NE_GP (Mcal) | No | 41 | 100% | 0% | 31.0% | 6.1% | 0% | <0.001 |
| <1.8 Mcal | 23 | 0% | 0% | 39.7% | 0% | 0% | ||
| [1.8 Mcal; 2 Mcal] | 79 | 0% | 100% | 6.9% | 93.9% | 0% | ||
| >2 Mcal | 36 | 0% | 0% | 22.4% | 0% | 100% | ||
| Fattening Period | Overall (n = 179) | Rearing Managements | p | |||||
|---|---|---|---|---|---|---|---|---|
| RM-1 (n = 21) | RM-2 (n = 44) | RM-3 (n = 58) | RM-4 (n = 33) | RM-5 (n = 23) | ||||
| Quantitative Rearing Factors | Mean ± SE | Mean ± SE | Mean ± SE | Mean ± SE | Mean ± SE | Mean ± SE | ||
| Age of early fattening (months) | 10.2 ± 0.1 | 10.5 b ± 0.3 | 10.4 b ± 0.2 | 9.0 c ± 0.1 | 9.6 c ± 0.2 | 13.7 a ± 0.2 | <0.001 | |
| Slaughter age (months) | 17.0 ± 0.1 | 15.8 c ± 0.2 | 17.0 b ± 0.2 | 16.5 bc ± 0.1 | 16.2 c ± 0.2 | 20.3 a ± 0.2 | <0.001 | |
| FP_duration (days) | 207.1 ± 3.4 | 162.6 c ± 11.9 | 202.6 b ± 8.3 | 230.6 a ± 4.6 | 203.3 b ± 5.4 | 202.3 b ± 3.3 | <0.001 | |
| Conc_quanti_intake_FP (kg) | 1449.3 ± 32.9 | 1355.9 b ± 118.9 | 1298.1 b ± 58.4 | 1641.7 a ± 70.3 | 1387.5 b ± 43.2 | 1427.3 ab ± 23.7 | <0.001 | |
| Conc_CP_FP (%) | 18.6 ± 0.3 | 16.7 cd ± 0.1 | 20.3 a ± 0.2 | 19.6 ab ± 0.6 | 18.3 bc ± 0.3 | 14.5 d ± 0.0 | <0.001 | |
| Conc_NE_FP (Mcal) | 1.9 ± 0.01 | 1.9 ab ± 0.02 | 1.9 a ± 0.01 | 1.9 b ± 0.03 | 1.8 b ± 0.02 | 2.0 a ± 0.0 | <0.001 | |
| Qualitative Rearing Factors | Modalities of the Rearing Factors | n | ||||||
| Main forage in the FP diet (%) | Wrapped_haylage_FP | 11 | 52.4% | 0% | 0% | 0% | 0% | <0.001 |
| Corn_silage_FP | 77 | 47.6% | 84.1% | 48.3% | 6.1% | 0% | ||
| Hay_FP | 27 | 0% | 9.1% | 0% | 0% | 100% | ||
| Straw_FP | 52 | 0% | 6.8% | 31% | 93.9% | 0% | ||
| Hay&Straw_FP | 12 | 0% | 0% | 20.7% | 0% | 0% | ||
| Carcass Traits | Overall | Rearing Managements | p | ||||
|---|---|---|---|---|---|---|---|
| RM-1 | RM-2 | RM-3 | RM-4 | RM-5 | |||
| Mean ± SE | Mean ± SE | Mean ± SE | Mean ± SE | Mean ± SE | Mean ± SE | ||
| n = 179 | n = 21 | n = 44 | n = 58 | n = 33 | n = 23 | ||
| Cold weight (kg) | 444 ± 33 | 447 ± 4 | 439 ± 4 | 453 ± 5 | 439 ± 4 | 435 ± 5 | 0.15 |
| Conformation score (scale 1 to 15) | 10.2 ± 2.7 | 10.4 ± 0.3 | 10.1 ± 0.2 | 10.2 ± 0.2 | 9.9 ± 0.2 | 10.5 ± 0.3 | 0.16 |
| Fat score (scale 1 to 5) | 2.7 ± 0.2 | 2.8 a ± 0.1 | 2.4 b ± 0.1 | 2.8 a ± 0.1 | 2.8 a ± 0.1 | 3.0 a ± 0.1 | <0.001 |
| Assessment at the 6th rib level | n = 174 | n = 21 | n = 44 | n = 55 | n = 31 | n = 23 | |
| Subcutaneous fat (cm) | 0.8 ± 0.06 | 0.5 ab ± 0.3 | 0.1 b ± 0.3 | 0.6 b ± 0.2 | 0.2 b ± 0.3 | 1.3 a ± 0.3 | <0.001 |
| Longissimus muscle seepage (scale 1 to 5) | 2.2 ± 0.2 | 2.1 ± 0.3 | 2.1 ± 0.3 | 2.2 ± 0.3 | 2.6 ± 0.3 | 2.4 ± 0.4 | 0.28 |
| Intermuscular fat (scale 1 to 5) | 1.4 ± 0.1 | 1.1 c ± 0.1 | 1.1 c ± 0.1 | 1.3 bc ± 0.1 | 1.6 a ± 0.1 | 1.6 ab ± 0.1 | <0.001 |
| Nerves (scale 1 to 5) | 1.5 ± 0.1 | 1.5 ± 0.2 | 1.2 ± 0.2 | 1.3 ± 0.2 | 1.2 ± 0.2 | 1.3 ± 0.2 | 0.48 |
| Overall meat grain (scale 1 to 5) | 2.0 ± 0.1 | 1.8 b ± 0.1 | 1.9 b ± 0.1 | 2.0 ab ± 0.1 | 2.4 a ± 0.1 | 2.2 ab ± 0.2 | 0.003 |
| Longissimus meat grain (scale 1 to 5) | 1.9 ± 0.1 | 1.8 ± 0.2 | 1.5 ± 0.2 | 1.9 ± 0.2 | 1.7 ± 0.2 | 1.7 ± 0.3 | 0.16 |
| Rhomboideus meat grain (scale 1 to 5) | 1.4 ± 0.1 | 1.2 ± 0.2 | 1.2 ± 0.2 | 1.2 ± 0.2 | 1.4 ± 0.2 | 1.4 ± 0.2 | 0.19 |
| Fat color (scale 0 to 9) | 1.5 ± 0.1 | 1.2 a ± 0.2 | 1.2 a ± 0.2 | 1.1 a ± 0.2 | 0.4 b ± 0.2 | 1.2 a ± 0.2 | <0.001 |
| Homogeneous color of muscles at the 6th rib (scale 1 to 4) | 1.8 ± 0.1 | 1.9 ab ± 0.1 | 1.6 b ± 0.1 | 1.9 ab ± 0.1 | 2.3 a ± 0.1 | 1.9 ab ± 0.2 | 0.002 |
| Longissimus color (scale 0 to 7) | 2.4 ± 0.2 | 2.0 ± 0.4 | 2.0 ± 0.4 | 2.0 ± 0.3 | 1.5 ± 0.4 | 1.9 ± 0.4 | 0.08 |
| Longissimus marbling (scale 0 to 6) | 0.7 ± 0.05 | 0.8 ± 0.2 | 0.6 ± 0.2 | 0.6 ± 0.2 | 0.7 ± 0.2 | 0.5 ± 0.2 | 0.66 |
| Meat Traits | Overall | Rearing Managements | p | ||||
|---|---|---|---|---|---|---|---|
| RM-1 | RM-2 | RM-3 | RM-4 | RM-5 | |||
| Mean ± SE | Mean ± SE | Mean ± SE | Mean ± SE | Mean ± SE | Mean ± SE | ||
| Seratus ventralis muscle | n = 163 | n = 20 | n = 42 | n = 55 | n = 28 | n = 18 | |
| Shear force (N/cm2) | 80.5 ± 6.3 | 83.4 ± 5.6 | 74.2 ± 3.6 | 76.9 ± 2.5 | 88.3 ± 5.6 | 85.0 ± 6.5 | 0.06 |
| Longissimus muscle | |||||||
| Raw meat | |||||||
| Color descriptors | n = 166 | n = 21 | n = 42 | n = 58 | n = 27 | n = 18 | |
| L* | 44.9 ± 3.5 | 44.5 b ± 0.5 | 43.9 b ± 0.5 | 44.3 b ± 0.4 | 47.3 a ± 0.6 | 46.2 ab ± 0.6 | <0.001 |
| a* | 18.5 ± 1.4 | 17.1 ± 0.7 | 19.3 ± 0.5 | 18.4 ± 0.5 | 19.1 ± 0.6 | 17.5 ± 0.7 | 0.06 |
| b* | 12.2 ± 0.9 | 11.4 b ± 0.2 | 11.9 b ± 0.2 | 12.2 b ± 0.1 | 13.1 a ± 0.2 | 12.3 ab ± 0.2 | <0.001 |
| TPA texture profile | n = 126 | n = 16 | n = 30 | n = 53 | n = 17 | n = 10 | |
| Springiness | 0.47 ± 0.04 | 0.4 ± 0.02 | 0.5 ± 0.01 | 0.5 ± 0.01 | 0.5 ± 0.02 | 0.4 ± 0.02 | 0.83 |
| Hardness | 1.5 ± 0.1 | 1.6 ± 0.1 | 1.5 ± 0.1 | 1.4 ± 0.05 | 1.5 ± 0.1 | 1.5 ± 0.1 | 0.52 |
| Cohesiveness | 2.3 ± 0.2 | 2.8 ± 0.4 | 2.7 ± 0.3 | 2.1 ± 0.2 | 1.8 ± 0.3 | 1.8 ± 0.3 | 0.06 |
| Resilience | 0.2 ± 0.02 | 0.3 ± 0.03 | 0.3 ± 0.02 | 0.2 ± 0.01 | 0.2 ± 0.02 | 0.2 ± 0.02 | 0.06 |
| Gumminess | 3.3 ± 0.3 | 4.3 ± 0.5 | 4.1 ± 0.5 | 3.0 ± 0.3 | 2.7 ± 0.5 | 2.7 ± 0.6 | 0.06 |
| Chewiness | 1.5 ± 0.1 | 1.9 ± 0.2 | 1.8 ± 0.2 | 1.3 ± 0.1 | 1.3 ± 0.2 | 1.3 ± 0.3 | 0.06 |
| Cooked meat | Emmean ± SE | Emmean ± SE | Emmean ± SE | Emmean ± SE | Emmean ± SE | ||
| Sensory descriptors (0–10 scale) | n = 166 | n = 21 | n = 42 | n = 58 | n = 27 | n = 18 | |
| Red color intensity | 3.1 ± 0.2 | 3.2 ± 0.3 | 2.9 ± 0.2 | 3.3 ± 0.2 | 2.9 ± 0.3 | 2.6 ± 0.3 | 0.31 |
| Initial tenderness | 6.1 ± 0.5 | 6.1 ab ± 0.2 | 5.8 b ± 0.2 | 6.2 a ± 0.1 | 6.4 a ± 0.2 | 6.1 ab ± 0.2 | 0.001 |
| Overall tenderness | 5.7 ± 0.4 | 5.7 ab ± 0.2 | 5.4 b ± 0.2 | 5.8 a ± 0.2 | 5.9 a ± 0.2 | 5.7 ab ± 0.2 | 0.007 |
| Overall juiciness | 4.3 ± 0.3 | 4.6 ± 0.3 | 4.7 ± 0.3 | 4.4 ± 0.3 | 4.2 ± 0.3 | 4.4 ± 0.3 | 0.17 |
| Presence of nerves | 2.0 ± 0.2 | 1.9 ± 0.3 | 2.2 ± 0.2 | 2.0 ± 0.2 | 1.9 ± 0.2 | 2.0 ± 0.3 | 0.18 |
| Residue | 2.9 ± 0.2 | 3.0 ± 0.2 | 3.0 ± 0.2 | 2.9 ± 0.2 | 2.9 ± 0.2 | 3.0 ± 0.2 | 0.87 |
| Flavor intensity | 5.7 ± 0.4 | 5.7 ± 0.2 | 5.7 ± 0.2 | 5.7 ± 0.1 | 5.8 ± 0.2 | 5.7 ± 0.2 | 0.84 |
| Fat aroma | 3.5 ± 0.3 | 3.8 ± 0.3 | 3.4 ± 0.3 | 3.6 ± 0.3 | 3.6 ± 0.3 | 3.4 ± 0.3 | 0.10 |
| Atypical flavor | 1.1 ± 0.1 | 0.8 ± 0.3 | 0.8 ± 0.3 | 1.0 ± 0.3 | 1.3 ± 0.3 | 1.0 ± 0.3 | 0.07 |
| Flavor persistence | 4.7 ± 0.4 | 4.6 ± 0.2 | 4.7 ± 0.2 | 4.7 ± 0.2 | 4.8 ± 0.2 | 4.6 ± 0.2 | 0.79 |
| Overall acceptability | 5.1 ± 0.4 | 5.4 ± 0.2 | 5.2 ± 0.2 | 5.0 ± 0.2 | 5.2 ± 0.2 | 4.9 ± 0.2 | 0.41 |
Publisher’s Note: MDPI stays neutral with regard to jurisdictional claims in published maps and institutional affiliations. |
© 2022 by the authors. Licensee MDPI, Basel, Switzerland. This article is an open access article distributed under the terms and conditions of the Creative Commons Attribution (CC BY) license (https://creativecommons.org/licenses/by/4.0/).
Share and Cite
Soulat, J.; Monteils, V.; Picard, B. Effects of Rearing Management Applied throughout the Charolais Young Bulls’ Life on Carcass and Meat Quality. Foods 2022, 11, 2878. https://doi.org/10.3390/foods11182878
Soulat J, Monteils V, Picard B. Effects of Rearing Management Applied throughout the Charolais Young Bulls’ Life on Carcass and Meat Quality. Foods. 2022; 11(18):2878. https://doi.org/10.3390/foods11182878
Chicago/Turabian StyleSoulat, Julien, Valérie Monteils, and Brigitte Picard. 2022. "Effects of Rearing Management Applied throughout the Charolais Young Bulls’ Life on Carcass and Meat Quality" Foods 11, no. 18: 2878. https://doi.org/10.3390/foods11182878
APA StyleSoulat, J., Monteils, V., & Picard, B. (2022). Effects of Rearing Management Applied throughout the Charolais Young Bulls’ Life on Carcass and Meat Quality. Foods, 11(18), 2878. https://doi.org/10.3390/foods11182878