Article

Consumer Choices and Habits Related to Tea Consumption by Poles

by
Ewa Czarniecka-Skubina
1,*,
Renata Korzeniowska-Ginter
2,
Marlena Pielak
1,
Piotr Sałek
1,
Tomasz Owczarek
3 and
Agata Kozak
1
1
Department of Food Gastronomy and Food Hygiene, Institute of Human Nutrition Sciences, Warsaw University of Life Sciences (WULS), Str. Nowoursynowska 166, 02-787 Warsaw, Poland
2
Department of Quality Management, Gdynia Maritime University, Str. Morska 81-87, 81-225 Gdynia, Poland
3
Department of Management and Economics, Gdynia Maritime University, Str. Morska 81-87, 81-225 Gdynia, Poland
*
Author to whom correspondence should be addressed.
Foods 2022, 11(18), 2873; https://doi.org/10.3390/foods11182873
Submission received: 9 August 2022 / Revised: 13 September 2022 / Accepted: 13 September 2022 / Published: 16 September 2022

Abstract

:
Tea is one of the most consumed beverages in the world. In the literature, much attention is paid to the influence of tea and its components on human health and consumer purchasing behavior. The aim of the study was to analyze the habits of Polish consumers regarding tea consumption, brewing methods, and their choices related to tea, to describe the characteristics of tea consumers, and present their segmentation based on consumer choices and habits regarding tea consumption. The study was performed using the computer-assisted web interviewing (CAWI) method on a group of 1700 adult consumers of tea. Information about consumer choices and habits related to tea consumption was collected, including brewing method, place of tea consumption, and factors determining tea choices. Using cluster analysis, six groups of tea consumers were identified. These are “Occasional tea gourmets”, “Yerba mate drinkers”, “Tea gourmets”, “Occasional consumers”, “Undemanding tea consumers,” and “Occasional strong tea consumers”. In summary, it can be said that Poles are not tea gourmets; they prefer black tea, in bags, brewed in cups or glasses for up to 3 min, and usually drink teas without any additives, at home, several times a week, during breakfast and between meals. The most popular brand among the respondents was Lipton. Consumers have little knowledge of the health benefits of tea.

1. Introduction

Tea is one of the most consumed beverages in the world for its health, sensory, stimulant, relaxing, and cultural properties. Depending on the place in the world, the preferences related to the method of brewing and serving tea are different [1].
The tea culture was established in China. During the late eighth century, it was introduced in Japan and became an important part of Japanese culture. Tea is also recognized as one of the cultural beverages in the United Kingdom, also in Middle Eastern and North African cultures, as well as in Russia [1,2] and even in Germany, where the East Frisian tea culture has the uniqueness of being the only UNESCO-awarded tea consumption tradition worldwide, in 2016 [3]. Incomes and price have been important but not always paramount factors in determining whether tea or coffee is predominant. Tea was the preferred drink in Great Britain, Australia, New Zealand, and Canada for a long period when they were among the richest countries in the world [1].
Most of the research in the scientific literature has focused on the potential health benefits of tea and its ingredients such as polyphenols, and catechins, especially for low-processed teas such as, white, green, and red tea [4,5,6,7,8,9]. Due to its numerous health properties, i.e., antioxidant, thermogenic, anti-inflammatory, cholesterol-lowering, antimicrobial, neuroprotective, antihypertensive, and anti-carcinogenic, the presence of tea in the human daily diet is significantly high [10,11,12,13,14,15,16,17,18,19,20,21,22]. The health benefits of tea consumption in humans have been documented extensively, including preventing cancer [10,11], cardiovascular diseases [9,10,12,13], coronary disease [23], Alzheimer’s disease [24,25,26], depression [27,28,29,30], and lowering COVID-19 morbidity/mortality [31,32,33,34]. Studies have also shown that tea consumption reduces the risk of getting flu and upper respiratory infections [35], aids weight loss [4,36,37], has a marked effect on bones as well as being a good source of vitamin K [38,39,40]. Drinking too much tea can raise blood pressure and cause kidney stones due to the high oxalate content which increases with long brewing times and strong infusions [41,42]. Yerba Mate is not a tea and is obtained from the evergreen holly (Ilex paraguariensis A. St.-Hil.), but the growing interest of consumers in antioxidant-rich infusions can be explained by the common fashion for a healthy lifestyle, as shown by both commercial data and studies [43,44]. China was the leading global tea producer, followed by India and Kenya. Worldwide tea production amounted to around 5.2 million metric tons in 2015 and 6.5 in 2019 [2]. Black tea is consumed mainly in Europe, North America, and North Africa (except Morocco), while green tea is drunk across the whole of Asia, and Oolong tea is also popular in China and Taiwan. World tea consumption has increased by 3.5% over the last decade and is projected to increase further by 2% over the next decade [45]. Black tea is the most important type of tea in international trade [46].
Tea is one of the most popular beverages consumed all over the world [47], including in European countries [1]. Annual tea consumption in Turkey is the largest in Europe and the world and is stated to be 3.16 kg per capita. Ireland ranks second in terms of tea consumption in Europe. The British, despite having a reputation for being big tea drinkers, are only the 3rd biggest tea drinkers in Europe. Southern European countries (except Turkey) consume the lowest amount of tea per capita. Average annual tea consumption in Europe ranged from 0.76 kg per capita (in 2012) to 0.80 kg (in 2021) at home, and 0.04 kg per capita outside of the home, only in 2017–2019 was it 0.05 kg per capita. The average volume per person of tea in Europe in 2022 is estimated to amount to 0.72 kg per capita. It is expected that by 2025, 51% of spending and 6% of tea consumption will be attributable to out-of-home consumption (e.g., in bars and restaurants) [48,49].
Tea consumption in Polish households ranges from 0.84 kg per capita in 2008–2011, up to 0.72 kg per capita in 2012–2015, and 0.60 kg per capita in 2016–2020 [50,51,52,53,54,55,56,57,58,59,60,61,62]. It is expected that by 2025, 39% of spending on tea and 3% of tea consumption will be attributable to out-of-home consumption (e.g., in bars and restaurants). It is estimated that in 2022 the average consumption of eta per capita in Poland will amount to 0.51 kg [63].
About 80% of global tea consumption is made up of the black variety, the remaining 20% of green, oolong, red, and yellow [64]. In the Polish market, the leader is black tea, which accounts for approximately 70% of the sales volume, with a 7% share of green tea and a 1.5% share of red tea [43].
The habits and behavior of the modern consumer in the tea market depend, among others, on psychological criteria (motivation and needs as well as pleasure of consumption), behavior (culture of life, frequency, and number of cups consumed, method of its preparation and place of consumption), descriptive (gender, age, professional activity, family size, dwelling place, and economic situation) and marketing (advertising and prices) [65]. Tea is seen as an essential part of the daily diet, and its consumption has been recognized as a “pro-health habit” [66].
In the scientific literature, however, there is little [67,68,69,70,71,72,73,74] consumer research on the habits and preferences of tea consumers, the way of brewing, and the additives to tea used by consumers. It should be emphasized that contemporary customers have more knowledge in the field of nutrition and their behaviors change with the increase in this knowledge. Therefore, our research aimed to analyze Polish consumers’ habits towards tea consumption, their choices and preferences related to tea, and the way of brewing methods. The second goal of this study is to identify, describe, and compare consumer segments based on differences in individual tea choices and tea habits.

2. Materials and Methods

2.1. Data Collection

The computer-assisted web-based interviewing (CAWI) method was used to collect all data. The survey was conducted on a group of 1700 adults in Poland, declaring their consumption of tea. The sample is representative of all adult residents of Poland. The respondents completed the questionnaire online. A link to the questionnaire in Polish language Google Forms format was sent via Facebook, WhatsApp®, e-mail and students forum. A questionnaire provided on a webpage increases the sense of anonymity and gives an opportunity to participate in the study at a time convenient for the respondent. The questionnaire was designed based on previous research related to tea consumption [67,68,69,70,71].
The questionnaire was validated by means of a pilot study with 20 people. Any problems were identified, and the questionnaire was completed and amended. It was estimated in a pilot test that completing the form would take each participant around 15 min. Each adult respondent who agreed to take part in the study was invited to fill in the questionnaire. The respondents were free to participate in the research. Because the research was non-invasive and details of the participants remained undisclosed, the research does not fall within the remit of the Helsinki Declaration.

2.2. Questionnaire

The questionnaire consisted of two parts of which the first part had nineteen questions relating to tea consumption and consumer habits with tea. The questions concerned the preferences and frequency of consumption of various types of tea, factors determining the choice and purchase of the tea brand, tea brewing (amount of tea, type of water, brewing method, and time), the use of sugar, sweeteners, and others, as well as knowledge about the health effects of tea, and the places and occasions of its consumption. The second part of the questionnaire consisted of five questions that were related to a respondent’s sociodemographic details (gender, age, education, dwelling place, and financial status).

2.3. Characteristics of Respondents

Characteristics of respondents are presented in Table 1.
The study mainly involved women, with secondary or high education, and different dwelling places. The financial status of respondents was average or good (85.41%). Respondents were in the age range between 18–75 years old, had access to a computer, the internet, and had sufficient computer literacy skills.

2.4. Data Analysis

The statistical analysis of the results was performed using Statistica software (StatSoft Inc., Hamburg, Germany, version 13.3 PL).
The study primarily used cluster analysis to isolate groups of respondents with similar attitudes toward tea purchase and consumption. In the first stage, the original number of nearly 100 variables was reduced to a few or a dozen new variables. This action was carried out to make the results more transparent and easier to interpret. The goal was to reduce the number of variables without significant loss of information carried by them. Due to the ordinal nature of most of the variables, an agglomeration method was used to determine the number of new variables, with complete linkage (distance of the furthest elements) and percentage discrepancy as a measure of distance. Homogeneous groups of variables were extracted using the k-means method. Further analysis used new variables created as averages of variables in groups calculated on a case-by-case basis. In the second part of the analysis, clusters of respondents were created due to similar values of the new variables. In this case, too, the agglomeration method and the k-means method were used. The groups thus formed were characterized using descriptive statistics, in particular medians (Me) and interquartile ranges (IQR). For a more precise interpretation of the results, arithmetic means were also used. They were used only to order the results obtained.
Non-parametric tests of significance for differences in average values (medians) across groups were used to determine the significance of the effect of demographic factors on tea consumption behavior. The Mann–Whitney U test was used for two median values, while the Kruskal–Wallis H test (also called K–W ANOVA) with post-hoc analysis was used for multiple groups. All tests were performed with a significance of p < 0.05.

3. Results

3.1. Type, Frequency, and Place of Tea Consumption

All the participants in the study (n = 1700) declared drinking tea, with not very high frequency (Table 2). The greatest number of people declared the consumption of black, green, and flavored tea. The respondents most often drank black tea, i.e., several times a week (median 5). Green tea, flavored tea, and beverages, that respondents defined as “fruit or herbal tea”, are drunk one to three times a month (median 3). Women consumed fruit or herbal infusions significantly more often (p = 0.005). Green tea is significantly more often consumed by women (p = 0.00001), people up to 40 years old (p = 0.000001), and living in large cities of over 100 thousand inhabitants (p = 0.0012). Yerba mate is also treated by the respondents as tea and is much more popular among people aged 25–40 years (p = 0.0007), living in large cities (p = 0.0031). White and red tea are significantly more often consumed by women aged 25–40, with higher education, resident in large cities, and with a very good financial situation (p < 0.05). Oolong tea is significantly more often drunk by people aged 25–60 years (p = 0.00002).
Among the respondents, the most popular is express tea (n = 1033, 60.8%), less popular is both whole-leaf tea (n = 303, 17.8%) and crushed leaf tea (n = 319, 18.8%), the least popular is granulated tea (n = 37, 2.2%) and others (n = 8, 0.5%) such as blooming tea balls. People over 60 years of age significantly more often prefer leaf tea (p = 0.00001), between the ages of 40–60 years crushed leaf tea (p = 0.0006), and women or people up to 40 years of age prefer express tea (p = 0.0001).
Tea, regardless of demographic factors, is usually consumed by respondents at home (n = 1385, 81.5%). They drink it less often at work (n = 212, 12.5%) or with friends and family (n = 88; 5.2%). It is not popular to drink it in a gastronomic establishment, i.e., a cafe, confectionery shop, tea house (n = 12, 0.7%) or in a canteen (3, 0.2%). At work, tea is most often drunk by people aged 41–60 years with higher education, while with friends and family, it is people over 61 years (p = 0.00001).
The respondents most often drank it between meals (n = 1144, 67.3%), during the first breakfast (n = 1057, 62.2%) or dinner (n = 826, 48.6%). Less often it is drunk during second breakfast (n = 393, 23.1%); lunch (n = 283, 16.7%) or during afternoon tea (n = 307, 18.1%).

3.2. Factors Determining the Choice of Tea

Among factors determining the choice of tea by respondents, the quality of tea (n = 1300, 76.5%) was mentioned. The price (n = 971, 57.1%), habits/preferences (n = 815, 47.9%), brand (n = 781, 45.9%), and sensory attributes (n = 658, 38.7%) were also quite important. Less important for the respondents were health reasons (n = 473, 27.8%), promotion (n = 377, 22.2%), as well as packaging (attractiveness, information, n = 327, 19.2%) or convenience (n = 259, 15.2%), and packaging size (n = 254, 14.9%). Factors of no significance in influencing the purchase of tea were: friends’ opinion (n = 85.5%), advertisements (n = 84, 4.9%), and the presentation on a shelf in a store (n = 85, 5%). Men significantly more often pay attention to tea brand, advertising, and convenience, while women to health reasons (p < 0.05). Price, packaging, promotion, and friends’ opinion were more significant for people under 24 years, with vocational or primary school education (p < 0.05).
The most important features of tea, regardless of demographic factors, were primarily the taste (n = 1614, 94.9%) and the aroma (n = 1219, 71.7%) of the tea. Color (n = 306, 18%) and other tea features (n = 36, 2.1%) were less important. Among other features, the respondents indicated the properties of tea such as astringency and strength of infusion.
The brand of tea is an individual preference of respondents. Tea selection depended on financial status (p < 0.05). More expensive brands, such as Lipton and Dilmah, were significantly more often chosen by people with a good or very good financial situation (p < 0.05), while cheaper brands such as Saga are chosen by people in a poor financial situation (p = 0.000001). The most popular tea brand chosen by respondents was Lipton (n = 1185, 69.7%). Less popular were: Dilmah (n = 663, 39%), Tetley (n = 415, 24.4%), Saga (Unilever, n = 330, 19.4%), Teekanne (n = 280, 16.5%), and Twining’s (n = 174, 10.2%). The respondents also choose tea blends (n = 104, 6.1%) from specialist tea stores and own brands of hyper- and supermarket chains operating in Poland (n = 91, 5.4%). Other brands were named by 294 respondents (n = 17.3%). Among them were Brooke Bond (n = 39, 2.3%), Posti (n = 35, 2.1%), Mokate (n = 25, 1.5%), and TET (n = 9, 0.5%).

3.3. The Methods of Preparing and the Kind of Tea Used by Respondents

The method of brewing is not important for the respondents (Table 3). Only 32.2% of respondents pay attention to it, and 37.6% only occasionally. When making tea, they use tap or filtered water. They drink weak tea, usually using 1 to 1.5 teaspoons of tea (67.5% of respondents) for brewing. The tea is usually brewed for up to 5 min, with a small percentage of respondents brewing for longer (Table 3). Men significantly more often use 3 g to brew tea, and women 2 g (p = 0.00001).
The respondents, regardless of the socio-demographic data (p > 0.05), brew tea mainly in a mug or in a cup after pouring boiling water (n = 1445; 85%). A small percentage of them consume iced tea (n = 189, 11.1%), and prepare green tea in a special teapot, pouring water over it several times (n = 182, 10.7%), or prepare an infusion and boiling water separately, usually in a teapot (n = 159, 9.4%). Other, national brewing methods are used by a smaller percentage of respondents. The respondents listed tea brewing in Bavarian style (n = 49, 2.9%), English (n = 39, 2.3%), Japanese and Moroccan (n = 35, 2.1%, respectively), Russian (n = 24, 1.4%), and even in Tibetan (n = 3, 0.2%). Other methods, such as cold brew or French press, were mentioned by 152 respondents (8.9%).
A significant percentage of the respondents (n = 999, 58.8%, p < 0.05) do not use sugar and sweeteners in tea. Only 701 people (41.2%) sweeten their tea with sugar or sweeteners such as xylitol, erytrol, or steviol glycosides (stevia). Sweeteners were used by 50 respondents (3%). One teaspoon of sugar is used by 403 respondents (23.7%) and two or more teaspoons of sugar by 248 respondents (14.5%). Significantly more often sugar is used to sweeten tea by men (p = 0.0001), the youngest (p = 0.0001), village residents (p = 0.0004) and people with primary or vocational education (p = 0.000001).
Other tea additives are used by 52.6% (n = 894) of respondents, mainly lemon (n = 807, 47.5%), honey (n = 522, 30.7%), and various fruit juices or syrups (n = 306, 18%) including raspberry, elderberry flower juice, elderberry juices, linden juices, quince syrups, or others. Milk for tea is used by only 70 respondents (4.1%) and alcohol by 42 respondents (2.5%). Other additives (n = 130, 7.7%) included spices: ginger, turmeric, cinnamon, cloves, cardamom, anise, herbs: mint, and fruits: orange, apples, and raspberries.
Women (p = 0.0098), people aged 25–60 years (p = 0.0007), with higher education (0.00001), inhabitants of large cities (p = 0.0004), with a very good financial situation (p = 0.00004) significantly more often do not use any additives to tea, enjoying its pure properties. Women significantly more often add lemon to tea (p = 0.0022) as well as fruit juice (p = 0.0329), while men with basic education more often add -alcohol (p = 0.00001). Honey is significantly more often added to tea by people aged up to 40 years (p = 0.00001) with secondary education (p = 0.0254).

3.4. Knowledge about Tea by Respondents

The respondents drink tea mainly for pleasure and sensory values, not for health reasons. Various diets ordered by a physician are used by a small percentage of the respondents (n = 59, 3.5%) and by their own choice, slimming, and vegetarian diets (n = 183, 10.8%).
They assess their nutritional knowledge as both good and very good (n = 1033; 60.8%) and insufficient or average (n = 667, 39.2%). However, the knowledge about the properties of tea among the respondents is not very high, as indicated by the obtained results (Table 4). They mainly assessed their diet as good or very good (n = 1408, 82.8%). A smaller percentage of respondents (n = 292, 17.2%) assessed it as insufficient or average.

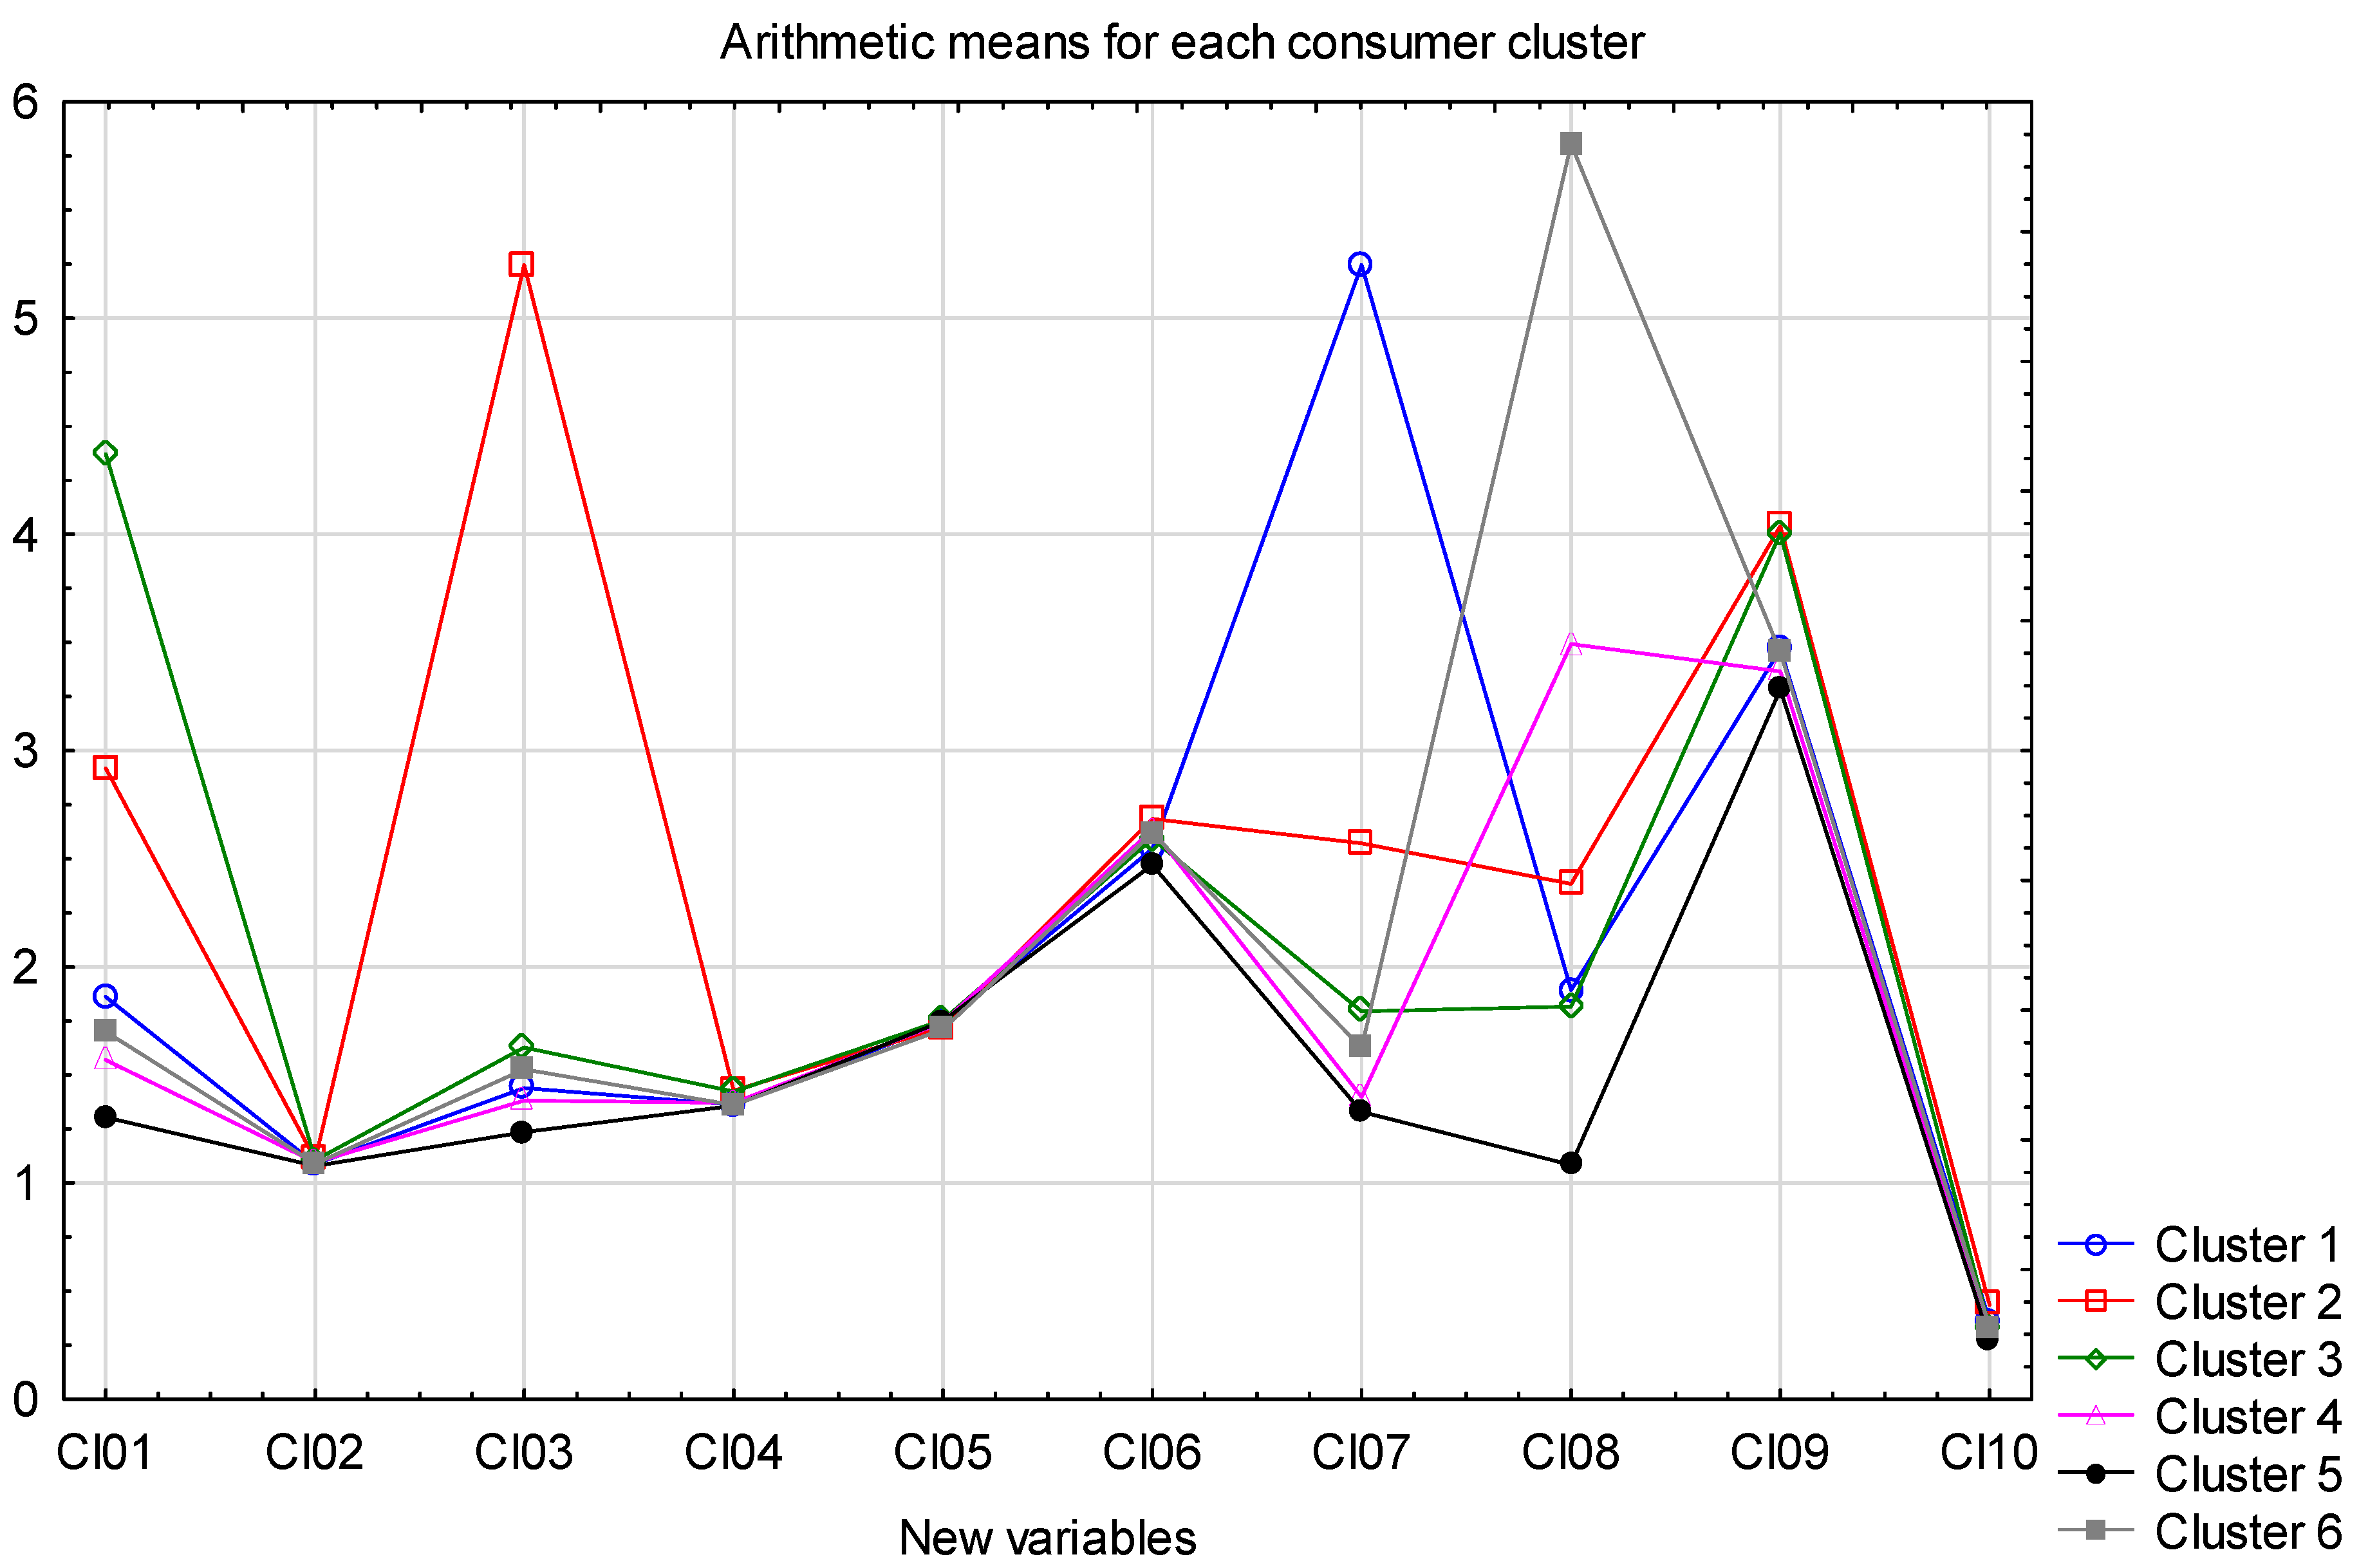
3.5. Clusters and the Impact of Demographics on Consumer Behavior

Originally, there were 93 variables in the survey. Two variables were removed due to identical values (lack of variability), six more due to reference to “other” responses that cannot be interpreted quantitatively. The remaining 85 variables were used in the analysis. However, there are too many of them and they would have caused great difficulties in interpreting the results obtained. It was decided to create new artificial variables corresponding to groups of variables with similar responses. The optimal number of new variables was obtained using the agglomeration method. Its results can be found in Figure 1. Figure 1 shows the dendrogram of the agglomeration of variables, showing groups of variables more and less similar to each other. The lower the linkage between the vertical lines in the chart, the stronger the relationship between the variables. By appropriately selecting the level of dissimilarity, it is possible to indicate the optimal number of groups of variables. Assuming a dissimilarity of 0.7, it can be assumed that the optimal number of new variables is 10.
Agglomeration of variables using the k-means method resulted in 10 clusters of variables with similar values in the sample. For each cluster, arithmetic averages of the values for each observation were calculated. This resulted in 10 new synthetic variables (Cl01-Cl10). These variables are artificial creations and have no natural interpretation. However, it is possible to determine what the characteristics included in these variables refer to: Cl01—frequency of red tea consumption; Cl02—frequency of abnormal behavior toward tea; Cl03—frequency of consumption of yerba mate; Cl04—frequency of typical (for Poles) behaviors towards tea; Cl05—tea as a household daily beverage; Cl06—paying attention to things related to tea, diet and health; Cl07—frequency of consumption of white tea; Cl08—tea brewing time; Cl09—frequency of consumption of popular types of tea (black, green, fruit and herbal teas); Cl10—knowledge of the health properties of tea.
Using 10 new variables, a cluster analysis was conducted to select clusters of respondents giving similar answers. The analysis used the agglomeration method, taking percentage discrepancy and complete linkage clustering as a measure of distance. Based on the resulting dendrogram (Figure 2), it can be assumed that the optimal number of clusters is six.
Individual respondents (observations) were assigned to clusters using the k-variable method. This yielded six clusters of respondents with similar attitudes toward tea purchase and consumption. Descriptive statistics, in particular, median—Me and interquartile deviation—IQR (Table 5), were used to evaluate the characteristics of respondents in each cluster.
The analysis also used arithmetic means calculated for the new variables in the respondent groups (Figure 3). The averages were used only to better rank the results obtained.
Based on the results obtained, it is possible to distinguish homogeneous groups among the respondents taking part in the survey. These groups can be characterized as follows:
Cluster 1—“Occasional tea gourmets” n = 159 (9.4%) people who consume white tea far more often than others and red tea more often than others. These are almost exclusively women with the highest average education among all clusters,
Cluster 2—”Yerba mate drinkers” n = 159 (9.4%) people consuming yerba mate most often, also reaching for red and white tea more often than others. This group has the highest number of men, although women still make up the majority. Respondents in this group are also the youngest, have the best financial situation, are more likely to come from larger cities and have the worst education.
Cluster 3—“Tea gourmets” n = 180 (10.6%) people who consume red tea most often, but also frequently consume traditional varieties of tea (black, green, “herbal or fruit tea”), pay attention to brewing time and brew their tea rather short. This group includes more women than the average, they are more likely to come from smaller cities, and declare a slightly better financial situation and education.
Cluster 4—“Occasional consumers” n = 286 (16.8%) respondents in this group have been brewing tea longer than others but report lower frequency of consumption of teas and traditional teas. They are occasional consumers of stronger tea. This group consists of a larger than average number of men, rather slightly older, from smaller cities with the best financial situation and a low level of education.
Cluster 5—“Undemanding tea consumers” n = 766 (45.1%) people in this group declared the lowest values of all observed characteristics. They were the least likely to consume all types of tea, and the least likely to attach importance to all activities related to the purchase, preparation and consumption of tea. This group consists mainly of women, respondents in it are the oldest and in the worst financial situation.
Cluster 6—“Occasional strong tea consumers” n = 150 (8.8%) people who are the least likely to drink white tea and also the longest tea drinkers. This group includes a higher than-average number of men, they come from the smallest towns with the lowest education and almost the worst financial situation.
To determine whether demographic factors had a significant impact on tea consumption habits, tests were conducted to determine the significance of differences in average values across groups. Based on these, it can be concluded that men are more likely than women to consume white tea and traditional types of tea, take longer to brew them, and declare a greater attachment to the health benefits of tea. In the case of age, it can be concluded that younger respondents were more likely to consume white tea, yerba mate, pay more attention to the health properties of tea and generally consume more of it. Place of residence has an impact on yerba mate and white tea consumption. The larger the locality from which respondents come, the more likely they are to consume both types of tea.
Financial situation also differentiates respondents’ behavior toward tea. The better the situation, the less often the respondents treat tea as an everyday traditional beverage and at the same time have more knowledge about the health effects of tea. At the same time, those declaring that their financial situation is average pay the least attention to matters related to health, diet, etc.
The respondents’ education had an impact on the consumption of white and red tea. The higher the education, the more often these types of teas were consumed. At the same time, it could be observed that yerba mate was consumed more often in the middle-educated group and knowledge of the health properties of tea was greater, while tea was treated less often as an everyday drink.

4. Discussion

4.1. Type, Frequency, and Place of Tea Consumption

According to other authors [43,44,68] about 70–80% of Poles drink it every day, and 70–90% choose black tea. In this study, a significant percentage of respondents (over 80%) also indicated that they drink black and green tea, and a slightly smaller number (74.6–76.5%) indicated fruit and herbal infusions and aromatic tea. In the group of respondents, black tea was drunk several times a week, less often than reported by other authors [43,44]. The smallest number of respondents indicated oolong, white tea, and pu-erh teas. This was confirmed by other studies [68], according to which these teas are less known to Polish consumers and available in specialist stores.
According to other authors [75,76], the choice of teas depends on the age and gender of consumers. Red, white, and yellow teas were consumed occasionally. The elderly drank the most tea, which can also be explained by the power of motivation of older consumers who, in the face of emerging health problems, decide to use the health-promoting properties of tea or may result from attachment to the product.
Often the term tea is wrongly used to describe the assortment of plant materials and herbal mixtures used to make popular infusions, the so-called “fruit and herbal teas” [75].
This is due to the fact that such a trade name appears on the packaging of these beverages.
The respondents also indicated that they drink this type of infusion 1–3 times a month.
Yerba mate, which is not a tea, has recently appeared on the Polish market, was mentioned by 30% of the respondents but was characterized by a low frequency of consumption, which is confirmed by the results of other studies [75,76]. In previous studies, a lower percentage of Polish consumers surveyed indicated drinking green tea [43,68], similarly shown for British consumers (28%), which proves that English consumers are more attached to the centuries-old tradition of black tea consumption [68].
Teas are sold in many forms as a product to be infused in the form of leaves, granules, packed in bags (so-called express), or the instant type. Due to the wide assortment and convenience, express teas are gaining more and more supporters [69]. This trend is favored by factors such as an increase in the pace of life, change in production technology, quality improvement, and functional aspects. At the same time, shops specializing in selling teas have opened in the tea market in Poland [43]. A significant percentage of our respondents (over 60%) declared drinking express tea, which is confirmed by previous findings [44,67,77]. A smaller percentage of respondents choose teas with whole or crushed leaves and granulated. As indicated by other authors [77], leaf teas were used primarily by consumers of yellow tea and Oolong, and 38% of tea consumers used “herbal or fruit teas”.
On the other hand, even sophisticated British consumers, consuming green and white tea, bought it in sachets, preferring a comfortable lifestyle, at the expense of the sensory and health sensations that can be provided by tea brewed in the form of leaves [68].
The largest percentage of the respondents, regardless of their gender, consumed tea at home, rarely at work or with friends. It was unpopular to drink tea in a gastronomic establishment. Tea is usually associated with routine and ritualized household consumption. Other authors indicated similar places of tea consumption, with home first, work second, and bars and friend’s home third. According to these authors, in the northern part of Europe, tea was more frequently consumed at a friend’s place rather than at a bar [78].
The respondents consumed tea mainly between meals as well as during the first breakfast and dinner. Similar relationships were indicated by other authors, according to which Polish consumers have tea with the first breakfast (26%) and dinner (24%), but also with other meals and between meals (19%) [79]. According to Rusinek-Prystupa et al. [69], tea was most often drunk with meals (63.9% of responses), and almost half of the respondents drank tea on occasion or under various circumstances. Tea consumption was also indicated more often during visits than at work or at university (31.3% vs. 21.7%).

4.2. Factors Determining the Choice of Tea

Among the factors determining the choice of tea, the respondents mentioned quality, price, individual habits/preferences, brand, and flavor. Health reasons, promotion, packaging, and convenience were less important. The packaging size, friends’ opinions, and advertisements had a slight influence on their choice.
Similar results were obtained in another study [80], and the dominant factors were quality (38%), brand (22%), and low price (17%). Other authors also point to the significant role of the brand and the price of the packaged tea assortment in purchasing decisions [67,68]. For the customers of specialty tea stores, it did not matter, as they usually sell tea blends at a higher price, reflecting the quality, and in this case, the opinion of friends and the recommendation of store employees were more important. The special role of the price and quality of tea in shaping the behavior of tea consumers was noted by Li et al. [74]. The commercial attributes of products, such as the type, brand of tea, advertising impact, and packaging also play an important role in choosing tea [68].
The most popular brands among the respondents were Lipton, Dilmah, Tetley, Saga, Teekanne, and Twining’s. This is confirmed by the results of previous studies [69,71], according to which the most popular brands of tea were in the middle and low-price range, Lipton, and Saga. Some of the major commercial traders of black tea globally are Unilever-Lipton, PG Tips (Multinational); Associated British Foods-Twining’s (UK); Tata Tea-Tetley (India); Teekanne Group (Germany) [81], but in Poland, it is Unilever (Lipton, Saga), Herbapol Lublin, and Mokate. These three producers have nearly 70% of the market share (taking into consideration a small format of stores) in Poland [44]. Teleżyńska [82] stated that the most important sales channel was supermarkets, which accounted for over 38.4% of tea sales.
Among other factors of tea selection, the respondents indicated the sensory qualities of tea, such as taste and aroma, which is consistent with previous studies by other authors [68,70,71,75,76].
However, it was emphasized that these assessments were subjective, depending on the consumer’s individual sensory sensitivity. A type of tea was considered to be a more objective factor, which is conditioned by specific technological processes related to specific product characteristics [75,76]. Kozirok and Sitkiewicz [70] as important selection factors of tea, mentioned health-promoting properties, habituation, brewing convenience, price, friends’ opinion, and the brand of teas. Others, such as the origin of the product and promotional features (packaging, advertising), were not important for consumers.

4.3. The Methods of Preparing and the Kind of Tea Used by Respondents

Tea consumers have a wide variety of tea preferences. They prefer the traditional serving in a cup with a sachet or a large glass jug. However, they do not rule out other methods. New trends such as cold brew tea were not popular with our respondents. According to the SW Research [83] agency, 80% of surveyed Poles drink black tea every day or several times a day, starting their day with it or drinking it during meals or at social meetings, brewing in a teapot or a mug with a strainer.
The choice of the tea brewing time by respondents was caused by the different effects of the teas. Only one-third of respondents always pay attention to the method of brewing which affects the color, taste, and aroma of tea, as well as its strength, which is also related to the content of caffeine and L-theanine and depends on the type of tea [7,84,85,86,87].
More than half of the respondents chose the stimulating effect of black tea and a brewing time of up to 3 min, with another 25% of the respondents choosing a brewing time of up to 5 min together with the calming effect. The respondents used longer brewing times for white, green, and red tea. Dmowski et al. [68] indicated that Poles chose the health effects of teas and, to a lesser extent, the calming and stimulating effects. Most of them used up to 1.5 teaspoons of tea for one cup/glass, which is not a strong infusion.
Water used to brew tea was more important to the respondents, and a fairly high percentage (45%) used filtered water, Oligocene water, or mineral water for brewing tea.
The respondents chose a variety of tea additives, such as lemon and honey. Tea with lemon has been shown to have a beneficial effect on the body, reducing appetite, and honey has an antibacterial effect [88,89], however, the combination of hot tea with honey and lemon has no health properties and instead is one of the stereotypes passed down from generation to generation [90].
The respondents drink tea rather sporadically. According to other studies [91], average Pole consumes two–three cups of tea a day, but about 20% of the population consumes four to five teacups. In studies conducted in 27 European countries [78], the mean daily intake of tea in women and men ranged from 14–18 g/day (which corresponded to ~0.1 cups) in Spain to 788–928 g/day (~4.3 to 4.9 cups) in the UK general population. The lowest consumption of herbal tea was observed in Sweden (0 g and 7 g per day for men and women, respectively), and the highest in Germany (128 g/day for men and 202 g/day for women).

4.4. Knowledge about Tea by Respondents

In general, the respondents’ knowledge about the health properties of tea was not very high, and stereotypes were repeated, despite the fact that nearly 61% of the respondents assessed their nutritional knowledge as good and very good.
Contemporary, conscious consumers more and more often pay attention to the authenticity and health benefits of the product. They realize that teabags may contain fewer bioactive ingredients, positively influencing health, and one chooses their convenience [92,93].

4.5. Limitation

The strength of our study is the relatively large representative sample of adult Poles (n = 1700). We are aware that in the case of people who do not drink tea, our group was not a representative population for the entire adult population in our country, which may be a barrier to this study. However, it came from all over Poland, and its selection took into account all determinants also included in the group of tea consumers. Therefore, it can be considered as a reference group for comparative studies. Using an online survey to collect data can be considered a benefit as it allows the possibility of reaching a larger group of people from different backgrounds, which was very valuable when collecting data during a pandemic. On the other hand, it was also a limitation resulting from the possibility of participation only by people with internet access.

5. Conclusions

Based on the obtained results, we identified the habits and preferences of Poles related to tea drinking. The respondents preferred black tea, which they drink mainly at home, several times a week, during breakfast, and between meals. The respondents’ choice of tea was dependent on its quality, and above all, on its taste and aroma. The most popular brand among the respondents was Lipton. Most of the respondents did not pay attention to the method of brewing and poured boiling tap water over the tea bags and brewed them for up to 3 min. A significant percentage of the respondents drink teas without any additives.
Among consumers, depending on demographic characteristics, six clusters were identified differing in the type and frequency of tea consumption, being “Occasional tea gourmets”, “Yerba mate drinkers”, “Tea gourmets”, “Occasional consumers”, “Undemanding tea consumers”, and “Occasional strong tea consumers “. The most numerous (45%) group was the “Undemanding tea consumer”, while the remaining groups were similar in numbers.
Tea consumers do not have full knowledge about tea and the method of brewing. It can be concluded that the Polish tea consumer prefers conventional tea brewing methods, mainly reaching for black tea (a “traditionalist”) but is also open to novelties and the search for new flavors and types, reaching for less popular teas such as white or yerba mate. This is a niche that could be used in gastronomy to organize workshops on brewing various teas and educate consumers about the health-promoting properties of tea and the variety of its qualities. A good solution could also be to prepare a tasting menu based on a variety of teas.
Knowledge of consumer preferences regarding tea consumption, as well as determining the factors influencing their choice, can be an important source of information for producers and traders of these stimulants. Consumer segmentation can be helpful in conducting marketing activities to the appropriate group of consumers and can be of interest to other populations for cross-cultural comparison.
Differences in tea-drinking habits such as type of tea, the preparation processes, amount of tea consumed, and additions such as sugar, milk, and others may vary by population and country and could contribute to the inconsistencies found between studies comparing tea consumption.

Author Contributions

Conceptualization, E.C.-S. and R.K.-G.; methodology, E.C.-S.; validation, E.C.-S.; investigation, E.C.-S., R.K.-G., M.P., P.S. and A.K.; data curation, T.O.; writing—original draft preparation, E.C.-S., R.K.-G., M.P. and P.S.; writing—review and editing, E.C.-S.; visualization, E.C.-S. and T.O.; supervision, E.C.-S. All authors have read and agreed to the published version of the manuscript.

Funding

This research was financed by the Polish Ministry of Science and Higher Education with funds from the Institute of Human Nutrition Sciences, Warsaw University of Life Sciences (WULS), and Gdynia Maritime University for scientific research.

Institutional Review Board Statement

The study was performed in compliance with the Helsinki Declaration. As all data were collected anonymously and IP addresses were not collected following Polish law, our study did not need ethical approval.

Informed Consent Statement

Informed consent was obtained from all subjects involved in the study.

Data Availability Statement

The data presented in this article are available on reasonable request, from the corresponding author.

Conflicts of Interest

The authors declare no conflict of interest.

References

  1. Grigg, D. The worlds of tea and coffee: Patterns of consumption. GeoJournal 2002, 57, 283–294. [Google Scholar] [CrossRef]
  2. Annual Per Capita Tea Consumption Worldwide as of 2016, By Leading Countries (In Pounds). Available online: https://www.statista.com/statistics/507950/global-per-capita-tea-consumption-by-country/ (accessed on 6 August 2022).
  3. Bohne, H. Uniqueness of tea traditions and impacts on tourism: The East Frisian tea culture. Int. J. Cult. Tour. Hosp. Res. 2021, 15, 371–383. [Google Scholar] [CrossRef]
  4. Rains, T.M.; Agarwalb, S.; Maki, K.C. Antiobesity effects of green tea catechins: A mechanistic review. J. Nutr. Biochem. 2011, 22, 1–7. [Google Scholar] [CrossRef]
  5. Heber, D.; Zhang, Y.; Yang, J.; Ma, J.E.; Henning, S.M.; Li, Z. Green tea, black tea, and oolong tea polyphenols reduce visceral fat and inflammation in mice fed high-fat, high-sucrose obesogenic diets. J. Nutr. 2014, 144, 1385–1393. [Google Scholar] [CrossRef] [PubMed]
  6. EFSA. Panel on Dietetic Products, Nutrition & Allergies. EFSA J. 2015, 13, 4102. [Google Scholar]
  7. Chatterjee, T.N.; Roy, R.B.; Tudu, B.; Pramanik, P.; Deka, H.; Tamuly, P.; Bandyopadhyay, R. Detection of theaflavins in black tea using a molecular imprinted polyacrylamide-graphite nanocomposite electrode. Sens. Actuators B Chem. 2017, 246, 840–847. [Google Scholar] [CrossRef]
  8. Itoh, N.; Kurokawa, J.; Isogai, Y.; Ogasawara, M.; Matsunaga, T.; Okubo, T.; Katsube, Y. Functional characterization of epitheaflagallin 3-O-gallate generated in laccase-treated green tea extracts in the presence of gallic acid. J. Agric. Food Chem. 2017, 65, 10473–10481. [Google Scholar] [CrossRef]
  9. Rangi, S.; Dhatwalia, S.K.; Bhardwaj, P.; Kumar, M.; Dhawan, D.K. Evidence of similar protective effects afforded by white tea and its active component ‘EGCG’ on oxidative-stress mediated hepatic dysfunction during benzo (a) pyrene induced toxicity. Food Chem. Toxicol. 2018, 116, 281–291. [Google Scholar] [CrossRef]
  10. McKay, D.L.; Blumberg, J.B. The role of tea in human health: An update. J. Am. Coll. Nutr. 2002, 221, 1–13. [Google Scholar] [CrossRef]
  11. Hajiaghaalipoura, F.; Kanthimathia, M.S.; Sanusib, J.; Rajarajeswaran, J. White tea (Camellia sinensis) inhibits proliferation of the colon cancer cell line, HT-29, activates caspases and protects DNA of normal cells against oxidative damage. Food Chem. 2015, 169, 401–410. [Google Scholar] [CrossRef]
  12. Stępień, M.; Szulińska, M.; Bogdański, P.; Pupek-Musialik, D. Green tea and cardiovascular system. Farm. Współczesna 2012, 5, 39–45. [Google Scholar]
  13. Gaylard, L. The Tea Book; Dorling Kindersley Limited: London, UK, 2015; ISBN 9780241182284. [Google Scholar]
  14. Hartley, L.C.; Flowers, N.; Holmes, J.; Clarke, A.; Stranges, S.; Hooper, L.; Rees, K. Green and black tea for the primary prevention of cardiovascular disease (CVD): A cochrane systematic review. J. Epidemiol. Community Health 2013, 67, A52–A53. [Google Scholar] [CrossRef]
  15. Greyling, A.; Ras, R.T.; Zock, P.L.; Lorenz, M.; Hopman, M.T.; Thijssen, D.H.J.; Draijer, R. The Effect of Black Tea on Blood Pressure: A Systematic Review with Meta-Analysis of Randomized Controlled Trials. PLoS ONE 2014, 9, e103247. [Google Scholar] [CrossRef]
  16. Fang, J.; Sureda, A.; Sanches Silva, A.; Sanches Silva, F.; Xu, S.; Nabavi, S.M. Trends of tea in cardiovascular health and disease: Critical review. Trends Food Sci. Technol. 2019, 88, 385–396. [Google Scholar] [CrossRef]
  17. Orlando, P.; Chellan, N.; Louw, J.; Tiano, L.; Cirilli, I.; Dludla, P.; Joubert, E.; Muller, C.J.F. Aspalathin-Rich Green Rooibos Extract Lowers LDL-Cholesterol and Oxidative Status in High-Fat Diet-Induced Diabetic Vervet Monkeys. Molecules 2019, 24, 1713. [Google Scholar] [CrossRef] [PubMed]
  18. Xu, R.; Bai, Y.; Yang, K.; Chen, G. Effects of green tea consumption on glycemic control: A systematic review and meta-analysis of randomized controlled trials. Nutr. Metab. 2020, 17, 1–13. [Google Scholar] [CrossRef]
  19. Dludla, P.V.; Nkambule, B.B.; Mazibuko-Mbeje, S.E.; Nyambuya, T.M.; Orlando, P.; Silvestri, S.; Marcheggiani, F.; Cirilli, I.; Khanyisani, Z.; Ndevahoma, F.; et al. Tea consumption and its effects on primary and secondary prevention of coronary artery disease: Qualitative synthesis of evidence from randomized controlled trials. Clin. Nutr. ESPEN 2021, 41, 77–87. [Google Scholar] [CrossRef]
  20. Jia, W.; Rajani, C.; Lv, A.; Fan, T.P.; Zheng, X. Pu-erh tea: A review of a healthful brew. J. Tradit. Chin. Med. Sci. 2022, 9, 95–99. [Google Scholar] [CrossRef]
  21. Li, X.; Zhu, X. Tea: Types, Production, and Trade. Encycl. Food Health 2016, 279–282. [Google Scholar]
  22. Qi, G.; Mi, Y.; Liu, Z.; Fan, R.; Qiao, Q.; Sun, Y.; Ren, B.; Liu, X. Dietary tea polyphenols ameliorate metabolic syndrome and memory impairment via circadian clock related mechanisms. J. Funct. Foods 2017, 34, 168–180. [Google Scholar] [CrossRef]
  23. Peters, U.; Poole, C.; Arab, L. Does tea affect cardiovascular disease? A meta-analysis. Am. J. Epidemiol. 2001, 154, 495–503. [Google Scholar] [CrossRef] [PubMed]
  24. Kesse-Guyot, E.; Fezeu, L.; Andreeva, V.A.; Touvier, M.; Scalbert, A.; Hercberg, S.; Galan, P. Total and specific polyphenol intakes in midlife are associated with cognitive function measured 13 years later. J. Nutr. 2012, 142, 76–83. [Google Scholar] [CrossRef] [PubMed]
  25. Unno, K. Prevention of brain aging by green tea components: Role of catechins and theanine. J. Phys. Fit. Sports Med. 2016, 5, 117–122. [Google Scholar] [CrossRef] [Green Version]
  26. Zhang, S.; Otsuka, R.; Nishita, Y.; Nakamura, A.; Kato, T.; Iwata, K.; .Tange, C.; Tomida, M.; Ando, F.; Shimokata, H.; et al. Green tea consumption is associated with annual changes in hippocampal volumes: A longitudinal study in community-dwelling middle-aged and older Japanese individuals. Arch. Gerontol. Geriatr. 2021, 96, 104454. [Google Scholar] [CrossRef] [PubMed]
  27. Pittenger, C.; Duman, R.S. Stress, depression, and neuroplasticity: A convergence of mechanisms. Neuropsychopharmacology 2008, 33, 88–109. [Google Scholar] [CrossRef]
  28. Stefanescu, C.; Ciobica, A. The relevance of oxidative stress status in first episode and recurrent depression. J. Affect. Disord. 2012, 143, 34–38. [Google Scholar] [CrossRef]
  29. Guo, X.; Park, Y.; Freedman, N.D.; Sinha, R.; Hollenbeck, A.R.; Blair, A.; Chen, H. Sweetened beverages, coffee, and tea and depression risk among older US adults. PLoS ONE 2014, 9, e94715. [Google Scholar] [CrossRef]
  30. Chen, Y.X.; Jiang, C.Q.; Zhang, W.S.; Zhu, F.; Jin, Y.L.; Cheng, K.K.; Lam, T.H.; Xu, L. Habitual tea consumption was associated with lower levels of depressive symptoms among older Chinese: Guangzhou Biobank Cohort Study. Nutr. Res. 2022, 103, 59–67. [Google Scholar] [CrossRef]
  31. Henss, L.; Auste, A.; Schürmann, C.; Schmidt, C.; von Rhein, C.; Mühlebach, M.D.; Schnierle, B.S. The green tea catechin epigallocatechin gallate inhibits SARS-CoV-2 infection. J. Gen. Virol. 2021, 102, 001574. [Google Scholar] [CrossRef]
  32. Liu, J.; Bodnar, B.H.; Meng, F.; Khan, A.I.; Wang, X.; Saribas, S.; Wang, T.; Lohani, S.C.; Wang, P.; Wei, Z.; et al. Epigallocatechin gallate from green tea effectively blocks infection of SARS-CoV-2 and new variants by inhibiting spike binding to ACE2 receptor. Cell Biosci. 2021, 11, 168. [Google Scholar] [CrossRef]
  33. Storozhuk, M. COVID-19: Could green tea catechins reduce the risks? MedRxiv 2021, 11, 1–15. [Google Scholar] [CrossRef]
  34. Nanri, A.; Yamamoto, S.; Konishi, M.; Ohmagari, N.; Mizoue, T. Green tea consumption and SARS-CoV-2 infection among staff of a referral hospital in Japan. Clin. Nutr. Open Sci. 2022, 42, 1–5. [Google Scholar] [CrossRef] [PubMed]
  35. Umeda, M.; Tominaga, T.; Kozuma, K.; Kitazawa, H.; Furushima, D.; Hibi, M.; Yamada, H. Preventive effects of tea and tea catechins against influenza and acute upper respiratory tract infections: A systematic review and meta-analysis. Eur J. Nutr. 2021, 60, 4189–4202. [Google Scholar] [CrossRef]
  36. Lin, F.-J.; Wei, X.-L.; Liu, H.-Y.; Li, H.; Xia, Y.; Wu, D.-T.; Zhang, P.-Z.; Gandhi, G.R.; Li, H.-B.; Gan, R.-Y. State of the art review of dark tea: From chemistry to health benefits. Trends Food Sci. Technol. 2021, 109, 126–138. [Google Scholar] [CrossRef]
  37. Wierzejewska, R. Wpływ Picia Herbaty Na Zdrowie–Aktualny Stan Wiedzy. Przegląd Epidem. 2014, 68, 595–599. [Google Scholar]
  38. Shen, C.-L.; Yeh, J.K.; Cao, J.J.; Chieu, M.-C.; Wang, J.-S. Green tea and bone health: Evidence from laboratory studies. Pharmacol. Res. 2011, 64, 155–161. [Google Scholar] [CrossRef] [PubMed]
  39. Platta, A. The role of the diet in the prophylaxis and treatment of the osteopenia and osteporosis of women. Sci. J. Gdyn. Marit. Univ. 2014, 86, 16–28. [Google Scholar]
  40. Pastoriza, S.; Pérez-Burillo, S.; Rufián-Henares, J.A. How brewing parameters affect the healthy profile of tea. Curr. Opin. Food Sci. 2017, 14, 7–12. [Google Scholar] [CrossRef]
  41. Michalak-Majewska, M. Properties of tea. Part 1. Nutritional importance. Nauka Przyr. Technol. 2011, 5, 114. [Google Scholar]
  42. Maciąg, D.; Styczeń, M.; Cichońska, M.; Kucharska, K. Knowledge of pregnant women concerning gestational hypertension. Acta Sci. Acad. Ostroviensis 2013, 2, 97–118. [Google Scholar]
  43. Ratajczak, J.; Siuda, M. Rynek Kawy i Herbaty. Poradnik Handlowca 2012, 9/235. Available online: http://www.poradnikhandlowca.com.pl (accessed on 6 August 2022).
  44. Kawa, Herbata i Coś Słodkiego. Hurt Detal 2021, 05/183. Available online: https://hurtidetal.pl/article/art_id,33163-61/kawa-herbata-i-cos-slodkiego/ (accessed on 5 August 2022).
  45. Food and Agriculture Organization of the United Nations. International Tea Market: Market Situation, Prospects and Emerging Issues; FAO: Italy, Rome, 2022. [Google Scholar]
  46. Annual Bulletin of Statistics 2018; International Tea Committee: London, UK, 2018.
  47. Shen, F.M.; Chen, H.W. Element composition of tea leaves and tea infusions and its impact on health. Bul. Environ. Contam. Toxicol. 2008, 80, 300–304. [Google Scholar] [CrossRef]
  48. Tea Consumption in Europe. Available online: https://www.statista.com/outlook/cmo/hot-drinks/tea/europe (accessed on 6 August 2022).
  49. Tea Consumption. Available online: https://landgeistdotcom.files.wordpress.com/2022/01/asia-tea-consumption.png (accessed on 6 August 2022).
  50. Statistical Year of the Republic of Poland, GUS, Warsaw. 2021. Available online: https://stat.gov.pl (accessed on 6 August 2022).
  51. Statistical Year of the Republic of Poland, GUS, Warsaw. 2020. Available online: https://stat.gov.pl (accessed on 6 August 2022).
  52. Statistical Year of the Republic of Poland, GUS, Warsaw. 2019. Available online: https://stat.gov.pl (accessed on 6 August 2022).
  53. Statistical Year of the Republic of Poland, GUS, Warsaw. 2018. Available online: https://stat.gov.pl (accessed on 6 August 2022).
  54. Statistical Year of the Republic of Poland, GUS, Warsaw. 2017. Available online: https://stat.gov.pl (accessed on 6 August 2022).
  55. Statistical Year of the Republic of Poland, GUS, Warsaw. 2016. Available online: https://stat.gov.pl (accessed on 6 August 2022).
  56. Statistical Year of the Republic of Poland, GUS, Warsaw. 2015. Available online: https://stat.gov.pl (accessed on 6 August 2022).
  57. Statistical Year of the Republic of Poland, GUS, Warsaw. 2014. Available online: https://stat.gov.pl (accessed on 6 August 2022).
  58. Statistical Year of the Republic of Poland, GUS, Warsaw. 2013. Available online: https://stat.gov.pl (accessed on 6 August 2022).
  59. Statistical Year of the Republic of Poland, GUS, Warsaw. 2012. Available online: https://stat.gov.pl (accessed on 6 August 2022).
  60. Statistical Year of the Republic of Poland, GUS, Warsaw. 2011. Available online: https://stat.gov.pl (accessed on 6 August 2022).
  61. Statistical Year of the Republic of Poland, GUS, Warsaw. 2010. Available online: https://stat.gov.pl (accessed on 6 August 2022).
  62. Statistical Year of the Republic of Poland, GUS, Warsaw. 2009. Available online: https://stat.gov.pl (accessed on 6 August 2022).
  63. Hot Drinks. Poland. Available online: https://www.statista.com/outlook/cmo/hot-drinks/tea/Poland (accessed on 3 August 2022).
  64. Preedy, V.R. Tea in Health and Disease Prevention; Elsevier: Amsterdam, The Netherlands, 2013. [Google Scholar]
  65. Lenart, B.; Sikora, T. Model of Consumer Preferences and Behaviour on Coffee Market. Żywność. Nauka. Technologia. Jakość 2001, 3, 97. [Google Scholar]
  66. Sanlier, N.; Gokcen, B.B.; Altuğ, M. Tea consumption and disease correlations. Trends Food Sci. Technol. 2018, 78, 95–106. [Google Scholar] [CrossRef]
  67. Dmowski, P.; Śmiechowska, M.; Szemiako, M. Znaczenie marki produktu i jej wpływ na wybór herbaty przez konsumentów, w: Marketing przyszłości. Trendy. Strategie. Instrumenty. Zachowania konsumentów–trendy i kierunki zmian. Zesz. Nauk. Uniw. Szczecińskiego 2011, 660, 165. [Google Scholar]
  68. Dmowski, P.; Śmiechowska, M.; Dąbrowska, J. Behavior of Polish and English Consumers on the Tea market. Zesz. Nauk. Uniw. Szczecińskiego 2015, 38, 219–228. [Google Scholar] [CrossRef]
  69. Rusinek-Prystupa, E.; Samolińska, W. Consumer preferences for tea and coffee consumption among respondents living in Lublin and vicinity–preliminary report. Probl. Hig. Epidemiol. 2013, 94, 653–657. [Google Scholar]
  70. Kozirok, W.; Sitkiewicz, M. Consumers’ Attitudes and Behaviours towards Teas. Handel Wewnętrzny 2015, 2, 222–233. [Google Scholar]
  71. Dykiel, M.; Pisarek, M.; Krochmal-Marczak, B.; Gargała, M. Referencje Konsumenckie Dotyczące Spożycia Herbaty Wśród Respondentów Zamieszkałych W Krośnie i Okolicy. In Trendy w Żywieniu Człowieka; Karwowska, M., Gustaw, W., Eds.; Naukowe PTTŻ: Kraków, Poland, 2015; pp. 47–59. [Google Scholar]
  72. Husain, W.; Ashkanani, F. Does COVID-19 Change Dietary Habits and Lifestyle Behaviours in Kuwait: A Community-Based Cross-Sectional Study. Environ. Health Prev. Med. 2020, 25, 61. [Google Scholar] [CrossRef]
  73. Skotnicka, M.; Karwowska, K.; Kłobukowski, F.; Wasilewska, E.; Małgorzewicz, S. Dietary Habits before and during the COVID-19 Epidemic in Selected European Countries. Nutrients 2021, 13, 1690. [Google Scholar] [CrossRef]
  74. Li, J.; Lu, X.; Jiang, M.; Shao, W.; Zhou, J. Survey and Analysis on Undergraduate Tea Consumption and Attitude towards Tea Consumption. Asian Agri. Res. China 2013, 5, 118–120. [Google Scholar] [CrossRef]
  75. Stańczyk, A. Health properties of selected tea grades. Bromat. Chem. Toksykol. 2010, 43, 498–504. [Google Scholar]
  76. Łuczak, H.; Jeżewska, M.; Białas, M.; Kulczak, M. Ash content in selected tea bags. Bromat. Chem. Toksykol. 2012, 45, 500–506. [Google Scholar]
  77. Ostrowska, J.; Stankiewicz, A.; Skrzydlewska, E. Antyoksydacyjne właściwości zielonej herbaty. Bromat. ChemToksykol 2001, 34, 131–140. [Google Scholar]
  78. Landais, E.; Moskal, A.; Mullee, A.; Nicolas, G.; Gunter, M.J.; Huybrechts, I.; Overvad, K.; Roswall, N.; Affret, A.; Fagherazzi, G.; et al. Coffee and Tea Consumption and the Contribution of Their Added Ingredients to Total Energy and Nutrient Intakes in 10 European Countries: Benchmark Data from the Late 1990s. Nutrients 2018, 10, 725. [Google Scholar] [CrossRef] [Green Version]
  79. Gawęcki, J.; Twardowska, M.; Łoboda, D. Beverage consumption habits among academic youth–initial studies. Żywność. Nauka. Technologia. Jakość 2009, 4, 204–210. [Google Scholar]
  80. Bhattarai, G. Consumer Preference in Selection of Tea Brand in Itahari. Available online: https://www.scribd.com/document/442521758/Consumer-Preference-to-Tea-Brand (accessed on 5 December 2021).
  81. Hicks, A. Current Status and Future Development of Global Tea Production and Tea Products. AU J. Technol. 2009, 12, 251–264. [Google Scholar]
  82. Teleżyńska, K. Raport: Rynek Kawy i Herbaty. Porad. Handlowca. 2011. Available online: http://www.poradnikhandlowca.com.pl (accessed on 6 August 2022).
  83. SW Research. Zwyczaje Polaków Związane z Piciem Herbaty. 2019. Available online: https://handelextra.pl/artykuly/226346,polacy-kochaja-herbate (accessed on 6 August 2022).
  84. Bojarowicz, H.; Przygoda, M. Kofeina. Cz. I. Caffeine. Part, I. Common use of caffeine and its effect on human organism. Probl. Hig. Epidemiol. 2012, 93, 8–13. [Google Scholar]
  85. Castellana, F.; De Nucci, S.; De Pergola, G.; Di Chito, M.; Lisco, G.; Triggiani, V.; Sardone, R.; Zupo, R. Trends in Coffee and Tea Consumption during the COVID-19 Pandemic. Foods 2021, 10, 2458. [Google Scholar] [CrossRef] [PubMed]
  86. Polat, A.; Kalcıoğlu, Z.; Müezzinoğlu, N. Effect of infusion time on black tea quality, mineral content and sensory properties prepared using traditional Turkish infusion method. Int. J. Gastron. Food Sci. 2022, 29, 100559. [Google Scholar] [CrossRef]
  87. Mari, E.; Lausi, G.; Fraschetti, A.; Pizzo, A.; Baldi, M.; Quaglieri, A.; Burrai, J.; Barchielli, B.; Avallone, F.; Giannini, A.M. Teaching during the Pandemic: A Comparison in Psychological Wellbeing among Smart Working Professions. Sustain. Sci. Pract. Policy 2021, 13, 4850. [Google Scholar] [CrossRef]
  88. Brudzynski, K.; Abubaker, K.; Castle, A. Re-Examining the Role of Hydrogen Peroxide in Bacteriostatic and Bactericidal Activities of Honey. Front. Microbiol. 2011, 2, 213. [Google Scholar] [CrossRef]
  89. Beckwith, S.; Paul, C. A Little Tea Book: All the Essential from Leaf to Cup; Bloomsbury Publishing: New York, NY, USA, 2018. [Google Scholar]
  90. Rybowska, A. Common belief on selected food consumption behaviors in the opinion of consumers 65+. Zesz. Nauk. Szkoły Głównej Gospod. Wiej. Ekon. I Organ. Gospod. Żywnościowej 2016, 114, 45–55. [Google Scholar] [CrossRef]
  91. Wojciechowska-Mazurek, M.; Starska, K.; Mania, M.; Rebeniak, M.; Karłowski, K. Pierwiastki szkodliwe dla zdrowia w herbacie –ocena zagrożenia dla zdrowia. Bromat. Chem. Toksykol. 2010, 43, 233–239. [Google Scholar]
  92. Horžić, D.; Komes, D.; Belščak, A.; Kovačević, G.K.; Iveković, D.; Karlovic, D. The Composition of Polyphenols and Methylxanthines in Teas and Herbal Infusions. Food Chem. 2009, 115, 441–448. [Google Scholar] [CrossRef]
  93. Kusano, R.; Matsuo, Y.; Saito, Y.; Tanaka, T. Oxidation Mechanism of Black Tea Pigment Theaflavin by Peroxidase. Tetrahedron Lett. 2015, 56, 5099–5102. [Google Scholar] [CrossRef] [Green Version]
Figure 1. Dendrogram of variables agglomeration.
Foods 11 02873 g001
Figure 2. Dendrogram of consumers agglomeration.
Foods 11 02873 g002
Figure 3. Arithmetic averages of new variables in the separated groups of respondents.
Foods 11 02873 g003
Table 1. Characteristics of the surveyed sample of respondents.
Population FeaturesGroupNumber of Respondents (n)Percentage of Respondents (%)
Total-1700100.0
Genderwomen129876.4
men40223.6
Age18–24 years old73143.0
25–40 years old61135.9
41–60 years old28516.8
61–75 years old734.3
Educationvocational or primary school19311.4
secondary school46627.4
higher education (university)104161.2
Dwelling placevillage44025.9
city below 20,000 inhabitants17910.5
city between 20,000–100,000 inhabitants29417.3
city over 100,000 inhabitants78746.3
Financial statusbelow average (poor)663.9
average75444.3
over average (good)69841.1
very good18210.7
Table 2. The type and frequency of tea drinking by respondents.
TeaRespondentsAverage * ± SDMedian *Q25Q75
n%
White tea72042.41.9 ± 1.4112
Green tea142283.73.4 ± 1.8325
Oolong tea37021.81.4 ± 0.9111
Black tea151288.94.4 ± 2.0536
Red tea (pu-erh)77445.51.9 ± 1.3112
Aromatic tea126974.63.3 ± 1.9315
Other, understood by respondents as tea
Yerba mate55732.81.7 ± 1.4112
“Fruit tea”130176.53.1 ± 1.8325
“Herbal tea”127875.23.2 ± 1.9315
* Scale: (1) never; (2) rarely than once a month; (3) 1 or 3 times a month; (4) once a week; (5) several times a week; (6) once a day; (7) several times a day.
Table 3. Respondents preferences during the preparation of tea infusion.
PreferencesRespondentsPreferencesRespondents
n%n%
Water used to brewing Pay attention to way of brewing
Tap water from water supply93154.8Yes54732.18
Oligocene water321.9No51430.24
Mineral water no sparkling533.1Sometimes63937.59
Filtered water68440.2
The amount of tea for 1 cup/glass (200 mL water) Preferred brewing time
Less than 1 teaspoon (<2 g)31818.7Less than 3 min47828.1
1 teaspoon (2 g)81147.73 min39623.3
1.5 teaspoon (3 g)33819.94 min21012.4
2 teaspoon (4 g)1297.65 min20712.2
other1046.16 min402.4
---over 6 min1307.6
---I don’t know, it isn’t important for me23914.1
Table 4. Respondents’ opinion about tea.
Respondents’ Opinion/KnowledgeAverage * ± SDMedian *
Drinking about 450 mL of tea a day reduces the risk of cardiovascular diseases0.41 ± 0.700
Tea lowers blood pressure0.23 ± 0.680
Drinking green tea reduces the risk of osteoporosis0.00 ± 0.000
Tea reduces the risk of hyperlipidemia (high blood lipids)0.23 ± 0.610
Strong tea drink before going to sleep makes it difficult to fall asleep0.50 ± 1.101
The greatest amounts of components that have a beneficial effect on the human body are found in white and green tea0.56 ± 0.910
Drinking too much tea can cause kidney stones0.16 ± 0.860
Green tea reduces the appetite0.13 ± 0.880
* Scale: (−2) definitely do not agree; (−1) do not agree; (0) neither agree or disagree—I don’t know; (1) agree; (2) definitely agree.
Table 5. Values of medians (Me) and quartile ranges (IQR) in the separated groups of respondents.
Clustern Cl01Cl02Cl03Cl04Cl05Cl06Cl07Cl08Cl09Cl10GenderAgeDwelling PlaceFinancial SituationEducation
1159Me11.0811.361.752.50523.60.2922333
IQR10.0510.140.170.75221.80.4301211
2159Me31.1051.431.752.75224.00.2922433
IQR30.1020.140.170.75331.60.5711211
3180Me41.1011.431.752.50224.00.2922333
IQR20.0810.290.170.75111.60.5701311
4286Me11.0811.361.752.50133.40.2922333
IQR10.0810.140.250.75111.40.5711311
5766Me11.0811.361.752.50113.20.1422323
IQR10.0500.140.170.75111.40.5701311
6150Me11.0811.361.712.50163.40.1422333
IQR10.0810.140.250.75101.40.7111311
Median—Me and interquartile deviation—IQR.
Publisher’s Note: MDPI stays neutral with regard to jurisdictional claims in published maps and institutional affiliations.

