
Assessing Dietary Intakes from Household Budget Survey in Armenia, 2008–2019


Abstract
:
1. Introduction
2. Materials and Methods
2.1. Dietary Survey
2.2. Dietary Intake Assessment
2.3. Food Consumption Trends and Statistical Analysis of Data
3. Results and Discussion
3.1. Estimates of Food Availability
3.1.1. Cereals and Bakery Products
3.1.2. Meat and Meat Products, Fish
3.1.3. Milk and Milk Products
3.1.4. Fats and Oils
3.1.5. Fruits
3.1.6. Vegetables
3.1.7. Sugar, Honey, and Confectionery
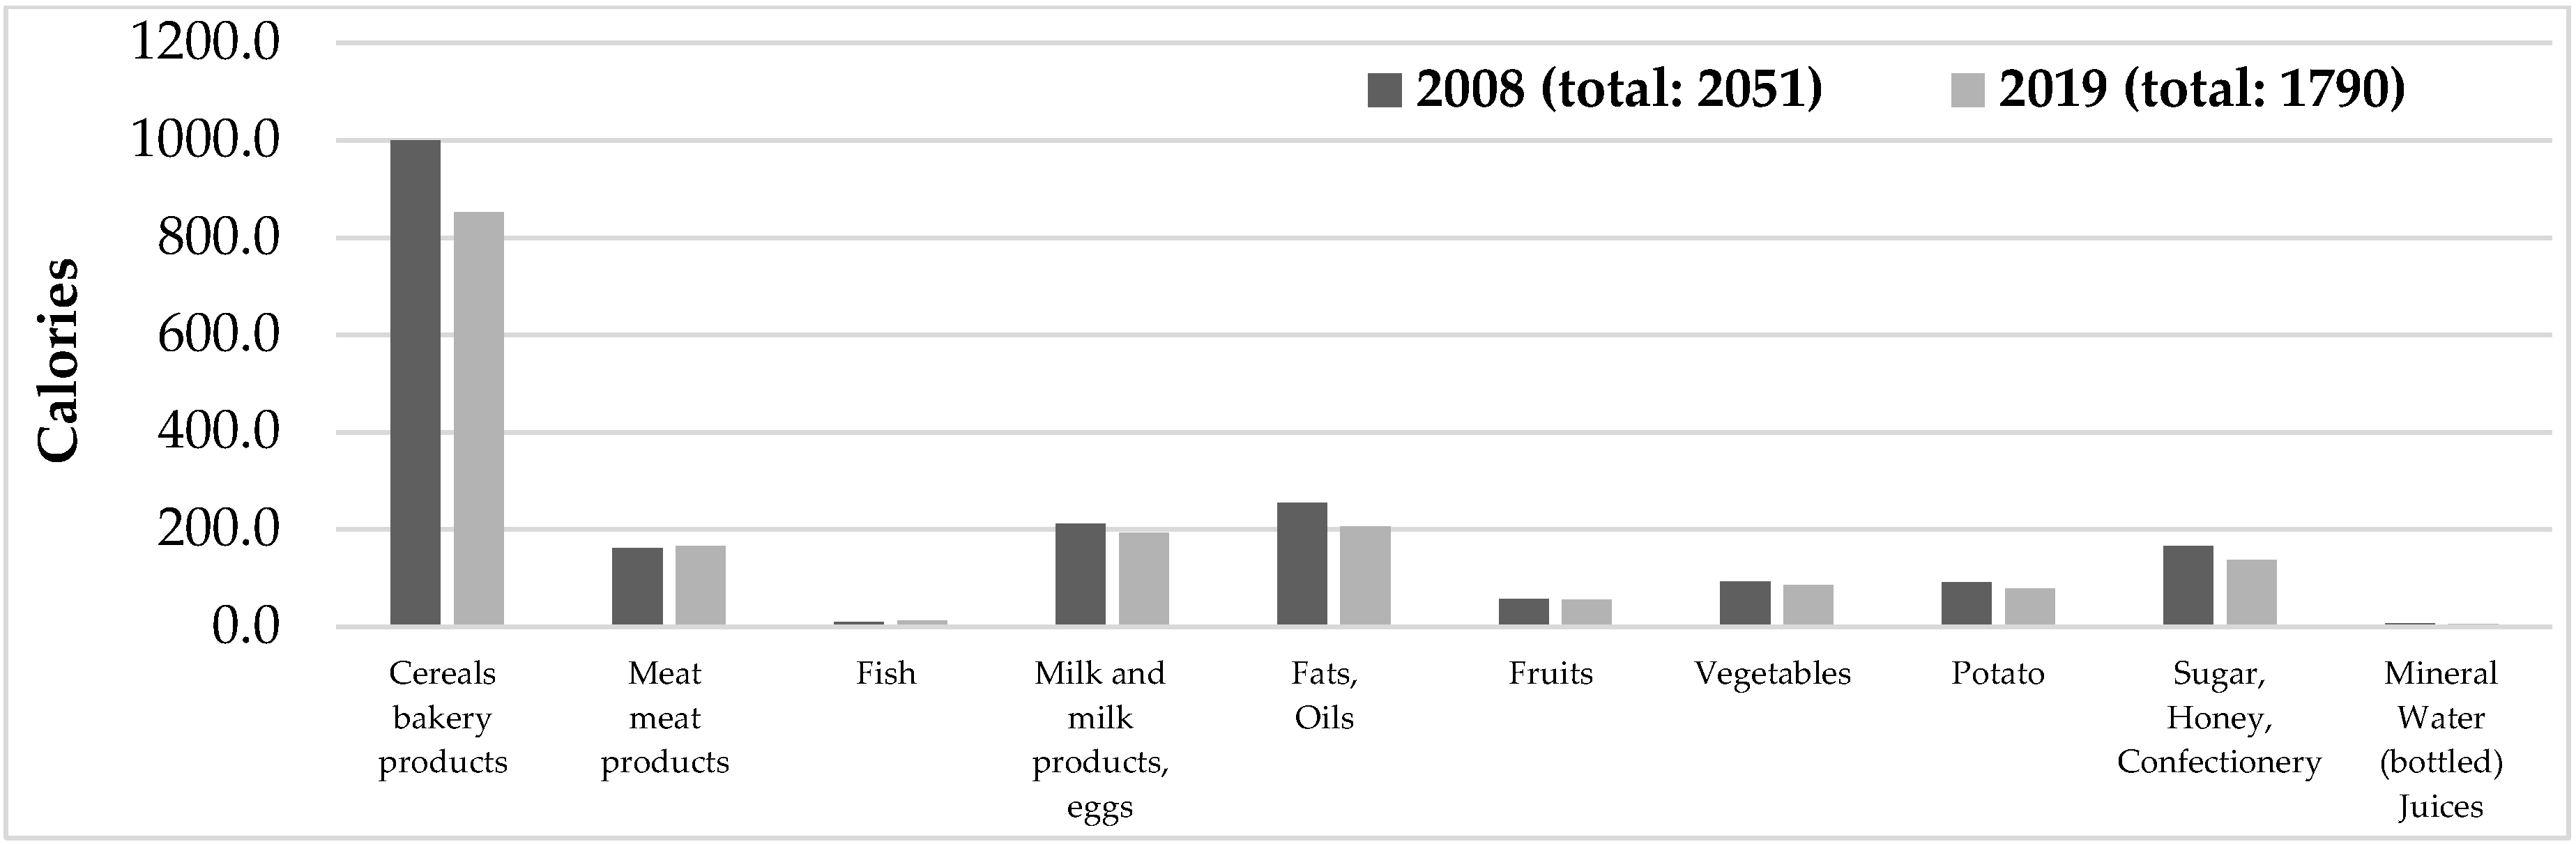
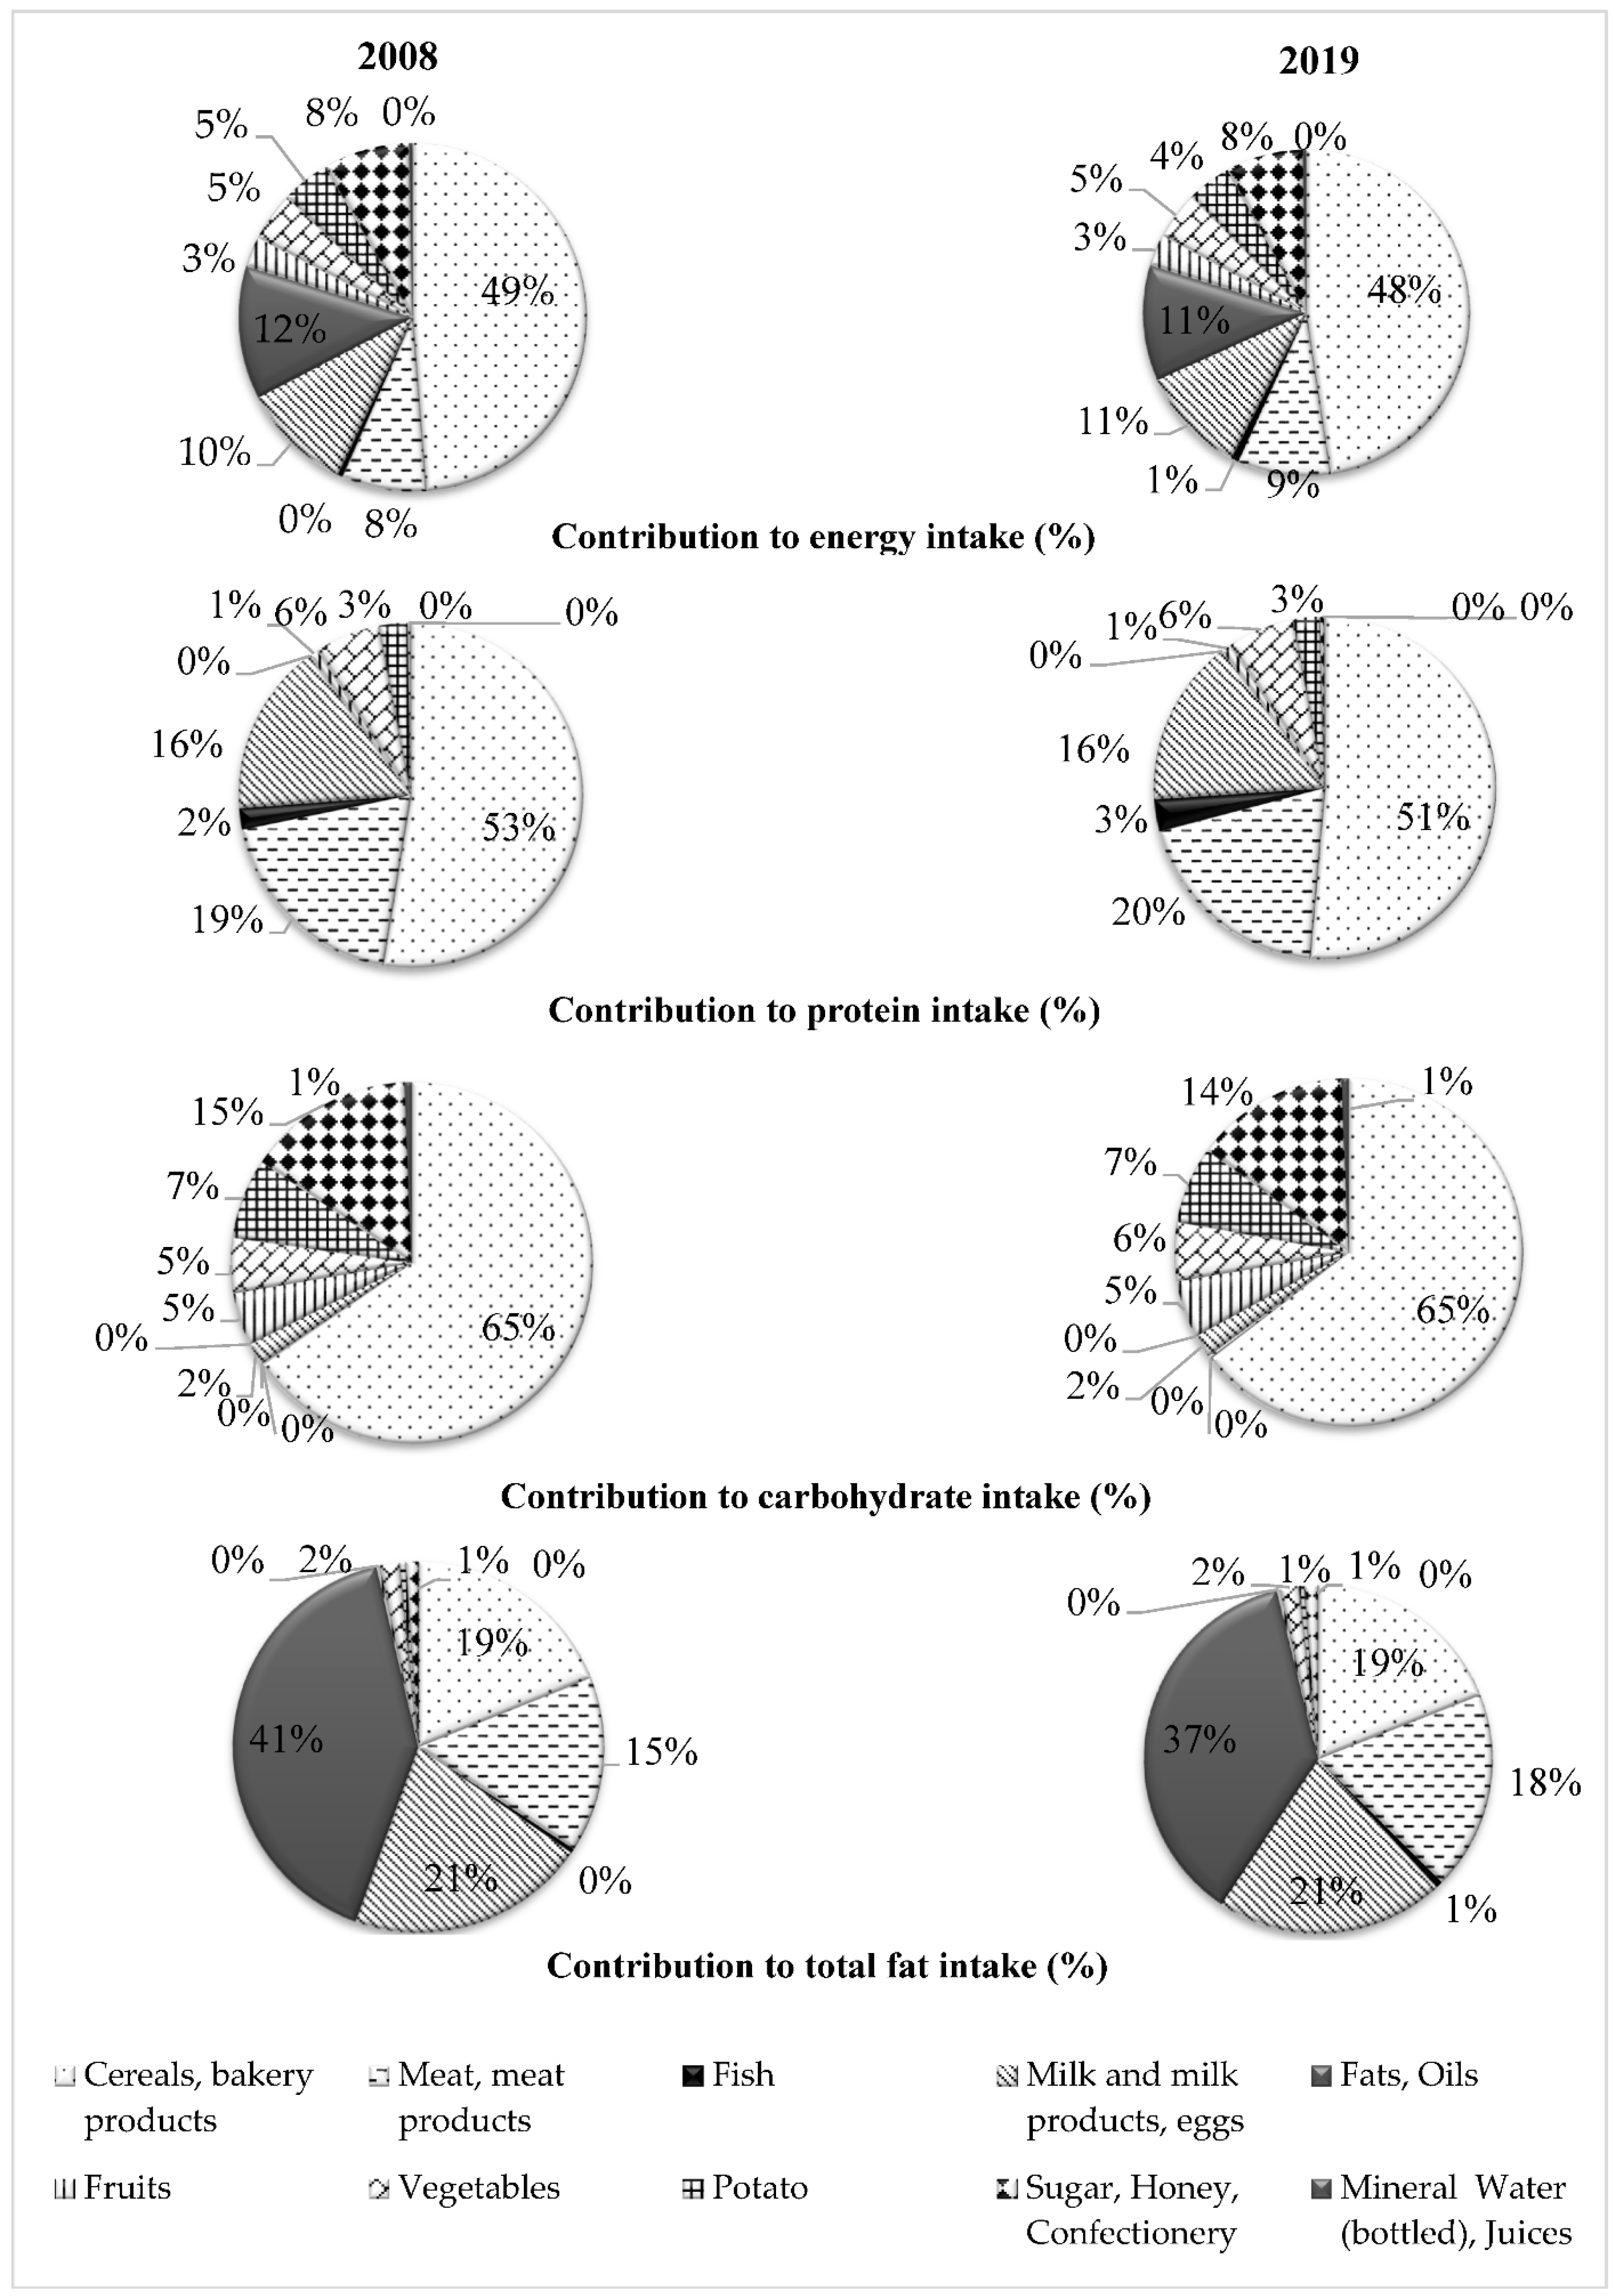
3.2. Energy Intake and Energy Contributions of Macronutrients
Food Sources of Dietary Energy
3.3. Contribution of Food Groups to Energy and Macronutrient Intakes in Different Countries
3.3.1. Total Energy Intake
3.3.2. Protein Intake
3.3.3. Carbohydrate Intake
3.3.4. Total Fats Intake
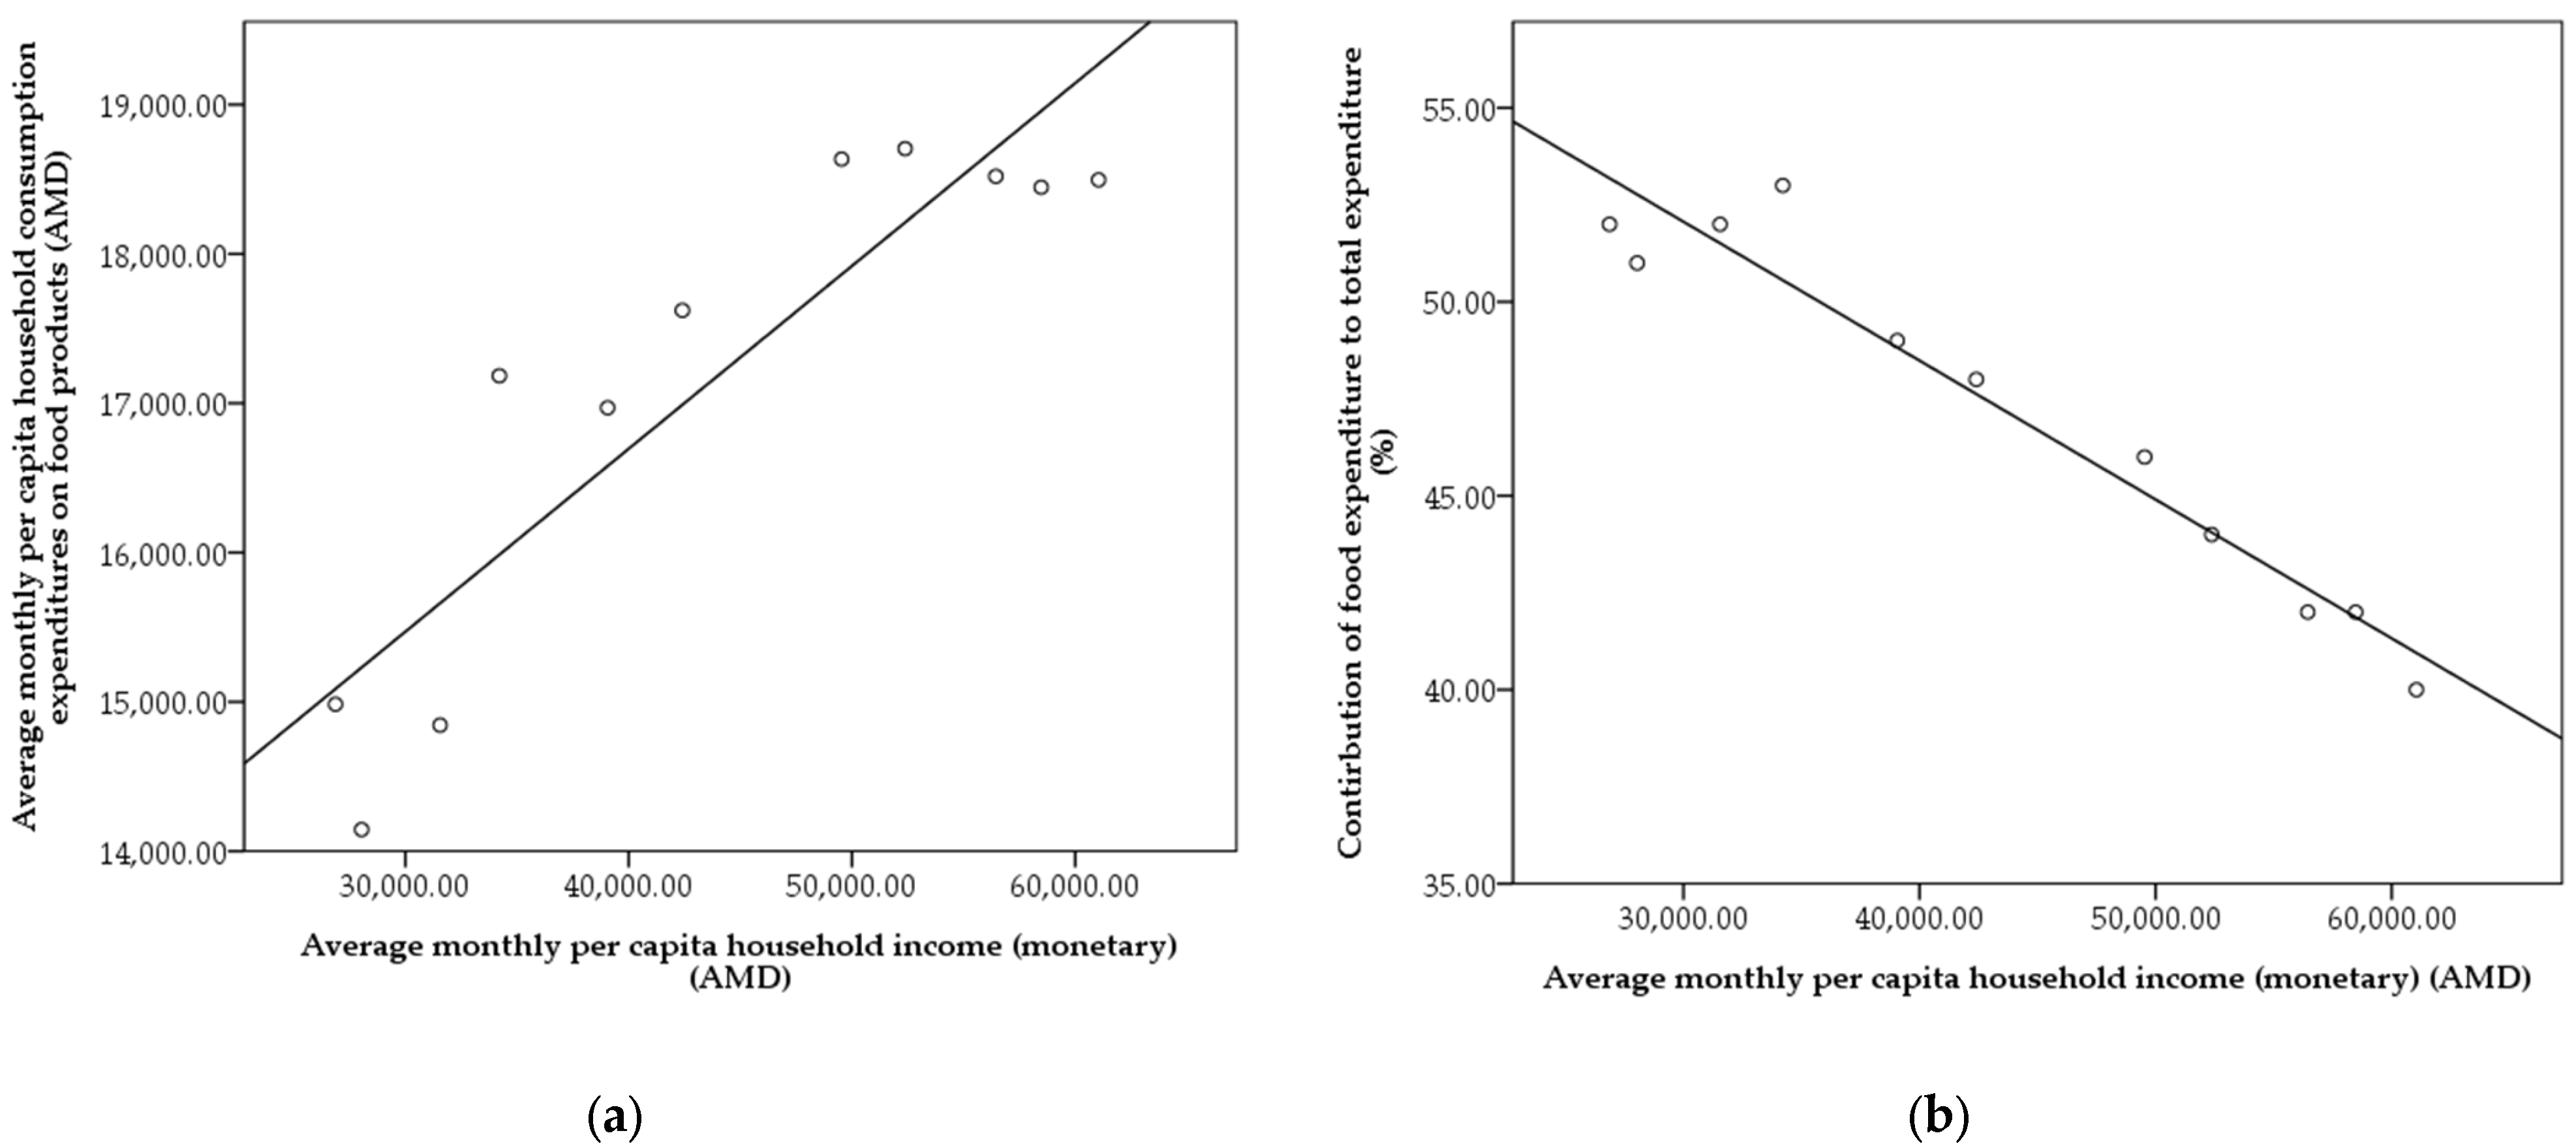
3.4. The Impact of Income and CPI Changes on Food Consumption Expenditure, 2008–2019
3.5. Meeting Dietary Recommendations
4. Conclusions
Author Contributions
Funding
Data Availability Statement
Conflicts of Interest
References
- Augustin, M.A.; Riley, M.; Stockmann, R.; Bennett, L.; Kahl, A.; Lockett, T.; Osmond, M.; Sanguansri, P.; Stonehouse, W.; Zajac, I.; et al. Role of food processing in food and nutrition security. Trends Food Sci. Technol. 2016, 56, 115–125. [Google Scholar] [CrossRef]
- Harris, J.; Nguyen, P.H.; Tran, L.M.; Huynh, P.N. Nutrition transition in Vietnam: Changing food supply, food prices, household expenditure, diet, and nutrition outcomes. Food Secur. 2020, 12, 1141–1155. [Google Scholar] [CrossRef]
- Andrew, N.L.; Allison, E.H.; Brewer, T.; Connell, J.; Eriksson, H.; Eurich, J.G.; Farmery, A.; Gephart, J.A.; Golden, C.D.; Herrero, M.; et al. Continuity and change in the contemporary Pacific food system. Glob. Food Secur. 2022, 32, 100608. [Google Scholar] [CrossRef]
- Asioli, D.; Aschemann-Witzel, J.; Caputo, V.; Vecchio, R.; Annunziata, A.; Naes, T.; Varela, P. Making sense of the “clean label” trends: A review of consumer food choice behavior and discussion of industry implications. Food Res. Int. 2017, 99, 58–71. [Google Scholar] [CrossRef] [PubMed]
- Park, H.; Kityo, A.; Kim, Y.; Lee, S.A. Macronutrient Intake in Adults Diagnosed with Metabolic Syndrome: Using the Health Examinee (HEXA) Cohort. Nutrients 2021, 13, 4457. [Google Scholar] [CrossRef] [PubMed]
- Mengesha, S.T. Understanding the Patterns and Trends of Food Consumption in a Developing Country Context: The Case of Amhara Region, Ethiopia. Risk Manag. And Healthc. Policy 2021, 14, 1777. [Google Scholar] [CrossRef] [PubMed]
- Carducci, B.; Oh, C.; Roth, D.E.; Neufeld, L.M.; Frongillo, E.A.; L’Abbe, M.R.; Franzo, J.; Herforth, A.; Sellen, D.W.; Bhutta, Z.A. Gaps and priorities in assessment of food environments for children and adolescents in low-and middle-income countries. Nat. Food 2021, 2, 396–403. [Google Scholar] [CrossRef]
- Waid, J.L.; Ali, M.; Thilsted, S.H.; Gabrysch, S. Dietary change in Bangladesh from 1985 to 2010. Glob. Food Secur. 2018, 17, 221–232. [Google Scholar] [CrossRef]
- Murphy, S.; Ruel, M.; Carriquiry, A. Should Household Consumption and Expenditures Surveys (HCES) be used for nutritional assessment and planning? Food Nutr Bull. 2012, 33 (Suppl. S2), S235–S241. [Google Scholar] [CrossRef] [PubMed]
- Fiedler, J.L.; Mwangi, D.M. Using Household Consumption and Expenditure Surveys to Make Inferences about Food Consumption, Nutrient Intakes, and Nutrition Status; International Food Policy Research Institute: Washington, DC, USA, 2016; Volume 1571. [Google Scholar]
- SC. Statistical Committee of RA: Integrated Living Conditions Survey 2019 Armenia. 2020. Available online: https://armstat.am/en/?nid=207 (accessed on 22 June 2021).
- WHO. Prevention and Control of Noncommunicable Diseases in Armenia. The Case for Investment in Prevention and Control of Noncommunicable Diseases (NCDs). 2019. Available online: https://www.euro.who.int/__data/assets/pdf_file/0017/401273/BizzCase-ARM-web.pdf (accessed on 1 September 2022).
- WFP. Food Security and Vulnerability Assessment in Armenia. 2021. Available online: https://docs.wfp.org/api/documents/WFP-0000134964/download/?_ga=2.119127104.811052882.1662529687-822788372.1662529687 (accessed on 1 September 2022).
- Pipoyan, D.; Stepanyan, S.; Beglaryan, M.; Stepanyan, S.; Mantovani, A. Health risk assessment of toxicologically relevant residues in emerging countries: A pilot study on Malachite Green residues in farmed freshwater fish of Armenia. Food Chem. Toxicol. 2020, 143, 111526. [Google Scholar] [CrossRef] [PubMed]
- Pipoyan, D.; Beglaryan, M.; Sireyan, L.; Merendino, N. Exposure assessment of potentially toxic trace elements via consumption of fruits and vegetables grown under the impact of Alaverdi’s mining complex. Hum. Ecol. Risk Assess. 2019, 25, 819–834. [Google Scholar] [CrossRef]
- SC. Statistical Committee of RA: Integrated Living Conditions Survey 2008 Armenia. 2020. Available online: https://microdata.worldbank.org/index.php/catalog/2957 (accessed on 28 May 2021).
- FAO. Food Composition Table for Armenia. First Edition. 2010. Available online: http://www.fao.org/infoods/infoods/tables-and-databases/europe/en/ (accessed on 1 September 2022).
- Greenfield, H.; Southgate, D.A.T. Food Composition Data 2nd Edition: Production, Management, and Use; Elsevier Science Publishers: Amsterdam, The Netherlands; FAO: Rome, Italy, 2003. [Google Scholar]
- WHO. Healthy Diet. No. WHO-EM/NUT/282/E; Regional Office for the Eastern Mediterranean; World Health Organization: Geneva, Switzerland, 2019.
- ТР ТС, 2011. 022/2011 Tехнический регламент Tамoженнoгo сoюза “Пищевая прoдукция в части ее маркирoвки” (с изменениями на 14 сентября 2018 гoда). Available online: http://docs.cntd.ru/document/902320347 (accessed on 1 September 2022).
- WHO/FAO. Human Energy Requirements: Report of a Joint FAO/WHO/UNU Expert Consultation: 2004; Food and Agriculture Org: Rome, Italy, 17–24 October 2001; Volume 1, Available online: http://www.fao.org/3/y5686e/y5686e00.htm#Contents (accessed on 1 September 2022).
- Australia Bureau of Statistics. Australian Health Survey: Nutrition First Results—Foods and Nutrients, 2011–2012; Australia Bureau of Statistics: Canberra, Australia, 2014. Available online: www.abs.gov.au/ausstats/abs@.nsf/Lookup/4364.0.55.007main+features12011-12 (accessed on 1 September 2022).
- Levy, R.B.; Claro, R.M.; Mondini, L.; Sichieri, R.; Monteiro, C.A. Regional and socioeconomic distribution of household food availability in Brazil, in 2008–2009. Rev. Saúde Pública 2011, 46, 6–15. [Google Scholar] [CrossRef] [PubMed]
- Food Standards Agency and Public Health England. National Diet and Nutrition Survey (NDNS). 2016. Available online: https://www.gov.uk/government/collections/national-diet-and-nutrition-survey (accessed on 1 September 2022).
- Górska-Warsewicz, H.; Laskowski, W.; Kulykovets, O.; Kudlińska-Chylak, A.; Czeczotko, M.; Rejman, K. Food products as sources of protein and amino acids—The case of Poland. Nutrients 2018, 10, 1977. [Google Scholar] [CrossRef] [PubMed]
- Hemalatha, A.; Lamaiah, A.; Sriswan, M.; Boiroju, N.; Radhakrishna, K. What India Eats. Report. 2020. Available online: https://www.nin.res.in/nutrition2020/what_india_eats.pdf (accessed on 1 September 2022).
- EFSA Panel on Dietetic Products, Nutrition, and Allergies (NDA). Scientific opinion on dietary reference values for carbohydrates and dietary fibre. EFSA J. 2010, 8, 1462. Available online: https://efsa.onlinelibrary.wiley.com/doi/10.2903/j.efsa.2010.1462 (accessed on 1 September 2022).
- EFSA Panel on Dietetic Products, Nutrition and Allergies (NDA). Scientific opinion on dietary reference values for protein. EFSA J. 2012, 10, 2557. Available online: https://efsa.onlinelibrary.wiley.com/doi/10.2903/j.efsa.2012.2557 (accessed on 1 September 2022). [CrossRef]
- WHO/FAO. Energy and protein requirements. World Health Organ. Tech. Support Ser. 1985, 724, 1–206. Available online: http://www.fao.org/3/AA040E/AA040E00.htm#TOC (accessed on 1 September 2022).
- EFSA Panel on Dietetic Products, Nutrition, and Allergies (NDA). Scientific Opinion on dietary reference values for fats, including saturated fatty acids, polyunsaturated fatty acids, monounsaturated fatty acids, trans fatty acids, and cholesterol. EFSA J. 2010, 8, 1461. Available online: https://efsa.onlinelibrary.wiley.com/doi/10.2903/j.efsa.2010.1461 (accessed on 1 September 2022).
- WHO/FAO. Fats and Fatty Acids in Human Nutrition; Report of an expert consultation, 10–14 November 2008; WHO: Geneva, Switzerland, 2010; Available online: http://www.fao.org/3/i1953e/i1953e.pdf (accessed on 1 September 2022).
- SC. Statistical Committee of RA. Poverty. 2019. Available online: https://armstat.am/file/article/poverty_2019_a_3.pdf (accessed on 1 September 2022).
- SC. Statistical Committee of RA. ArmStatBank. Consumer Price Index Republic of Armenia 1950–2020 by Years. 2021. Available online: https://armstatbank.am/pxweb/en/ArmStatBank/ArmStatBank__1%20Econnomy%20and%20finance__12%20Consumer%20Prices/EF-cpi-11-tari-2020.px/?rxid=002cc9e9-1bc8-4ae6-aaa3-40c0e377450a,002cc9e9-1bc8-4ae6-aaa3-40c0e377450a (accessed on 1 September 2022).
- SC. Statistical Committee of RA. Prices and Price Indexes. 2021. Available online: https://armstat.am/file/article/f_sec_1_2021_2.pdf (accessed on 1 September 2022).
- Ghazaryan, A. Can locally available foods provide a healthy diet at affordable costs? Case of Armenia. Dev. Stud. Res. 2018, 5, 122–131. [Google Scholar] [CrossRef] [Green Version]
- Torchyan, A. Knowledge of the Armenian Population about Healthy Nutrition. College of Health Science, American University of Armenia. 2007. Available online: https://law.aua.am/chsr/PDF/MPH/2007/TorchyanArmen.pdf (accessed on 1 September 2022).
- WFP. Armenia—Comprehensive Food Security and Vulnerability Analysis. 2019. Available online: https://docs.wfp.org/api/documents/WFP-0000117212/download/?_ga=2.10392316.811052882.1662529687-822788372.1662529687 (accessed on 1 September 2022).
- Williamson, D. WWF-UK Livewell: Healthy People, Healthy Planet. 2011. Available online: http://assets.wwf.org.uk/downloads/livewell___healthy_people_healthy_planet.pdf (accessed on 1 September 2022).


| Food Groups | Number of Products in Each Group |
|---|---|
| Cereals and bakery products | 11 |
| Meat and meat products | 10 |
| Fish | 3 |
| Milk and milk products, eggs | 9 |
| Fats and Oils | 3 |
| Fruits | 14 |
| Vegetables | 22 |
| Potato | 1 |
| Sugar, Honey, Confectionery | 8 |
| Mineral Water (bottled), Juices | 7 |
| Total | 88 |
| Food Groups | Year | |||||||||||
|---|---|---|---|---|---|---|---|---|---|---|---|---|
| 2008 | 2009 | 2010 | 2011 | 2012 | 2013 | 2014 | 2015 | 2016 | 2017 | 2018 | 2019 | |
| Cereals and bakery products | 12.7 | 12.3 | 11.9 | 12.2 | 12.2 | 11.8 | 11.3 | 11.4 | 11.3 | 10.6 | 10.5 | 10.1 |
| Meat and meat products | 2 | 2 | 1.8 | 1.8 | 1.9 | 1.9 | 1.9 | 1.9 | 2 | 1.9 | 2 | 2.1 |
| Fish | 0.2 | 0.2 | 0.1 | 0.1 | 0.2 | 0.2 | 0.2 | 0.2 | 0.2 | 0.2 | 0.2 | 0.3 |
| Milk, matsun | 1.7 | 1.7 | 1.7 | 1.7 | 1.5 | 1.5 | 1.7 | 1.8 | 1.8 | 1.8 | 1.6 | 1.5 |
| Cheese | 1.06 | 1 | 0.8 | 0.8 | 0.9 | 0.8 | 0.8 | 0.9 | 0.9 | 0.8 | 0.8 | 0.8 |
| Eggs (in pieces) | 10.1 | 10.5 | 11.1 | 11.2 | 10.8 | 10.4 | 10.9 | 10.5 | 10.7 | 10.6 | 11.3 | 12 |
| Butter and oil | 0.4 | 0.4 | 0.3 | 0.2 | 0.2 | 0.3 | 0.2 | 0.2 | 0.2 | 0.2 | 0.1 | 0.1 |
| Vegetable oil and other oils | 0.6 | 0.5 | 0.5 | 0.6 | 0.4 | 0.4 | 0.5 | 0.5 | 0.6 | 0.6 | 0.6 | 0.5 |
| Fruits and berries | 3.9 | 4.5 | 4.3 | 4 | 4.2 | 3.9 | 3.8 | 3.9 | 3.9 | 3.5 | 3.6 | 3.6 |
| Vegetables | 6.3 | 6.1 | 5.7 | 6.5 | 6.6 | 6.6 | 6.4 | 6.6 | 6.6 | 6.2 | 6.5 | 5.9 |
| Potato | 3.9 | 3.9 | 3.9 | 3.6 | 3.6 | 3.5 | 3.4 | 3.5 | 3.4 | 3.3 | 3.3 | 3.2 |
| Sugar, honey, confectionery | 0.7 | 0.7 | 0.6 | 0.6 | 0.6 | 0.6 | 0.5 | 0.6 | 0.6 | 0.4 | 0.4 | 0.3 |
| Food Type | Average Monthly Per Capita Household Income (Monetary) p (Significance) | Consumer Price Index over the Base Year of 2000 p (Significance) |
|---|---|---|
| Bread and bread products | −0.935 ** (0.000) | −0.872 ** (0.001) |
| Potato | −0.949 ** (0.000) | −0.959 ** (0.000) |
| Vegetables and vegetable crops | 0.190 (0.553) | 0.295 (0.352) |
| Fruits and berries | −0.802 ** (0.002) | −0.749 ** (0.005) |
| Meat and meat products | 0.382 (0.221) | 0.206 (0.520) |
| Milk and yogurt | 0.009 (0.977) | −0.074 (0.819) |
| Cheese | −0.534 (0.074) | −0.655 * (0.021) |
| Butter and Oil | −0.843 ** (0.001) | −0.882 ** (0.000) |
| Eggs | 0.445 (0.147) | 0.460 (0.132) |
| Fish products | 0.549 (0.065) | 0.454 (0.139) |
| Sugar | −0.823 ** (0.001) | −0.778 ** (0.003) |
| Vegetable oil and other oils | 0.188 (0.558) | 0.027 (0.935) |
Publisher’s Note: MDPI stays neutral with regard to jurisdictional claims in published maps and institutional affiliations. |
© 2022 by the authors. Licensee MDPI, Basel, Switzerland. This article is an open access article distributed under the terms and conditions of the Creative Commons Attribution (CC BY) license (https://creativecommons.org/licenses/by/4.0/).
Share and Cite
Stepanyan, S.; Pipoyan, D.; Beglaryan, M.; Merendino, N. Assessing Dietary Intakes from Household Budget Survey in Armenia, 2008–2019. Foods 2022, 11, 2847. https://doi.org/10.3390/foods11182847
Stepanyan S, Pipoyan D, Beglaryan M, Merendino N. Assessing Dietary Intakes from Household Budget Survey in Armenia, 2008–2019. Foods. 2022; 11(18):2847. https://doi.org/10.3390/foods11182847
Chicago/Turabian StyleStepanyan, Seda, Davit Pipoyan, Meline Beglaryan, and Nicolò Merendino. 2022. "Assessing Dietary Intakes from Household Budget Survey in Armenia, 2008–2019" Foods 11, no. 18: 2847. https://doi.org/10.3390/foods11182847
APA StyleStepanyan, S., Pipoyan, D., Beglaryan, M., & Merendino, N. (2022). Assessing Dietary Intakes from Household Budget Survey in Armenia, 2008–2019. Foods, 11(18), 2847. https://doi.org/10.3390/foods11182847