Article

Evaluation of pH in Sausages Stuffed in a Modified Casing with Orange Extracts by Hyperspectral Imaging Coupled with Response Surface Methodology

by
Chao-Hui Feng
1,2,*,
Hirofumi Arai
1 and
Francisco J. Rodríguez-Pulido
3
1
School of Regional Innovation and Social Design Engineering, Faculty of Engineering, Kitami Institute of Technology, 165 Koen-cho, Kitami, Sendai 090-8507, Japan
2
RIKEN Centre for Advanced Photonics, RIKEN, 519-1399 Aramaki-Aoba, Aoba-ku, Sendai 980-0845, Japan
3
Food Colour and Quality Laboratory, Facultad de Farmacia, Universidad de Sevilla, 41012 Sevilla, Spain
*
Author to whom correspondence should be addressed.
Foods 2022, 11(18), 2797; https://doi.org/10.3390/foods11182797
Submission received: 18 August 2022 / Revised: 4 September 2022 / Accepted: 8 September 2022 / Published: 10 September 2022

Abstract

:
The pH values of sausages stuffed in natural hog casings with different modifications (soy lecithin, soy oil, orange extracts (OE) from waste orange peels, lactic acid in slush salt, and treatment time) after 16-day 4 °C storage were evaluated for the first time by hyperspectral imaging (350–1100 nm) coupled with response surface methodology (RSM). A partial least squares regression (PLSR) model was developed to relate the spectra to the pH of sausages. Spectral pretreatment, including first derivative, second derivative, multiplicative scatter correction (MSC), standard normal variate (SNV), normalization, and normalization, with different combinations was employed to improve model performance. RSM showed that only soy lecithin and OE interactively affected the pH of sausages (p < 0.05). The pH value decreased when the casing was treated with a higher concentration of soy lecithin with 0.26% OE. As the first and second derivatives are commonly used to eliminate the baseline shift, the PLSR model derived from absorbance pretreated by the first derivative in the full wavelengths showed a calibration coefficient of determination (R2) of 0.73 with a root mean square error of calibration of 0.4283. Twelve feature wavelengths were selected with a comparable R2 value compared with the full wavelengths. The prediction map enables the visualization of the pH evolution of sausages stuffed in the modified casings added with OE.

1. Introduction

Due to their special bite and unique flavor, natural casings are widely utilized in sausage production. Nevertheless, the high bursting incidence hinders the rapid and efficient large-scale manufacture of sausages. Nature casings are required to bear the high pressures generated during stuffing or precooking without compromising sausage quality. Previous studies have proven that casings can become more porous after modification and reduce the bursting that occurs during immersion vacuum cooling [1]. Due to the change in the microstructure of modified casings, microorganism invasion and oxidation can easily occur; therefore, a food-grade antioxidative or antimicrobial reagent is required to prolong the shelf life of modified casings for better commercial utilization.
Citrus fruit peels, which possess a large amount of useful and helpful biologically active compounds for human beings, are currently either directly discarded to landfills as fertilizer, used as animal feed, or sold as dried orange peels in China, serving as one of the ingredients of Chinese herbal medicine [2]. The waste of orange peels not only causes environmental problems, but it is also highly costly to deal with waste in accordance with the Food Recycling Law in Japan [3]. As a member of the flavonoids family and rich in the peels of citrus fruits, hesperidin has been demonstrated to be effective against liver cancer and lung cancer [4], possessing antioxidant [5] and antimicrobial properties [6,7]. The latest literature also reveals that flavonoids such as hesperidin and rutin can be regarded as the starting point for therapeutics against COVID-19 [8]. If the waste of orange peels can be taken full advantage of, it can not only reduce environmental issues but also utilize value-added products and increase industrial income [9]. As modified casings require an antioxidative or antimicrobial reagent, it is meaningful to add extracts from these waste orange peels. Fernández-López (2007) studied the quality of dry-cured sausages according to different concentrations of orange fiber powder (mixture of albedo, flavedo, and pulp) with a 28-day dry-curing time of 15 ± 1 °C and relative humidity of 75% [10]. The pH values of all samples decreased during the first week and then returned to similar values after 4 weeks. Fernández-Ginés et al. (2003) observed that a lower pH value was obtained when a higher concentration of orange fiber was used [11]. The reason for using citrus fiber was that it possesses better quality than other dietary fibers due to the presence of bioactive compounds such as flavonoids, polyphenols, carotenes, and antioxidant properties [11].
Response surface methodology (RSM) is a useful statistical method that can interpret the relationship between food processing parameters and the quality attributes of food products [12,13,14,15,16,17], especially if the effects of variables on the response are unknown. As a powerful design that can greatly reduce the number of experiments compared with a full experimental design, the central composite design (CCD) has been employed in several studies by RSM with a single run of different variable combinations and replicates only at the center point [18,19,20]. Currently, however, there are no relevant studies on combining sausage casing modification and orange extracts from waste orange peels by using RSM, which merits investigating their effects on sausage quality.
Hyperspectral imaging (HSI) is more advantageous than conventional spectroscopic methods, as it can provide the spectral information and spatial distribution of a subject simultaneously [21]. Prediction maps can provide more detailed information on how many and where attributes are exactly located. The pH changes of large Japanese sausages under different storage conditions were investigated by HSI via a distribution map developed by R statistics [21]. The results showed that the pH values of samples stored at 35 °C for 1, 3, and 5 days started to decrease in the surrounding area [19]. Compared to a conventional digital pH meter that can only identify the measuring spot, distribution maps generated by HSI can elaborate on how many different pH values exist in every spot in different test samples. The Cantonese sausage grade was classified by using multiple linear regression (MLR) and partial least squares regression (PLSR), and the best classification was achieved by using a successive projections algorithm coupled with MLR, with a predictive accuracy of 100% [22]. Shi et al. (2019) employed HSI to classify colonies from food fragments (sausage, bacon, and millet fragments) in an agar plate [23]. Kamrruzzaman et al. (2022) studied the moisture of red meat and corn using six different methods to select the wavelength in terms of model performance and demonstrated that competitive adaptive reweighted sampling (CARS) in tandem with PLSR is superior to PLSR models when developing models between the moisture and spectra of red meat and corn using a full spectral range [24]. Siripatrawan and Makino (2018) evaluated the changes in physicochemical, microbiological, and sensory attributes of packaged bratwurst (a type of sausage) during 20-day storage at 4 ± 1 °C [25]. Lightness, thiobarbituric acid, total viable counts, lactic acid bacteria, odor, and overall acceptability were found to be highly correlated with reflectance [25]. All these studies accentuate an unyielding interest in the application of HSI as an emerging method to detect different types of meat products.
Although previous studies have investigated the pH [26], color [27,28,29], and triphosphate content [30] of sausages by using HSI, scarce information has been obtained on evaluating the effects of extracts from waste orange peels on the pH of sausages after addition in a modified solution by using RSM and HSI combined with the PLSR algorithm. The novelty of the current study is:
(1)
The simultaneous effects of five variables (different concentrations of soy lecithin, soy oil, lactic acid, orange extracts, and treatment times) on the pH of sausages during 15 days of storage were elucidated by RSM.
(2)
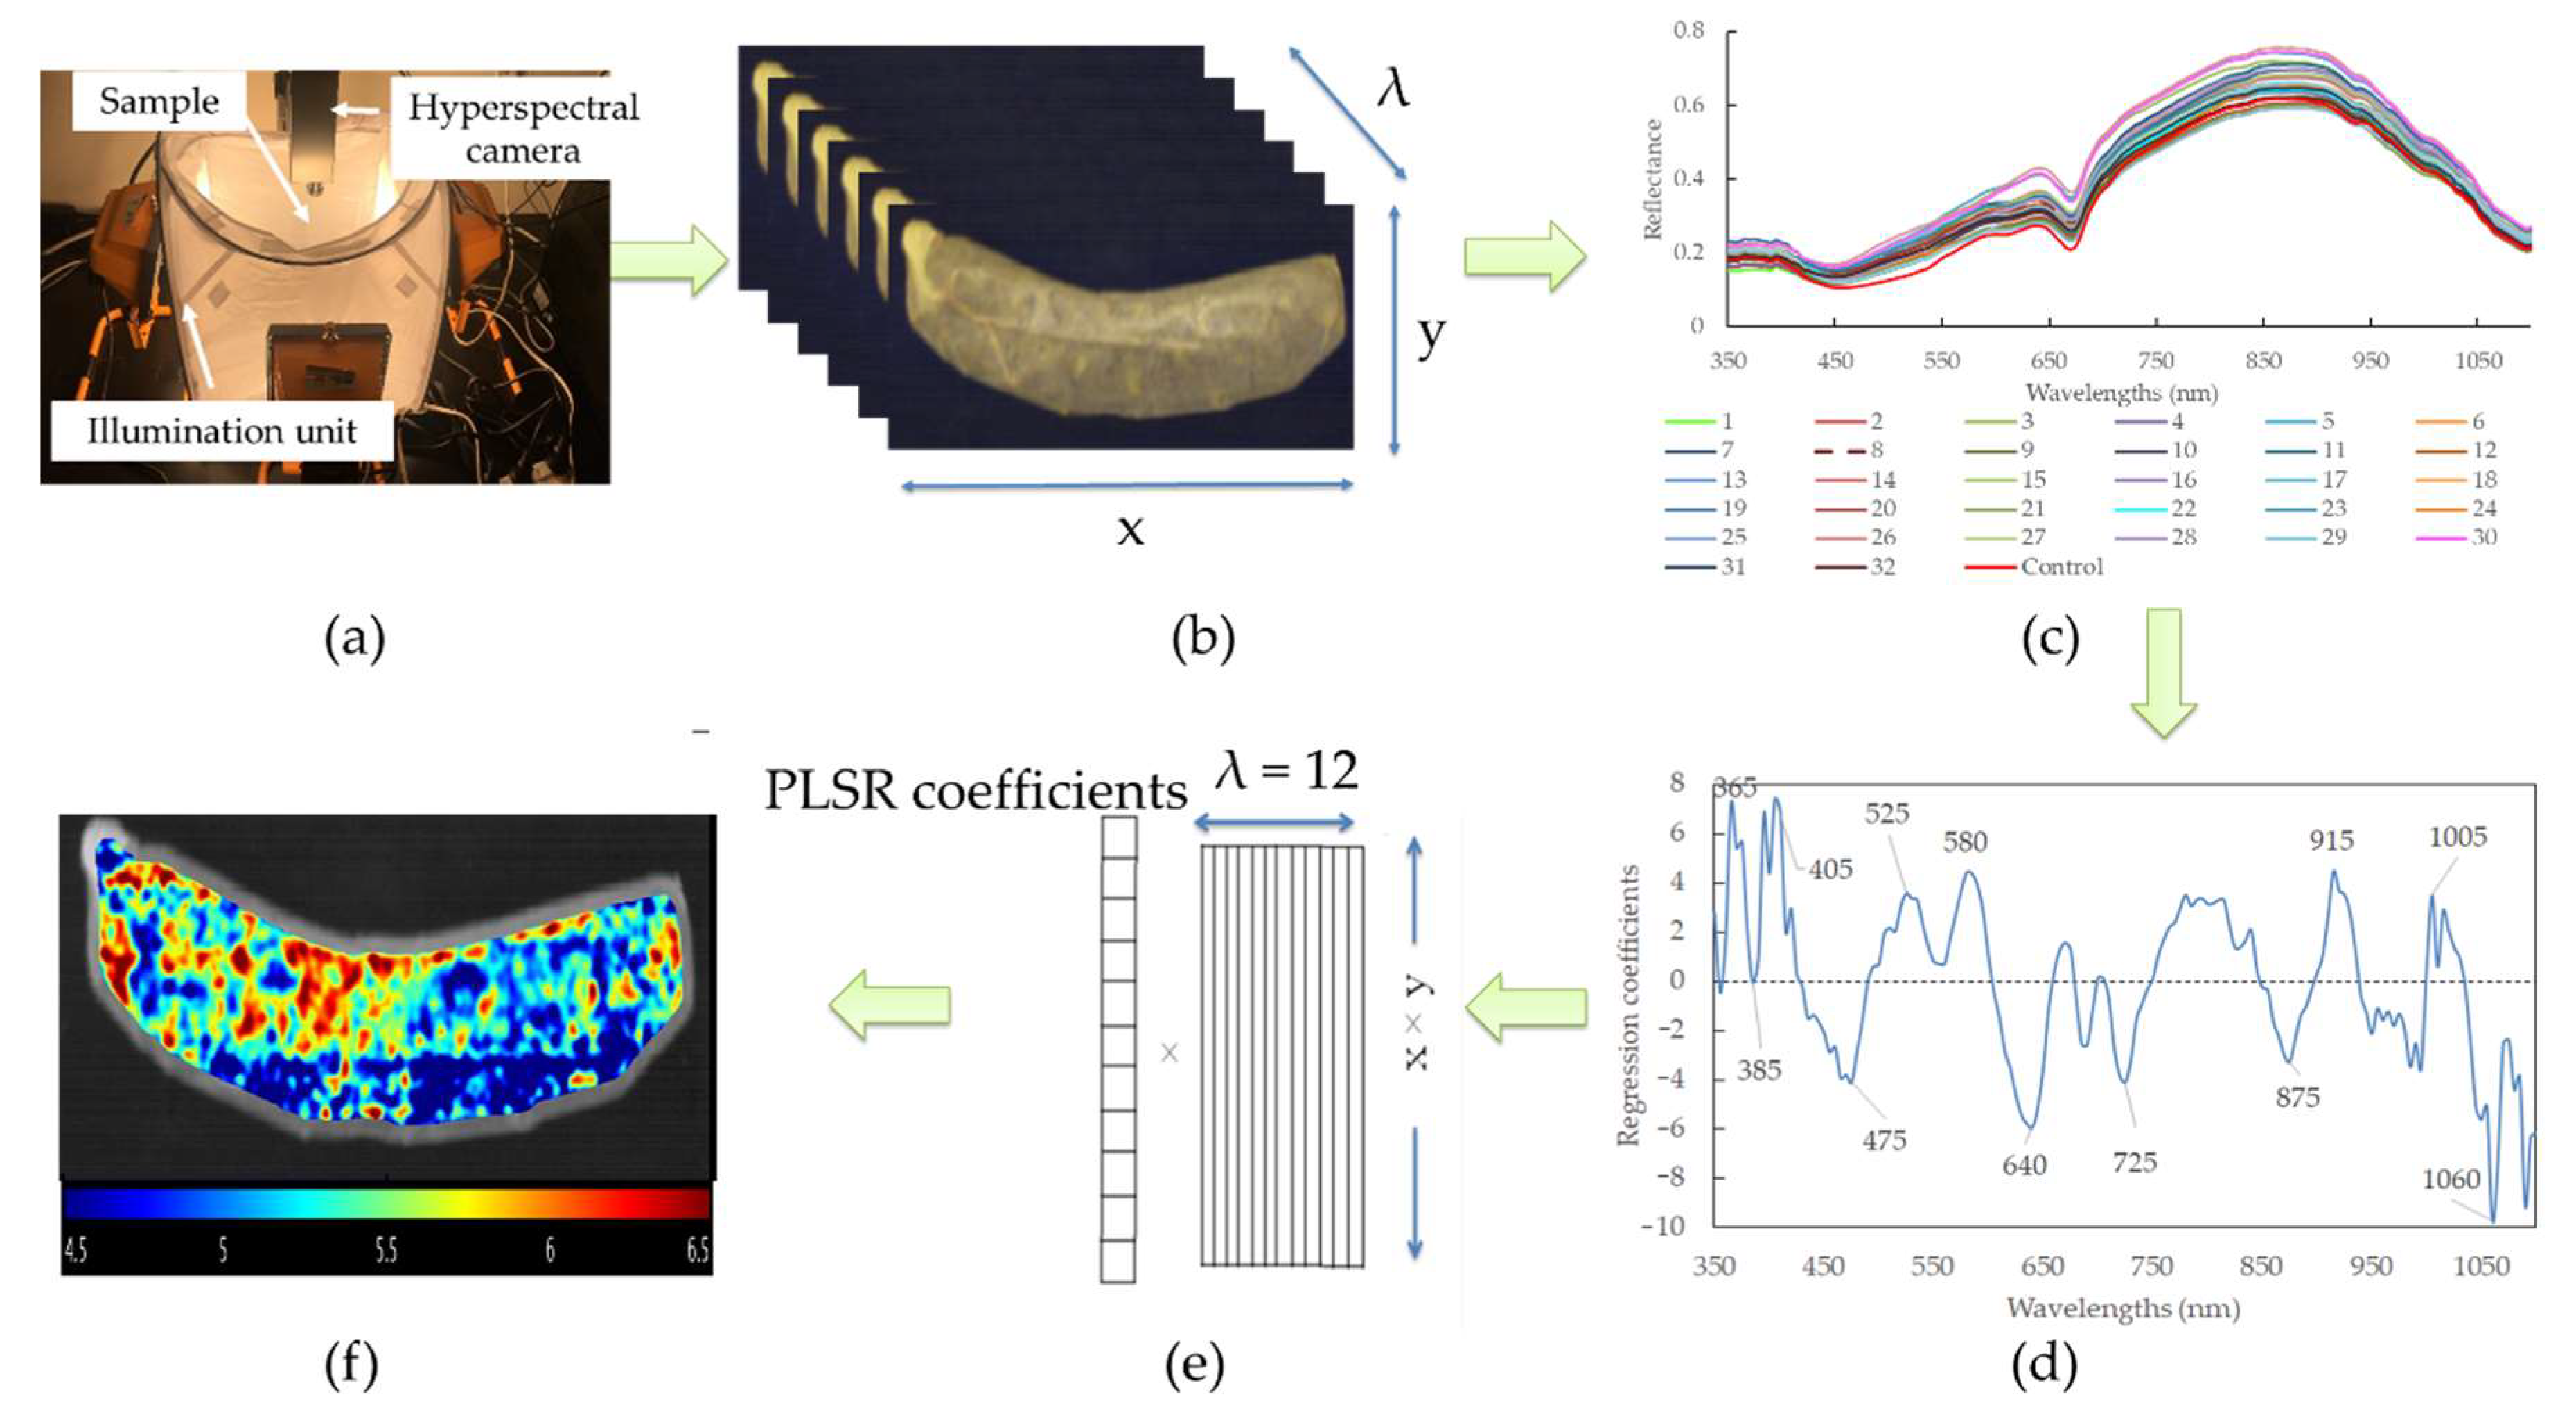
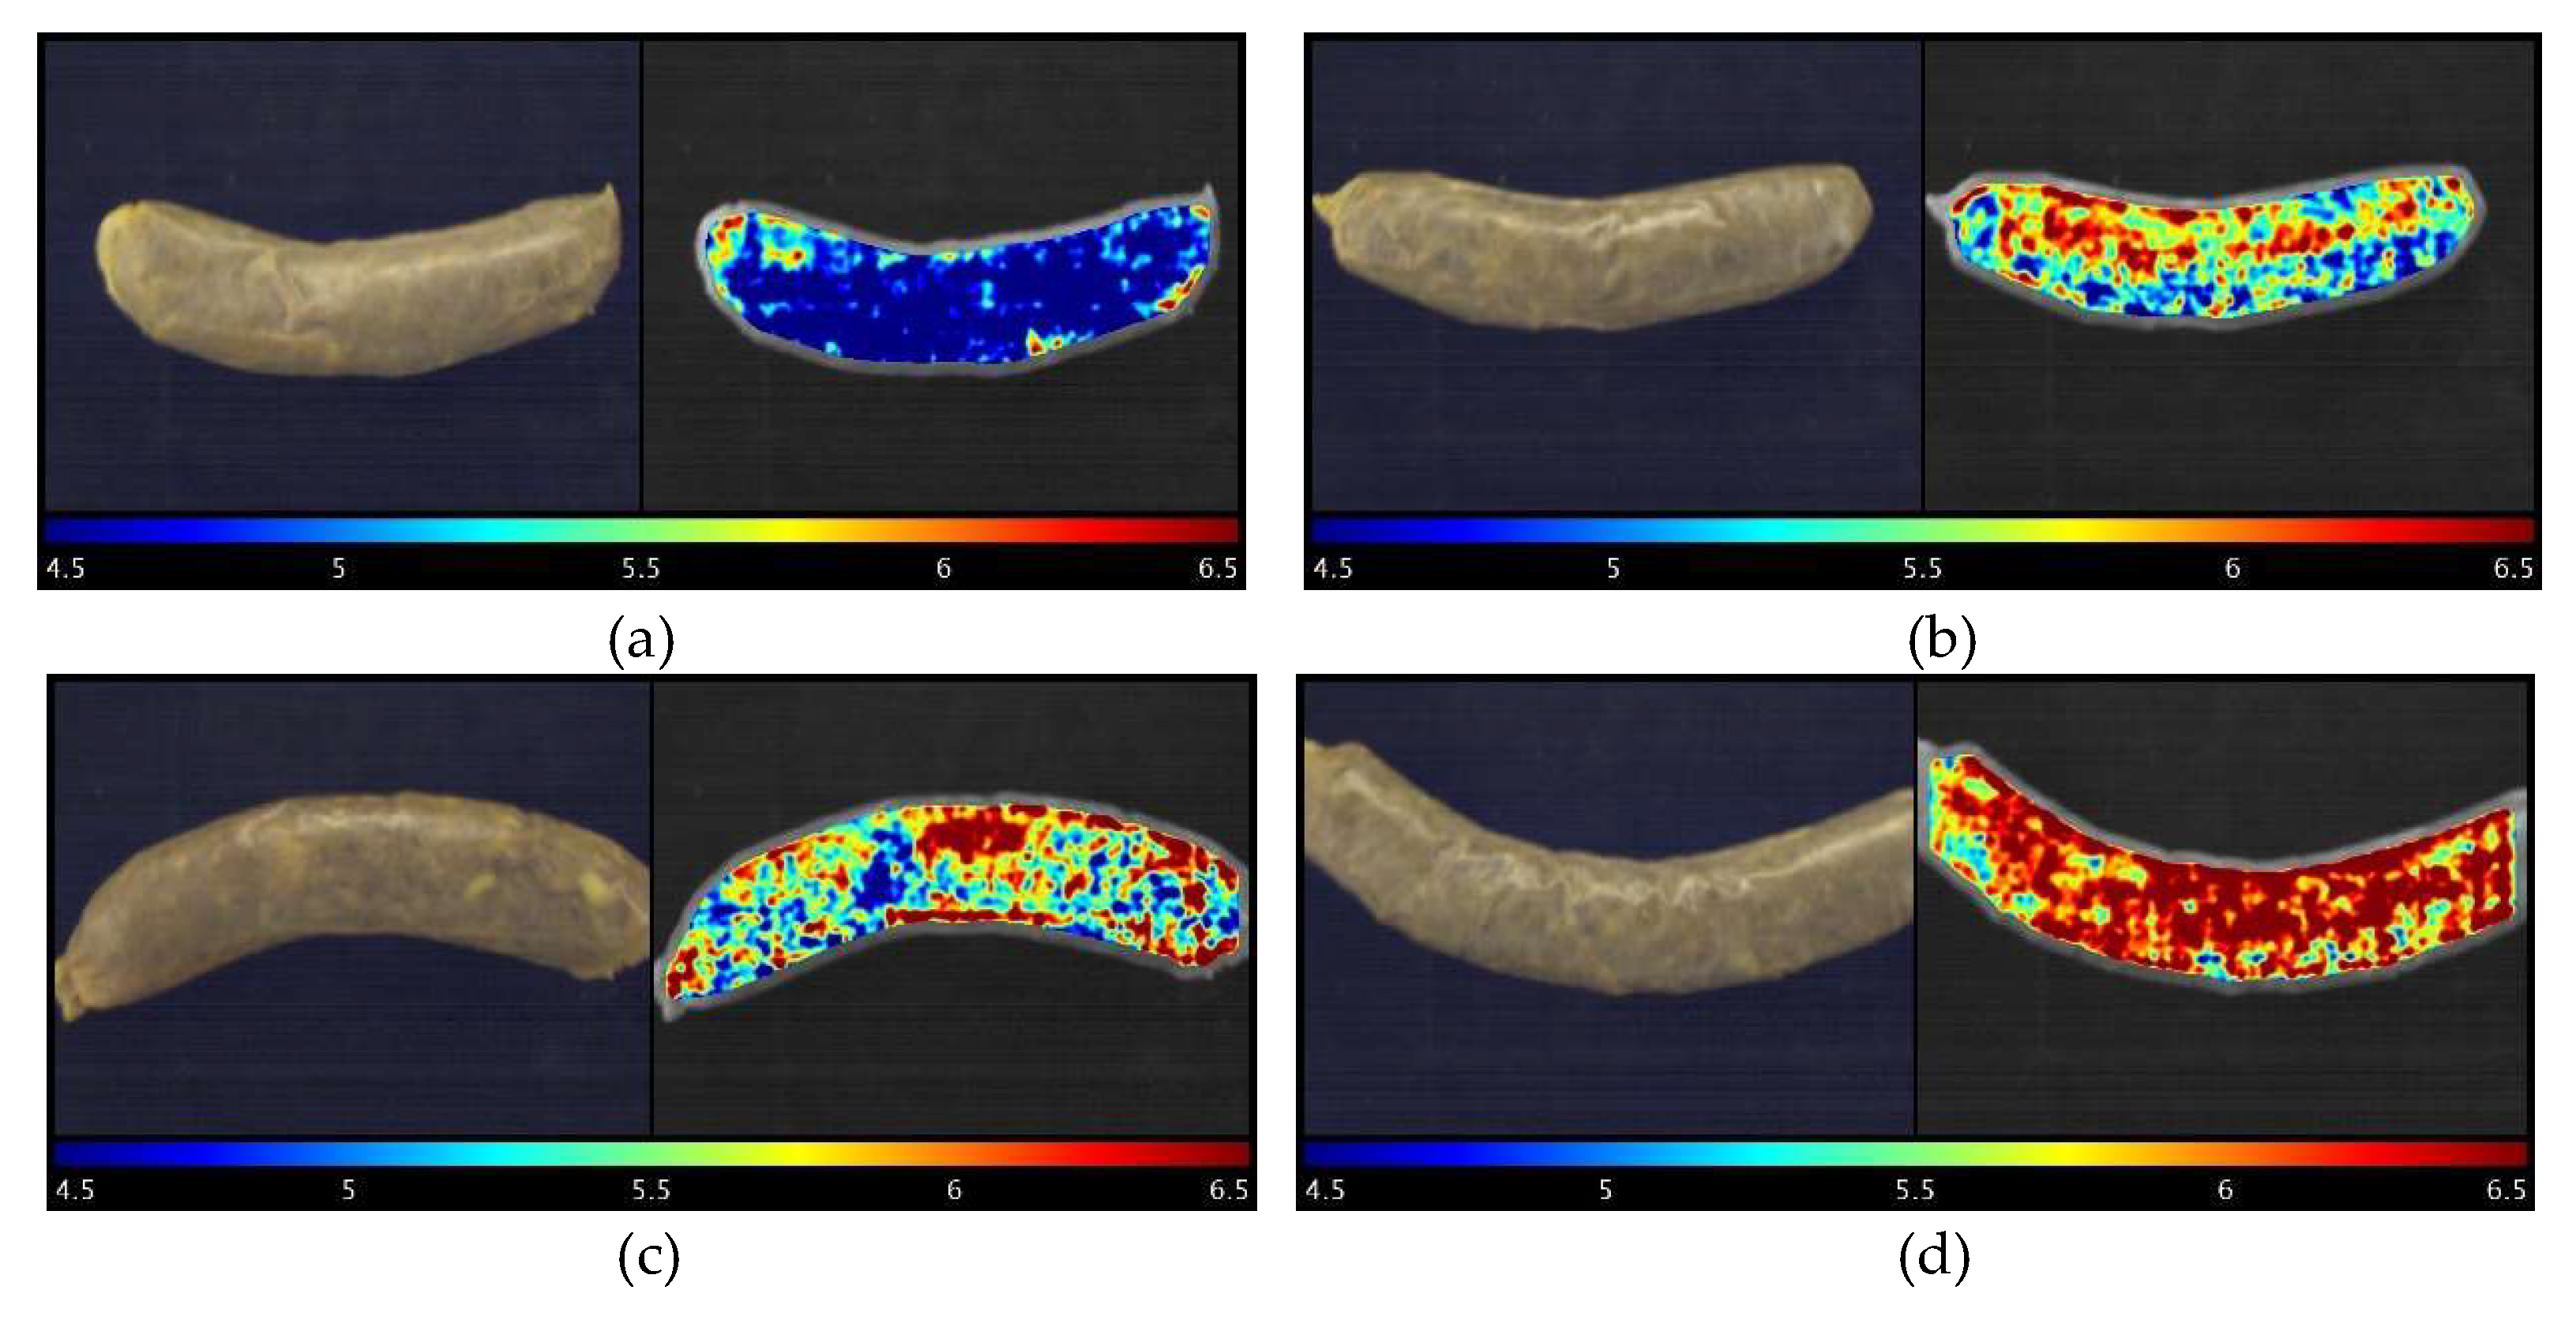
The pH of sausages stuffed in modified casings after adding orange extracts was elaborated for the first time by HSI. The pH changes of each pixel in casings responding to different concentrations of orange extracts were clearly illustrated via prediction maps. The results can provide a better understanding of how pH reacts with orange extracts and provide useful information for future investigations.
(3)
The relationship between pH and spectra from the surface of cylindrical sausages with modified casings was established for the first time by PLSR.
The purpose of this study is to evaluate the effects of five variables on the pH of sausages by using RSM. Following this, a quantitative model relating spectral data to the reference pH of sausage with this new type of casing is established. Consequently, wavelengths with high predictive power are chosen, and the distribution map of pH with differently treated casings is developed using image processing algorithms.

2. Materials and Methods

2.1. Soxhlet Extraction

The peels of Valencia sweet orange (Citrus sinensis) were first dried at 45 °C for 7 days. The dried orange peels were finely blade-milled into powder, and an average of 40.70 ± 0.52 g of orange powder was added to a cartridge sealed with cotton for Soxhlet extraction using 250 mL of 100% methanol. The crude extracts were separated from the solvent using a rotary vacuum evaporator. The crude extracts were placed in a flow hood overnight, allowing the solvent to be fully evaporated. Subsequently, the crude extracts were washed with distilled water of twice their weights, filtered, dried, and stored in a desiccator to finally obtain the dried precipitate extracts for further usage. The efficiencies of crude extract and precipitation were calculated based on the weight ratio of crude and precipitation with orange powder. A total of 35 repetitions were conducted to obtain enough orange extracts.

2.2. Experiment Design and Casing Modification

The simultaneous effects of five treatment variables (soy lecithin (X1), soy oil (X2), orange extracts (X3), lactic acid (X4), and treatment time (X5)) on pH were studied using RSM. The ranges of the independent variables were defined as follows: 2.12–4.20% for X1, 1.18–2.39% for X2, 0.12–0.40% for X3, 18–21 mL/kg NaCl for X4, and 60–90 min for X5. The experimental plan was designed by Minitab 21.1 software with an alpha (α) of 2 (Kozo Keikaku Engineering Inc., Tokyo, Japan). A total of 32 experiment matrices, including 6 replicates of the central point, were conducted in a random order to avoid erroneous conclusions due to extraneous sources of variability [1,17]. A quadratic polynomial equation was employed to establish the relationship between YpH and independent variables (Xa; a = 1 − 5).
Y pH   = β + a = 1 β a X a   + a = 1 β a a X a X a   + a = 1 b = a + 1 β a b X a X b
where β, βa, βaa, and βab are the coefficients of constant, linear, quadratic, and interaction, respective. The F test was employed to estimate the significance of the regression parameters.
The surfactant solution was made by dissolving soy lecithin and soy oil with distilled water via magnetic agitation at 500 rpm and 60 °C. The orange extracts were added when the modified solution was cooled to 25 °C and mixed well with the magnetic agitation. A length of 30 cm natural hog casing (Pakumogu.com, Niigata Prefecture, Japan) section was desalted and placed in surfactant solution added with orange extracts with magnetic agitation at 500 rpm. The casings after treatment time were picked up and placed in the slush salt with lactic acid for another treatment time. The composition of the surfactant solution with orange extracts, slush salt with lactic acid, and treatment time are shown in Table 1.

2.3. Sausage Production

Sausage batter was made of lean pork (4020 g), fat (1720 g), Chinese white wine (718.6 g; ethanol content: 52%, v/v), salt (200 g), sugar (120 g), black pepper (73.9 g), coriander powder (37.6 g), spicy pepper (42.4 g), turmeric powder (16.8 g), and garam masala powder (17.5 g). The meat and fat were sterilely cut into small pieces and mixed well with spices and wine. The mixed batter was filled into the modified casings and desalted untreated natural hog casings (as a control) by using a stuffing machine (STX-4000-TB2-PD-BL, Electric Meat Grinder & Sausage Stuffer, STX International, Lincoln, NE, USA). The sausage sections after stuffing were immediately dried in a sterilized oven at 45 °C for 24 h and aged at 20 °C for another 48 h. Subsequently, the sausage sections were vacuum packaged and stored in a fridge (4 °C) for 16 days for the following post-analysis.

2.4. Hyperspectral Imaging System
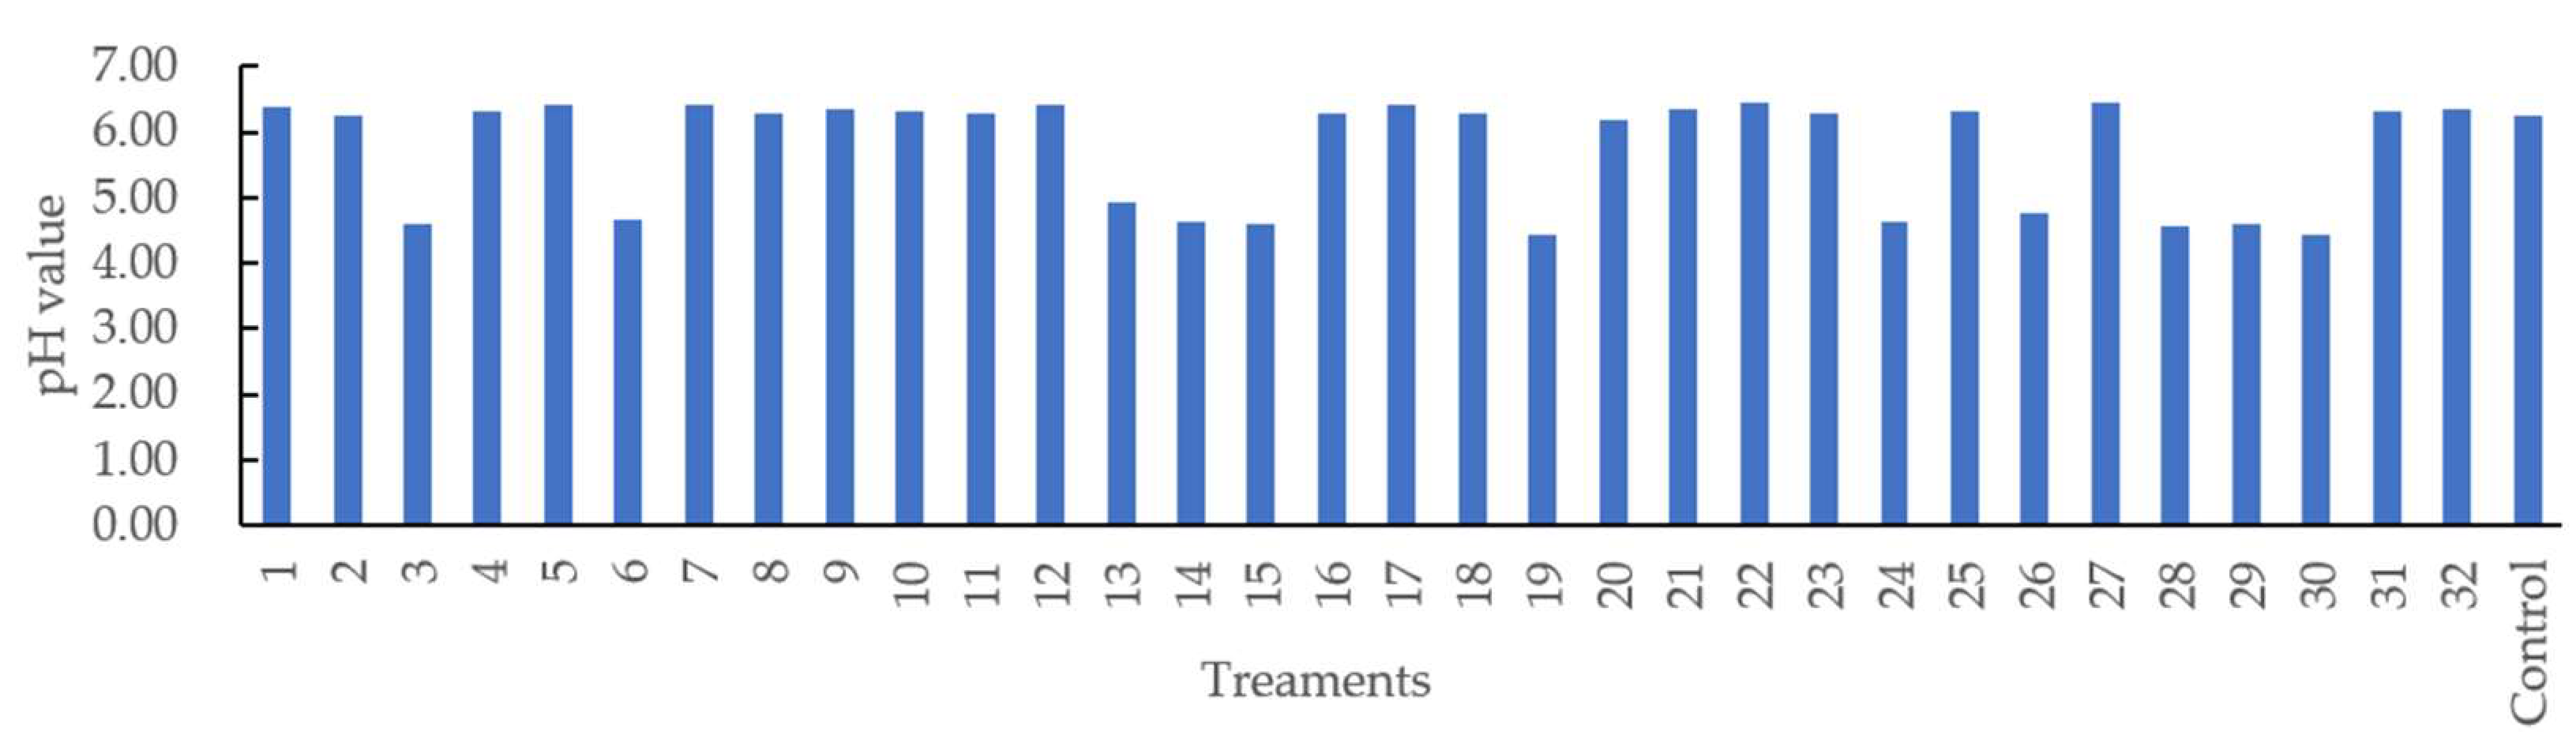
A laboratory visible near-infrared HSI (NH-4-KIT, EBA Japan, Tokyo, Japan) with a spectra range of 350 nm–1100 nm was employed for push-broom line-scanning of the sausage surface. A 10-bit charged coupled device camera was used, and the flame rate was 100 fps with an exposure time of 12.47 ms. The total contiguous spectral bands were 151 with 5 nm intervals. The halogen lamp light source was fixed on three sides of the camera, and the white sheet was used to render the light source to have an even distribution. The HSI system was calibrated by a dark reference (with 0% reflectance) by completely covering the camera lens with its opaque cap and calibrated by a white reference with 100% reflectance before measuring. Imaging acquisition was conducted using a reflectance mode of HSI with a dark room temperature of 20 °C. The corrected images reflectance (Rci) was expressed as the following equation using the software of the imaging system
R ci = R r R d R w R d
where Rr, Rd, and Rw are the reflectance images of raw, dark, and white, respectively. The absorbance profiles were transformed using the following equations:
A = −log R
A black background (low reflectance surface) was used to achieve a good contrast between the sample and the background. Control software (HSAnalyzer, version 1.2, EBA Japan, Tokyo, Japan), supported by a computer, was used to analyze and process the hyperspectral images. The hypercubes were segmented by applying a threshold criterion. In this sense, all pixels having a reflectance higher than 0.075 at band 70 (695 nm) were considered as sausage. Moreover, several spectra from each sample, each sausage was digitally divided into five regions of equal area. The average spectrum of each segment was extracted and merged in a table that also contained the reference pH value and the sample code. The segmentation, the extraction of the spectra as well as the storage of data were developed by an algorithm coded under MATLAB (MathWorks Inc., Natick, MA, USA). This table with both spectra and pH reference values was used to develop the calibration models.

2.5. pH Analysis

Ten grams of sausage slices was homogenized with 90 mL of distilled water for 1 min and measured using a digital pH meter. The method was based on Zdolec et al. (2008) [31].

2.6. Spectral Pretreatment and Model Development

In order to enhance the model performance, the pretreatments of spectra, such as multiplicative scatter correction (MSC), standard normal variate (SNV), normalization, the first and the second derivatives, were conducted before multivariate analysis. Partial least square regression (PLSR), as one of the important regression algorithms, was employed to connect the pH parameter and the spectra of the sausages stuffed with different treated modified casings. Two-thirds of the samples were used for the calibration group, while the left one-third was used for the prediction group.
The predictive ability was estimated by the determination coefficient in calibration (Rc2), prediction (Rp2), cross-validation (Rcv2), the root mean square errors of calibration (RMSEC), prediction (RMSEP), and cross-validation (RMSECV). These parameters were determined as follows:
R 2 = 1 ( y i   y p r e d i c t e d ) 2 ( y i   y m e a n ) 2
RMSE = i = 1 n ( y i   y p r e d i c t e d ) 2 n
where yi is the measured pH of the ith sample, and n is the number of samples. A good PLSR model is commonly believed to have a high R2 with a low RMSE with a small absolute difference between RMSEC and RMSECV.

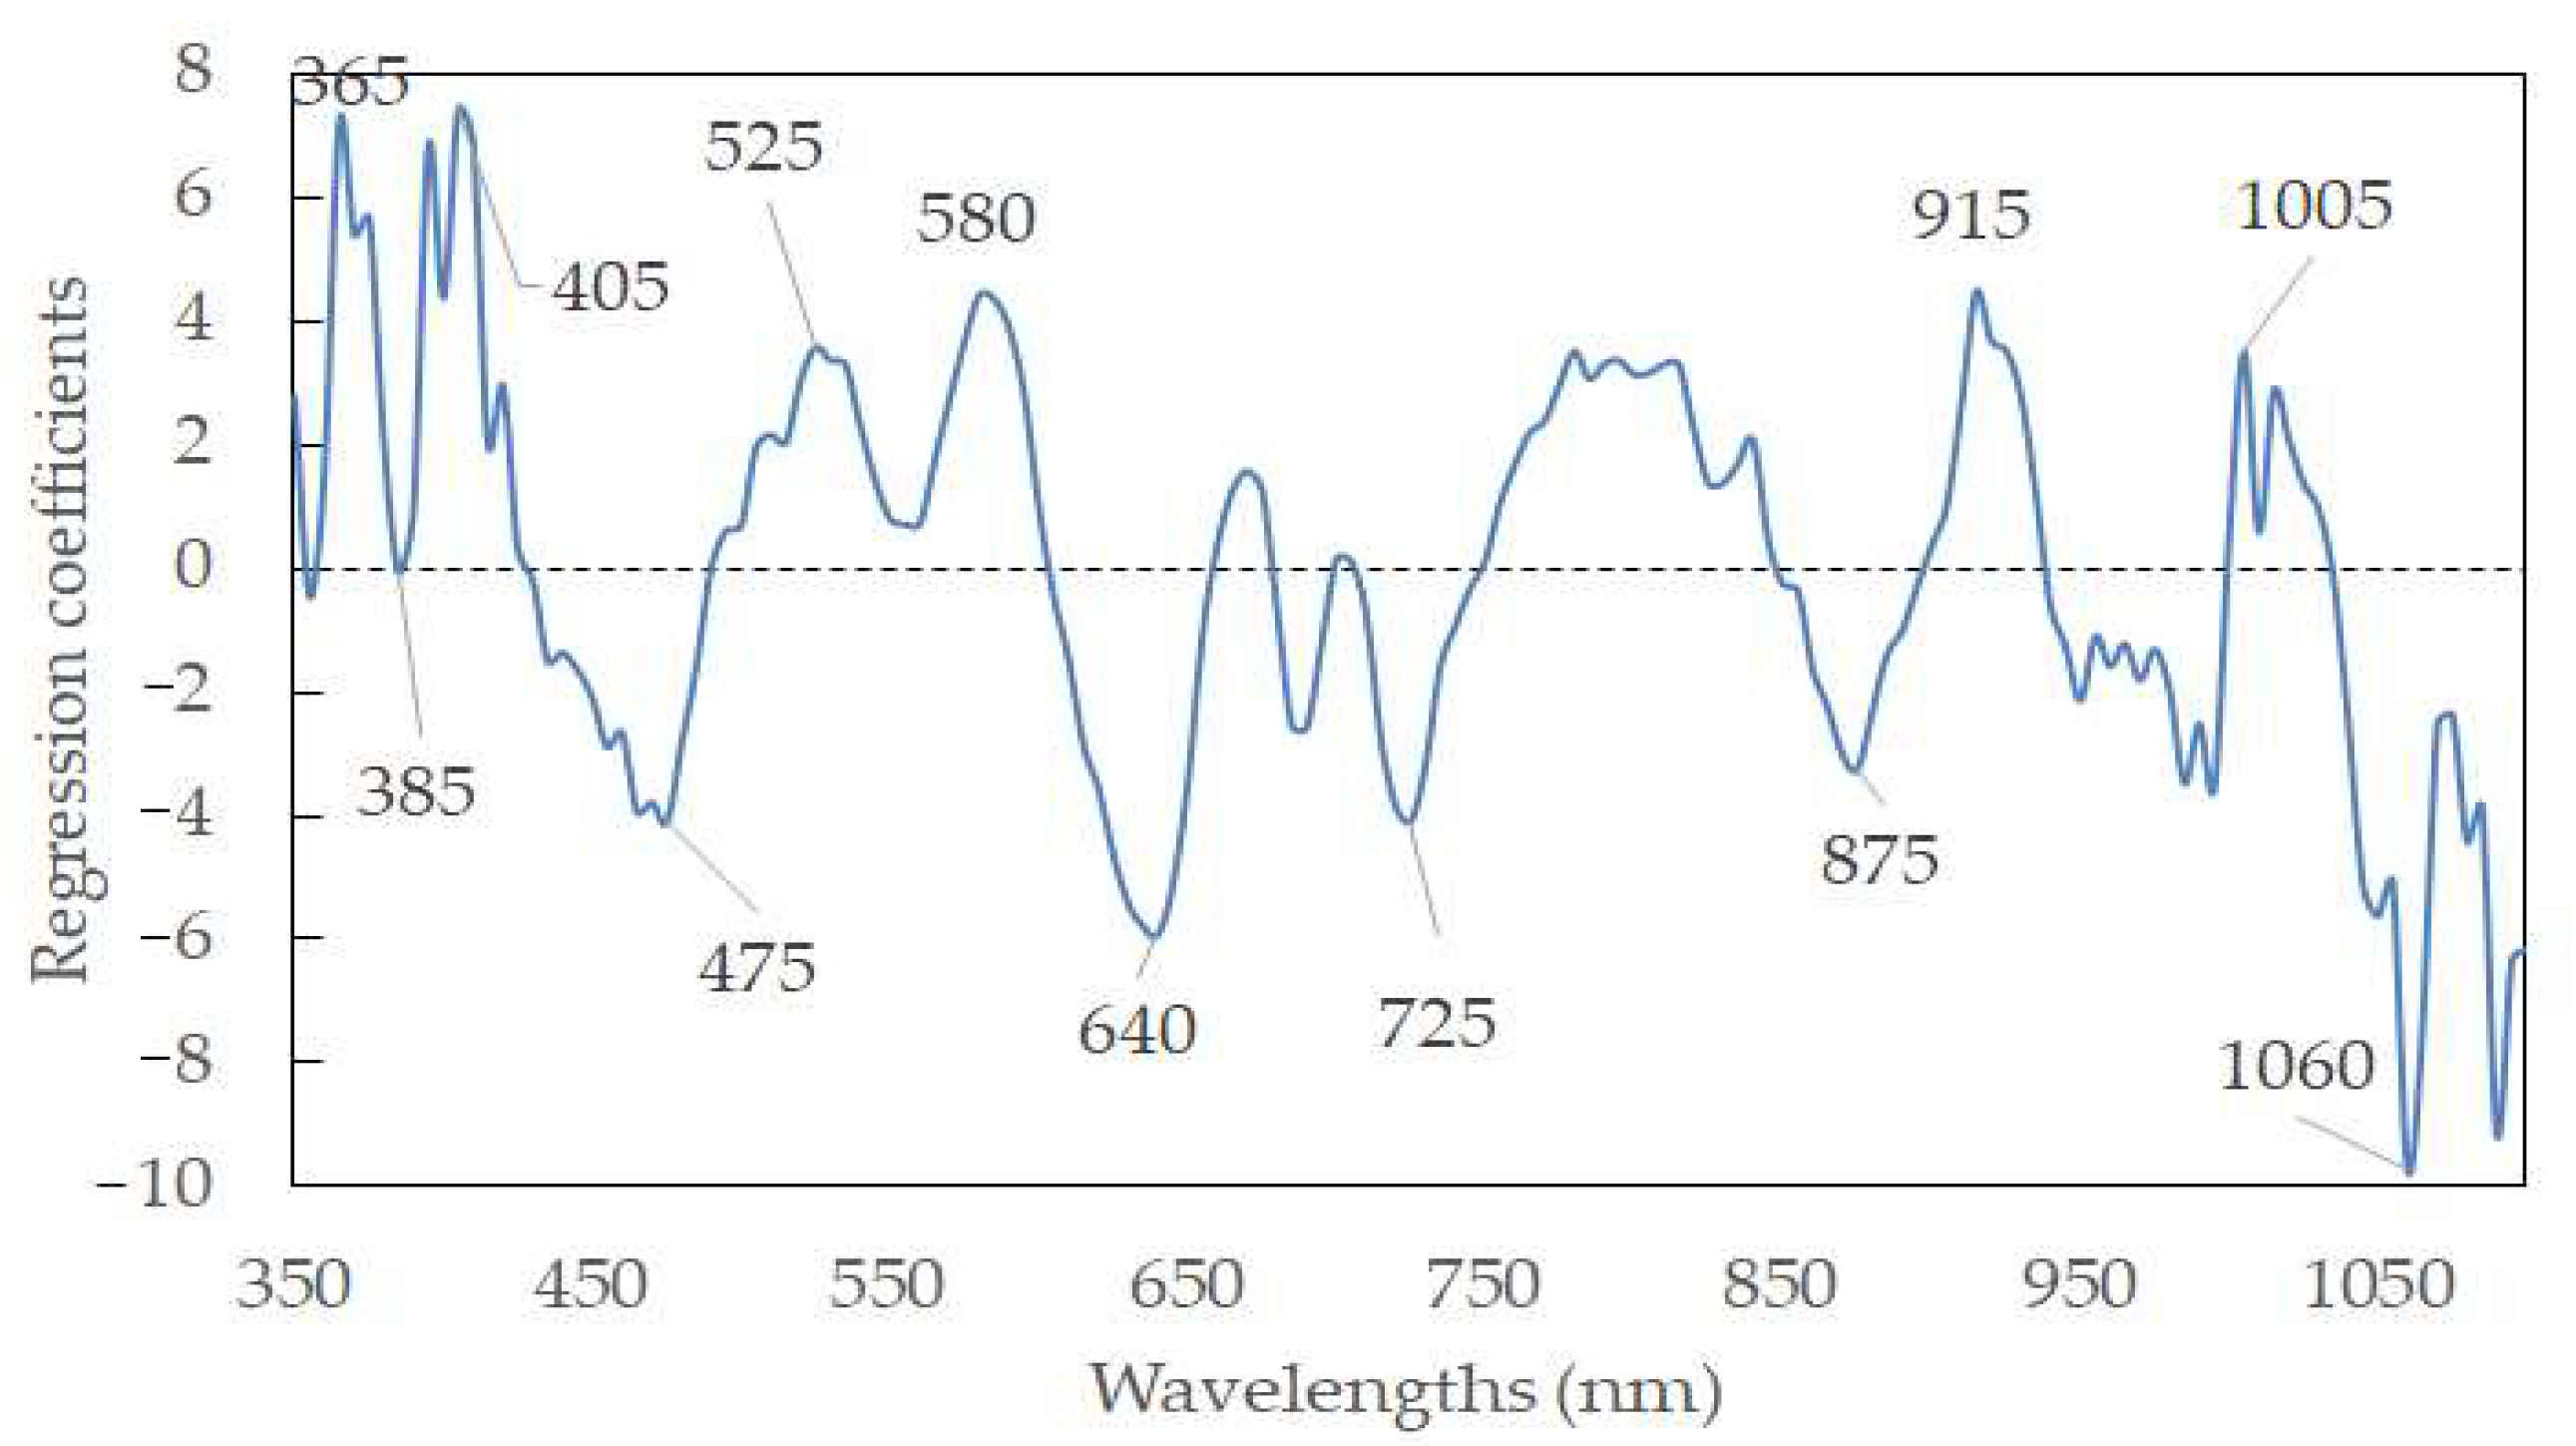
2.7. Feature Wavelengths Selection

The feather wavelengths (FWs) for pH were selected based on the weighted regression coefficient from the developed calibration model, to simplify the full model and reduce noise and redundancy information and so enhance the model accuracy. Wavelengths that contained large regression coefficients (irrespective of the sign) were selected as the FWs, and a new simplified model was created using those FWs. If the predictive performance of the new model is comparable to that with full spectra, it could be of practical use to design a simple cost-effective multispectral system and applicable to commercialization.

2.8. Visualization of pH Distribution

The pH prediction maps for sausages with different modified casings were produced according to calibration models with FWs. As HSI possesses a 3D matrix that contains a large amount of spatial and spectral information, it is required to unfold into a 2D matrix at the FWs. The purpose of this is to render each row standing for the spectrum of a pixel, and the columns represented the selected feather wavelengths. The matrix was then multiplied by the corresponding regression coefficient. In this way, the vector could be refolded back to generate a 2D color image, and consequently, the color heterogeneity of the sausages with a linear color scale (i.e., distribution map) could be shown. All these procedures were computed with MATLAB software (R2017b; MathWorks Inc., Natick, MA, USA). The graphical scheme of the main steps of building the prediction map is illustrated in Figure 1.

3. Results and Discussion

3.1. Spectral Characteristics and Simultaneous Effects on pH Analyzed by RSM

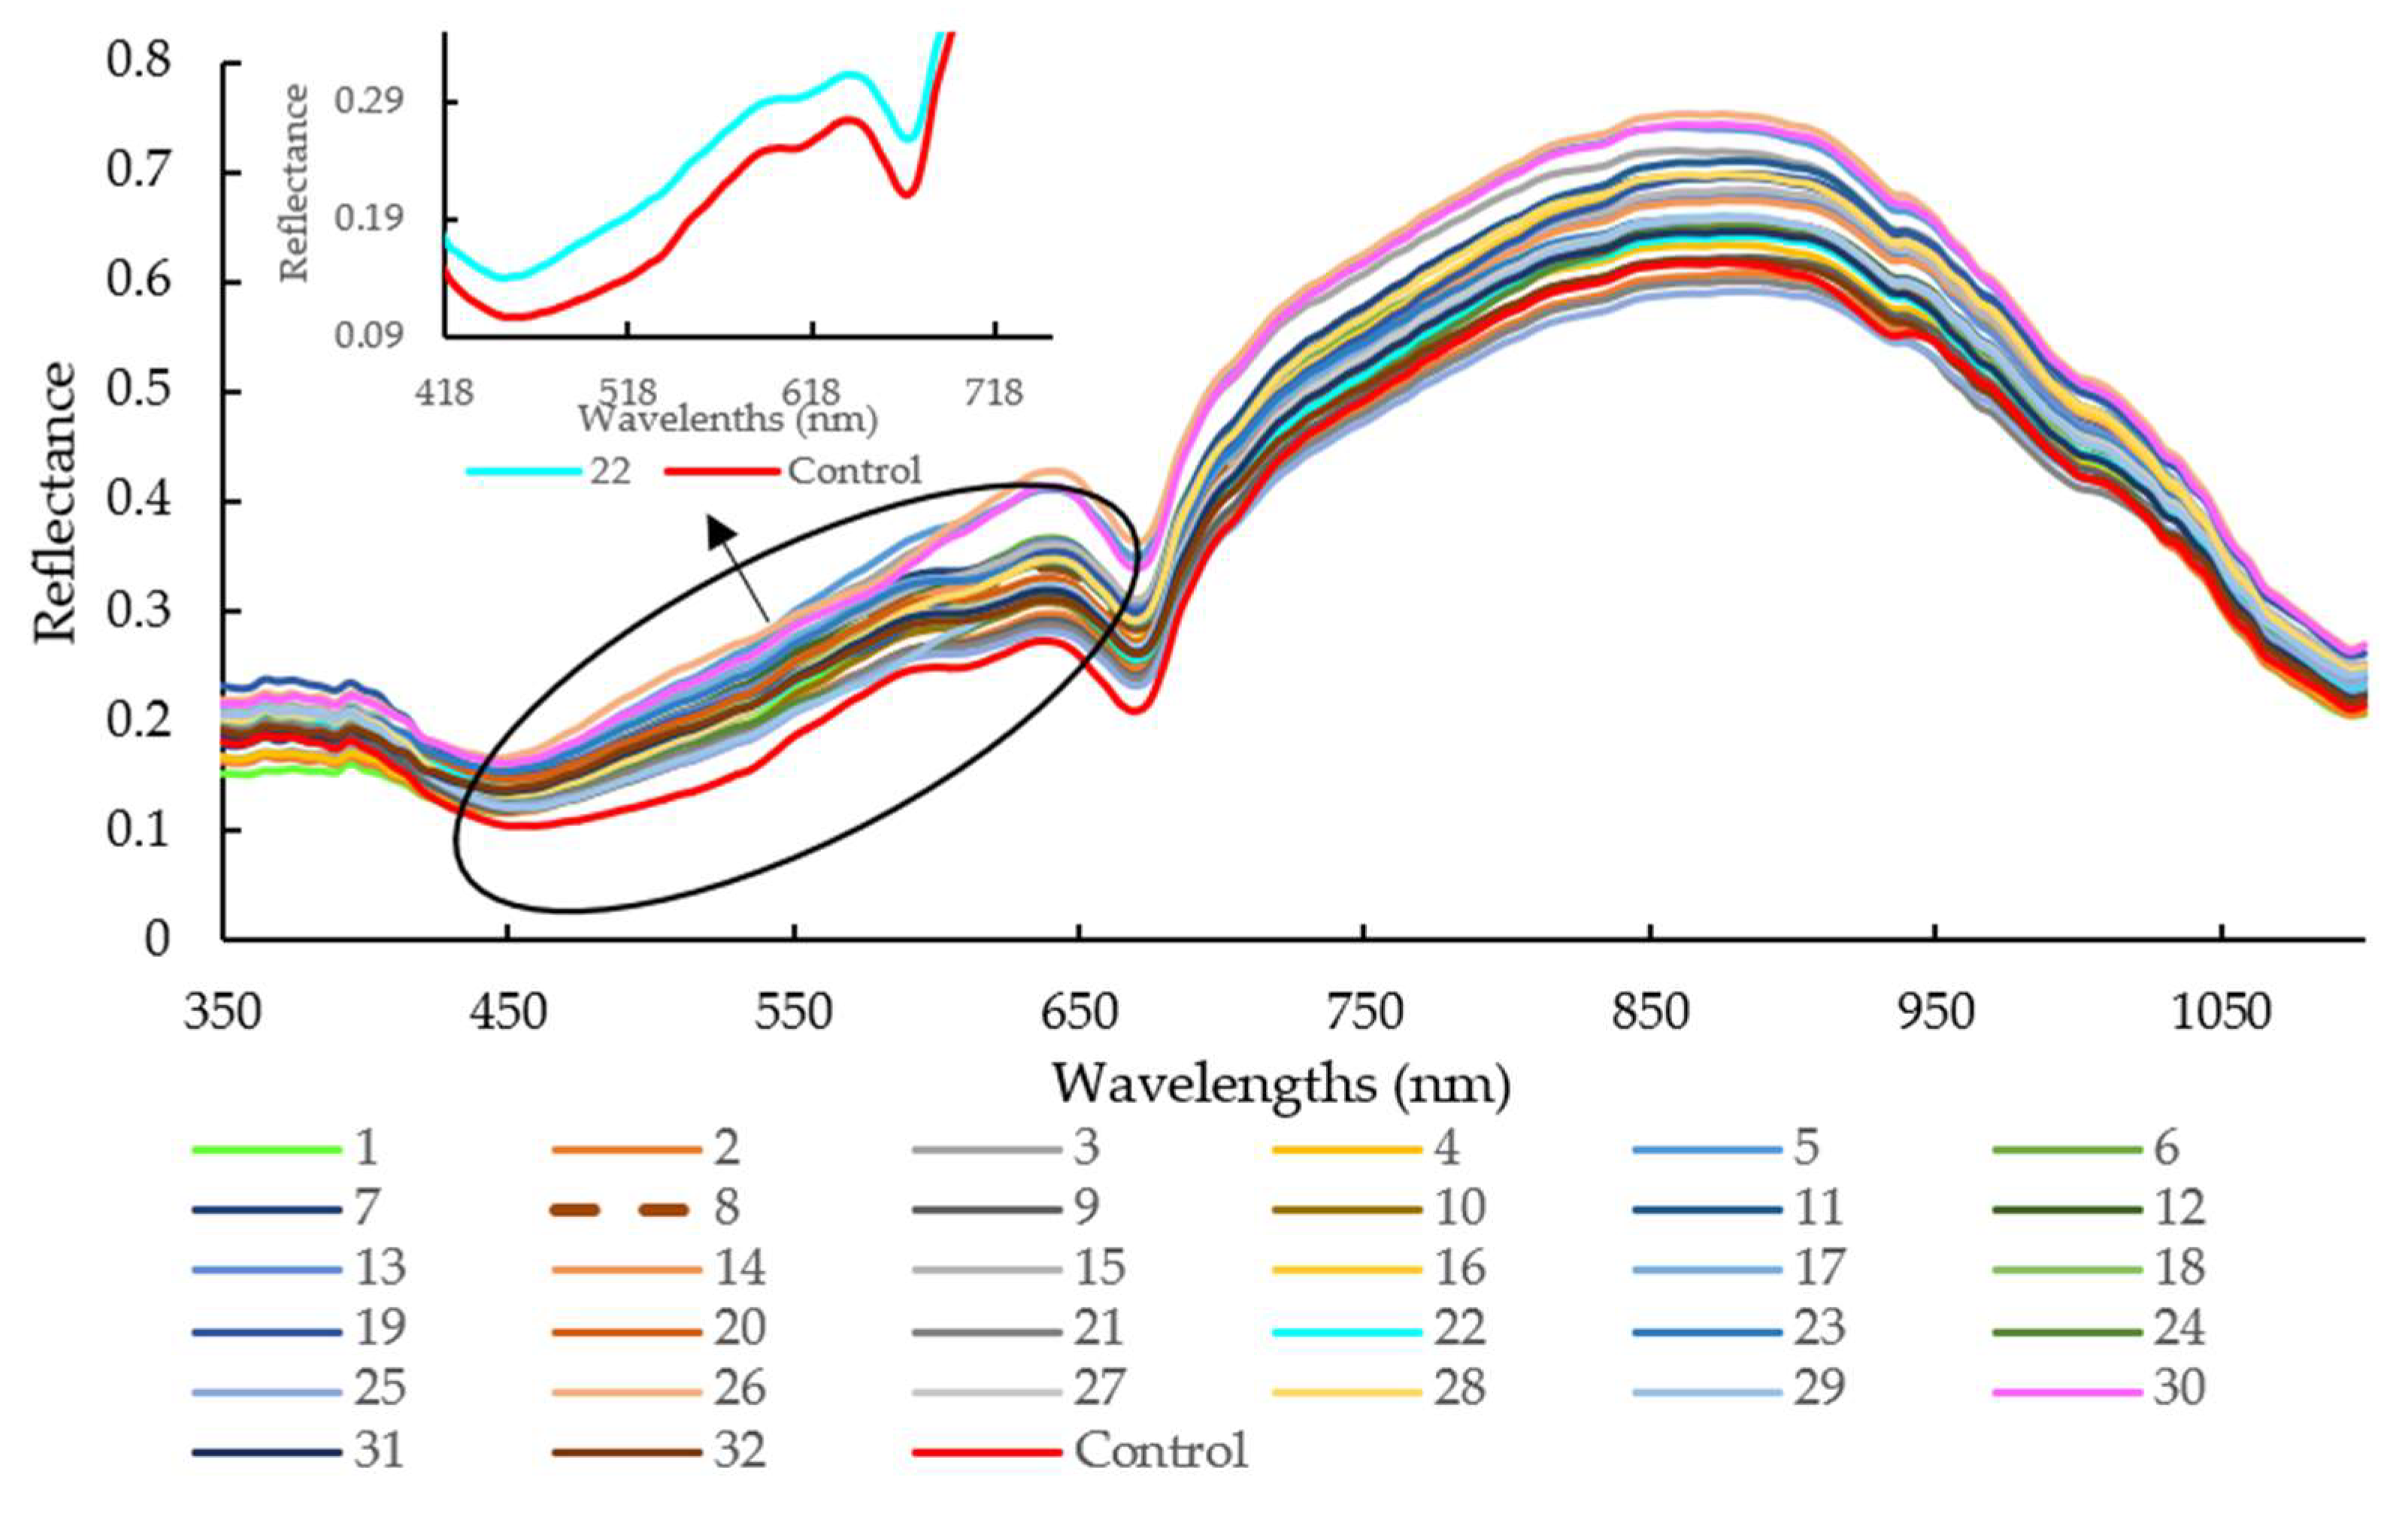
3.1.1. Spectra Overview

As illustrated in Figure 2, the average reflectance of sausages stuffed in the modified casing with Treatment 30 was higher than that with Treatment 25 and the control group, especially for the wavelengths range of 645 nm to 670 nm and 865 nm to 890 nm. The pH values for Treatments 30, 25, and control were 4.44, 6.32, and 6.24, respectively. It is well known that the NIR hyperspectral system recorded the different absorbance patterns according to the interior structural changes or intermolecular forces changes in the meat with different pH levels [32]. It was also reported that oxymyoglobin (MbO2) has a large absorption coefficient at 544 nm and 582 nm, while oxyhemoglobin (HbO2) possesses three absorption bands at 418 nm, 543 nm, and 574 nm, representing soret, α, and β bands [33]. The absorption bands at 780 and 980 nm were related to moisture absorption, corresponding to the third and second overtones of O-H stretching, respectively [34].

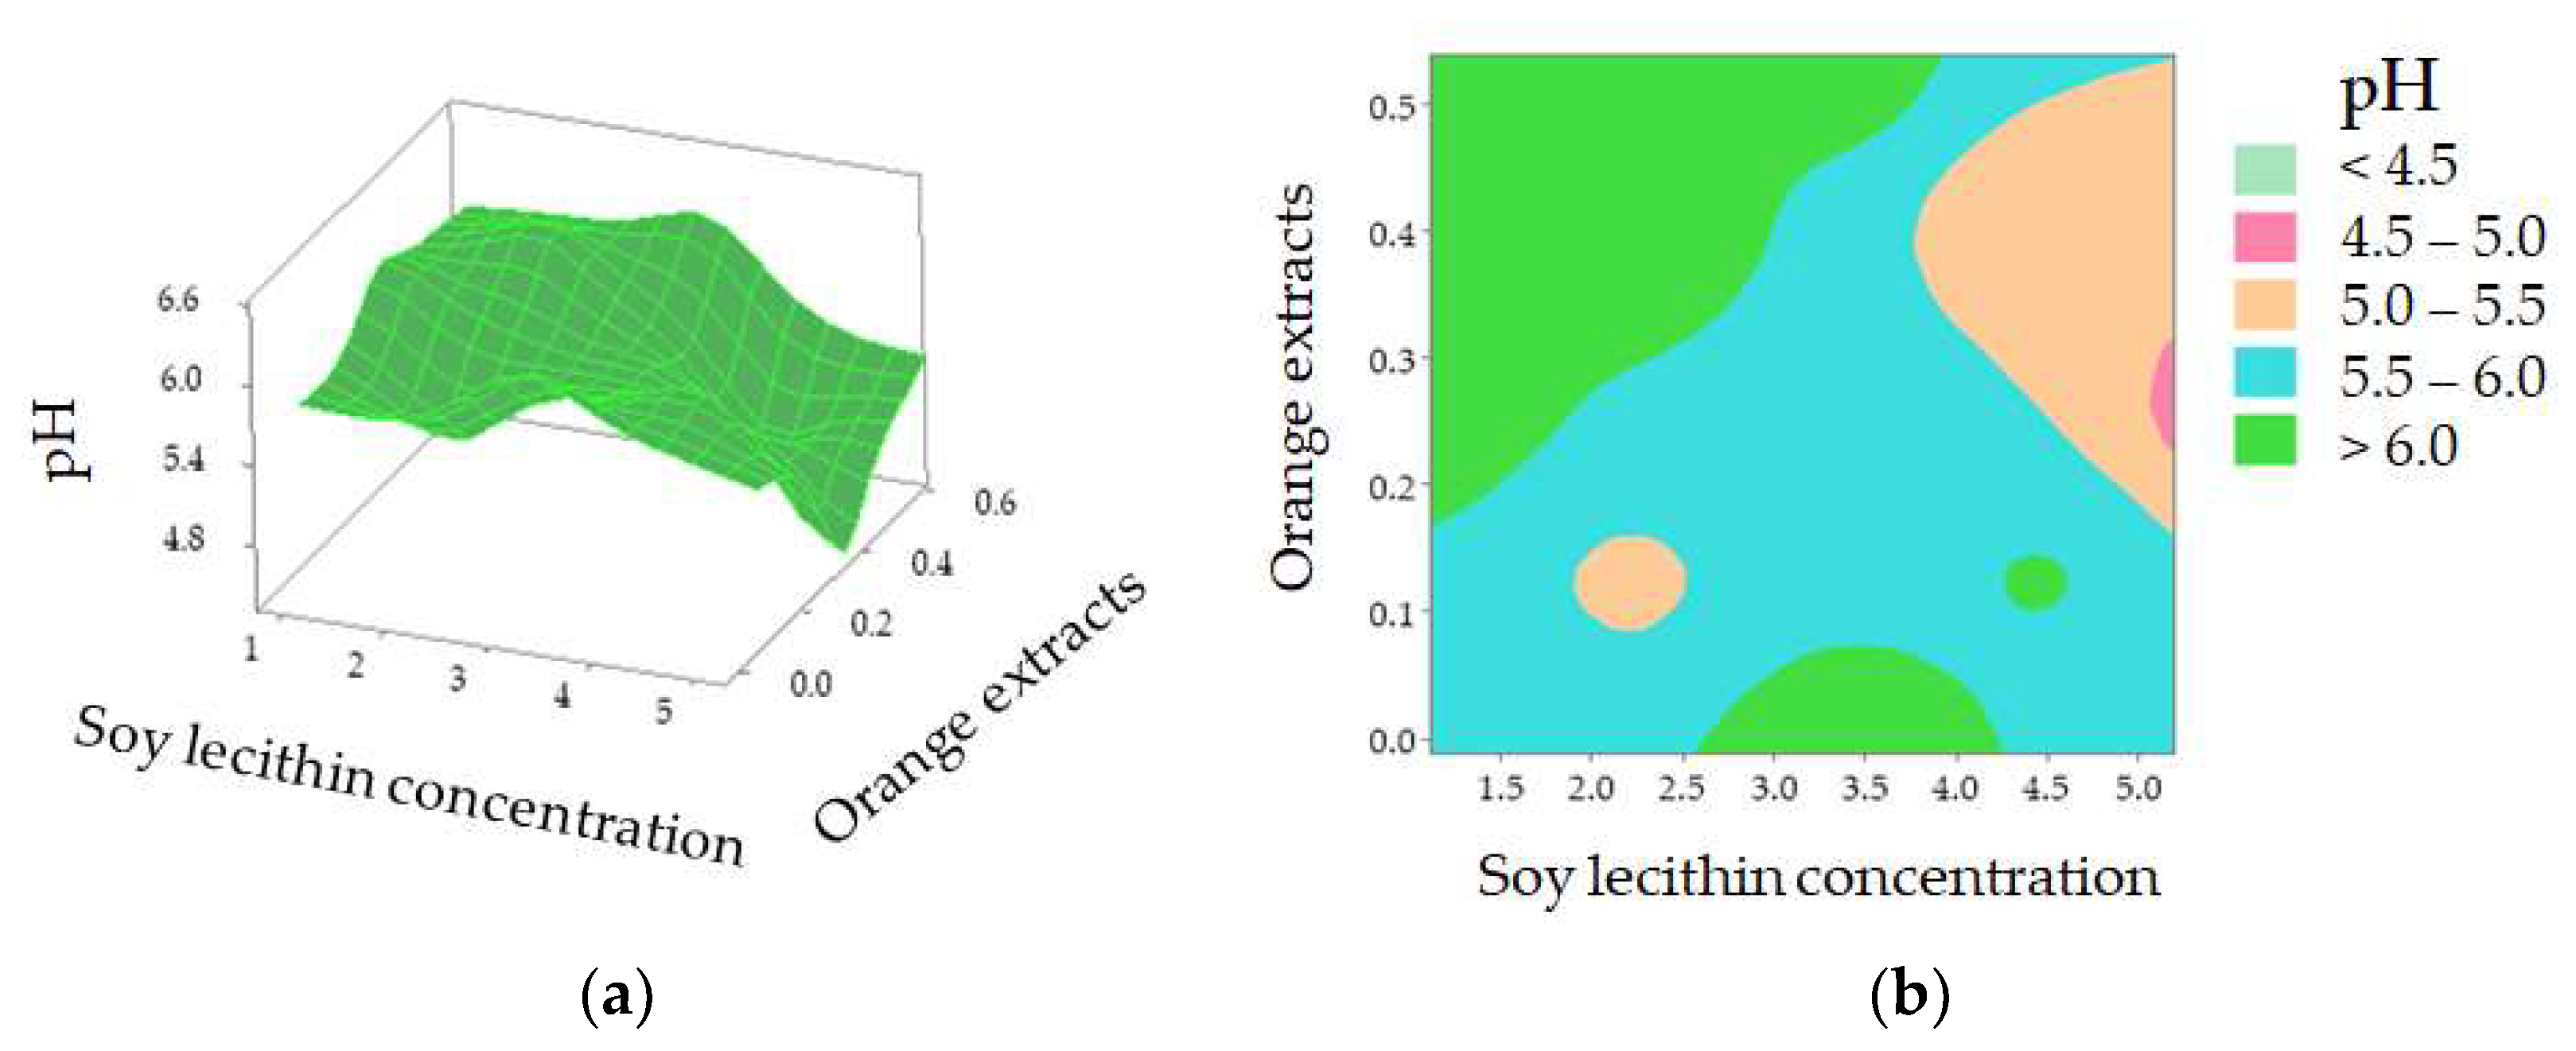
3.1.2. Simultaneous Effects on pH Analyzed by RSM

Figure 3 shows that the pH value varied from 4.44 (Treatments 19 and 30) to 6.46 (Treatment 22). Different casing treatments may have affected pH evaluation during the 16 days of storage under 4 °C. The R2 value of the regression model developed for pH was 67.13% with a nonsignificant lack of fit (p > 0.05). Only soy lecithin and orange extracts (X1 × X3) were observed to have interactively affected the pH of sausage at a 5% significance level (Table 2). The predicted quadratic polynomial regression equation for pH as a function of soy lecithin (X1), soy oil (X2), orange extracts (X3), lactic acid (X4), and treatment time (X5) in the uncoded units are shown as follows:
Y pH = 59.0000 + 1.5200   X 1 9.0700   X 2 8.4000   X 3 3.8400   X 4 0.2520   X 5 0.0520   X 1 2 + 0.4260   X 2 2 + 7.8200   X 3 2 + 0.0635   X 4 2 + 0.0007   X 5 2 + 0.0110   X 1 X 2 3.2700   X 1 X 3 0.0160   X 1 X 4 0.0035   X 1 X 5 + 2.0700   X 2 X 3   + 0.2720   X 2 X 4 + 0.0216   X 2 X 5 + 1.0000   X 3 X 4 0.1109   X 3 X 5 + 0.0086   X 4 X 5
The value of the corresponding coefficient for orange extracts (X3, −8.4000) indicates that it exerts an important impact on casing modification and so influenced sausage pH during the 16-day storage. Further investigation shows that pH decreased when casings were treated with a higher concentration of soy lecithin with orange extracts at approximately 0.26% [Figure 4a]. According to the 2D contour plot [Figure 4b], the pH value is over 6.0 when a lower soy lecithin concentration was combined with higher orange extracts. The increased pH may be explained by the nitrogen compounds generated by proteolysis [35]. Yao et al. reported that protein enzymes, produced by microorganisms, led to the decomposition of meat protein, generating ammonia, biogenic amine, and skatole [33]. The contents of MbO2 and HbO2 were decreased with the decomposition of protein, which indirectly affected the change of spectra at 540 and 582 nm (related to MbO2), and 418, 543, and 574 nm (related to HbO2) in comparison with the control (pH = 6.24) and sample with Treatment 22 (pH = 6.46) (Figure 2). A lower soy lecithin level was reported to render the casings to be more porous [1]. Orange extracts were reported to possess certain contents of hesperidin [9,17,36,37,38], which has a potent antioxidant effect and is an anti-microorganism.

3.2. Calibration Models with Full Wavelengths

The PLSR model was employed to predict the pH values of the sausages using different modified casings from both reflectance and absorbance spectral data over the full spectral range of 350–1100 nm. Using the reflectance spectra, the Rp2 value of data pretreated by normalization shows some improvement to 0.6855 when compared with the raw data of 0.6485, with a small decrease in RMSEP (Table 3). It is reported that normalization can improve the spectral features, making the spectra have an equal area under the curve to allow for easy comparison of spectral features in the same plot [39]. Proper normalization of hyperspectral spectra data enables a better signal-to-noise ratio, compared to the conventional spectrophotometer method [40] A-PLSR model derived from the spectra preprocessed by the first derivative presented the highest Rc2 of 0.7300, the lowest RMSEC of 0.4283%, and Rp2 of 0.6789 and RMSEP of 0.4501% (Table 3), with a low absolute difference between RMSEC and RMSECV, compared with raw and other pretreatments. The function of first derivatives is to remove background noise and baseline drift, as well as to improve small spectral features [41]. Regarding a similar study, the Rp2 values for predicting pH in salted meat [42], freeze–thawed pork [43], fresh pork [44], and large Japanese sausages [19] were 0.797, 0.845, 0.55, and 0.882, respectively. The comparable low Rp2 in the current study may be due to the factor where the pH value was only concentrated either near 4.66 or 6.32 (Figure 3), leading to a narrow pH distribution for analysis.

3.3. Calibration Models with Selected Feature Wavelengths

Hyperspectral data display a high degree of interband correction with high dimensions. It is thus meaningful to select feature wavelengths to represent the full wavelengths. In this way, the model can be simplified, and data redundancy can be eliminated. Furthermore, the algorithms’ efficacies can be enhanced, accelerating the classification of sausages based on the pH for industrial machine-vision systems. According to the weighted regression coefficients from the PLSR model (Figure 5), the feature wavelengths were selected based on the peaks and valleys (i.e., indicating the important information and large contribution to the productivity of the model) in the wavelengths. To this end, twelve wavelengths (365, 385, 405, 475, 525, 580, 640, 725, 875, 915, 1005, and 1060 nm) were selected as the feature wavelengths. Table 4 elaborates on the predictive ability of the simplified model, with an Rp2 of 0.6896 and an RMSEP of 0.4426%, using data pretreated by normalization. A new PLSR with those feature wavelengths was established as follows:
Y’pH = 5.335 + 7.243λ365 − 0.060λ385 + 7.461λ405 − 4.098λ475 + 3.594λ525 + 4.443λ580 − 5.920λ640 − 4.083λ725 − 3.246λ875 + 4.495λ915 + 3.520λ1005 − 9.730λ1060
where λxnm is the reflectance spectra at the wavelength of x nm, and Y’pH is the predicted pH value. Generally, the R2 values of prediction in the reduced model were comparable to that of the model using full wavelengths, and approximately 92% of wavelengths were reduced from the full wavelengths. There were even some cases where the prediction accuracy of the model using the feature wavelengths was higher than that using the full wavelengths (e.g., Rp = 0.6835 for A-1st Derivative-PLSR using feature wavelength vs. Rp = 0.6789 for A-1st Derivative-PLSR using full wavelength). This may be elucidated by removing the noise and pixel outliers, resulting in the improvement of robustness and reliability of the PLSR model [44,45,46,47]. It was mentioned that the R2 value between 0.66 and 0.81 is allowed for approximate prediction, an R2 value between 0.82 and 0.90 is regarded as a good prediction, while an R2 higher than 0.91 is demonstrated to be an excellent prediction [48]. The selected feature wavelengths were applied to creating prediction maps in the following step.

3.4. Visual Representation of Sausage pH Distribution

As the main advantage of hyperspectral imaging technology, a prediction map (or distribution map) can illustrate where and how many different reference parameters (pH in the current study) are located from spot to spot in different detected samples. Figure 6 elaborates how pH changes in response to the different treated modified casings used for the sausages stored on Day 16. Four samples, the sample with the highest pH value (treatment 22, pH = 6.46), middle pH (Treatment 20, pH = 6.17), lowest pH (Treatment 30, pH = 4.44), and control group, were selected for representation. It is difficult to distinguish the differences in the RGB images with the naked eyes (Figure 6). Nevertheless, the prediction maps clearly show how much different pH values were located from pixel to pixel, which is superior to the conventional pH measurement, which is time-consuming and difficult to obtain the data like this. It is meaningful to monitor and understand the spatial change, which could provide useful information on how intrinsic properties such as the composition and biochemical attributes of samples react to different modified casings. To this point, it could serve as a good reference before those types of modified casings are commercially utilized.

4. Conclusions

The present study investigated the feasibility of employing HSI for rapidly and nondestructively predicting pH values in sausages stuffed in modified casings added with orange extracts from waste orange peels. RSM was used to explain the relationship between different modified factors and sausage pH. The R2 value of the polynomial regression model was 67.13% with a nonsignificant lack of fit (p > 0.05). When using full wavelengths, the A-PLSR model derived from the spectra preprocessed by the first derivative presented the highest Rc2 of 0.7300, while R-PLSR derived from normalization achieved the highest Rp2 of 0.6855. Twelve feature wavelengths (365, 385, 405, 475, 525, 580, 640, 725, 875, 915, 1005, and 1060 nm) were selected to develop a simplified model. This reduced model achieved a comparable R2 value in comparison with that using full wavelengths, which means it can be applied to a simple, cost-effective, multispectral system establishment or for online industrial applications. For the first time, the prediction map developed in this study clearly displayed sausage pH evolution according to different modified casings.

Author Contributions

Conceptualization, C.-H.F.; methodology, C.-H.F., and F.J.R.-P.; software, C.-H.F. and F.J.R.-P.; validation, C.-H.F. and F.J.R.-P.; formal analysis, C.-H.F. and F.J.R.-P.; investigation, C.-H.F., H.A., and F.J.R.-P.; resources, C.-H.F.; data curation, C.-H.F. and F.J.R.-P.; writing—original draft preparation, C.-H.F., H.A., and F.J.R.-P.; writing—review and editing, C.-H.F., H.A., and F.J.R.-P.; visualization, C.-H.F. and F.J.R.-P.; supervision, H.A.; project administration, C.-H.F. and H.A.; funding acquisition, C.-H.F. and H.A. All authors have read and agreed to the published version of the manuscript.

Funding

This research was funded by the FY 2022 Sasakawa Scientific Research Grant from the Japan Science Society (No. 2022-3005), FY 2022 Mishima Kaiun Memorial Foundation (A-241), FY 2022 President’s Discretionary Grants, funded by the Kitami Institute of Technology, and FY 2022 Grants-in-Aid for the Regional R&D Proposal-Based Program from Northern Advancement Center for Science & Technology of Hokkaido Japan (T-2-4).

Institutional Review Board Statement

Not applicable.

Informed Consent Statement

Not applicable.

Data Availability Statement

Data are contained within this article.

Acknowledgments

The authors would also like to thank the anonymous reviewers for their constructive comments. Chao-Hui Feng appreciates the financial support from the Leading Initiative for Excellent Young Researchers (LEADER) from the Government of Japan Ministry of Education, Culture, Sports, Science and Technology (MEXT) (2020L0277), the Japan Society for the Promotion of Science Grant-in-Aid for Early Career Scientists (20K15477), FY 2021 President’s Discretionary Grants, funded by the Kitami Institute of Technology, and the Special Postdoctoral Researcher Program funded by Riken.

Conflicts of Interest

The authors declare no conflict of interest.

References

  1. Feng, C.H.; Drummond, L.; Sun, D.W.; Zhang, Z.-H. Evaluation of natural hog casings modified by surfactant solutions combined with lactic acid by response surface methodology. LWT Food Sci. Technol. 2014, 58, 427–438. [Google Scholar] [CrossRef]
  2. Ishiwata, L.; Feng, L.; Yian, N.; Yoshida, I.R.; Palihakkara, I.R.; Silva, N.D.; Tanaka, H.; Nga, N.T. Reduction of waste from beverage industry in Shizuoka prefecture. Available online: http://www.iai.ga.a.u-tokyo.ac.jp/mizo/lecture/noukoku-1/group-work/2012/G2_e.pdf (accessed on 12 July 2022).
  3. Japanese Cabinet Approves Bill to Amend Food Recycling Law. Available online: https://www.japanfs.org/en/news/archives/news_id026664.html (accessed on 12 July 2022).
  4. Ahmadi, A.; Shadboorestan, A. Oxidative stress and cancer; the role of hesperidin, a citrus natural bioflavonoid, as a cancer chemoprotective agent. Nutr. Cancer 2016, 68, 29–39. [Google Scholar] [CrossRef] [PubMed]
  5. Feng, C.H.; Otani, C.; García-Martín, J.F. Flavonoids as a starting point for therapeutics against COVID-19: Current state-of-the art research advances. In The Book of Flavonoids, 1st ed.; Feng, C.-H., García Martín, J.F., Eds.; Nova Science Publishers Inc.: New York, NY, USA, 2021; Chapter 12; pp. 340–350. [Google Scholar]
  6. Zhao, Z.-Y.; Li, P.-J.; Xie, R.-S.; Cao, R.-S.; Su, D.-L.; Shan, Y. Biosynthesis of silver nanoparticle composites based on hesperidin and pectin and their synergistic antibacterial mechanism. Int. J. Biol. Macromol. 2022, 214, 220–229. [Google Scholar] [CrossRef] [PubMed]
  7. Zhou, P.; Zheng, M.; Li, X.Z.; Zhou, J.; Shang, Y.-X.; Li, Z.S.; Qu, L.M. A consecutive extraction of pectin and hesperidin from Citrus aurantium L.: Process optimization, extract mechanism, characterization and bioactivity analysis. Ind. Crops Prod. 2022, 182, 114849. [Google Scholar] [CrossRef]
  8. Bellavite, P.; Donzelli, A. Hesperidin and SARS-CoV-2: New light on the healthy function of citrus fruits. Antioxidants 2020, 9, 742. [Google Scholar] [CrossRef]
  9. Feng, C.-H.; Otani, C.; Ogawa, Y. Innovatively identifying naringin and hesperidin by using terahertz spectroscopy and evaluating flavonoids extracts from waste orange peels by coupling with multivariate analysis. Food Control. 2022, 137, 108897. [Google Scholar] [CrossRef]
  10. Fernández-López, J.; Viuda-Martos, M.; Sendra, E.; Sayas-Barberá, E.; Navarro, C.; Pérez-Alvarez, J. Orange fibre as potential functional ingredient for dry-cured sausages. Eur. Food Res. Technol. 2007, 226, 1–6. [Google Scholar] [CrossRef]
  11. Fernández-Ginés, J.M.; Fernández-López, J.; Sayas-Barberá, E.; Sendra, E.; Pérez-Alvarez, J.A. Effect of storage conditions on quality characteristics of bologna sausages made with citrus fiber. J. Food Sci. 2003, 68, 710–715. [Google Scholar] [CrossRef]
  12. Sirichan, T.; Kijpatanasilp, I.; Asadatorn, N.; Assatarakul, K. Optimization of ultrasound extraction of functional compound from making seed by response surface methodology and antimicrobial activity of optimized extract with its application in orange juice. Ultrason. Sonochem. 2022, 83, 105916. [Google Scholar] [CrossRef]
  13. Yan, Y.; Zhao, X.; Wang, C.; Fang, Q.; Zhong, L.; Wei, Q. Preparation, optimization, and characterization of inclusion complexes of Cinnamomum longepaniculatum essential oil in β-cyclodextrin. Sustainability 2022, 14, 9513. [Google Scholar] [CrossRef]
  14. Mohammad, N.A.; Zaidel, D.N.A.; Muhamad, I.I.; Hamid, M.A.; Yaakob, H.; Jusoh, Y.M.M. Optimization of the amtopxodamt-rich xanthone extract from mangosteen (Garcinia mangostana L.) pericarp via microwave-assisted extraction. Heliyon 2019, 5, e02571. [Google Scholar] [CrossRef] [PubMed]
  15. Feng, C.H.; Sun, D.W. Optimisation of immersion vacuum cooling operation and quality of Irish cooked sausages by using response surface methodology. Int. J. Food Sci. Technol. 2014, 49, 1850–1858. [Google Scholar] [CrossRef]
  16. Fan, T.; Hu, J.G.; Fu, L.D.; Zhang, L.J. Optimization of enzymolysis-ultrasonic assisted extraction of polysaccharides from Momordica charabtia L. by response surface methodology. Carbohydr. Polym. 2015, 115, 701–706. [Google Scholar] [CrossRef] [PubMed]
  17. Feng, C.H. Optimizing procedures of ultrasound-assisted extraction of waste orange peels by response surface methodology. Molecules 2022, 27, 2268. [Google Scholar] [CrossRef] [PubMed]
  18. Schmidt, M.M.; Dornelles, R.C.P.; Vidal, A.R.; Fontoura, A.; Kubota, E.H.; Mello, R.O.; Kempka, A.P.; Deminate, I.M. Development of cooked and smoked chicken sausage with reduced sodium and fat. J. Appl. Poult. Res. 2017, 26, 130–144. [Google Scholar] [CrossRef]
  19. Rubio, B.; Possas, A.; Rincon, F.; Garcia-Gimeno, R.M.; Martinez, B. Model for Listeria monocytogenes inactivation by high hydrostatic pressure processing in Spanish chorizo sausage. Food Microbiol. 2018, 69, 18–24. [Google Scholar] [CrossRef]
  20. Ramezani, H.; Hosseini, H.; Kamankesh, M.; Ghasemzadeh-Mohammadi, V.; Mohammadi, A. Rapid determination of nitrosamines in sausage and salami using microwave-assisted extraction and dispersive liquid-liquid microextraction followed by gas chromatography-mass spectrometry. Eur. Food Res. Technol. 2015, 240, 441–450. [Google Scholar] [CrossRef]
  21. Feng, C.H.; Makino, Y.; Yoshimura, M.; Thuyet, D.C.; García-Martín, J.F. Hyperspectral imaging in tandem with R statistics and image processing for detection and visualisation of pH in Japanese big sausages under different storage conditions. J. Food Sci. 2018, 83, 358–366. [Google Scholar] [CrossRef]
  22. Wang, Q.; He, Y. Rapid and nondestructive classification of Cantonese sausage degree using hyperspectral images. Appl. Sci. 2019, 9, 822. [Google Scholar] [CrossRef]
  23. Shi, J.Y.; Zhang, F.; Wu, S.B.; Guo, Z.M.; Huang, X.W.; Hu, X.T.; Holmes, M.; Zou, X.B. Noise-free microbial colony counting method based on hyperspectral features of agar plates. Food Chem. 2019, 274, 925–932. [Google Scholar] [CrossRef]
  24. Kamrruzzaman, M.; Kalita, D.; Ahmed, M.T.; ElMasry, G.; Makino, Y. Effect of variable selection algorithms on model performance for predicting moisture content in biological materials using spectral data. Anal. Chim. Acta 2022, 1202, 339390. [Google Scholar] [CrossRef]
  25. Siripatrawan, U.; Makino, Y. Simultaneous assessment of various quality attributes and shelf life of packaged bratwurst using hyperspectral imaging. Meat Sci. 2018, 146, 26–33. [Google Scholar] [CrossRef] [PubMed]
  26. Jiang, H.Z.; Yoon, S.-C.; Zhuang, H.; Wang, W.; Li, Y.F.; Lu, C.J.; Li, N. Non-destructive assessment of final color and pH attributes of broiler breast fillets using visible and near-infrared hyperspectral imaging: A preliminary study. Infrared Phys. Technol. 2018, 92, 309–317. [Google Scholar] [CrossRef]
  27. Feng, C.H.; Makino, Y.; Yoshimura, M.; Rodríguez-Pulido, F.J. Real-time prediction of pre-cooked Japanese sausages color with different storage days using hyperspectral imaging. J. Sci. Food Agric. 2018, 98, 2564–2572. [Google Scholar] [CrossRef] [PubMed]
  28. Feng, C.H.; Makino, Y. Colour analysis in sausages stuffed in modified casings with different storage days using hyperspectral imaging—A feasibility study. Food Control. 2020, 111, 107047. [Google Scholar] [CrossRef]
  29. Feng, C.H.; Makino, Y.; García-Martín, J.F. Hyperspectral imaging coupled with multivariate analysis and image processing for detection and visualisation of colour in cooked sausages stuffed with different modified casings. Foods 2020, 9, 1089. [Google Scholar] [CrossRef]
  30. Feng, C.H.; Makino, Y.; Yoshimura, M.; Rodríguez-Pulido, F.J. Estimation of adenosine triphosphate content in ready-to-eat sausages with different storage days, using hyperspectral imaging coupled with R statistics. Food Chem. 2018, 264, 419–426. [Google Scholar] [CrossRef]
  31. Zdolec, N.; Hadžiosmanović, M.; Kozačinski, L.; Cvrtila, Ž.; Filipović, I.; Škrivanko, M.; Leskovar, K. Microbial and physicochemical succession in fermented sausages produced with bacteriocinogenic culture of Lactobacillus sakei and semi-purified bacteriocin mesenterocin Y. Meat Sci. 2008, 80, 480–487. [Google Scholar] [CrossRef]
  32. Iqbal, A.; Sun, D.-W.; Allen, P. Prediction of moisture, colour and pH in cooked, pre-sliced turkey hams by NIR hyperspectral imaging system. J. Food Eng. 2013, 117, 42–51. [Google Scholar] [CrossRef]
  33. Yao, X.L.; Cai, F.H.; Zhu, P.Y.; Fang, H.X.; Li, J.W.; He, S.L. Non-invasive and rapid pH monitoring for meat quality assessment using a low-cost portable hyperspectral scanner. Meat Sci. 2019, 152, 73–80. [Google Scholar] [CrossRef]
  34. Kamruzzaman, M.; Makino, Y.; Oshita, S. Parsimonious model development for real-time monitoring of moisture in red meat using hyperspectral imaging. Food Chem. 2016, 196, 1084–1091. [Google Scholar] [CrossRef]
  35. Feng, C.H.; Sun, D.W.; García-Martín, J.F.; Zhang, Z.-H. Effects of different cooling methods on shelf-life of cooked jumbo plain sausages. LWT Food Sci. Technol. 2014, 58, 427–438. [Google Scholar] [CrossRef]
  36. Jokić, S.; Molnar, M.; Cikoš, A.-M.; Jakovljević, M.; Šafranko, S.; Jerković, I. Separation of selected bioactive compounds from orange peel using the sequence of supercritical CO2 extraction and ultrasound solvent extraction: Optimization of limonene and hesperidin content. Sep. Sci. Technol. 2020, 55, 2799–2811. [Google Scholar] [CrossRef]
  37. Feng, C.H.; García-Martín, J.F.; Lavado, M.B.; López-Barrera, M.C.; Álvarez-Mateos, P. Evaluation of different solvents on flavonoids extraction efficiency from sweet oranges and ripe and immature Seville oranges. Int. J. Food Sci. 2020, 55, 3123–3134. [Google Scholar] [CrossRef]
  38. Pereira, R.M.S.; López, B.G.-C.; Diniz, S.N.; Antunes, A.A.; Garcia, D.M.; Oliveira, C.R.; Marcucci, M.C. Quantification of flavonoids in brazilian orange peels and industrial orange juice processing wastes. Agric. Sci. 2017, 8, 14. [Google Scholar] [CrossRef]
  39. Skjelvareid, M.H.; Heia, K.; Olsen, S.H.; Stormo, S.K. Detection of blood in fish muscle by constrained spectral unmixing of hyperspectral images. J. Food Eng. 2017, 212, 252–261. [Google Scholar] [CrossRef]
  40. Darnay, L.; Králik, F.; Oros, G.; Koncz, Á.; Firtha, F. Monitoring the effect of transglutaminase in semi-hard cheese during ripening by hyperspectral imaging. J. Food Eng. 2017, 196, 123–129. [Google Scholar] [CrossRef]
  41. Shen, F.; Yang, D.; Ying, Y.; Li, B.; Zheng, Y.; Jiang, T. Discrimination between Shaoxing wines and other Chinese rice wines by near-infrared spectroscopy and chemometrics. Food Bioprocess Technol. 2012, 5, 786–795. [Google Scholar] [CrossRef]
  42. Liu, D.; Pu, H.B.; Sun, D.-W.; Wang, L.; Zeng, X.-A. Combination of spectra and texture data of hyperspectral imaging for prediction of pH in salted meat. Food Chem. 2014, 160, 330–337. [Google Scholar] [CrossRef]
  43. Pu, H.B.; Sun, D.-W.; Ma, J.; Liu, D.; Cheng, J.-H. Using wavelet textural features of visible and near infrared hyperspectral image to differentiate between fresh and frozen-thawed pork. Food Bioprocess Technol. 2014, 7, 3088–3099. [Google Scholar] [CrossRef]
  44. ElMasry, G.M.; Nakauchi, S. Image analysis operations applied to hyperspectral images for non-invasive sensing of food quality—A comprehensive review. Biosyst. Eng. 2016, 142, 53–82. [Google Scholar] [CrossRef]
  45. Qi, S.Y.; Oshita, S.; Makino, Y.; Han, D. Influence of sampling component on determination of soluble solids content of Fuji apple by near-infrared spectroscopy. Appl. Spectrosc. 2016, 71, 856–865. [Google Scholar] [CrossRef] [PubMed]
  46. Xu, J.L.; Riccioli, C.; Sun, D.-W. Development of an alternative technique for rapid and accurate determination of fish caloric density based hyperspectral imaging. J. Food Eng. 2016, 190, 185–194. [Google Scholar] [CrossRef]
  47. Jia, B.B.; Yoon, S.-C.; Zhuang, H.; Wang, W.; Li, C.Y. Prediction of pH of fresh chicken breast fillets by VNIR hyperspectral imaging. J. Food Eng. 2017, 208, 57–65. [Google Scholar] [CrossRef]
  48. Girolamo, A.D.; Lippolis, V.; Nordkvist, E.; Visconti, A. Rapid and non-invasive analysis of deoxynivalenol in durum and common wheat by Fourier-Transform Near Infrared (FT-NIR) spectroscopy. Food Addit. Contam. Part A 2009, 26, 907–917. [Google Scholar] [CrossRef]
Figure 1. Flowchart of the main steps to design a hyperspectral imaging system for real-time monitoring of pH in sausages with different modified casings. (a) Imaging acquisition; (b) hyperspectral image segmentation; (c) spectral extraction; (d) feature wavelengths selection; (e) unfolded image to 2D and multiply the regression coefficients of PLSR model using feature wavelengths; (f) prediction map establishment.
Foods 11 02797 g001
Figure 2. Spectra of all raw samples with different modified casing treatments in the spectral range of 350 to 1100 nm. Note: legend number means different treatments
Foods 11 02797 g002
Figure 3. pH value of the sausages stuffed in modified casings with different treatments.
Foods 11 02797 g003
Figure 4. pH value of the sausages stuffed in modified casings as affected by soy lecithin concentration and addition of orange extracts (a); 2D contour plot (b).
Foods 11 02797 g004
Figure 5. Feature wavelength selection from the PLSR model.
Foods 11 02797 g005
Figure 6. RGB images (left) and visualization of pH prediction map (right) for sausages stuffed in different treated modified casings stored on Day 16. Note: (a): Treatment 30 sample, pH = 4.44; (b): Treatment 20 sample, pH = 6.17; (c): Control sample, pH = 6.24; and (d): Treatment 22 sample, pH = 6.46.
Foods 11 02797 g006
Table 1. Casing modification treatment combinations.
TreatmentsSurfactant Solution with Orange ExtractsSlush Slat with Lactic Acid
Soy Lecithin Concentration (X1, %, w/w)Soy Oil Concentration (X2,%, w/w)Orange Extracts (X3, %, w/w)Treatment Time (X5, min)Lactic Acid (ml/kg NaCl, X4)Treatment Time (X5, min)
13.16 (C, 0)1.78 (C, 0)0.26 (C, 0)75 (C, 0)19.50 (C, 0)75 (C, 0)
23.16 (C, 0)1.78 (C, 0)0.26 (C, 0)75 (C, 0)22.50 (A, +α)75 (C, 0)
34.20 (F, +1)1.18 (F,−1)0.40 (F, +1)90 (F, +1)18.00 (F,−1)90 (F, +1)
43.16 (C, 0)1.78 (C, 0)0.26 (C, 0)75 (C, 0)16.50 (A, -α)75 (C, 0)
52.11 (F, −1)2.38 (F, +1)0.12 (F, −1)90 (F, +1)21.00 (F, +1)90 (F, +1)
63.16 (C, 0)1.78 (C, 0)0.26 (C, 0)75 (C, 0)19.50 (C, 0)75 (C, 0)
72.11 (F, −1)2.38 (F, +1)0.40 (F, +1)60 (F, −1)21.00 (F, +1)60 (F, −1)
81.07 (A, -α)1.78 (C, 0)0.26 (C, 0)75 (C, 0)19.50 (C, 0)75 (C, 0)
93.16 (C, 0)1.78 (C, 0)0.26 (C, 0)105 (A, +α)19.50 (C, 0)105 (A, +α)
103.16 (C, 0)1.78 (C, 0)0.26 (C, 0)45 (A, -α)19.50 (C, 0)45(A, -α)
113.16 (C, 0)1.78 (C, 0)0.26 (C, 0)75 (C, 0)19.50 (C, 0)75 (C, 0)
122.11 (F, −1)1.18 (F, −1)0.40 (F, +1)90 (F, +1)21.00 (F, +1)90 (F, +1)
134.20 (F, +1)2.38 (F, +1)0.12 (F, −1)60 (F, −1)21.00 (F, +1)60 (F, −1)
144.20 (F, +1)2.38 (F, +1)0.40 (F, +1)60 (F, −1)18.00 (F, −1)60 (F, −1)
154.20 (F, +1)1.18 (F, −1)0.40 (F, +1)60 (F, −1)21.00 (F, +1)60 (F, −1)
162.11 (F, −1)1.18 (F, −1)0.12 (F, −1)90 (F, +1)18.00 (F, −1)90 (F, +1)
173.16 (C, 0)2.93(A, +α)0.26 (C, 0)75 (C, 0)19.50 (C, 0)75 (C, 0)
184.20 (F, +1)1.18 (F, −1)0.12 (F, −1)90 (F, +1)21.00 (F, +1)90 (F, +1)
192.11 (F, −1)1.18 (F, −1)0.12 (F, −1)60 (F, −1)21.00 (F, +1)60 (F, −1)
204.20 (F, +1)2.38 (F, +1)0.40 (F, +1)90 (F, +1)21.00 (F, +1)90 (F, +1)
212.11(F, −1)1.18 (F, −1)0.40 (F, +1)60 (F, −1)18.00 (F, −1)60 (F, −1)
224.20(F, +1)1.18 (F, −1)0.12 (F, −1)60 (F, −1)18.00 (F, −1)60 (F, −1)
233.16 (C, 0)1.78 (C, 0)0.53(A, +α)75 (C, 0)19.50 (C, 0)75 (C, 0)
245.16 (A, +α)1.78 (C, 0)0.26 (C, 0)75 (C, 0)19.50 (C, 0)75 (C, 0)
252.11 (F, −1)2.38 (F, +1)0.40 (F, +1)90 (F, +1)18.00 (F, −1)90 (F, +1)
263.16(C, 0)1.78(C, 0)0.26 (C, 0)75 (C, 0)19.50 (C, 0)75 (C, 0)
274.20 (F, +1)2.38 (F, +1)0.12 (F, −1)90 (F, +1)18.00 (F, −1)90 (F, +1)
283.16 (C, 0)1.78(C, 0)0.26 (C, 0)75 (C, 0)19.50 (C, 0)75 (C, 0)
293.16 (C, 0)1.78(C, 0)0.26 (C, 0)75 (C, 0)19.50 (C, 0)75 (C, 0)
302.11 (F, −1)2.38 (F, +1)0.12 (F, −1)60 (F, −1)18.00 (F, −1)60(F, −1)
313.16(C, 0)1.78 (C, 0)0.00 (A, -α)75 (C, 0)19.50 (C, 0)75 (C, 0)
323.20(C, 0)0.60 (A, -α)0.26 (C, 0)75 (C, 0)19.50 (C, 0)75 (C, 0)
Note: A: axial, C: center, F: factorial; the numbers α −1, 0, 1, and +α in the brackets mean coded variable level.
Table 2. Regression coefficients and analysis of variance of the regression models for pH.
Analysis of Variance
SourceDfAdj SSF-Value
Model2014.451.12
Linear53.541.10
X111.642.56
X210.010.01
X310.000.01
X410.000
X511.882.93
Square52.550.79
X1 × X110.120.19
X2 ×X210.811.27
X3 ×X310.641.00
X4 ×X410.600.93
X5 × X510.711.10
2-Way Interaction108.371.30
X1 × X210.000.00
X1 × X313.986.19 *
X1 × X410.010.02
X1 × X510.060.09
X2 × X310.500.78
X2 × X411.041.62
X2 × X510.661.02
X3 × X410.681.06
X3 × X510.841.30
X4 × X510.600.93
Error117.07
Lack of Fit63.300.73
Pure Error53.78
Total3121.52
Note: * significant at p < 0.05, without any mark means not significant. Adj SS: adjust sum of squares, Df: degree of freedom.
Table 3. Statistical parameters of PLSR with raw and preprocessing spectra based on full wavelengths.
TreatmentsCalibration Group
(n = 110)
Prediction Group
(n = 55)
Cross-Validation
Reflectance (R) Rc2RMSEC (%)Rp2RMSEP (%)Rcv2RMSECV (%)
Raw0.68490.46280.64850.47090.74960.4063
1st Derivative 0.53420.56260.64010.47660.87560.2864
2nd Derivative0.62910.5020.38430.62330.74310.4115
MSC0.55690.54880.64160.47560.65240.4787
SNV0.55700.54870.64160.47560.65280.4785
Normalization0.67700.46850.68550.44550.71940.4301
Normalization + 1st Derivative 0.68130.46540.65030.46980.71520.4333
1st Derivative + Normalization 0.56920.54110.55240.53140.61970.5007
Normalization + 2nd Derivative0.72820.42980.40910.61060.75340.4032
2nd Derivative + Normalization 0.34170.66880.13090.74060.34470.6573
Absorbance (A)Raw0.70250.44960.66260.46140.73050.4216
1st Derivative 0.73000.42830.67890.45010.77980.3810
2nd Derivative0.52570.56770.37100.630.65440.4733
MSC0.54790.55430.56770.52230.63840.4883
SNV0.54760.55450.56800.52210.63840.4883
Normalization0.50210.58170.60150.50150.59270.5182
Normalization + 1st Derivative 0.53240.56370.65600.46590.57060.5321
1st Derivative + Normalization 0.48120.59380.48310.57110.61230.5056
Normalization + 2nd Derivative0.61490.51160.25140.68730.62400.4979
2nd Derivative + Normalization 0.01790.81700.02170.78570.01830.8045
Note: MSC: multiplicative scatter correction; SNV: standard normal variate; RMSEC: root mean square error of calibration; RMSEP: root mean square error of prediction; RMSECV: root mean square error of cross-validation.
Table 4. Statistical parameters of PLSR with raw and preprocessing spectra based on selected feature wavelengths.
TreatmentsCalibration Group
(n = 110)
Prediction Group
(n = 55)
Cross-Validation
Reflectance Rc2RMSEC (%)Rp2RMSEP (%)Rcv2RMSECV (%)
Raw0.68760.46080.66480.45990.68440.4561
1st Derivative 0.58810.52910.62570.4860.63730.4890
2nd Derivative0.55600.54930.66400.46040.60010.5135
MSC0.53700.56090.65300.46800.63190.4926
SNV0.53690.56100.65320.46780.62290.4986
Normalization0.68600.46190.68960.44260.69540.4482
Normalization + 1st Derivative 0.66950.47390.66130.46230.67050.4661
1st Derivative + Normalization 0.61240.51320.61890.49040.60210.5122
Normalization + 2nd Derivative0.66030.48050.66880.45710.67300.4643
2nd Derivative + Normalization 0.54270.55740.63930.47710.59560.5164
AbsorbanceRaw0.69960.45180.67060.45590.70500.4410
1st Derivative 0.65530.48400.68350.44690.70260.4428
2nd Derivative0.66080.48010.66530.45960.66540.4697
MSC0.55640.5490.58240.51330.57090.5319
SNV0.52090.57060.62670.48540.59120.5191
Normalization0.57190.53940.53150.54370.59560.5163
Normalization + 1st Derivative 0.53310.56330.57820.51590.56160.5376
1st Derivative + Normalization 0.55170.55190.53070.54420.54130.5499
Normalization + 2nd Derivative0.58990.52790.58220.51350.59730.5153
2nd Derivative + Normalization 0.58920.52840.57280.51920.59770.515
Note: MSC: multiplicative scatter correction; SNV: standard normal variate; RMSEC: root mean square error of calibration; RMSEP: root mean square error of prediction; RMSECV: root mean square error of cross-validation.
Publisher’s Note: MDPI stays neutral with regard to jurisdictional claims in published maps and institutional affiliations.

