Article

Study of Consumer Liking of Six Chinese Vinegar Products and the Correlation between These Likings and the Volatile Profile

1
Beijing Engineering and Technology Research Center of Food Additives, Beijing Technology and Business University, Beijing 100048, China
2
College of Biological Sciences and Technology, Beijing Forestry University, Beijing 100083, China
*
Authors to whom correspondence should be addressed.
Foods 2022, 11(15), 2224; https://doi.org/10.3390/foods11152224
Submission received: 28 June 2022 / Revised: 20 July 2022 / Accepted: 23 July 2022 / Published: 26 July 2022

Abstract

:
As the aroma of Chinese vinegar is a key quality trait that influences consumer liking, a combination of sensory data and instrumental measurements were performed to help understand the aroma differences of six types of Chinese vinegar. A total of 52 volatile compounds, mostly ethyl acetate, acetic acid, and phenethyl alcohol, were detected in six types of Chinese vinegar using solid-phase microextraction coupled with gas chromatography–mass spectrometry (SPME-GC–MS). Combined with open-ended questions, the correlation between consumer liking and the volatile profile of the vinegar was further investigated. More consumers preferred the potato vinegar (B6) described as “having a sweet aroma and fruity vinegar aroma”. The Heng-shun Jinyou balsamic vinegar (B5) was not favored by consumers with its exhibition of “too pungent vinegar aroma”. Based on their preference patterns, consumers were grouped into three clusters by k-means clustering and principal component analysis (PCA). Using partial least squares regression (PLSR), the most important volatile compounds that drove consumer liking in the three clusters were obtained, among which 14 compounds such as 1-methylpyrrole-2-carboxaldehyde, ethyl acetate, and acetylfuran had the greatest impact on consumer liking, which could guide manufacturers to improve product quality and customer satisfaction.

1. Introduction

Vinegar is a popular seasoning and cooking ingredient that contains acetic acid and other flavor components [1]. The acetic acid in vinegar is mainly produced from ethanol via acetic acid fermentation [2]. Vinegar has attracted increasing attention since various studies have suggested that its consumption can improve human health [3]. For instance, vinegar reportedly contains many nutritional ingredients, including amino acids, minerals, organic acids, and phenolic compounds, displaying anti-microbial and anti-oxidant properties that can prevent hypertension, cardiovascular disease, and cancer [3,4,5,6,7,8].
Since Chinese vinegar is used extensively, the country produces 26 million hectoliters of vinegar annually, and its quality is essentially determined by its appearance, aroma, and nutritional components [9]. Volatile compounds play a vital role in determining the overall aroma of Chinese vinegar and are mainly formed from the source material (grain and cereal) via the fermentation process [9,10,11]. It has been reported that different acetic acid bacterial strains possess different preferences on metabolizing nutrient components during fermentation, which could result in different aromatic features for Chinese vinegar [12]. After the fermentation process, Chinese vinegar is aged to enhance its sensory attributes and nutritional quality while improving the aromatic complexity [13,14,15].
Solid-phase microextraction (SPME) represents a well-established sampling method, which can be used to extract many volatile compounds from a large variety of foods. It has been frequently combined with gas chromatography–mass spectrometry (GC-MS), which is widely used to identify volatile compounds [16,17]. Chung et al. (2017) [18] reported that SPME-GC–MS helped to distinguish the aroma profiles of rice vinegars of different producer origin, reflecting the important role of SPME-GC–MS in the extraction and identification of volatile compounds.
Regarding sensory analysis, a descriptive assessment by a trained panel represents the typical method used in the food industry to develop and control the sensory quality of products [19,20,21]. However, creating and maintaining well-trained, calibrated sensory panels can be economically challenging and time-consuming, particularly when dealing with a complex product, such as wine [22]. Moreover, due to extensive training, highly trained assessors can perceive wine aroma differently from consumers, who display a unified and holistic impression of the product. Some studies have indicated that the perception of a trained panel does not reflect the sensory impression of consumers [19,21]. Considering the high competitiveness of the current market, companies must base their decisions on consumer preferences to increase the success of their products [23]. Open-ended questions are a fast sensory descriptive analysis method. Recent studies have employed it to evaluate 3D printed cookies and coffee [24,25]. Applying it to sensory food evaluation not only complements the quantitative results provided by the sensory panels and helps to explore the similarities and differences between products but also provides considerable information for product developers and designers.
To better understand vinegar aroma perception, finding a correlation between the sensory data and instrumental measurements is necessary [26]. The combination of sensory data and instrumental measurements helped facilitate marketing and quality control. Yu et al. (2021) [27] revealed the aroma characteristics of traditional Huangjiu produced around the winter solstice via sensory evaluation, GC–MS, and gas chromatography–ion mobility spectrometry (GC–IMS). The results suggested that the traditional Huangjiu produced around the winter solstice contained more aroma volatile compounds and had better aroma quality than those produced during other periods. It proved that the combination of sensory data and instrumental measurements could guide product optimization effectively. The present study selected six different types of commercially available Chinese vinegar for volatile compounds extraction and analysis using SPME-GC–MS while exploring the association between consumer perception and volatile composition. This study aims to characterize the aromatic features of these vinegar samples to help understand the relationship between volatile compounds and sensory attributes, and guide manufacturers to improve the quality and consumer liking of vinegar.

2. Materials and Methods

2.1. Chemicals

The external standards with a purity of at least 95% included ethyl acetate, diethyl succinate, isoamyl acetate, benzaldehyde, isovaleric acid, caproic acid, octanoic acid, propionic acid, phenylethyl alcohol, and were purchased from Sigma-Aldrich (St. Louis, MO, USA). Furthermore, 2-methyl-3-heptanone with a purity of 99% represented the internal standard and was also obtained from Sigma-Aldrich (St. Louis, MO, USA).

2.2. Chinese Vinegar Samples

In this study, six representatives of different types of vinegar produced in various regions of China were selected, including ten-year aged Qian-he cellar vinegar (B1), Ning-hua-mansion old vinegar (B2), East-lake health vinegar (B3), Qian-he glutinous rice vinegar (B4), Heng-shun Jinyou balsamic vinegar (B5), and potato vinegar (B6). Among them, potato vinegar (B6) was selected because potato (one of the principal raw materials) is widely cultivated around the world, is rich in nutrients, and has enormous development potential. All the above samples were purchased from a local supermarket (Beijing, China). Detailed information regarding these Chinese vinegar samples is listed in Table 1.

2.3. Volatile Compounds Extraction

The volatile compounds were extracted from the Chinese vinegar samples using SPME according to a published method with minor modifications [28]. Briefly, each Chinese vinegar sample (5 mL) was mixed with 1 µL of 0.816 µg/µL 2-methyl-3-heptanone and 1 g sodium chloride in a 15-mL vial containing a magnetic stirrer. The vial was immediately capped with a PTFE-silicone septum and equilibrated in a 55 °C water bath under agitation for 20 min. Next, a DVB/CAR/PDMS fiber was inserted into the headspace of the vial to adsorb the volatile compounds for 40 min at the same temperature with the same agitation (55 °C water bath under agitation). After SPME, the fiber was removed from the headspace of the vial and immediately inserted into the injection port of the gas chromatograph; it was then left for 5 min at 250 °C to desorb the volatile compounds into the GC column. All the samples were analyzed in triplicate.

2.4. GC–MS Analysis

An Agilent 7890A GC coupled with an Agilent 7000B mass spectrometer (Agilent Technologies, Santa Clara, CA, USA) was used to analyze the volatile compounds in the Chinese vinegar samples according to a previously described method [28]. An Agilent DB-WAX capillary column (30 m × 0.32 mm, 0.25 µm film thickness, Agilent Technologies, Santa Clara, CA, USA) was employed to separate the volatile compounds using a carrier gas (helium) at a flow rate of 1 mL/min. The temperature of the oven was programmed as follows: The temperature was increased from 40 °C to 250 °C at 5 °C/min, and maintained at 250 °C for 3 min. A 5:1 split mode was used under an electron impact mode of 70 eV, with a mass spectrometer interface temperature of 280 °C, and an ion source temperature of 230 °C. A selective ion mode was used for the mass scan, ranging from m/z 20 to m/z 450. A C6-C24 n-alkane series (Supelco, Bellefonte, PA, USA) was used in the same chromatographic conditions to calculate the retention indices. Volatile compounds with available reference standards were identified by comparing their mass spectra and retention indices with the standard, while volatile compounds without available standards were tentatively identified by comparing their mass spectra and retention indices with the Standard NIST11 library and reference literature [29]. The stock solution (5 mL) was mixed with 5 mL distilled water and then consecutively diluted to six concentration level standards, which were extracted and analyzed employing the same procedure used for the Chinese vinegar samples. A quantitative analysis was carried out through the standard curve. In addition, volatile compounds without a standard curve were quantified using standards sharing similar structures or carbon atom numbers.

2.5. Odor Activity Value (OAV)

The OAVs of volatile compounds reflected their importance in contributing aroma notes to the overall aroma of the sample, and were calculated by comparing their concentrations in the sample with their perception threshold [30,31]. Odor thresholds were taken from the literature [32]. A volatile compound OAV higher than 1 indicated that its aroma features significantly contributed to the overall aroma of the sample.

2.6. Sensory Evaluation

This survey was conducted in January 2018 and featured 86 healthy participants (67% women and 33% men, aged 18 to 40) from the Beijing Forestry University. The inclusion criteria were regular vinegar consumption, as well as sufficient interest and time to participate in the study. The respondents were asked to complete an online questionnaire before evaluating the samples, which consisted of 32 questions divided into four sections: (1) Basic Information of Consumers. This section included eight questions regarding name, gender, age, permanent residence in the last ten years, occupation, vinegar consumption frequency, experimental participation time, and contact information. (2) Preference for Vinegar. This section investigated the attitude of the respondents towards vinegar via ten statement questions, which were scored on a 7-point scale. The 1–7 scale represented the responses, “strongly disagree”, “disagree”, “disagree slightly”, “indifferent”, “agree slightly”, “agree”, and “strongly agree”, respectively. The respondents were required to rate each statement question according to their actual situations. (3) General Health Interest. This section also investigated the attitude of the respondents towards vinegar using ten statement questions scored on a 7-point scale. The 1–7 scale represented the responses, “strongly disagree”, “disagree”, “disagree slightly”, “indifferent”, “agree slightly”, “agree”, and “strongly agree”, respectively. The respondents were required to rate each statement question according to their actual situations. (4) Consumer Purchasing Behavior and Preferences. This section consisted of four questions regarding understanding the vinegar aroma, the factors valued by the participants when choosing vinegar, the difference in vinegar quality, and the type of vinegar generally purchased.
This study evaluated six vinegar samples during a single experiment lasting for approximately 15–30 min. Here, 5 mL of each sample was placed in separate 30 mL brown PET plastic vials at room temperature and labeled with random three-digit numbers. The samples were placed on separate tables under artificial white light. The participants were required to smell each sample, with a 3 min resting period between samples to remove the residual odor of the previous sample. After entering the evaluation room, the respondents smelled six different vinegar samples successively to determine the difference between the vinegar aromas. Then, the respondents scored each sample within 30 s according to their personal liking and provided comments for 2 min. The vinegar samples were subjected to a sequential blind test, while the smelling order was rotated for each respondent to avoid the bias caused by the smelling sequence. This test was repeated six times. A 7-point scale was used, with points 1–7 representing “particularly dislike”, “dislike”, “dislike slightly”, “just so, so”, “like slightly, “like”, and “particularly like”, respectively. After the evaluation, the respondents were asked to reply to an additional two questions. (1) “Why do you like this sample?” → “Is there any other reason?” (2) “Why don’t you like this sample?” → “Is there any other reason?” The tests were conducted in controlled conditions in accordance with the ISO8589:2007 standard. All respondents have consented to participation in the study. In the consumer stage, there were 86 participants, while only 76 participants completed the sensory evaluation. The data in this study were the data of the 76 participants

2.7. Statistical Analysis

The data were expressed as the mean ± standard deviation of triplicate tests. An analysis of variance (ANOVA) was performed to compare the significant differences between the means using Duncan’s range test and SPSS version 23.0 (Chicago, IL, USA) with a significant level of 0.05. In addition, the Kruskal-Wallis test was used to analyze the consumer liking score. Principal component analysis (PCA) was used to evaluate the similarities and differences between the Chinese vinegar samples regarding their volatile compositions and aromatic properties. All statistical analyses of the sensory data were conducted in the R language and employed packages, such as ggplot2, reshape2, FactoMineR, pheatmap, and PLSR. PCA and k-means clustering were used to draw a consumer preference map using the relevant product data. Partial least squares regression (PLSR) was used to investigate the relationship between the volatile compound concentrations and product liking of each consumer cluster. The PLSR data were scaled and centered according to the volatile compound structures.

3. Results

3.1. Volatile Compounds Detection Using GC–MS

A total of 52 volatile compounds were detected in vinegar thanks to GC–MS analysis, including eleven esters, seven aldehydes, seven acids, four phenols, three alcohols, three ketones, eight furans, three pyrazines, and six others (Table 2). The relevant information of the standard curve for vinegar compounds is provided in Table 3. The GC–MS total ion chromatograms of six kinds of vinegar are in Figure S1.

3.1.1. Esters

The solid-state fermentation of traditional Chinese vinegar favors ester accumulation, substantially improving the aromatic complexity [33]. This study revealed eleven esters in the Chinese vinegar samples, including ethyl acetate, ethyl propionate, n-propyl acetate, isobutyl acetate, isoamyl acetate, 1,2-propanediol,2-acetate, trimethylene acetate, ethyl benzoate, diethyl succinate, ethyl phenylacetate, and β-phenethyl acetate (Table 4). B1 exhibited high 1,2-propanediol,2-acetate (344,314.42 µg/L) and B2, B3, B4, B5, and B6 all displayed high ethyl acetate concentrations of 625,514.35 µg/L, 783,331.79 µg/L, 571,951.58 µg/L, 304,167.86 µg/L, and 467,917.75 µg/L, respectively. Meanwhile, ethyl phenylacetate was the lowest (trace amounts) in all samples.
Esters represent essential volatile compounds providing vinegar with floral or fruity aromas [34]. Ethyl propionate, denoting sweet, fruity, grape, ether, rum, and pineapple notes, contributed most to the aroma of B1 (OAV = 118.177) (Table 5) B2 (OAV = 170.431), and B3 (OAV = 173.433). Ethyl acetate (OAV = 114.390), ethyl benzoate (OAV = 73.764), and trimethylene acetate (OAV = 263.524) were more representative of the aroma of B4, B5, and B6, respectively. The diethyl succinate (OAV = 5.698) concentration only reached an odor threshold in B5, while isobutyl acetate and ethyl benzoate failed to reach an odor threshold in B3.

3.1.2. Acids

Studies had shown that vinegar contains an abundance of acid compounds, primarily acetic acid, which was consistent with the findings of this paper. Acetic acid is produced via the alcoholic fermentation of wine yeast and by acetobacter acting on alcohol. Other acids may be the products of amino acid degradation via oxidation, or the reduction or the oxidation and degradation of saturated fatty acids [35]. Seven acids were present in all the samples, including acetic acid, propionic acid, butyric acid, isovaleric acid, 2-methylbutyric acid, caproic acid, and octanoic acid. Acetic acid was the most abundant in all the samples at levels of 8,020,749.17 µg/L, 7,057,979.52 µg/L, 11,429,688.79 µg/L, 6,119,026.91 µg/L, 11,729,001.22 µg/L, and 6,077,922.73 µg/L in B1, B2, B3, B4, B5, and B6, respectively. Butyric acid was the lowest in B1, B2, B3, B4, and B6 at 73.83 µg/L, 155.64 µg/L, 230.41 µg/L, 46.56 µg/L, and 40.22 µg/L, while isovaleric acid was the lowest in B5 at 793.42 µg/L. Various other acids were distributed between these concentrations.
Acid compounds are vital for providing vinegar with is bold aromas and include strong, acidic, pungent, spicy, cheesy, and chemical notes [36]. These compounds significantly contribute to the overall aroma of the vinegar and lay the foundation for its sour taste [37,38]. Acetic acid is responsible for strong acidic notes, contributing significantly to the aroma of B1 (OAV = 3645.795), B2 (OAV = 3208.173), B3 (OAV = 5195.313), B4 (OAV = 2781.376), B5 (OAV = 5331.364), and B6 (OAV = 2762.692). The 2-Methylbutyric acid is responsible for pungent, spicy, cheesy notes and was second to acetic acid in aroma strength in B1 (OAV = 191.887), B2 (OAV = 119.274), B3 (OAV = 97.302), B4 (OAV = 136.356), B5 (OAV = 233.104), and B6 (OAV = 72.358), followed by caproic acid (OAV = 9.514). The propionic acid concentrations only reached odor thresholds in B2 (OAV = 4.165), B3 (OAV = 1.221), and B6 (OAV = 25.182), while the butyric acid (OAV = 3.679) and isovaleric acid (OAV = 1.133) concentrations only reached odor thresholds in B5.

3.1.3. Aldehydes

Aldehyde formation may be enhanced by oxidation after a long aging period [39]. Seven aldehydes were present in all the samples, including 3-methylbutyraldehyde, nonanal, benzaldehyde, phenylethanal, 1H-pyrrole-2-carbaldehyde, 5-methyl-2-phenyl-2-hexenal, and 1-methylpyrrole-2-carboxaldehyde. Of these, benzaldehyde may be derived from the oxidation of benzyl alcohol or the action of microorganisms on phenylalanine, phenol, phenylacetic acid, and hydroxybenzoic acid [40]. Phenylethanal is formed via the Strecke degradation of phenylalanine during the acetic acid fermentation stage [41]. Here, 3-methylbutyraldehyde was most abundant in B1, B2, B3, B4, and B5 at levels of 39,262.87 µg/L, 22,572.34 µg/L, 19,246.37 µg/L, 35,396.43 µg/L, and 44,409.15 µg/L, while phenylethanal was the highest in B6 at 12,303.69 µg/L. The 1-methylpyrrole-2-carboxaldehyde levels were lowest in all the samples at 36.40 µg/L, 135.69 µg/L, 489.55 µg/L, 27.11 µg/L, 92.43 µg/L, and 14.36 µg/L in B1, B2, B3, B4, B5, and B6, respectively.
The aldehyde compounds displayed significant diversity and were highly abundant in the vinegar, providing fruity, floral, fatty, waxy, and fragrant aromas [9]. These components substantially affected the overall aroma characteristics of the different types of vinegar. Phenylethanal contributed sweet, roasted, green, nutty, and floral notes, significantly affecting the aroma profiles of B1 (OAV = 4154.525), B2 (OAV = 3420.799), B3 (OAV = 4034.055), B4 (OAV = 5790.261), B5 (OAV = 3526.653), and B6 (OAV = 3075.922). The benzaldehyde concentration contributed fruity, nutty, woody, and floral notes while reaching odor thresholds in B2 (OAV = 1.905) and B4 (OAV = 2.080).

3.1.4. Volatile Phenols

Phenolic compounds are mainly produced by thermal degradation via the depolymerization or oxidation of lignin [9]. Four phenols were present in all the samples, including guaiacol, 2-ethyl-3-hydroxy-4H-pyran-4-one, 4-ethyl-2-methoxyphenol, and 4-ethylphenol. Here, 4-ethyl-2-methoxyphenol was most abundant in B1, B4, and B6 at levels of 1836.67 µg/L, 4746.59 µg/L, and 2794.37 µg/L, respectively, while guaiacol was highest in B2, B3, and B5 at respective levels of 42,367.62 µg/L, 5063.67 µg/L, and 809.65 µg/L. The 4-ethylphenol level was lowest in all the samples at 23.19 µg/L, 2829.93 µg/L, 180.21 µg/L, 14.55 µg/L, 18.91 µg/L, and 30.89 µg/L in B1, B2, B3, B4, B5, and B6, respectively.
Phenol compounds provide medicinal, meaty, woody, fruity, and floral notes [9]. The guaiacol imparted smoky, spicy, fragrant, meaty, woody, and floral notes, reaching odor thresholds in B1 (OAV = 65.961), B2 (OAV = 2017.506), B3 (OAV = 241.127), B4 (OAV = 28.278), B5 (OAV = 38.555), and B6 (OAV = 60.044). Neither 4-ethyl-2-methoxyphenol nor 4-ethylphenol reached an odor threshold.

3.1.5. Alcohols

Alcohols are mainly derived from alcohol fermentation [42]. Three alcohols were present in all the samples, including 3-methyl-1-butanol, 2,3-butanediol, and phenethyl alcohol. The phenethyl alcohol concentrations were most abundant in all the samples at levels of 460,480.92 µg/L, 145,519.63 µg/L, 77,189.78 µg/L, 565,184.73 µg/L, 695,627.22 µg/L, and 173,905.87 µg/L in B1, B2, B3, B4, B5, and B6, respectively. Furthermore, the 3-methyl-1-butanol concentrations were lowest in B1, B2, B4, B5, and B6, displaying levels of 8637.39 µg/L, 440.01 µg/L, 13,010.93 µg/L, 4574.55 µg/L, and 4819.93 µg/L, respectively, while only trace amounts were evident in B3.
Alcohol compounds provide fruity, floral, fatty, fragrant, and floral notes. The phenethyl alcohol presented a soft, pleasant, and long-lasting scent [43], reaching odor thresholds in B1 (OAV = 613.975), B2 (OAV = 194.026), B3 (OAV = 102.920), B4 (OAV = 753.580), B5 (OAV = 927.503), and B6 (OAV = 231.874). Only 2,3-butanediol (OAV = 1.067) reached an odor threshold in B5, while 3-methyl-1-butanol did not reach an odor threshold.

3.1.6. Ketones

Ketone volatile compounds are formed via sugar degradation by the Maillard reaction [44]. Three ketones were present in all the samples, including 3-hydroxy-2-butanone, acetophenone, and 2-pyrrolidinone. Of these, 3-hydroxy-2-butanone, also known as acetoin, is responsible for a milky aroma. 2,3-butanediol and other by-products will be produced when 3-hydroxy-2-butanone is produced by the glycolytic pathway. Many microorganisms including Bacillus, E. coli and Klebsiella, can be synthesized as 3-hydroxy-2-butanone [45]. The accumulation of 3-hydroxyl-2-butanone plays an important role in pyrazine synthesis. The acetophenone concentrations were most abundant in B1, B3, and B5 at respective levels of 1412.14 µg/L, 1057.34 µg/L, and 1220.89 µg/L, while the 3-hydroxy-2-butanone concentrations were highest in B2, B4, and B6 at 6910.25 µg/L, 2468.94 µg/L, 9315.87 µg/L, respectively. The 3-hydroxy-2-butanone levels were lowest in B3 at 136.94 µg/L, while only showing trace amounts in B1. Furthermore, the 2-pyrrolidinone concentrations were lowest in B2, B4, and B5 at 769.83 µg/L, 328.93 µg/L, and 362.42 µg/L, respectively, while the lowest concentration of acetophenone was found in B6 at 129.10 µg/L.
Ketones provide medicinal, balsam, and floral notes [46]. The acetophenone concentrations, presenting strong medicinal, almond aromas, reached odor thresholds in B1 (OAV = 21.738), B2 (OAV = 86.984), B3 (OAV = 16.267), B4 (OAV = 19.342), B5 (OAV = 18.783), and B6 (OAV = 1.986). The 3-hydroxy-2-butanone concentrations, presenting creamy, fatty aromas, reached odor thresholds in B2 (OAV = 49.359), B4 (OAV = 17.635), B5 (OAV = 2.641), and B6 (OAV = 66.542), but not in B1 and B3. Furthermore, the 2-pyrrolidinone concentrations did not achieve odor thresholds in any of the vinegar samples.

3.1.7. Furans

The furans in vinegar are mainly produced by sugar degradation via heating [9]. Eight furans were present in the samples, including furfural, acetylfuran, furfuryl acetate, 1-pentanone, 1-(2-furanyl)-, 3-furanmethanol, 1-(5-methyl-2-furyl)ethan-1-one, 4-(2-furyl)-3-buten-2-one, and 5-acetyldihydrofuran-2(3H)-one. The furfuryl acetate concentrations were most abundant in B1, B4, and B5 at 19,300.71 µg/L, 18,218.52 µg/L, and 12,829.97 µg/L, respectively, while acetylfuran was highest in B2, B3, and B6 at respective levels of 24,330.76 µg/L, 17,231.94 µg/L, and 3161.14 µg/L. Furthermore, B1, B3, B4, and B5 exhibited the lowest 1-pentanone, 1-(2-furanyl) levels at 93.85 µg/L, 122.23 µg/L, 46.35 µg/L, and 2.39 µg/L, respectively, while the lowest 3-furanmethanol concentration was evident in B2 at 787.66 µg/L. B6 displayed trace amounts of furfural, which could be converted into D-glucose via a series of changes.
Furans provide roasted, woody, fruity, floral, fatty, and floral notes [47]. The 5-acetyldihydrofuran-2(3H)-one concentration, presenting a sweet, lemony scent, reached odor thresholds in B1 (OAV = 7.372), B2 (OAV = 19.470), B3 (OAV = 4.672), B4 (OAV = 8.375), B5 (OAV = 9.111), and B6 (OAV = 6.361). The 1-pentanone, 1-(2-furanyl)- reached odor thresholds in B1 (OAV = 15.642), B2 (OAV = 245.359), B3 (OAV = 20.371), and B4 (OAV = 7.726), but not in B5 and B6. The acetylfuran concentrations, presenting baked, smoky aromas, reached odor thresholds in B2 (OAV = 2.433) and B3 (OAV = 1.723). None of the other furan compounds reached aroma thresholds.

3.1.8. Pyrazines

Pyrazines are produced by microbial fermentation or via the Maillard reaction and amino ketone condensation produced by Strecker degradation [48]. Three pyrazines were present in the samples, including 2-methylpyrazine, 2,3-dimethylpyrazine, and 2,3,5-trimethylpyrazine. The 2,3,5-trimethylpyrazine concentrations were highest in all the vinegar samples at 29,125.40 µg/L, 114,532.53 µg/L, 94,445.64 µg/L, 53,390.76 µg/L, 6870.70 µg/L, and 911.37 µg/L in B1, B2, B3, B4, B5, and B6, respectively. Additionally, all the samples exhibited the lowest 2,3-dimethylpyrazine concentrations at respective levels of 297.71 µg/L, 3190.07 µg/L, 1498.79 µg/L, 627.20 µg/L, 91.46 µg/L, and 45.30 µg/L in B1, B2, B3, B4, B5, and B6.
Pyrazines provide roasted, fragrant, mildewy, ester, and floral notes [32]. The 2,3,5-trimethylpyrazine concentrations, presenting baked, nutty, mildewy, and earthy aromas, reached odor thresholds in B1 (OAV = 16.181), B2 (OAV = 63.629), B3 (OAV = 52.470), B4 (OAV = 29.662), and B5 (OAV = 3.817), but not in B6. Neither 2-methylpyrazine nor 2,3-dimethylpyrazine reached odor thresholds.

3.1.9. Other Compounds

Six other compounds were present in the samples, including 1,3-dioxolane,2,4,5-trimethyl-, 1,3-dioxane, 2-methyl-, naphthalene, 2-methylnaphthalene, 2-phenylthiophene, and 4-acetoxy-3-methoxystyrene. The 4-acetoxy-3-methoxystyrene concentrations were highest in all the vinegar samples with B1, B2, B3, B4, B5, and B6 displaying respective levels of 12,375.86 µg/L, 4469.58 µg/L, 1962.65 µg/L, 1414.54 µg/L, 2734.43 µg/L, and 924.48 µg/L. Furthermore, the naphthalene levels were lowest in all the samples at 1.26 µg/L, 3.48 µg/L, 3.42 µg/L, 0.92 µg/L, 0.79 µg/L, and 27.83 µg/L in B1, B2, B3, B4, B5, and B6, respectively. The concentrations of these compounds did not reach the odor thresholds, contributing little to the aroma of the vinegar.

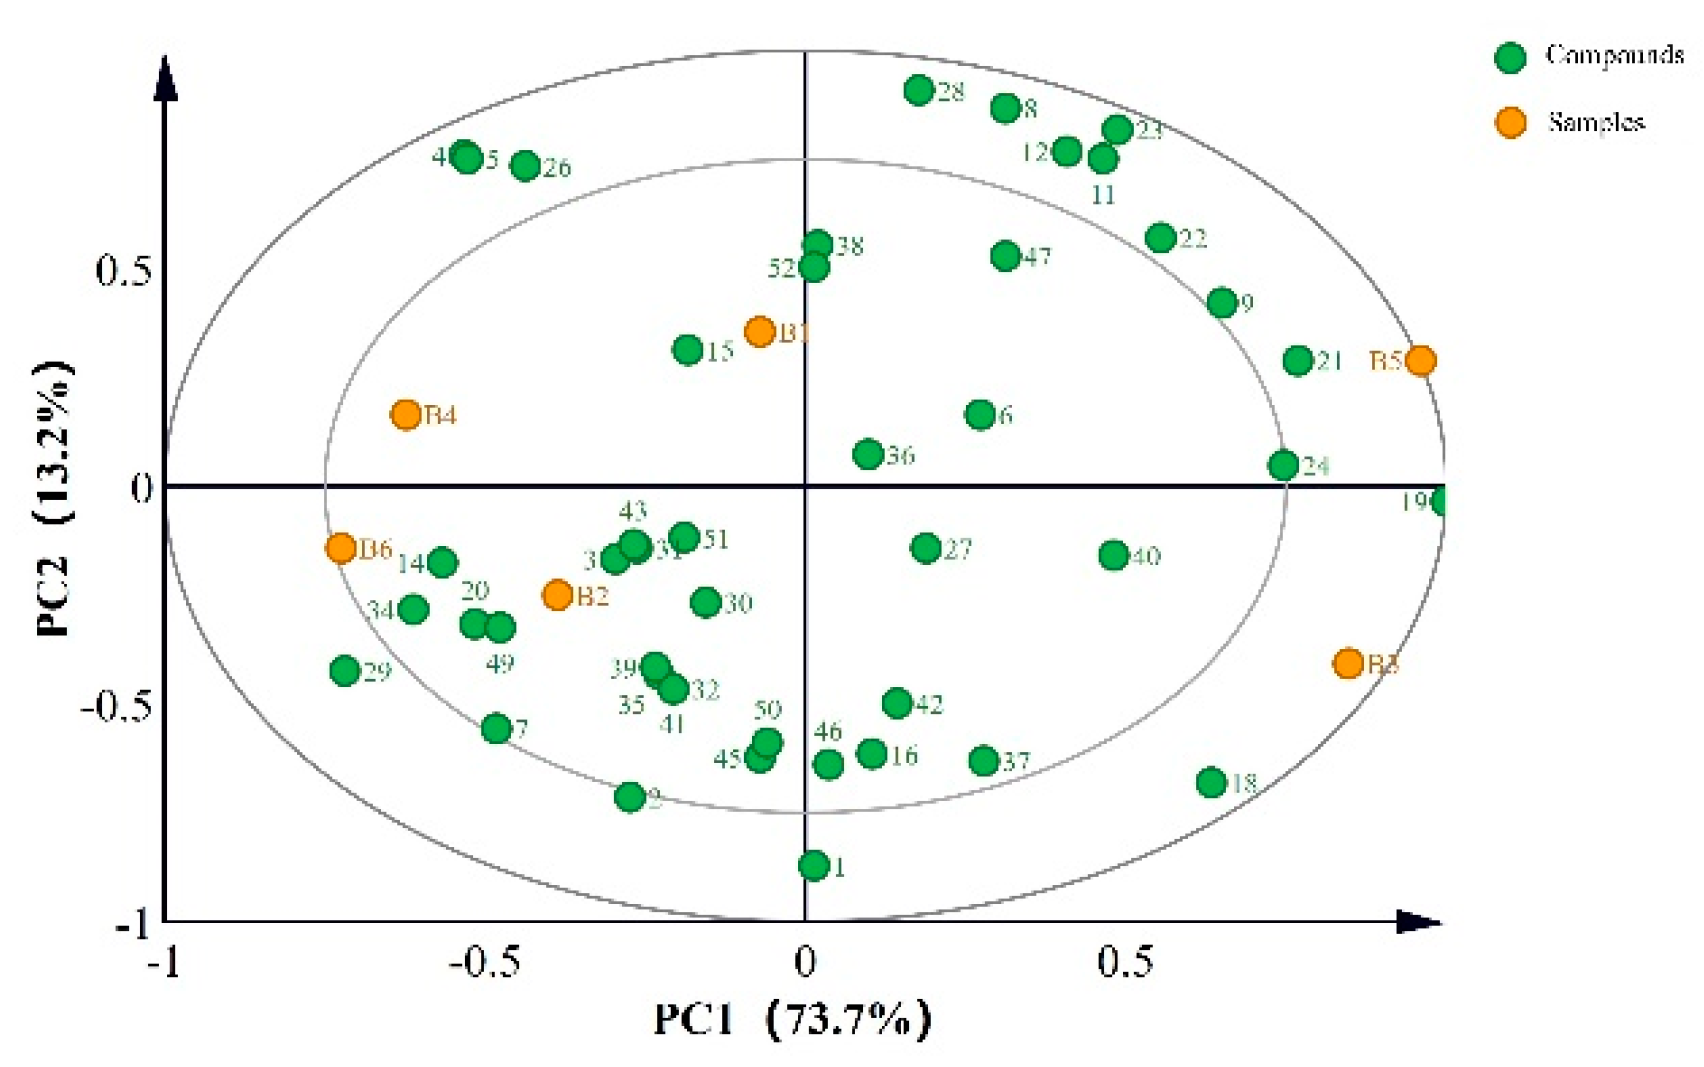
3.2. Aromatic Features of the Chinese Vinegar Samples

The overall aromatic features in the traditional Chinese vinegar samples were assessed according to nine aroma elements, including fruity, floral, herbaceous, nutty, caramel, earthy, chemical, fatty, and roasted. The overall aroma was rated according to the OAVs of each volatile compound that significantly contributed to each aromatic category (OAV above 1). The B1 sample presented sour, green, floral, and sweet scents, while sour, green, fruity, sweet, and roasted aromas were evident in the B2 sample (Table 6). The B3 and B5 samples presented strong sour, green, fruity, and sweet notes, while B4 displayed sour, green, floral, and sweet aromatic notes. The B6 sample presented strong sour, fragrant, green, fruity, and sweet aromas. Besides, the aromatic features of the Chinese vinegar are similar to the other vinegar such as Shanxi aged-vinegar [49], strawberry vinegar [50], and cordyceps vinegar [51].

3.3. Aromatic Features of the Chinese Vinegar Samples

The characteristic aromas of different vinegar varieties were analyzed according to the qualitative and quantitative aroma substance results. Figure 1, where 86.9% of the variance is in the first two components, reflects most of the sample information. The results showed that the samples were divided into four groups, with B1 and B4 concentrated in quadrant 2, B2 and B6 concentrated quadrant 3, B5 in quadrant 1, and B3 in quadrant 4.
As shown in Figure 1, acetic acid, caproic acid, butyric acid, and diethyl succinate were located on the positive side of PC1, whereas 3-hydroxy-2-butanone, 4-ethyl-2-methoxyphenol and benzaldehyde were located on the negative side of PC1. Phenethyl alcohol, ethyl benzoate, and 2-methylbutyric acid were located on the positive side of PC2, whereas ethyl acetate, ethyl propionate, and 1-methypyrrole-2-carboxaldehyde were located on the negative side of PC2.
Since the acetic acid, caproic acid, and butyric acid levels in B3 and B5 were high, a positive direction distribution was evident in PC1. Similarly, B4 and B6 displayed distribution in a negative direction in PC1 due to the high 3-hydroxy-2-butanone and benzaldehyde concentrations. Therefore, variation was evident in the characteristic volatile composition of the different vinegar samples.

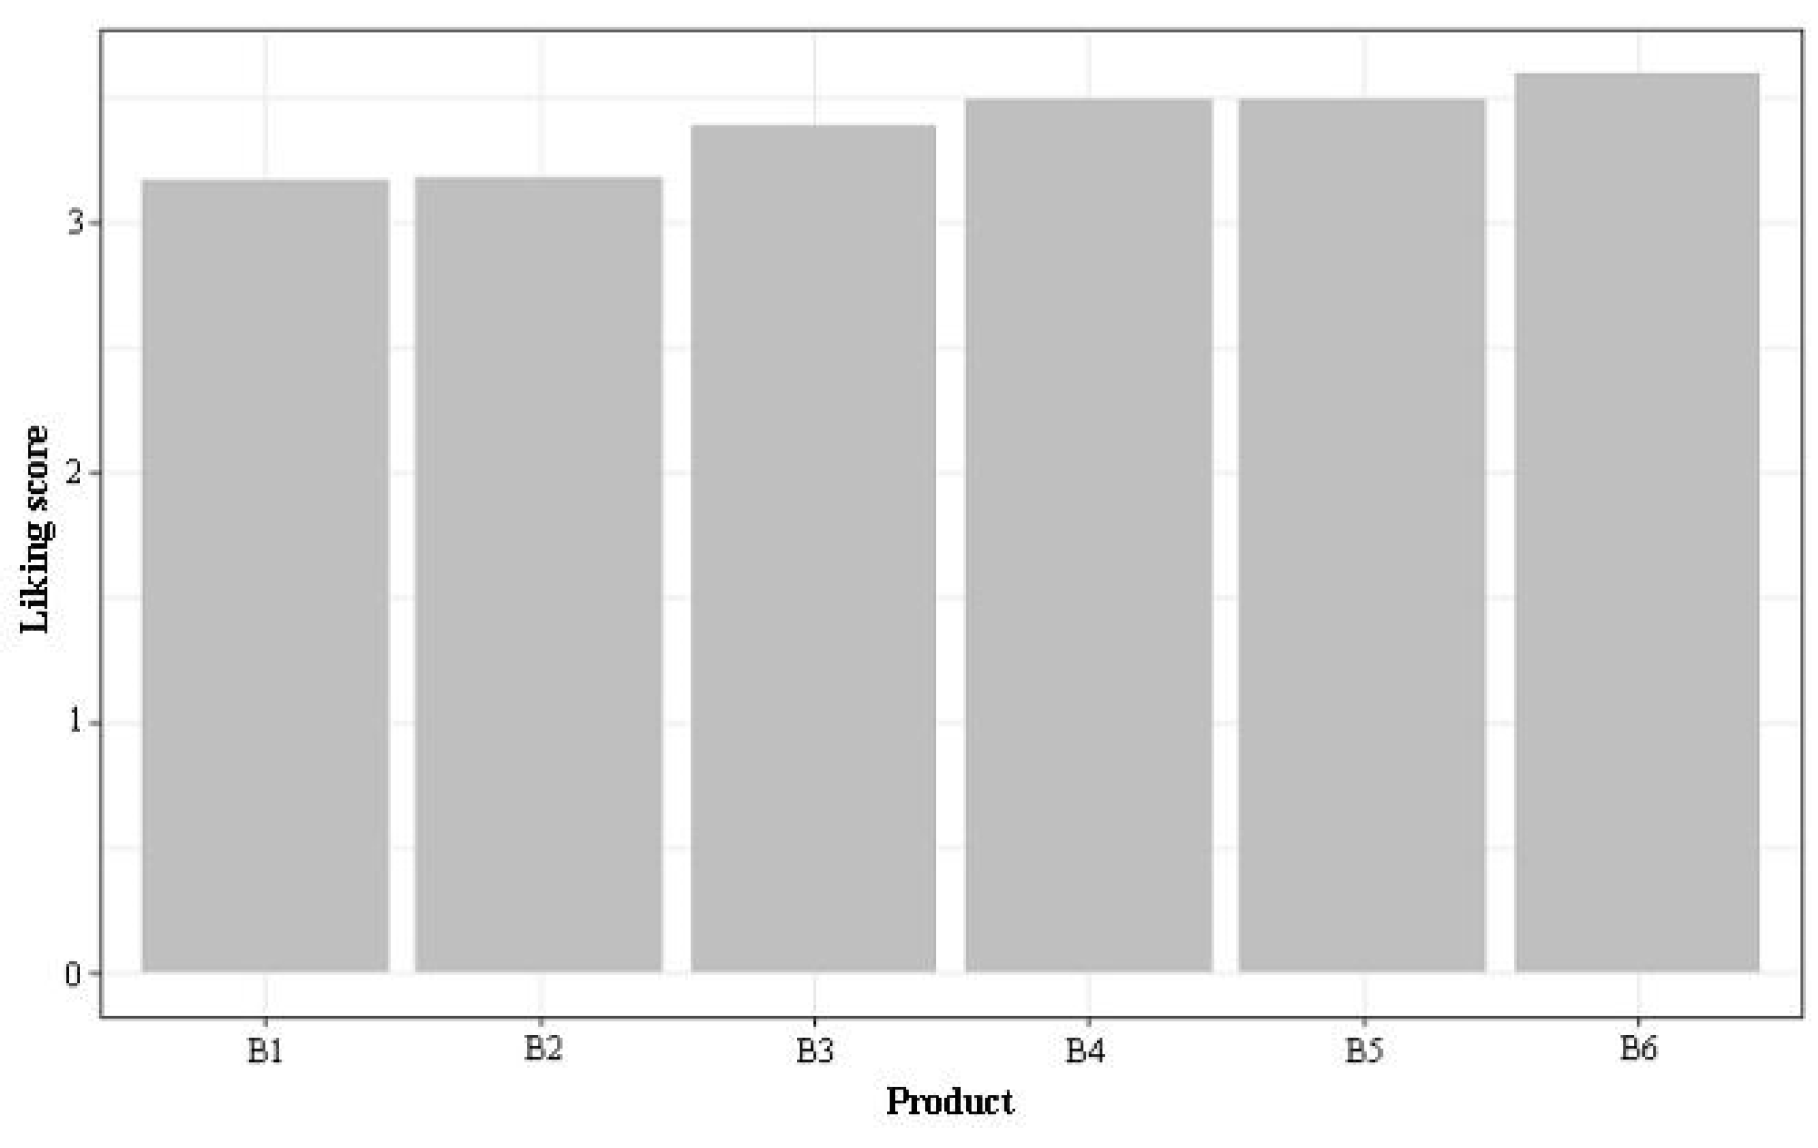
3.4. Analysis of the Overall Consumer Liking

3.4.1. Overall Consumer Liking

This study collected the liking data of 76 qualified consumers. A larger sample size could make the results more accurate and instructive, although our sample size (76) was appropriate for consumer liking, as many studies show. Berna et al. [52], Yanxin et al. [53], and Varela et al. [54] studied tomatoes, Chinese bog bilberry wines, and coffee with a sample size of 54, 93, and 96 respectively. On average, B6 was preferred, receiving a score of 3.60 on a scale of 1 to 7, followed by B2, indicating that the most preferred vinegar was still not liked much (Figure 2). A previous study showed that the satisfaction level of consumers of vinegar products was low at this stage [55]. B1 scored the lowest in liking with a value of 3.18. The liking score range of all the tested products was 0.43, suggesting that respondents provided scores in a relatively limited range. The Kruskal-Wallis test calculated that there was no significant difference between the six products at a significance level of 0.05. This could be attributed to the significant segmentation in the liking results of the respondents, as discussed subsequently. Zamora and Guirao (2004) [56] mentioned that experts gave a more consistent description of attributes than the trained panelists for different wine product brands.

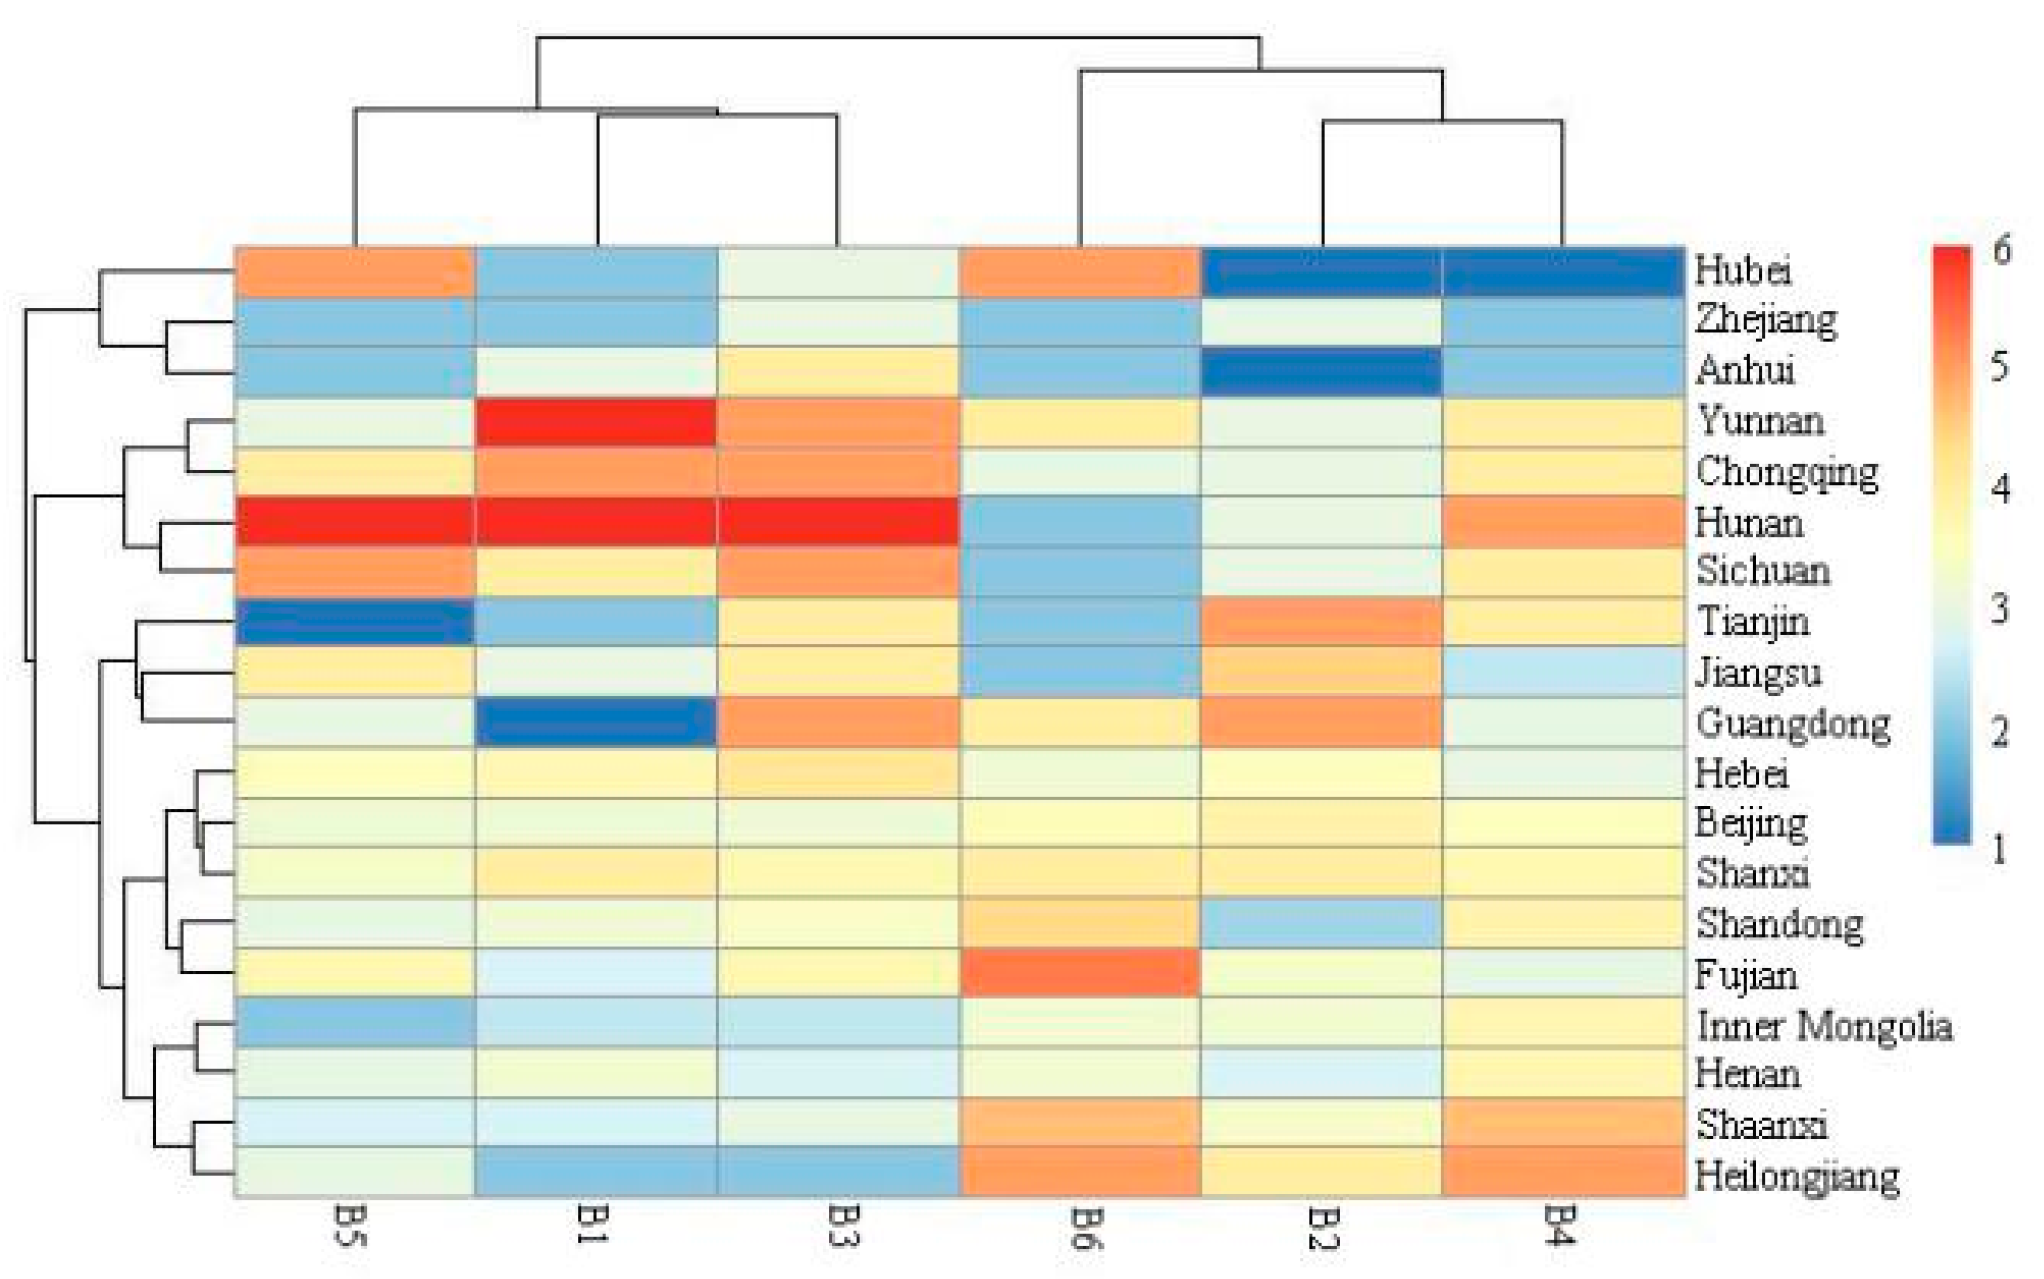
3.4.2. The Association between the Geographical Location of Consumers for the Past Ten Years and Their Likings

Figure 3 shows a heatmap representing the geographical origins of the respondents and their likings. The results yielded two distinct clusters, one containing B1, B3, and B5, while the other comprising B2, B4, and B6. Respondents from Chongqing, Hunan, and Sichuan generally showed a marked liking for B1, B3, and B5, while participants from Heilongjiang, Henan, Shaanxi, and Inner Mongolia preferred B2, B4, and B6. Respondents from Beijing, Hebei, and Shanxi exhibited lower liking differences regarding the tested products. Moreover, respondents from Hubei, Anhui, and Zhejiang displayed a less positive attitude toward most of the tested samples. Obviously, consumers from different geographical locations had different likings [57].
It should be noted that the respondents were not evenly distributed in this study, denoting an area that could be improved in further research. Here, 48% of the respondents were from Beijing or had lived in Beijing in recent years (Figure S2). This observation may not remain the same when the sample size increases, representing an interesting phenomenon derived from this dataset.

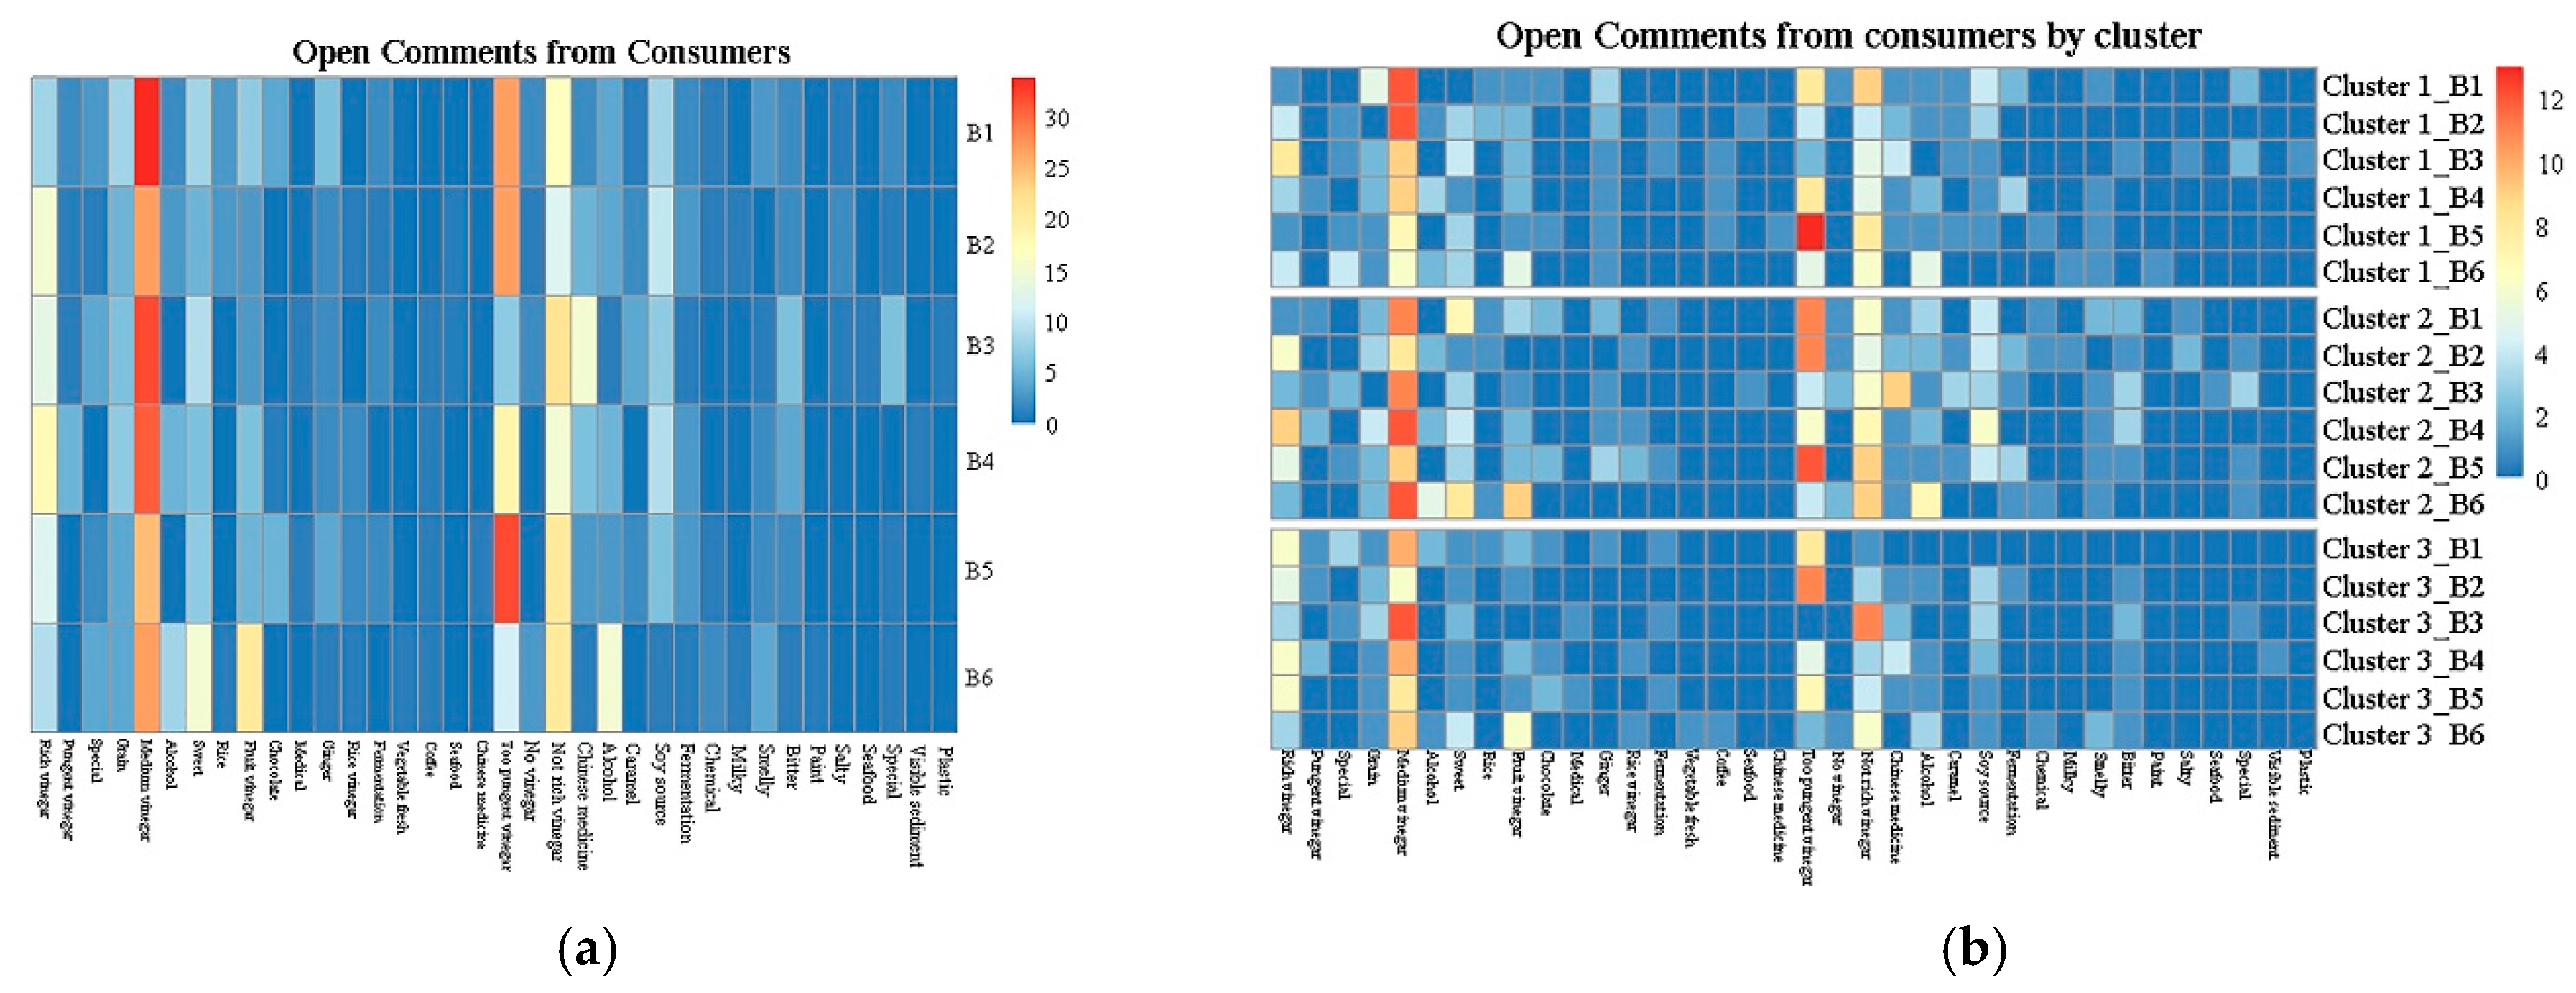
3.4.3. Open Comments from Consumers

The open comments are encompassed in Figure 4a. When describing their liking for the vinegar samples, no significant variation or specific frequency was detected in the verbiage used by the consumers, and included terms, such as “rich vinegar aroma”, “medium vinegar aroma”, “fruity vinegar aroma”, and “sweet aroma.” Consumers also mentioned terms like “too pungent vinegar aroma”, “not rich vinegar aroma”, “alcohol aroma”, and “smelly aroma.” Furthermore, the heatmap showed the differences between the six samples as per the participants.
Regarding liking, B1, B3, and B4 were more often described as presenting a “medium vinegar aroma” than the remaining samples, while more participants ascribed a “rich vinegar aroma” to B2. More consumers described B6 as “having a sweet aroma and fruity vinegar aroma” than the other samples.
Many consumers (32 out of 76) described B5 as exhibiting a “too pungent vinegar aroma”, while significantly fewer participants ascribed this characteristic to B3 and B6, when asked what they disliked about the product. Comments indicated B6 as “having an alcohol aroma” for 15 consumers out of 76, while fewer than five participants ascribe this attribute to the other samples. B3 was attributed a “Chinese medicine aroma” by 15 out 76 consumers, who disliked the characteristics of this sample, representing the highest percentage of the six products.

3.5. Consumer Liking Segmentation

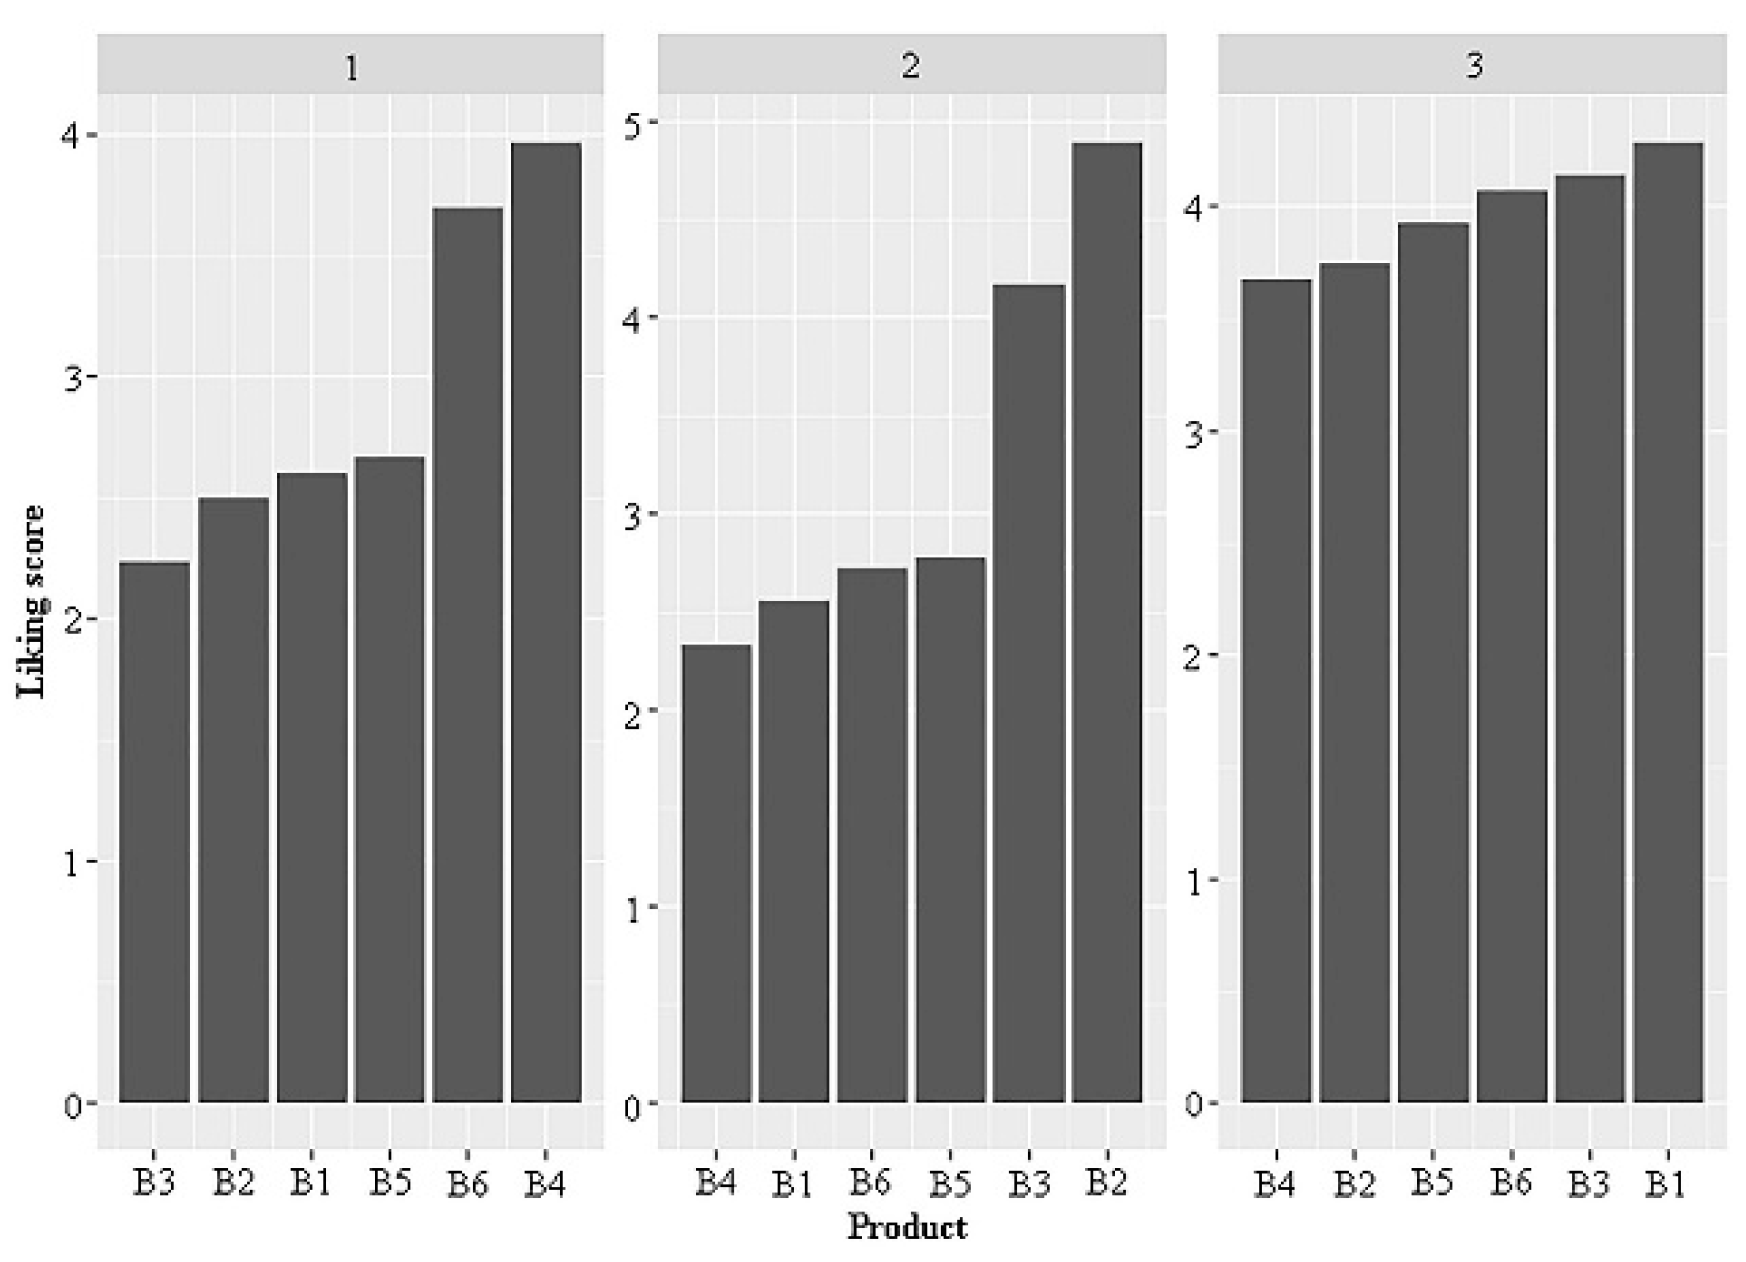
3.5.1. Overall Liking by Clusters

The consumers were clustered according to their preference patterns using k-means clustering and PCA, and the results were visualized in a 2-D map (Figure 5). The average likings of the three identified consumer clusters were displayed in the bar plot shown in Figure 6. The clusters contained 30, 18, and 28 participants, respectively. The consumers in cluster 1 generally provided lower liking scores for all the products, with average values below 4. Cluster 1 consumers favored B4 and B6 over the other samples. Cluster 2 consumers preferred B2 and B3, while cluster 3 participants favored the B1, B3, and B6 samples, with liking scores over 4.

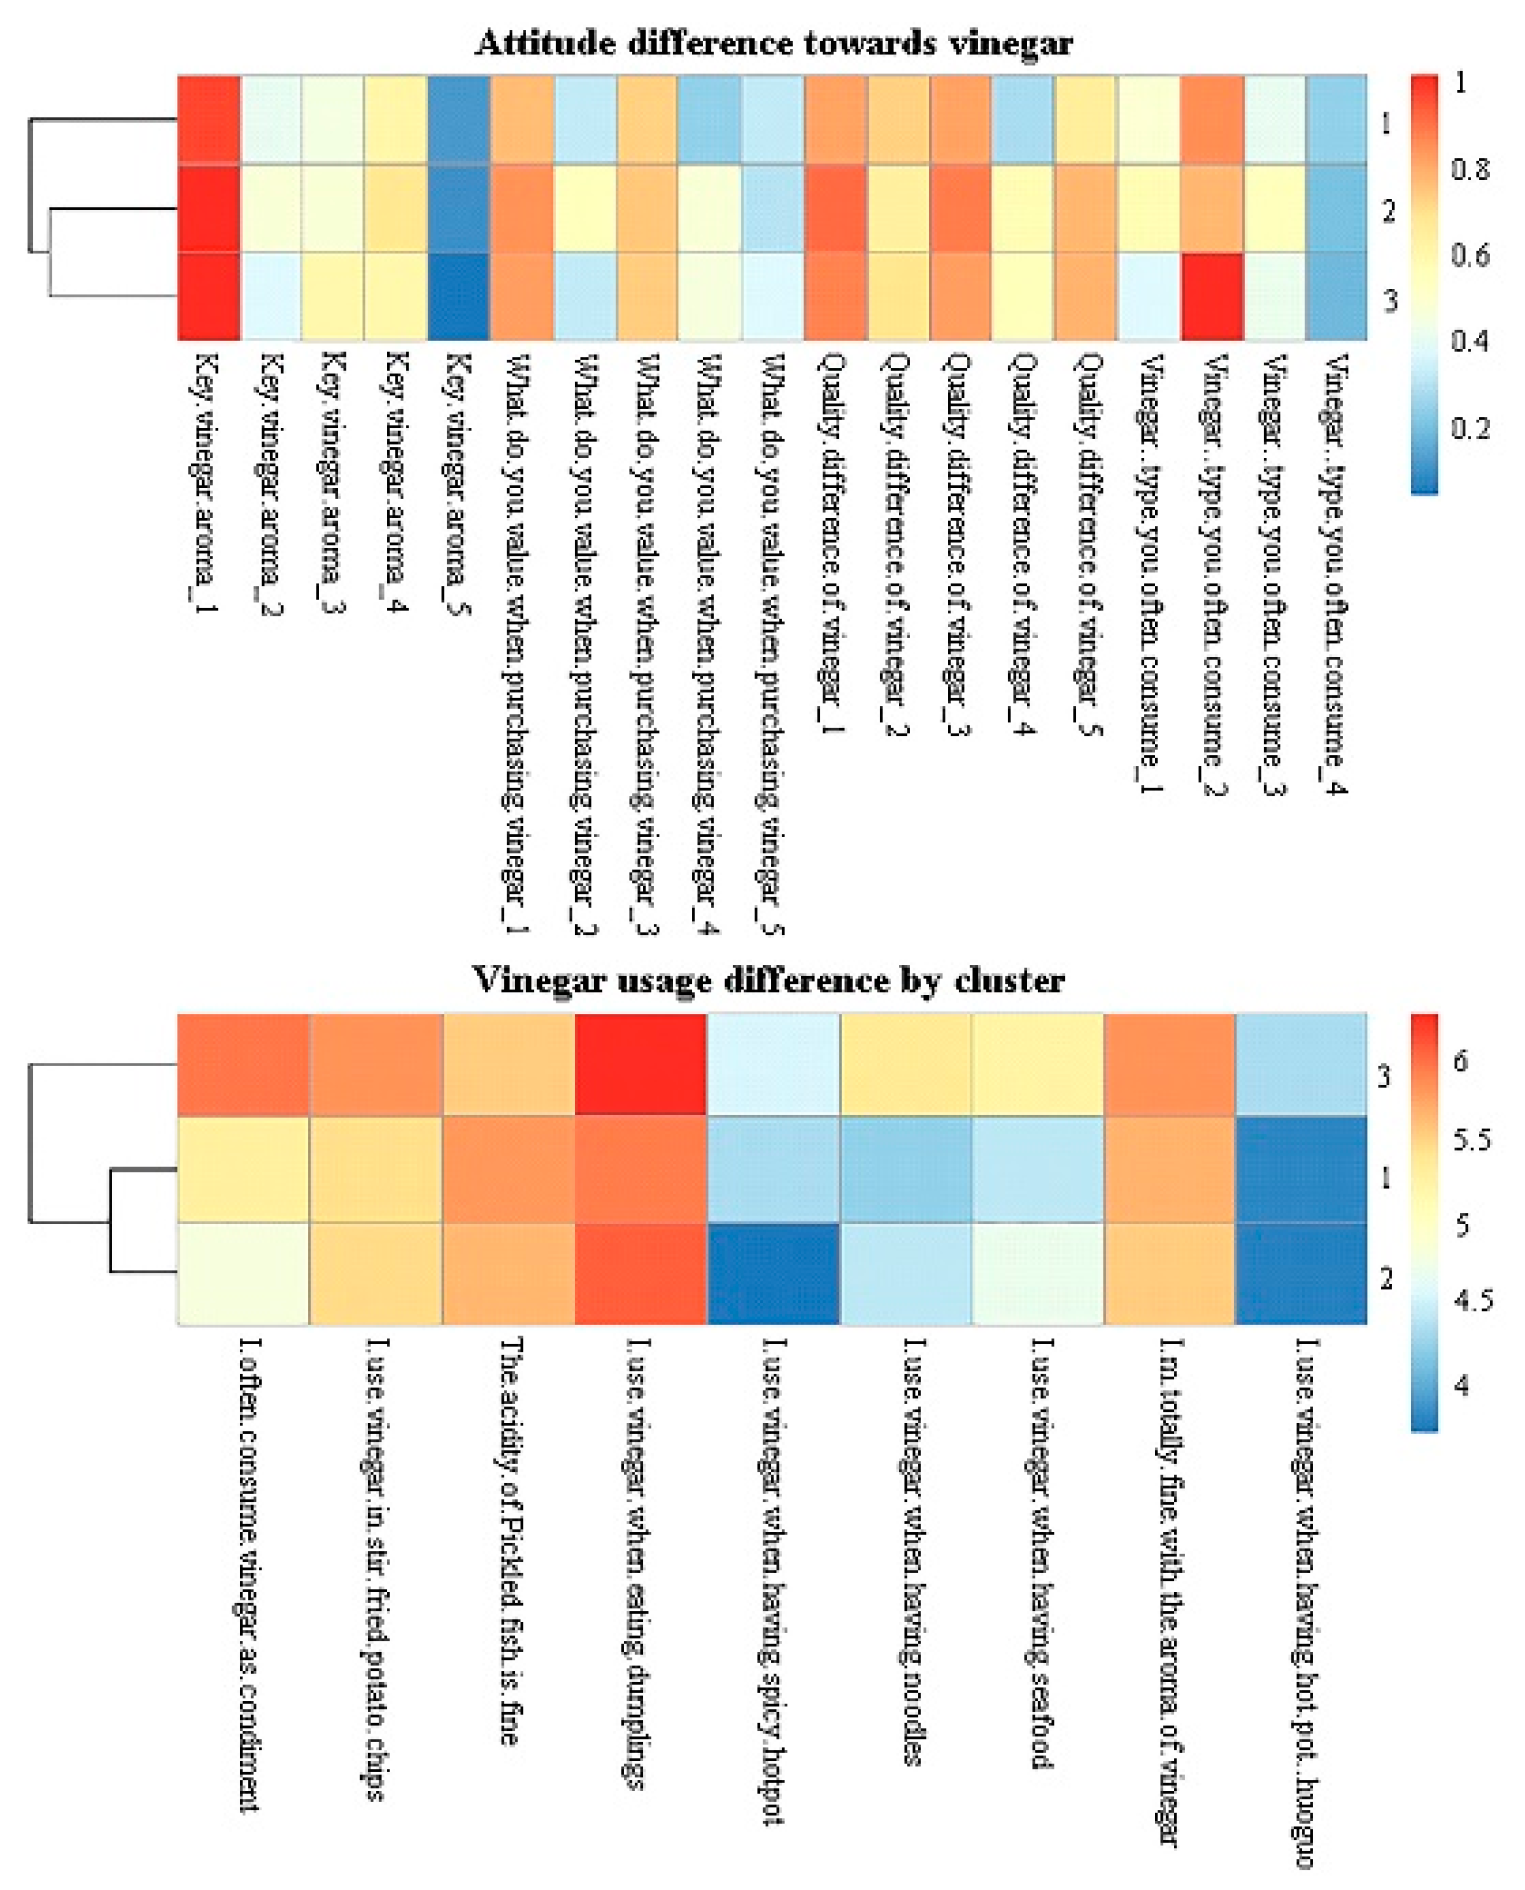
3.5.2. Cluster Differences in Demographics, Usage, and Attitude

The three consumer clusters displayed differences in attitude towards purchasing and using vinegar (Figure 7). A higher percentage of cluster 2 consumers considered the product brand essential when purchasing vinegar products than the other two clusters. Cluster 3 consumers often used vinegar as a condiment in daily life when having noodles, while cluster 1 and 2 consumers agreed to a lesser extent in this regard, indicating different vinegar utilization habits. A higher percentage of cluster 1 consumers used rice vinegar than the other clusters, and attached less importance to acidity when purchasing vinegar. A previous study showed that consumers differ in their usage and attitudes towards balsamic vinegar. Italians would pair balsamic vinegar mainly with vegetables, fruits, and cheese, while Koreans would combine balsamic vinegar preferably with bread, vegetables, and meat [58]. In this study, a lot of consumers used vinegar when eating dumplings and noodles.

3.5.3. Open Comments by Clusters

The open comment elicitation rates of each consumer cluster were visualized in a heatmap (Figure 4b). The elicitation rate pattern of the comments showed minimal differences between the clusters, which was validated by the correlation among the groups (results not shown). This consistency suggested that the consumers displayed a limited capability to distinguish and describe the aroma of the vinegar and to express their likes and dislikes.

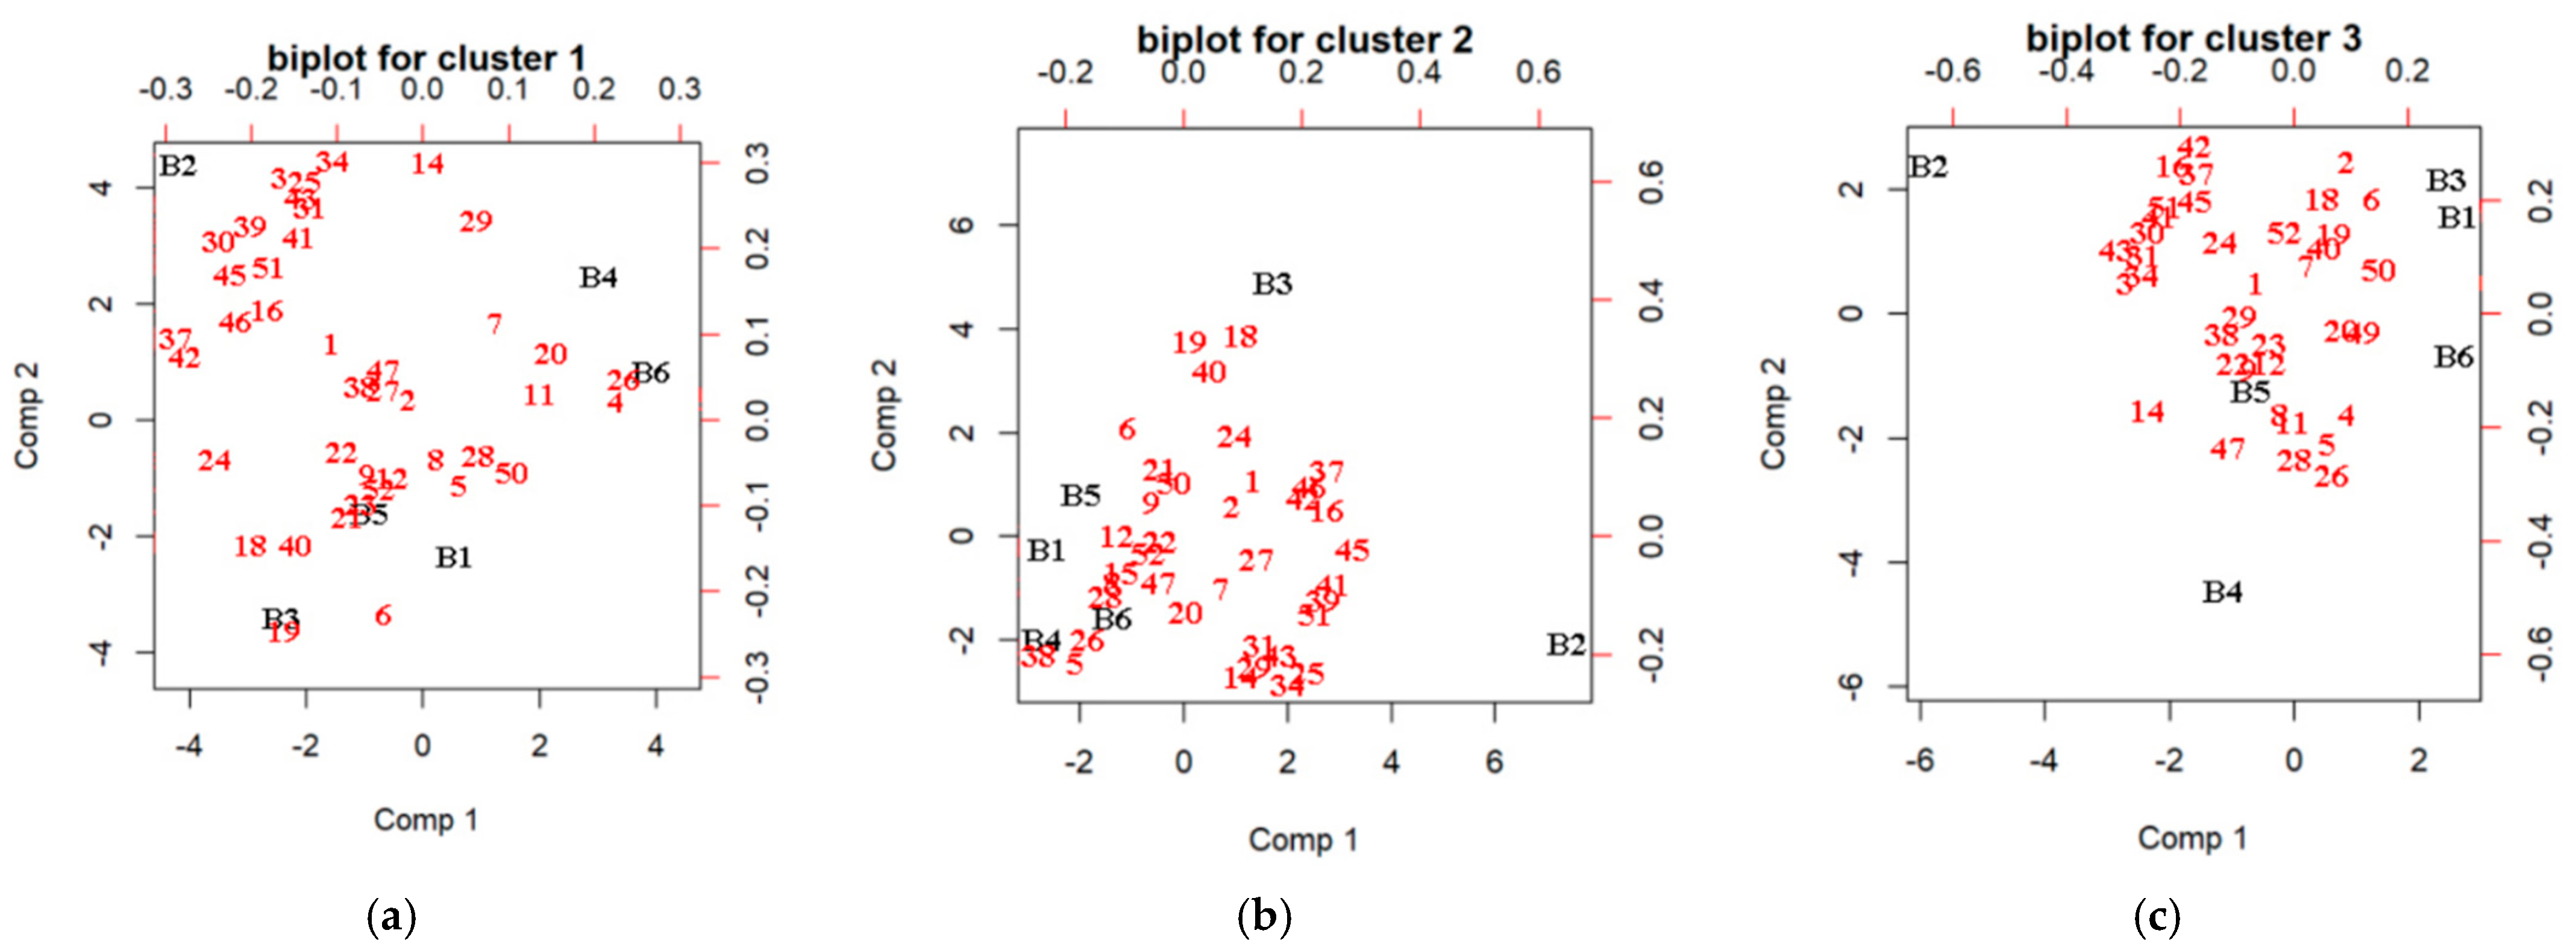
3.6. The Correlation between Consumer Liking and the Volatile Profiles of the Vinegar

PLSR was applied to investigate the correlation between the volatile profiles of the vinegar and the likings of the consumers in each cluster, to reveal the volatile chemicals responsible for favorable aroma scores. The biplot for each cluster is shown in Figure 8. The relative importance of a specific compound was calculated by its percentage of the absolute value of the coefficient in the sum of the absolute value of all coefficients. The top five most important volatiles are listed in Table 7, displaying the different volatile compounds that may drive consumer likings in the clusters. Therefore, 1-methylpyrrole-2-carboxaldehyde, ethyl acetate, acetylfuran, 1H-Pyrrole-2-carbaldehyde, and 2,3,5-trimethylpyrazine played a crucial role in the likings of cluster 1 consumers. Cluster 2 consumers were partial to benzaldehyde, phenylethanal, 3-methyl-1-butanol, 3-hydroxy-2-butanone, and ethyl acetate, while cluster 3 consumers favored products containing (2-methoxy-4-vinyl-phenyl)-acetate, 1,2-propanediol,2-acetate, isobutyl acetate, methylbutyric acid, and isoamyl acetate. Detailed regression coefficients are provided in Table S1. Jo et al. (2013) [59] reported that the highest score was observed for vinegar with moderate acidity. Cejudo-Bastante et al. (2018) [60] confirmed that for the majority of volatile compounds, higher contents were observed for the submerged culture acetification process, and this was also reflected in the sensory analysis, presenting higher scores for the different descriptors.

4. Conclusions

In this study, we used SPME-GC–MS combined with sensory evaluation to examine the association between consumer perception and volatile compounds of six types of Chinese vinegar. The results showed that 52 volatile compounds were detected by GC–MS in six types of Chinese vinegar. High concentrations of ethyl acetate, acetic acid, and phenethyl alcohol were found in all the vinegar samples. Combined with sensory evaluation, it was found that some specific volatile compounds affected consumer liking for Chinese vinegar significantly. The potato vinegar (B6) was preferred; more consumers described B6 as “having a sweet aroma and fruity vinegar aroma” than the other samples, and many consumers described the Heng-shun Jinyou balsamic vinegar (B5) as exhibiting a “too pungent vinegar aroma” when asked what they disliked about the product. For PLSR, the most important volatile compounds in the three clusters that drove consumer liking confirmed the importance of 1-methylpyrrole-2-carboxaldehyde, ethyl acetate, acetylfuran, 1H-Pyrrole-2-carbaldehyde, 2,3,5-trimethylpyrazine, benzaldehyde, phenylethanal, 3-methyl-1-butanol, 3-hydroxy-2-butanone, (2-methoxy-4-vinyl-phenyl)-acetate, 1,2-propanediol,2-acetate, isobutyl acetate, methylbutyric acid, and isoamyl acetate in Chinese vinegar. Manufacturers should pay attention to the changes in these 14 compounds and the content of the end product in the production process, and at the same time accumulate data about the correlation between compounds and consumer liking. They should subsequently change the production process using the data to improve the quality and consumer preference of vinegar.

Supplementary Materials

The following supporting information can be downloaded at: https://www.mdpi.com/article/10.3390/foods11152224/s1, Figure S1: GC–MS total ion chromatograms of Ten-year aged Qian-he cellar vinegar (a), Ning-hua-mansion old vinegar (b), East-lake health vinegar (c), Qian-he glutinous rice vinegar (d), Heng-shun Jinyou balsamic vinegar (e), and potato vinegar (f); Figure S2: Geographical distribution of respondents; Table S1: Coefficient of PLSR models for each cluster of consumers.

Author Contributions

M.Z., B.Z. and S.L. designed and managed the project. Y.L. (Ying Liu), S.Y. and Y.L. (Yixuan Liu) performed all tests and analyzed the data. S.L., Y.L. (Ying Liu) and S.Y. wrote the manuscript. S.L., Y.L. (Ying Liu), B.Z. and M.Z. revised the paper. All authors have read and agreed to the published version of the manuscript.

Funding

This research received no external funding.

Institutional Review Board Statement

Not applicable.

Informed Consent Statement

Not applicable.

Data Availability Statement

Data is contained within the article or Supplementary Materials.

Acknowledgments

The authors thank all respondents who participated in sensory evaluation.

Conflicts of Interest

The authors declare no conflict of interest.

References

  1. Nam, T.G.; Lee, J.-Y.; Kim, B.-K.; Song, N.-E.; Jang, H.W. Analyzing volatiles in brown rice vinegar by headspace solid-phase microextraction (SPME)–Arrow: Optimizing the extraction conditions and comparisons with conventional SPME. Int. J. Food Prop. 2019, 22, 1195–1204. [Google Scholar] [CrossRef] [Green Version]
  2. Sengun, I.Y.; Karabiyikli, S. Importance of acetic acid bacteria in food industry. Food Control 2011, 22, 647–656. [Google Scholar] [CrossRef]
  3. Budak, N.H.; Aykin, E.; Seydim, A.C.; Greene, A.K.; Güzel-Seydim, Z.B. Functional Properties of Vinegar. J. Food Sci. 2014, 79, R757–R764. [Google Scholar] [CrossRef]
  4. Bastante, M.J.C.; Guerrero, E.D.; Mejías, R.C.; Marín, R.N.; Dodero, M.C.R.; Barroso, C.G. Study of the Polyphenolic Composition and Antioxidant Activity of New Sherry Vinegar-Derived Products by Maceration with Fruits. J. Agric. Food Chem. 2010, 58, 11814–11820. [Google Scholar] [CrossRef] [PubMed]
  5. Ubeda, C.; Hidalgo, C.; Torija, M.; Mas, A.; Troncoso, A.; Morales, M. Evaluation of antioxidant activity and total phenols index in persimmon vinegars produced by different processes. LWT 2011, 44, 1591–1596. [Google Scholar] [CrossRef]
  6. Yıkmış, S.; Aksu, F.; Altunatmaz, S.; Çöl, B. Ultrasound Processing of Vinegar: Modelling the Impact on Bioactives and Other Quality Factors. Foods 2021, 10, 1703. [Google Scholar] [CrossRef]
  7. Yikmis, S.; Bozgeyik, E.; Levent, O.; Aksu, H. Organic cherry laurel (Prunus laurocerasus) vinegar enriched with bioactive compounds with ultrasound technology using artificial neural network (ANN) and response surface methodology (RSM): Antidiabetic, antihypertensive, cytotoxic activities, volatile profile and optical microstructure. J. Food Process. Preserv. 2021, 45, e15883. [Google Scholar]
  8. Yıkmış, S.; Bozgeyik, E.; Şimşek, M.A. Ultrasound processing of verjuice (unripe grape juice) vinegar: Effect on bioactive compounds, sensory properties, microbiological quality and anticarcinogenic activity. J. Food Sci. Technol. 2020, 57, 3445–3456. [Google Scholar] [CrossRef]
  9. Xiao, Z.; Dai, S.; Niu, Y.; Yu, H.; Zhu, J.; Tian, H.; Gu, Y. Discrimination of Chinese Vinegars Based on Headspace Solid-Phase Microextraction-Gas Chromatography Mass Spectrometry of Volatile Compounds and Multivariate Analysis. J. Food Sci. 2011, 76, C1125–C1135. [Google Scholar] [CrossRef]
  10. Cocchi, M.; Durante, C.; Grandi, M.; Manzini, D.; Marchetti, A. Three-way principal component analysis of the volatile fraction by HS-SPME/GC of aceto balsamico tradizionale of modena. Talanta 2008, 74, 547–554. [Google Scholar] [CrossRef]
  11. Wang, A.L.; Song, H.L.; Ren, C.Z.; Li, Z.G. Key aroma compounds in Shanxi aged tartary buckwheat vinegar and changes during its thermal processing. Flavour Fragr. J. 2012, 27, 47–53. [Google Scholar]
  12. Li, S.; Li, P.; Liu, X.; Luo, L.; Lin, W. Bacterial dynamics and metabolite changes in solid-state acetic acid fermentation of Shanxi aged vinegar. Appl. Microbiol. Biotechnol. 2016, 100, 4395–4411. [Google Scholar] [CrossRef]
  13. Chen, H.Y.; Zhou, Y.X.; Shao, Y.C.; Chen, F.S. Free phenolic acids in Shanxi aged vinegar: Changes during aging and synergistic antioxidant activities. Int. J. Food Prop. 2016, 19, 1183–1193. [Google Scholar] [CrossRef]
  14. Liang, J.; Xie, J.; Hou, L.; Zhao, M.; Zhao, J.; Cheng, J.; Wang, S.; Sun, B.-G. Aroma Constituents in Shanxi Aged Vinegar before and after Aging. J. Agric. Food Chem. 2016, 64, 7597–7605. [Google Scholar] [CrossRef] [PubMed]
  15. Zhou, Z.; Jian, D.; Gong, M.; Zhu, S.; Li, G.; Zhang, S.; Zhong, F.; Mao, J. Characterization of the key aroma compounds in aged Zhenjiang aromatic vinegar by gas chromatography-olfactometry-mass spectrometry, quantitative measurements, aroma recombination and omission experiments. Food Res. Int. 2020, 136, 109434. [Google Scholar] [CrossRef] [PubMed]
  16. Azarnia, S.; Boye, J.I.; Warkentin, T.; Malcolmson, L.; Sabik, H.; Bellido, A.S. Volatile flavour profile changes in selected field pea cultivars as affected by crop year and processing. Food Chem. 2011, 124, 326–335. [Google Scholar] [CrossRef]
  17. Heaven, M.W.; Nash, D. Recent analyses using solid phase microextraction in industries related to food made into or from liquids. Food Control 2012, 27, 214–227. [Google Scholar] [CrossRef]
  18. Chung, N.; Jo, Y.; Joe, M.-H.; Jeong, M.-H.; Jeong, Y.-J.; Kwon, J.-H. Rice vinegars of different origins: Discriminative characteristics based on solid-phase microextraction and gas chromatography with mass spectrometry, an electronic nose, electronic tongue and sensory evaluation. J. Inst. Brew. 2017, 123, 159–166. [Google Scholar] [CrossRef]
  19. Saldaña, E.; Garcia, A.D.O.; Selani, M.M.; Haguiwara, M.M.; de Almeida, M.A.; Siche, R.; Contreras-Castillo, C.J. A sensometric approach to the development of mortadella with healthier fats. Meat Sci. 2018, 137, 176–190. [Google Scholar] [CrossRef]
  20. Selani, M.M.; Shirado, G.A.; Margiotta, G.B.; Rasera, M.L.; Marabesi, A.C.; Piedade, S.M.; Contreras-Castillo, C.J.; Canniatti-Brazaca, S.G. Pineapple by-product and canola oil as partial fat replacers in low-fat beef burger: Effects on oxidative stability, cholesterol content and fatty acid profile. Meat Sci. 2016, 115, 9–15. [Google Scholar] [CrossRef]
  21. Kleij, F.T.; Musters, P.A. Text analysis of open-ended survey responses: A complementary method to preference mapping. Food Qual. Prefer. 2003, 14, 43–52. [Google Scholar] [CrossRef]
  22. Varela, P.; Ares, G. Sensory profiling, the blurred line between sensory and consumer science. A review of novel methods for product characterization. Food Res. Int. 2012, 48, 893–908. [Google Scholar] [CrossRef]
  23. Hannum, M.E.; Forzley, S.; Popper, R.; Simons, C.T. Application of the Engagement Questionnaire (EQ) to compare methodological differences in sensory and consumer testing. Food Res. Int. 2020, 140, 110083. [Google Scholar] [CrossRef] [PubMed]
  24. Manstan, T.; Chandler, S.L.; McSweeney, M.B. Consumers’ attitudes towards 3D printed foods after a positive experience: An exploratory study. J. Sens. Stud. 2020, 36, 12619. [Google Scholar] [CrossRef]
  25. Spinelli, S.; Dinnella, C.; Masi, C.; Zoboli, G.P.; Prescott, J.; Monteleone, E. Investigating preferred coffee consumption contexts using open-ended questions. Food Qual. Prefer. 2017, 61, 63–73. [Google Scholar] [CrossRef]
  26. Saldaña, E.; Saldarriaga, L.; Cabrera, J.; Siche, R.; Behrens, J.H.; Selani, M.M.; de Almeida, M.A.; Silva, L.D.; Pinto, J.S.S.; Contreras-Castillo, C.J. Relationship between volatile compounds and consumer-based sensory characteristics of bacon smoked with different Brazilian woods. Food Res. Int. 2019, 119, 839–849. [Google Scholar] [CrossRef]
  27. Yu, H.; Guo, W.; Xie, T.; Ai, L.; Tian, H.; Chen, C. Aroma characteristics of traditional Huangjiu produced around Winter Solstice revealed by sensory evaluation, gas chromatography–mass spectrometry and gas chromatography–ion mobility spectrometry. Food Res. Int. 2021, 145, 110421. [Google Scholar] [CrossRef]
  28. Wu, Y.; Pan, Q.; Qu, W.; Duan, C. Comparison of volatile profiles of nine litchi (Litchi chinensis Sonn.) cultivars from Southern China. J. Agric. Food Chem. 2009, 57, 9676–9681. [Google Scholar] [CrossRef]
  29. Wen, Y.-Q.; He, F.; Zhu, B.-Q.; Lan, Y.; Pan, Q.-H.; Li, C.-Y.; Reeves, M.J.; Wang, J. Free and glycosidically bound aroma compounds in cherry (Prunus avium L.). Food Chem. 2014, 152, 29–36. [Google Scholar] [CrossRef]
  30. Sun, J.; Li, Q.; Luo, S.; Zhang, J.; Huang, M.; Chen, F.; Zheng, F.; Sun, X.; Li, H. Characterization of key aroma compounds in Meilanchun sesame flavor style baijiu by application of aroma extract dilution analysis, quantitative measurements, aroma recombination, and omission/addition experiments. RSC Adv. 2018, 8, 23757–23767. [Google Scholar] [CrossRef] [Green Version]
  31. Zhao, G.; Kuang, G.; Li, J.; Hadiatullah, H.; Chen, Z.; Wang, X.; Yao, Y.; Pan, Z.-H.; Wang, Y. Characterization of aldehydes and hydroxy acids as the main contribution to the traditional Chinese rose vinegar by flavor and taste analyses. Food Res. Int. 2020, 129, 108879. [Google Scholar] [CrossRef] [PubMed]
  32. Yuan, X.D.; Yan, R.; Ma, Y.K.; Ma, S.L.; Zhang, L.; Xu, Y.; Ma, H. Aromatic compounds in Zhenjiang fragrant vinegar after high pressure treatment by SPME-GC-MS. Food Sci. Technol. 2012, 37, 263–269. [Google Scholar]
  33. Liu, D.R.; Zhu, Y.; Beeftink, R.; Ooijkaas, L.; Rinzema, A.; Chen, J.; Tramper, J. Chinese vinegar and its solid-state fermentation process. Food Rev. Int. 2004, 20, 407–424. [Google Scholar] [CrossRef]
  34. Lu, S.; Cao, Y.; Yang, Y.; Jin, Z.; Luo, X. Effect of fermentation modes on nutritional and volatile compounds of Huyou vinegar. J. Food Sci. Technol. 2018, 55, 2631–2640. [Google Scholar] [CrossRef]
  35. Ma, Y.K.; Wei, Y.Y.; Jiang, J.K.; Sun, L.L.; Xia, R.; Xu, K.P. Study on Analysis of Aroma Components and Their Formation Mechanisms of Different Aged Zhenjiang Frangrance Vinegars. Food Sci. 2006, 27, 504–507. [Google Scholar]
  36. Sun, Z.B.; Fan, Y.P.; Ji, P. Comparative study on the flavor compounds of three brands of Zhenjiang aromatic vinegar analyzed by SPME-GC-MS-O. China Condiment 2015, 40, 26–29. [Google Scholar]
  37. Su, M.-S.; Chien, P.-J. Aroma impact components of rabbiteye blueberry (Vaccinium ashei) vinegars. Food Chem. 2010, 119, 923–928. [Google Scholar] [CrossRef]
  38. Tesfaye, W.; García-Parrilla, M.; Troncoso, A. Sensory evaluation of sherry wine vinegar. J. Sens. Stud. 2002, 17, 133–144. [Google Scholar] [CrossRef]
  39. Zhang, X.; Wang, P.; Xu, D.; Wang, W.; Zhao, Y. Aroma patterns of Beijing rice vinegar and their potential biomarker for traditional Chinese cereal vinegars. Food Res. Int. 2019, 119, 398–410. [Google Scholar] [CrossRef] [PubMed]
  40. Genovese, A.; Gambuti, A.; Piombino, P.; Moio, L. Sensory properties and aroma compounds of sweet Fiano wine. Food Chem. 2007, 103, 1228–1236. [Google Scholar] [CrossRef]
  41. Frank, S.; Wollmann, N.; Schieberle, P.; Hofmann, T. Reconstitution of the Flavor Signature of Dornfelder Red Wine on the Basis of the Natural Concentrations of Its Key Aroma and Taste Compounds. J. Agric. Food Chem. 2011, 59, 8866–8874. [Google Scholar] [CrossRef] [PubMed]
  42. Zhou, Z.; Liu, S.; Kong, X.; Ji, Z.; Han, X.; Wu, J.; Mao, J. Elucidation of the aroma compositions of Zhenjiang aromatic vinegar using comprehensive two dimensional gas chromatography coupled to time-of-flight mass spectrometry and gas chromatography-olfactometry. J. Chromatogr. A 2017, 1487, 218–226. [Google Scholar] [CrossRef]
  43. Liu, M.Y.; Liu, J.B.; Cong-Cong, H.E.; Song, H.L.; Wang, Y.; Guo, J. Use of GC-O-MS to Identify Key Aroma Compounds in Dark Chocolate. Mod. Food Sci. Technol. 2013, 29, 2311–2316. [Google Scholar]
  44. Al-Dalali, S.; Zheng, F.; Sun, B.; Chen, F. Comparison of Aroma Profiles of Traditional and Modern Zhenjiang Aromatic Vinegars and Their Changes During the Vinegar Aging by SPME-GC-MS and GC-O. Food Anal. Methods 2019, 12, 544–557. [Google Scholar] [CrossRef]
  45. Chen, Y.Y.; Wu, Y.; Liu, X.G. The regulation and application of acetoin biosynthesis. J. Biol. 2014, 31, 76–80, 84. [Google Scholar]
  46. Al-Dalali, S.; Zheng, F.; Sun, B.; Chen, F.; Wang, P.; Wang, W. Determination of the aroma changes of Zhengrong vinegar during different processing steps by SPME–GC–MS and GC-O. J. Food Meas. Charact. 2020, 14, 535–547. [Google Scholar] [CrossRef]
  47. Aida, T.M.; Sato, Y.; Watanabe, M.; Tajima, K.; Nonaka, T.; Hattori, H.; Arai, K. Dehydration of d-glucose in high temperature water at pressures up to 80MPa. J. Supercrit. Fluids 2007, 40, 381–388. [Google Scholar] [CrossRef]
  48. Rocha, S.; Ramalheira, V.; Barros, A.; Delgadillo, I.; Coimbra, M.A. Headspace Solid Phase Microextraction (SPME) Analysis of Flavor Compounds in Wines. Effect of the Matrix Volatile Composition in the Relative Response Factors in a Wine Model. J. Agric. Food Chem. 2001, 49, 5142–5151. [Google Scholar] [CrossRef] [Green Version]
  49. Xing, X.; Wang, Y.; Huo, N.; Wang, R. Candida Ethanolica Strain Y18 Enhances Aroma of Shanxi Aged-vinegar. Food Sci. Technol. Res. 2018, 24, 1069–1081. [Google Scholar] [CrossRef]
  50. Ubeda, C.; Callejón, R.M.; Troncoso, A.M.; Moreno-Rojas, J.M.; Peña, F.; Morales, M.L. Characterization of odour active compounds in strawberry vinegars. Flavour Fragr. J. 2012, 27, 313–321. [Google Scholar] [CrossRef]
  51. Liu, L.; Chen, Y.; Luo, Q.; Xu, N.; Zhou, M.; Gao, B.; Wang, C.; Shi, Y. Fermenting liquid vinegar with higher taste, flavor and healthy value by using discarded Cordyceps militaris solid culture medium. LWT 2018, 98, 654–660. [Google Scholar] [CrossRef]
  52. Berna, A.Z.; Lammertyn, J.; Buysens, S.; Di Natale, C.; Nicolaï, B.M. Mapping consumer liking of tomatoes with fast aroma profiling techniques. Postharvest Biol. Technol. 2005, 38, 115–127. [Google Scholar] [CrossRef]
  53. Yanxin, L.; Yaran, L.; Shuxun, L.; Kortesniemi, M.; Jiani, L.; Baoqing, Z.; Laaksonen, O. Sensory and chemical characterization of Chinese bog bilberry wines using Check-all-that-apply method and GC-Quadrupole-MS and GC-Orbitrap-MS analyses. Food Res. Int. 2022, 151, 110809. [Google Scholar]
  54. Varela, P.; Beltrán, J.; Fiszman, S. An alternative way to uncover drivers of coffee liking: Preference mapping based on consumers’ preference ranking and open comments. Food Qual. Prefer. 2014, 32, 152–159. [Google Scholar] [CrossRef]
  55. Lu, Y.; Huicong, X.; Baichuan, W.; Longqi, D.; Jianhui, Y.; Chengguo, W. Analysis of consumers′ purchasing habits and satisfaction for vinegar products-based on the perspective of consumers in Yantai. Food Ind. 2021, 230–234. [Google Scholar]
  56. Zamora, M.C.; Guirao, M. Performance Comparison between Trained Assessors and Wine Experts Using Specific Sensory Attributes. J. Sens. Stud. 2004, 19, 530–545. [Google Scholar] [CrossRef]
  57. Clark, S.; Warner, H.; Luedecke, L. Acceptability of queso fresco cheese by traditional and nontraditional consumers. Food Sci. Technol. Int. 2001, 7, 165–170. [Google Scholar] [CrossRef]
  58. Torri, L.; Jeon, S.-Y.; Piochi, M.; Morini, G.; Kim, K.-O. Consumer perception of balsamic vinegar: A cross-cultural study between Korea and Italy. Food Res. Int. 2017, 91, 148–160. [Google Scholar] [CrossRef]
  59. Jo, D.; Kim, G.-R.; Yeo, S.-H.; Jeong, Y.-J.; Noh, B.S.; Kwon, J.-H. Analysis of aroma compounds of commercial cider vinegars with different acidities using SPME/GC-MS, electronic nose, and sensory evaluation. Food Sci. Biotechnol. 2013, 22, 1559–1565. [Google Scholar] [CrossRef]
  60. Cejudo-Bastante, C.; Durán-Guerrero, E.; García-Barroso, C.; Castro-Mejías, R. Comparative study of submerged and surface culture acetification process for orange vinegar. J. Sci. Food Agric. 2018, 98, 1052–1060. [Google Scholar] [CrossRef]
Figure 1. Principal component analysis model of the key aroma compounds in different vinegar samples. The sample codes correspond with Table 1. The number of compounds corresponds with Table 2.
Foods 11 02224 g001
Figure 2. Average liking scores of 76 qualified consumers for six kinds of vinegar. The vinegar code corresponds with Table 1.
Foods 11 02224 g002
Figure 3. The heatmap of respondents’ liking scores for six kinds of vinegar in different regions. The code of vinegar corresponds with Table 1. These regions are explained in the supplementary data (Figure S2).
Foods 11 02224 g003
Figure 4. The heatmaps of open comments from all consumers (a) and each cluster (b). The code of vinegar corresponds with Table 1. The left 18 columns were the terms that consumers liked, and the right 18 columns were the terms that consumers disliked.
Foods 11 02224 g004
Figure 5. The 2-D map of the consumer liking pattern according to their preference patterns using k-means clustering and PCA.
Foods 11 02224 g005
Figure 6. The bar plot of average liking scores by three clusters of consumers for products (n = 30 for cluster 1, n = 18 for cluster 2 and n = 28 for cluster 3). The vinegar code corresponds with Table 1.
Foods 11 02224 g006
Figure 7. The heatmap of three clusters of consumers reflecting attitudes towards purchasing and using vinegar (n = 30 for cluster 1, n = 18 for cluster 2 and n = 28 for cluster 3).
Foods 11 02224 g007
Figure 8. The biplot of each cluster (ac) by partial least squares regression analysis (n = 30 for cluster 1, n = 18 for cluster 2 and n = 28 for cluster 3). The vinegar code corresponds with Table 1. The number of compounds corresponds with Table 2.
Foods 11 02224 g008
Table 1. Detailed information on six kinds of Chinese vinegar.
CodeB1B2B3B4B5B6
Product nameTen-year aged Qian-he cellar vinegarNing-hua-mansion old vinegarEast-lake health vinegarQian-he glutinous rice vinegarHeng-shun Jinyou balsamic vinegarPotato vinegar
Net content
(mL)
5005005005003601750
IngredientsWater, glutinous rice, wheat, sorghum, corn, buckwheat, edible salt, sugarDrinking water, sorghum, bran, rice husk, daqu (barley, peas), edible salt, spicesWater, sorghum, barley, peas, honey, dates, peanuts, licorice, hawthorn, sugarWater, glutinous rice, rice, wheat bran, edible salt, sugarWater, glutinous rice, wheat bran, edible salt, sugarDrinking water, potato, edible salt, food additive (sodium benzoate)
Product standard NoGB/18187SSFGB/18187SSFGB19777SSFGB/T18187SSFGB/T18187SSFGB/T18187SSF
Goods originMeishan, Sichuan ProvinceTaiyuan, Shanxi ProvinceTaiyuan, Shanxi ProvinceMeishan, Sichuan ProvinceZhenjiang, Jiangsu ProvinceUlanqab, Inner Mongolia
Product typeMature vinegarMature vinegarHealth vinegarAromatic vinegarAromatic vinegarPotato vinegar
Table 2. Relevant information of gas chromatography–mass spectrometry (GC–MS) analysis on vinegar compounds.
No.CompoundRIMethod of IdentificationClassQuantitative IonAroma Description Odor Threshold (μg/L)
1ethyl acetate878MS, RIEster43sweet, etheric, fruity, grape, rum5000
2ethyl propionate958MS, RIEster75sweet, fruity, grape, ether, rum, pineapple10
3n-propyl acetate974MS, RIEster43pleasant, solvent, sweet fruit150,000
4isobutyl acetate1012MS, RIEster43sweet, apple, banana, fruity66
5isoamyl acetate1110MS, RIEster43sweet, pear, banana, fruity
61,2-propanediol,2-acetate1621MS, RIEster43
7trimethylene acetate1665MS, RIEster4311
8ethyl benzoate1681MS, RIEster105sweet, fruity, fragrant60
9diethyl succinate1680MS, RIEster101weak pleasing aroma2000
10ethyl phenylacetate1770MS, RIEster91sweet, fruity, cocoa, floral scent, honey aroma650
11β-phenethyl acetate1788MS, RIEster104sweet, green, floral, fruity, citrus, honey3900
123-methylbutyraldehyde924MS, RIAldehyde44apple, chocolate, cocoa
13nonanal1386MS, RIAldehyde57fat, floral, waxy, citrus1
14benzaldehyde1520MS, RIAldehyde77almonds, cherries, nuts, woody3500
15phenylethanal1638MS, RIAldehyde91green, earthy, chocolate4
161H-pyrrole-2-carbaldehyde2009MS, RIAldehyde95
175-methyl-2-phenyl-2-hexenal2060MS, RIAldehyde117bitter cocoa, nuts, honey, baking and grassy notes
181-methylpyrrole-2-carboxaldehyde2009MS, RIAldehyde95
19acetic acid1449MS, RIAcid60strong sour taste2200
20propionic acid1522MS, RIAcid74spicy and sour20,000
21butyric acid1620MS, RIAcid60cheese, milk, cream, fruity240
22isovaleric acid1680MS, RIAcid60cheese, products, fruity700
232-methylbutyric acid1685MS, RIAcid74pungent and spicy Roquefort20
24caproic acid1880MS, RIAcid60green, woody, grassy, vegetable, meaty, fruity3000
25octanoic acid2100MS, RIAcid60sweet3000
263-methyl-1-butanol1185MS, RIAlcohol55apple, banana, whiskey30,000
272,3-butanediol1584MS, RIAlcohol45sweet, butter, butter100,000
28phenethyl alcohol1890MS, RIAlcohol91sweet, green, floral, fresh bread aroma750
293-hydroxy-2-butanone1270MS, RIKetone45140
30acetophenone1656MS, RIKetone105cream, fat65
312-pyrrolidinone2037MS, RIKetone42strong medicinal, almond
32guaiacol1862MS, RIPhenol109smoked, spicy, fragrant, meaty, woody21
332-ethyl-3-hydroxy-4H-pyran-4-one2052MS, RIPhenol140fruity, caramel
344-ethyl-2-methoxyphenol2031MS, RIPhenol137sweet, spicy, herbal
354-ethylphenol2199MS, RIPhenol107strong phenolic smell, slightly sweet aroma
36furfural1462MS, RIFuran96strong phenolic smell, slightly sweet aroma3000
37acetylfuran1508MS, RIFuran95baked incense, smoky10,000
38furfuryl acetate1525MS, RIFuran81ester, floral
391-pentanone, 1-(2-furanyl)-1563MS, RIFuran956
403-furanmethanol1679MS, RIFuran98caramel
411-(5-methyl-2-furyl)ethan-1-one1606MS, RIFuran109biscuits, roasted almonds
424-(2-furyl)-3-buten-2-one1879MS, RIFuran121sweet, powdery, nutty, creamy, woody cinnamon
435-acetyldihydrofuran-2(3H)-one2160MS, RIFuran85sweet, lemon green65
442-methylpyrazine1266MS, RIPyrazine94nuts, peanuts, roasted incense, soily, mildew60
452,3-dimethyl pyrazine1356MS, RIPyrazine67mildew, roasted, creamy, nuts, cocoa, coffee2500
462,3,5-trimethylpyrazine1415MS, RIPyrazine42baked potatoes, fried peanuts, nuts, earthy notes, fermented400
471,3-dioxolane,2,4,5-trimethyl-967MS, RIOthers44
481,3-dioxane, 2-methyl-1044MS, RIOthers87
49naphthalene1744MS, RIOthers128aromatic odor, coal tar smell1500
502-methylnaphthalene1839MS, RIOthers142aromatic odor, coal tar, camphor, chemicals
512-phenylthiophene2124MS, RIOthers160
524-acetoxy-3-methoxystyrene2235MS, RIOthers150
MS: mass spectra; RI: retention indice; Both agreed with database of NIST11; Odor thresholds were from the literature [32].
Table 3. Relevant information of the standard curve on vinegar compounds.
No.CompoundClassPuritySupplierLinear Range(μg/L)
LOQ/LOD
FormulaR2
1ethyl acetateEster0.998Sigma-Aldrich121,137/40,379y = 30.114x − 191,619R2 = 0.9811
5isoamyl acetateEster0.95Sigma-Aldrich433.125/144.375y = 0.0102x − 31.932R2 = 0.918
9diethyl succinateEster0.99Sigma-Aldrich99.9375/33.3125y = 0.0081x − 4.7535R2 = 0.9829
14benzaldehydeAldehyde0.99Sigma-Aldrich300/100y = 0.0068x − 188.12R2 = 0.9911
20propionic acidAcid0.995Sigma-Aldrich6135/2045y = 0.5732x + 1246.3R2 = 0.9697
22isovaleric acidAcid0.99Sigma-Aldrich116.25/38.75y = 0.0012x + 13.158R2 = 0.9939
24caproic acidAcid0.995Sigma-Aldrich2437.5/812.5y = 0.0911x + 507.9R2 = 0.9661
25octanoic acidAcid0.99Sigma-Aldrich6761.25/2253.75y = 0.0438x + 902R2 = 0.9837
28phenethyl alcoholAlcohol0.99Sigma-Aldrich30,825/10,275y = 0.1457x − 18,131R2 = 0.9953
Table 4. Content information of vinegar compounds (μg/L).
No.B1 aB2B3B4B5B6
1130,650.99 ± 6636.18 a625,514.35 ± 1291.87 e783,331.79 ± 6806.85 f571,951.58 ± 3619.70 d304,167.86 ± 5632.55 b467,917.75 ± 8154.52 c
21181.77 ± 4.53 b1704.31 ± 14.55 c1734.33 ± 10.94 c221.56 ± 8.28 a223.86 ± 4.31 a2271.78 ± 47.05 d
3751.54 ± 38.69 a5244.03 ± 76.36 c399.66 ± 23.07 a2123.75 ± 34.38 b1792.44 ± 61.09 b812.39 ± 536.96 a
4740.49 ± 7.53 f126.34 ± 1.17 b16.24 ± 0.18 a637.52 ± 6.18 e278.41 ± 2.77 c472.90 ± 30.91 d
521,239.27 ± 78.78 d3100.82 ± 47.47 atr22,149.40 ± 183.22 e7331.81 ± 70.42 b11,597.80 ± 2340.62 c
6344,314.42 ± 3037.80 d8624.00 ± 193.86 a b208,404.31 ± 1309.92 c6464.71 ± 627.42 a8724.21 ± 206.27 a b11,842.14 ± 825.47 b
7159.27 ± 6.92 a1357.87 ± 113.19 c761.25 ± 39.64 b138.21 ± 18.20 a152.63 ± 2.70 a2898.76 ± 2.70 d
82496.29 ± 5.54 d768.78 ± 3.38 c57.64 ± 15.06 a2766.54 ± 4.32 e4425.84 ± 3.75 f134.63 ± 36.13 b
9607.73 ± 1.70 a1786.03 ± 57.56 c1354.23 ± 92.26 b1881.49 ± 200.04 d11,395.23 ± 347.24 etr
10trtrtrtrtrtr
110.45 ± 0.19 btrtr0.62 ± 0.16 b1.47 ± 0.30 ctr
1239,262.87 ± 58.38 e22,572.34 ± 19.84 c19,246.37 ± 27.46 b35,396.43 ± 20.06 d44,409.15 ± 95.67 f3022.45 ± 337.71 a
13trtrtrtrtrtr
141150.98 ± 2.29 a6667.33 ± 10.79 e2167.45 ± 12.54 b7281.14 ± 0.96 f2704.11 ± 11.99 c3383.24 ± 156.20 d
1516,618.10 ± 34.91 c13,683.19 ± 2.56 b16,136.22 ± 62.54 c23,161.05 ± 76.12 d14,106.61 ± 38.35 b12,303.69 ± 556.86 a
161982.62 ± 135.83 b14,611.62 ± 877.44 d7735.74 ± 1024.88 c1439.58 ± 89.46 a b2466.34 ± 16.66 b223.47 ± 7.66 a
17trtrtrtrtrtr
1836.40 ± 2.62 a135.69 ± 7.68 a489.55 ± 108.62 b27.11 ± 1.55 a92.43 ± 2.28 a14.36 ± 2.46 a
198,020,749.17 ± 2,250,142.09 a7,057,979.52 ± 1,329,019.25 a11,429,688.79 ± 3,499,562.07 a6,119,026.91 ± 530,020.51 a11,729,001.22 ± 5,750,084.35 a6,077,922.73 ± 124,119.42 a
2013,954.14 ± 125.32 a83,294.53 ± 427.16 c24,429.37 ± 153.02 btrtr503,640.81 ± 153,772.98 d
2173.83 ± 0.16 a b155.64 ± 0.25 b c230.41 ± 35.27 c46.56 ± 0.31 a882.92 ± 73.08 d40.22 ± 0.13 a
22363.08 ± 0.08 c397.24 ± 17.93 c246.81 ± 0.38 b379.70 ± 23.62 c793.42 ± 0.05 d137.08 ± 23.54 a
2313,432.09 ± 390.75 d8349.21 ± 731.17 b c6811.15 ± 137.18 a b9544.95 ± 925.82 c16,317.27 ± 1529.55 e5065.04 ± 633.79 a
2411,979.79 ± 5.92 c21,522.27 ± 328.98 e17,502.03 ± 33.56 d8781.48 ± 980.37 b28,541.34 ± 986.88 f4208.75 ± 13.15 a
25trtrtrtrtrtr
268637.39 ± 32.20 c440.01 ± 39.83 atr13,010.93 ± 167.42 d4574.55 ± 42.91 b4819.93 ± 1259.78 b
2744,617.93 ± 137.00 a95,440.55 ± 28,644.95 b c49,629.19 ± 601.14 a b20,513.18 ± 528.50 a106,686.91 ± 181.98 c92,842.65 ± 31,051.35 b c
28460,480.92 ± 5729.13 c145,519.63 ± 11,269.22 a b77,189.78 ± 7544.10 a565,184.73 ± 42,979.58 d695,627.22 ± 40,986.21 e173,905.87 ± 24,280.65 b
29tr6910.25 ± 1724.70 b c136.94 ± 133.61 a b2468.94 ± 521.10 a b c369.80 ± 283.54 a b9315.87 ± 5955.46 c
301412.94 ± 5.75 b5653.94 ± 331.67 c1057.34 ± 9.49 b1257.21 ± 9.80 b1220.89 ± 5.24 b129.10 ± 1.78 a
31285.25 ± 29.00 a b769.83 ± 101.22 c185.04 ± 24.28 a328.93 ± 13.26 b362.42 ± 23.59 b250.98 ± 57.63 a b
321385.18 ± 5.38 a42,367.62 ± 1490.59 c5063.67 ± 6.19 b593.83 ± 117.46 a809.65 ± 31.79 a1260.93 ± 244.56 a
33trtrtrtrtrtr
341836.67 ± 125.52 b10,330.78 ± 422.46 e413.50 ± 63.52 a4746.59 ± 87.82 d199.59 ± 15.38 a2794.37 ± 656.28 c
3523.19 ± 1.27 a2829.93 ± 226.93 b180.21 ± 15.24 a14.55 ± 0.59 a18.91 ± 0.36 a30.89 ± 6.62 a
36334.34 ± 3.85 c1502.79 ± 54.64 f142.65 ± 11.07 b514.31 ± 4.86 d1057.21 ± 8.29 etr
374810.83 ± 49.30 b24,330.76 ± 282.79 e17,231.94 ± 407.93 d5400.72 ± 58.23 b9834.93 ± 152.36 c3161.14 ± 549.63 a
3819,300.71 ± 1153.50 e15,329.97 ± 1124.08 d8932.46 ± 178.69 b18,218.52 ± 51.99 e12,829.97 ± 133.62 c965.43 ± 193.69 a
3993.85 ± 0.52 b1474.57 ± 75.16 c122.23 ± 11.09 b46.35 ± 0.08 a b2.39 ± 0.45 atr
401274.10 ± 0.29 c787.66 ± 50.90 b2064.35 ± 128.89 d1293.57 ± 93.83 c711.91 ± 0.28 btr
41135.85 ± 0.72 a4078.41 ± 326.13 c502.77 ± 0.71 b64.87 ± 5.68 a84.82 ± 9.87 a124.02 ± 24.02 a
42785.24 ± 9.04 d1809.90 ± 16.33 f1156.85 ± 3.01 e323.94 ± 8.20 b393.02 ± 26.61 c93.58 ± 38.26 a
43479.21 ± 43.10 a b1265.54 ± 185.14 c303.70 ± 35.28 a544.40 ± 19.80 b592.24 ± 33.21 b413.46 ± 82.58 a b
44trtrtrtrtrtr
45297.71 ± 2.71 b3190.07 ± 127.80 e1498.79 ± 10.60 d627.20 ± 83.01 c91.46 ± 13.13 a45.30 ± 4.69 a
4629,125.40 ± 294.08 b114,532.53 ± 1137.68 e94,445.64 ± 2367.40 d53,390.76 ± 5265.10 c6870.70 ± 140.14 a911.37 ± 106.41 a
471780.01 ± 3.98 c3373.76 ± 15.08 d1324.12 ± 9.50 b5712.76 ± 55.65 e8207.16 ± 33.79 f1020.24 ± 43.86 a
48trtrtrtrtrtr
491.26 ± 0.01 a3.48 ± 0.01 a3.42 ± 1.87 a0.92 ± 0.21 a0.79 ± 0.12 a27.83 ± 10.31 b
5070.87 ± 0.62 a b120.71 ± 1.83 a b612.06 ± 342.68 b c51.49 ± 3.51 a161.21 ± 37.54 a b924.48 ± 344.18 c
511172.28 ± 1876.58 a2650.75 ± 1886.25 a323.81 ± 252.06 a324.17 ± 494.20 a829.70 ± 296.07 a512.85 ± 12.92 a
5212,375.86 ± 1661.42 c4469.58 ± 1100.56 b1962.65 ± 378.17 a1414.54 ± 16.80 a2734.43 ± 312.57 a b756.57 ± 157.68 a
“tr” represents “Trace Amount”. The data are mean ± standard deviation of one-way ANOVA and Duncan’s range test. The different letters in each row indicate significant differences at a significant level of 0.05. The code of vinegar corresponds with Table 1. The number of compounds corresponds with Table 2.
Table 5. Odor activity values (OAVs) of vinegar compounds.
No.B1B2B3B4B5B6
126.130125.103156.666114.39060.83493.584
2118.177170.431173.43322.15622.386227.178
411.2201.9149.6594.2187.165
714.479123.44369.20512.56413.876263.524
841.60512.81346.10973.7642.244
95.698
141.9052.080
154154.5253420.7994034.0555790.2613526.6533075.922
193645.7953208.1735195.3132781.3765331.3642762.692
204.1651.22125.182
213.679
221.133
23191.887119.27497.302136.356233.10472.358
243.9937.1745.8342.9279.5141.403
271.067
28613.975194.026102.920753.580927.503231.874
2949.35917.6352.64166.542
3021.73886.98416.26719.34218.7831.986
3265.9612017.506241.12728.27838.55560.044
372.4331.723
3915.642245.76220.3717.726
437.37219.4704.6728.3759.1116.361
4616.18163.62952.47029.6623.817
The number of compounds corresponds with Table 2. The code of vinegar corresponds with Table 1.
Table 6. Aromatic features of six kinds of vinegar.
Produce NameAroma Description
Ten-year aged Qian-he cellar vinegarSour, green, floral, and sweet scents
Ning-hua-mansion old vinegarSour, green, fruity, sweet, and roasted aromas
East-lake health vinegarSour, green, fruity, and sweet notes
Qian-he glutinous rice vinegarSour, green, floral, and sweet aromatic notes
Heng-shun Jinyou balsamic vinegarSour, green, fruity, and sweet notes
Potato vinegarSour, fragrant, green, fruity, and sweet aromas
Table 7. The relative importance of the top five most important volatiles in three clusters.
Cluster 1Relative ImportanceCluster 2Relative ImportanceCluster 3Relative Importance
1-methylpyrrole-2-carboxaldehyde4.342935benzaldehyde7.2178794-acetoxy-3-methoxystyrene8.302227
ethyl acetate4.319396phenylethanal4.19441,2-propanediol,2-acetate8.09123
acetylfuran4.2697283-methyl-1-butanol4.082279isobutyl acetate3.474666
1H-pyrrole-2-carbaldehyde3.7845733-hydroxy-2-butanone3.8874112-methylbutyric acid3.007397
2,3,5-trimethylpyrazine3.509161ethyl acetate3.391669isoamyl acetate2.51753
Publisher’s Note: MDPI stays neutral with regard to jurisdictional claims in published maps and institutional affiliations.

