
Profiling of Croatian Consumers Based on Their Intention to Consume Farmed Fish

 ,
,  ,
,  ,
, 
Abstract
:1. Introduction
2. Materials and Methods
2.1. Subjects
2.2. Questionnaire Design
2.3. Data Analysis
3. Results and Discussion
3.1. Sociodemographic Characteristics of Fish Consumers
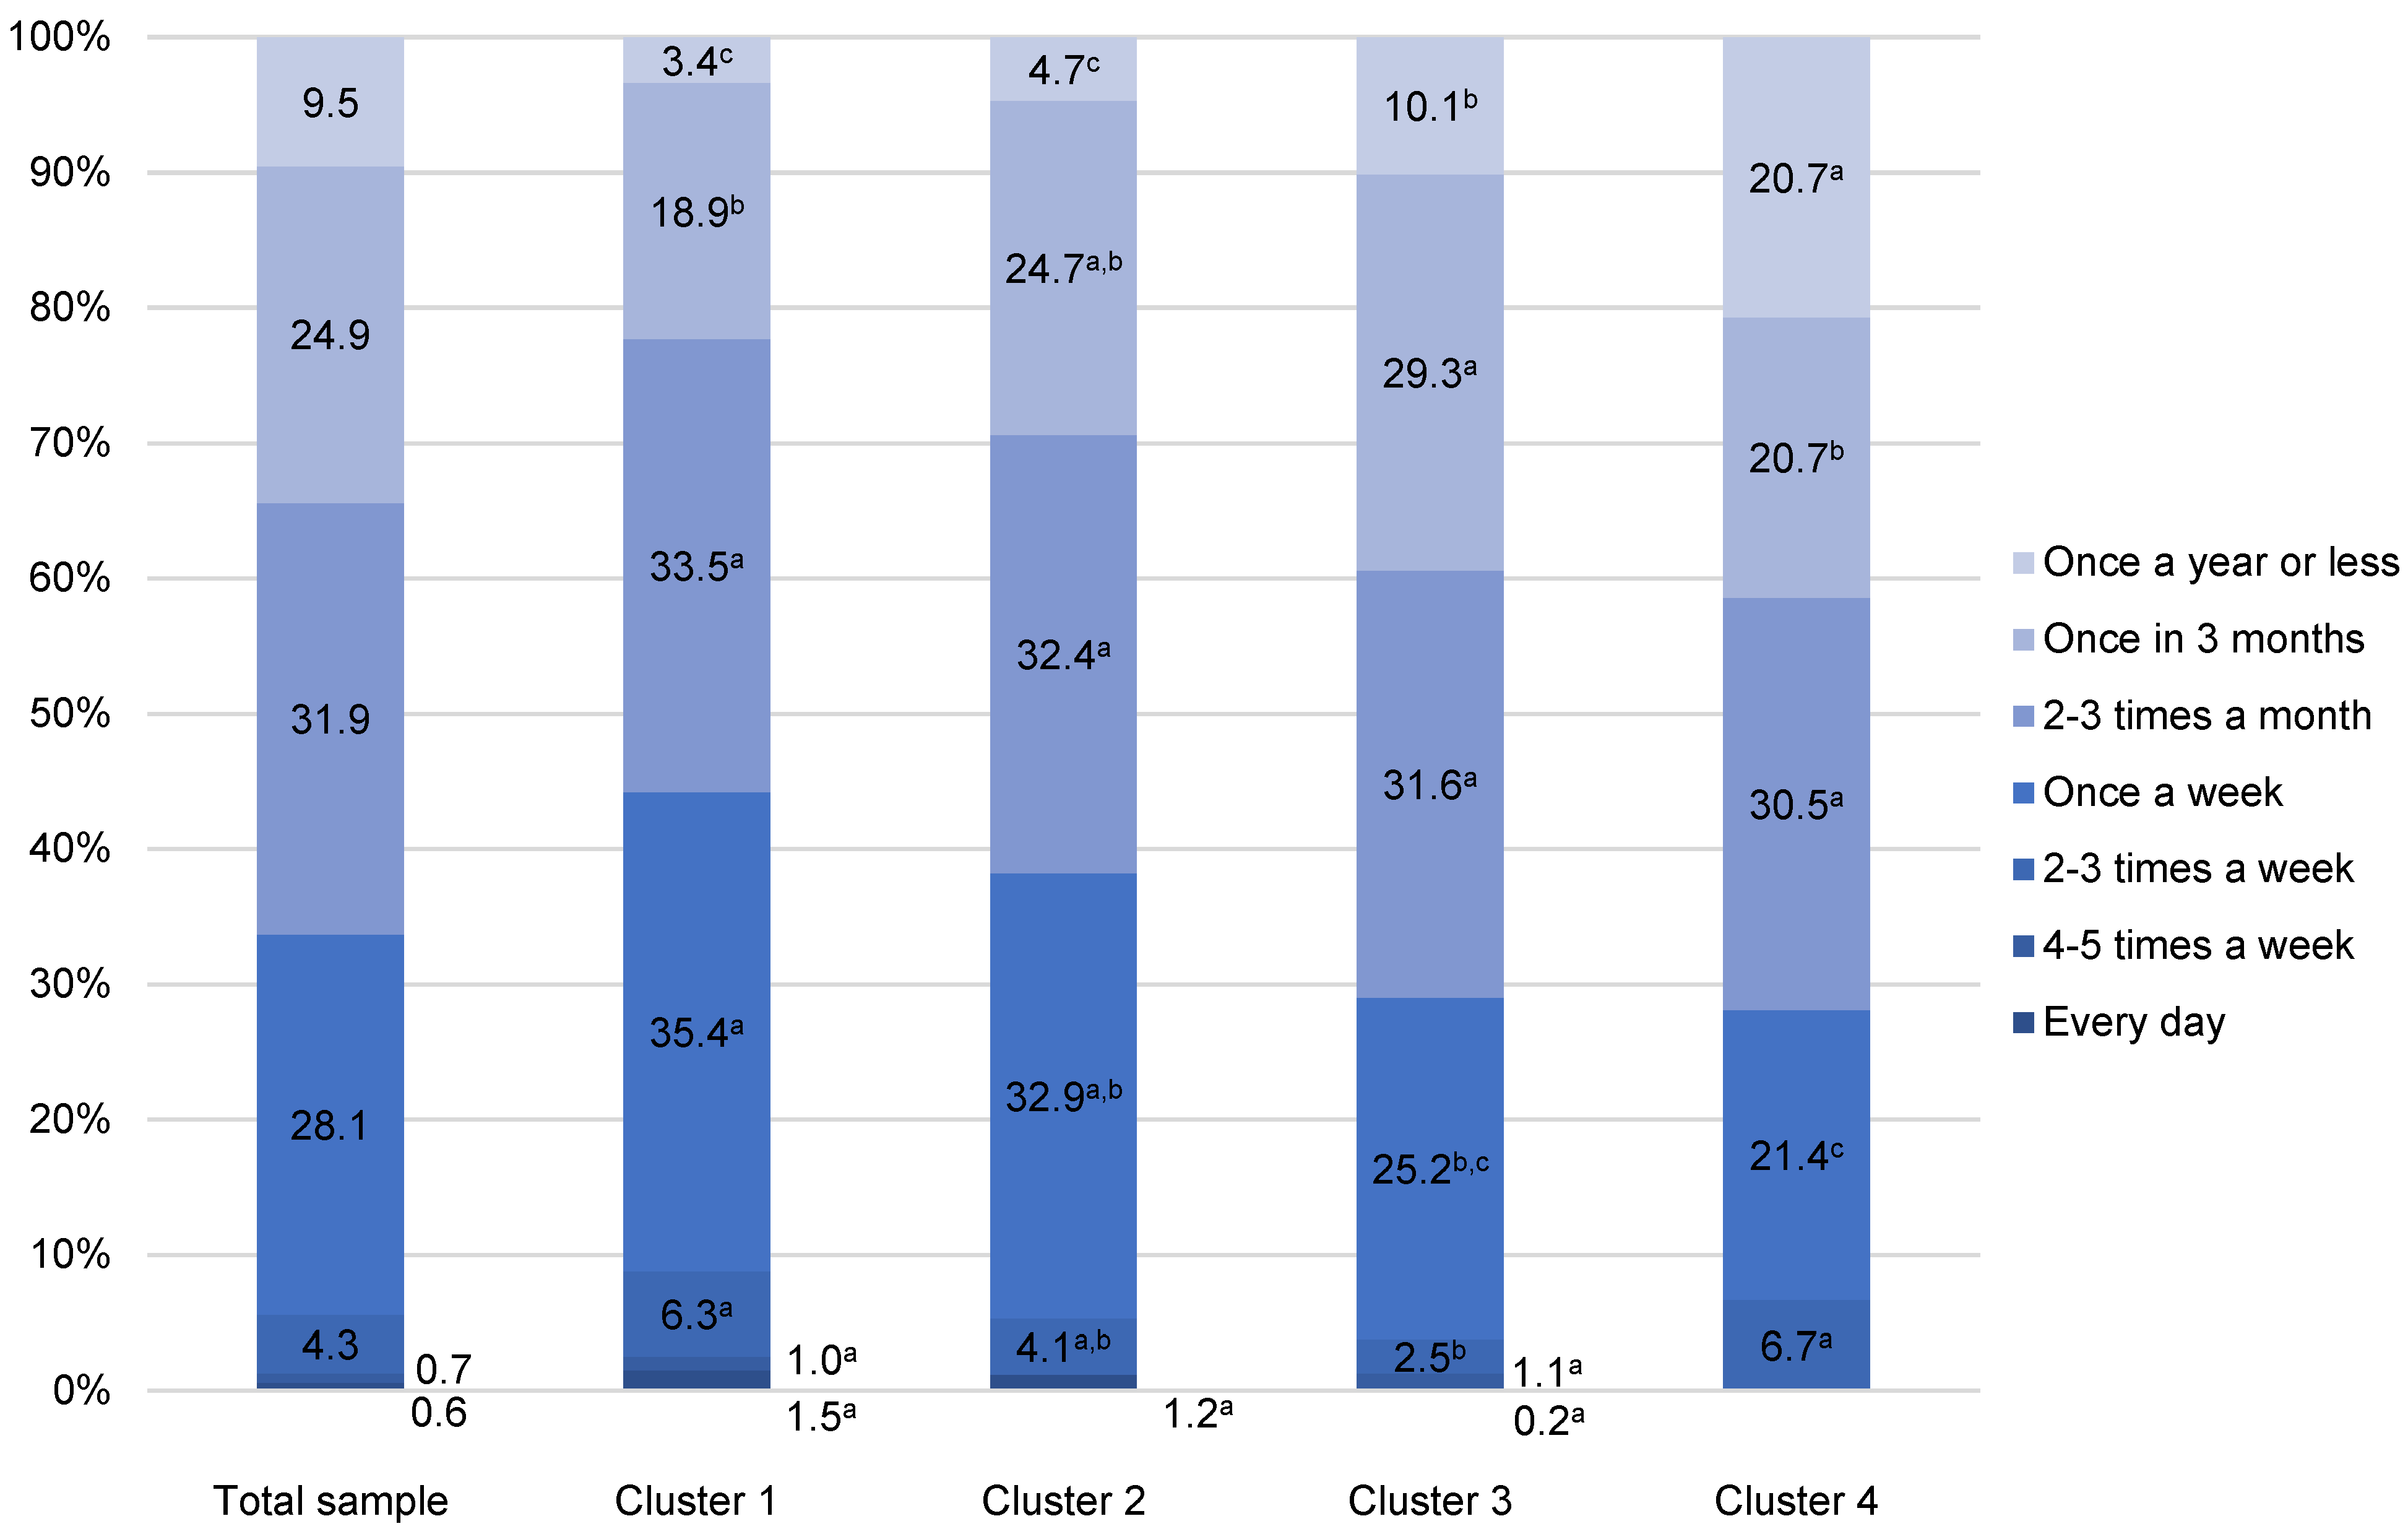
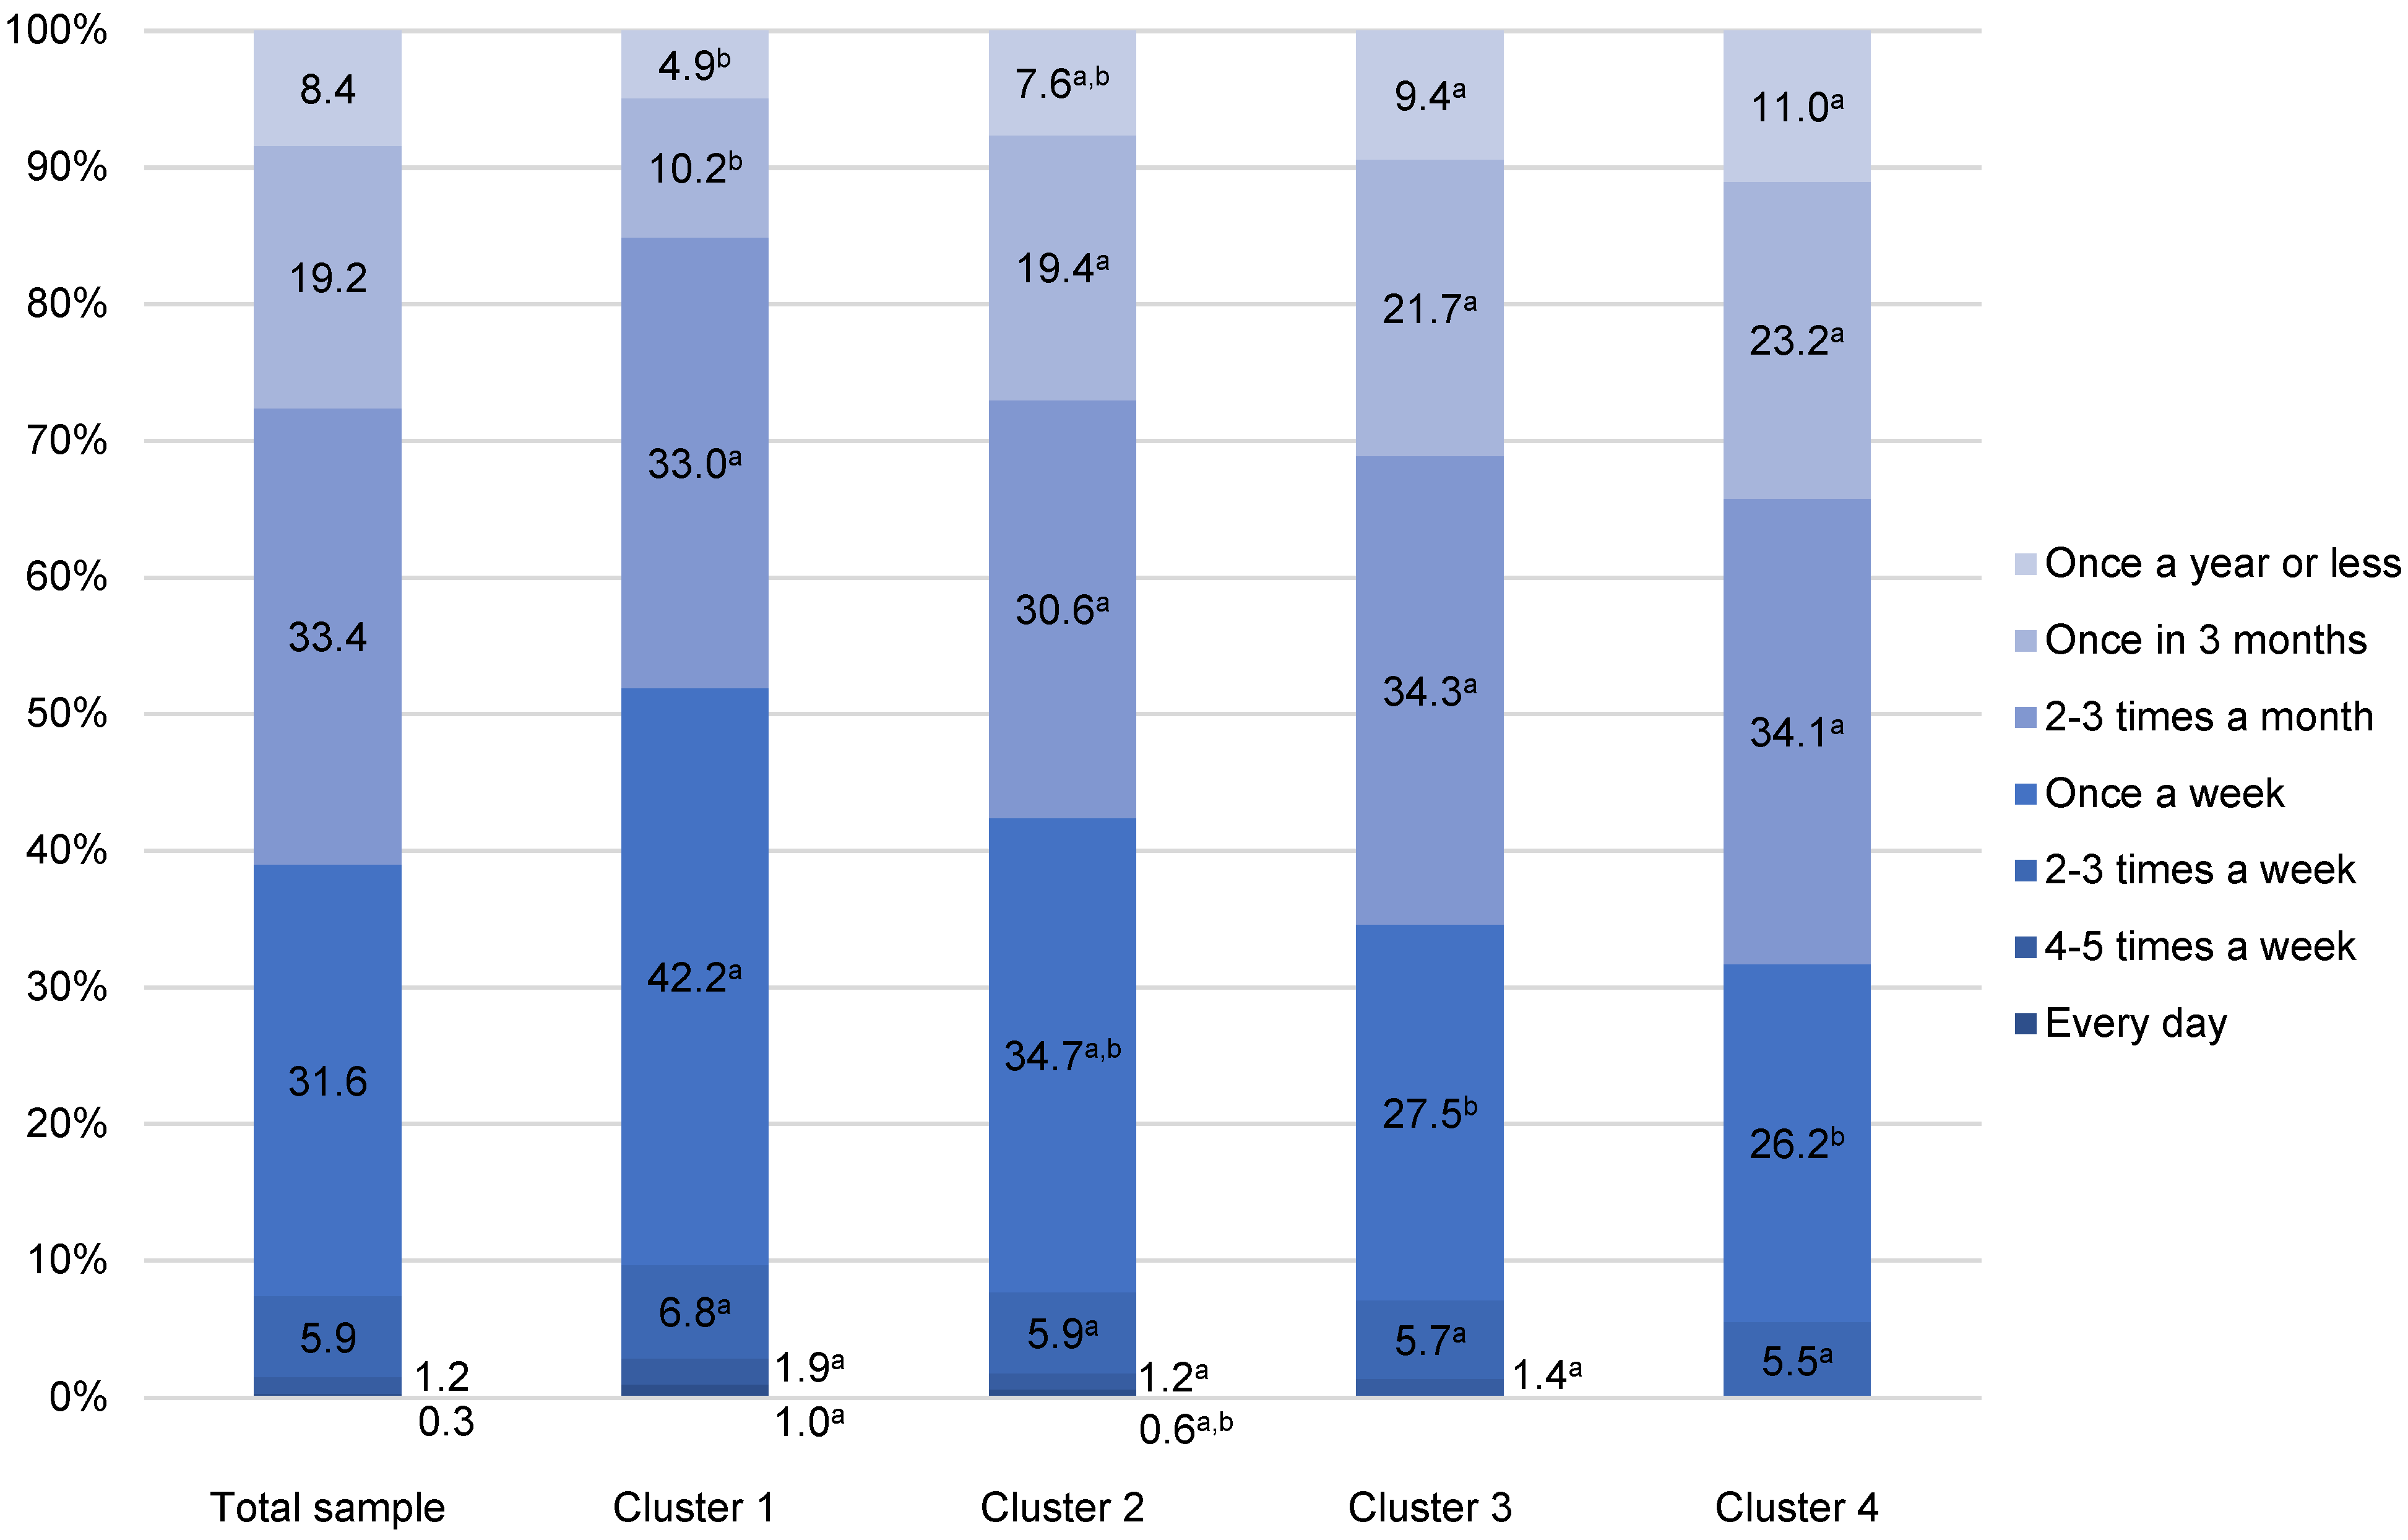
3.2. Frequencies of At-Home White and Fatty Fish Consumption
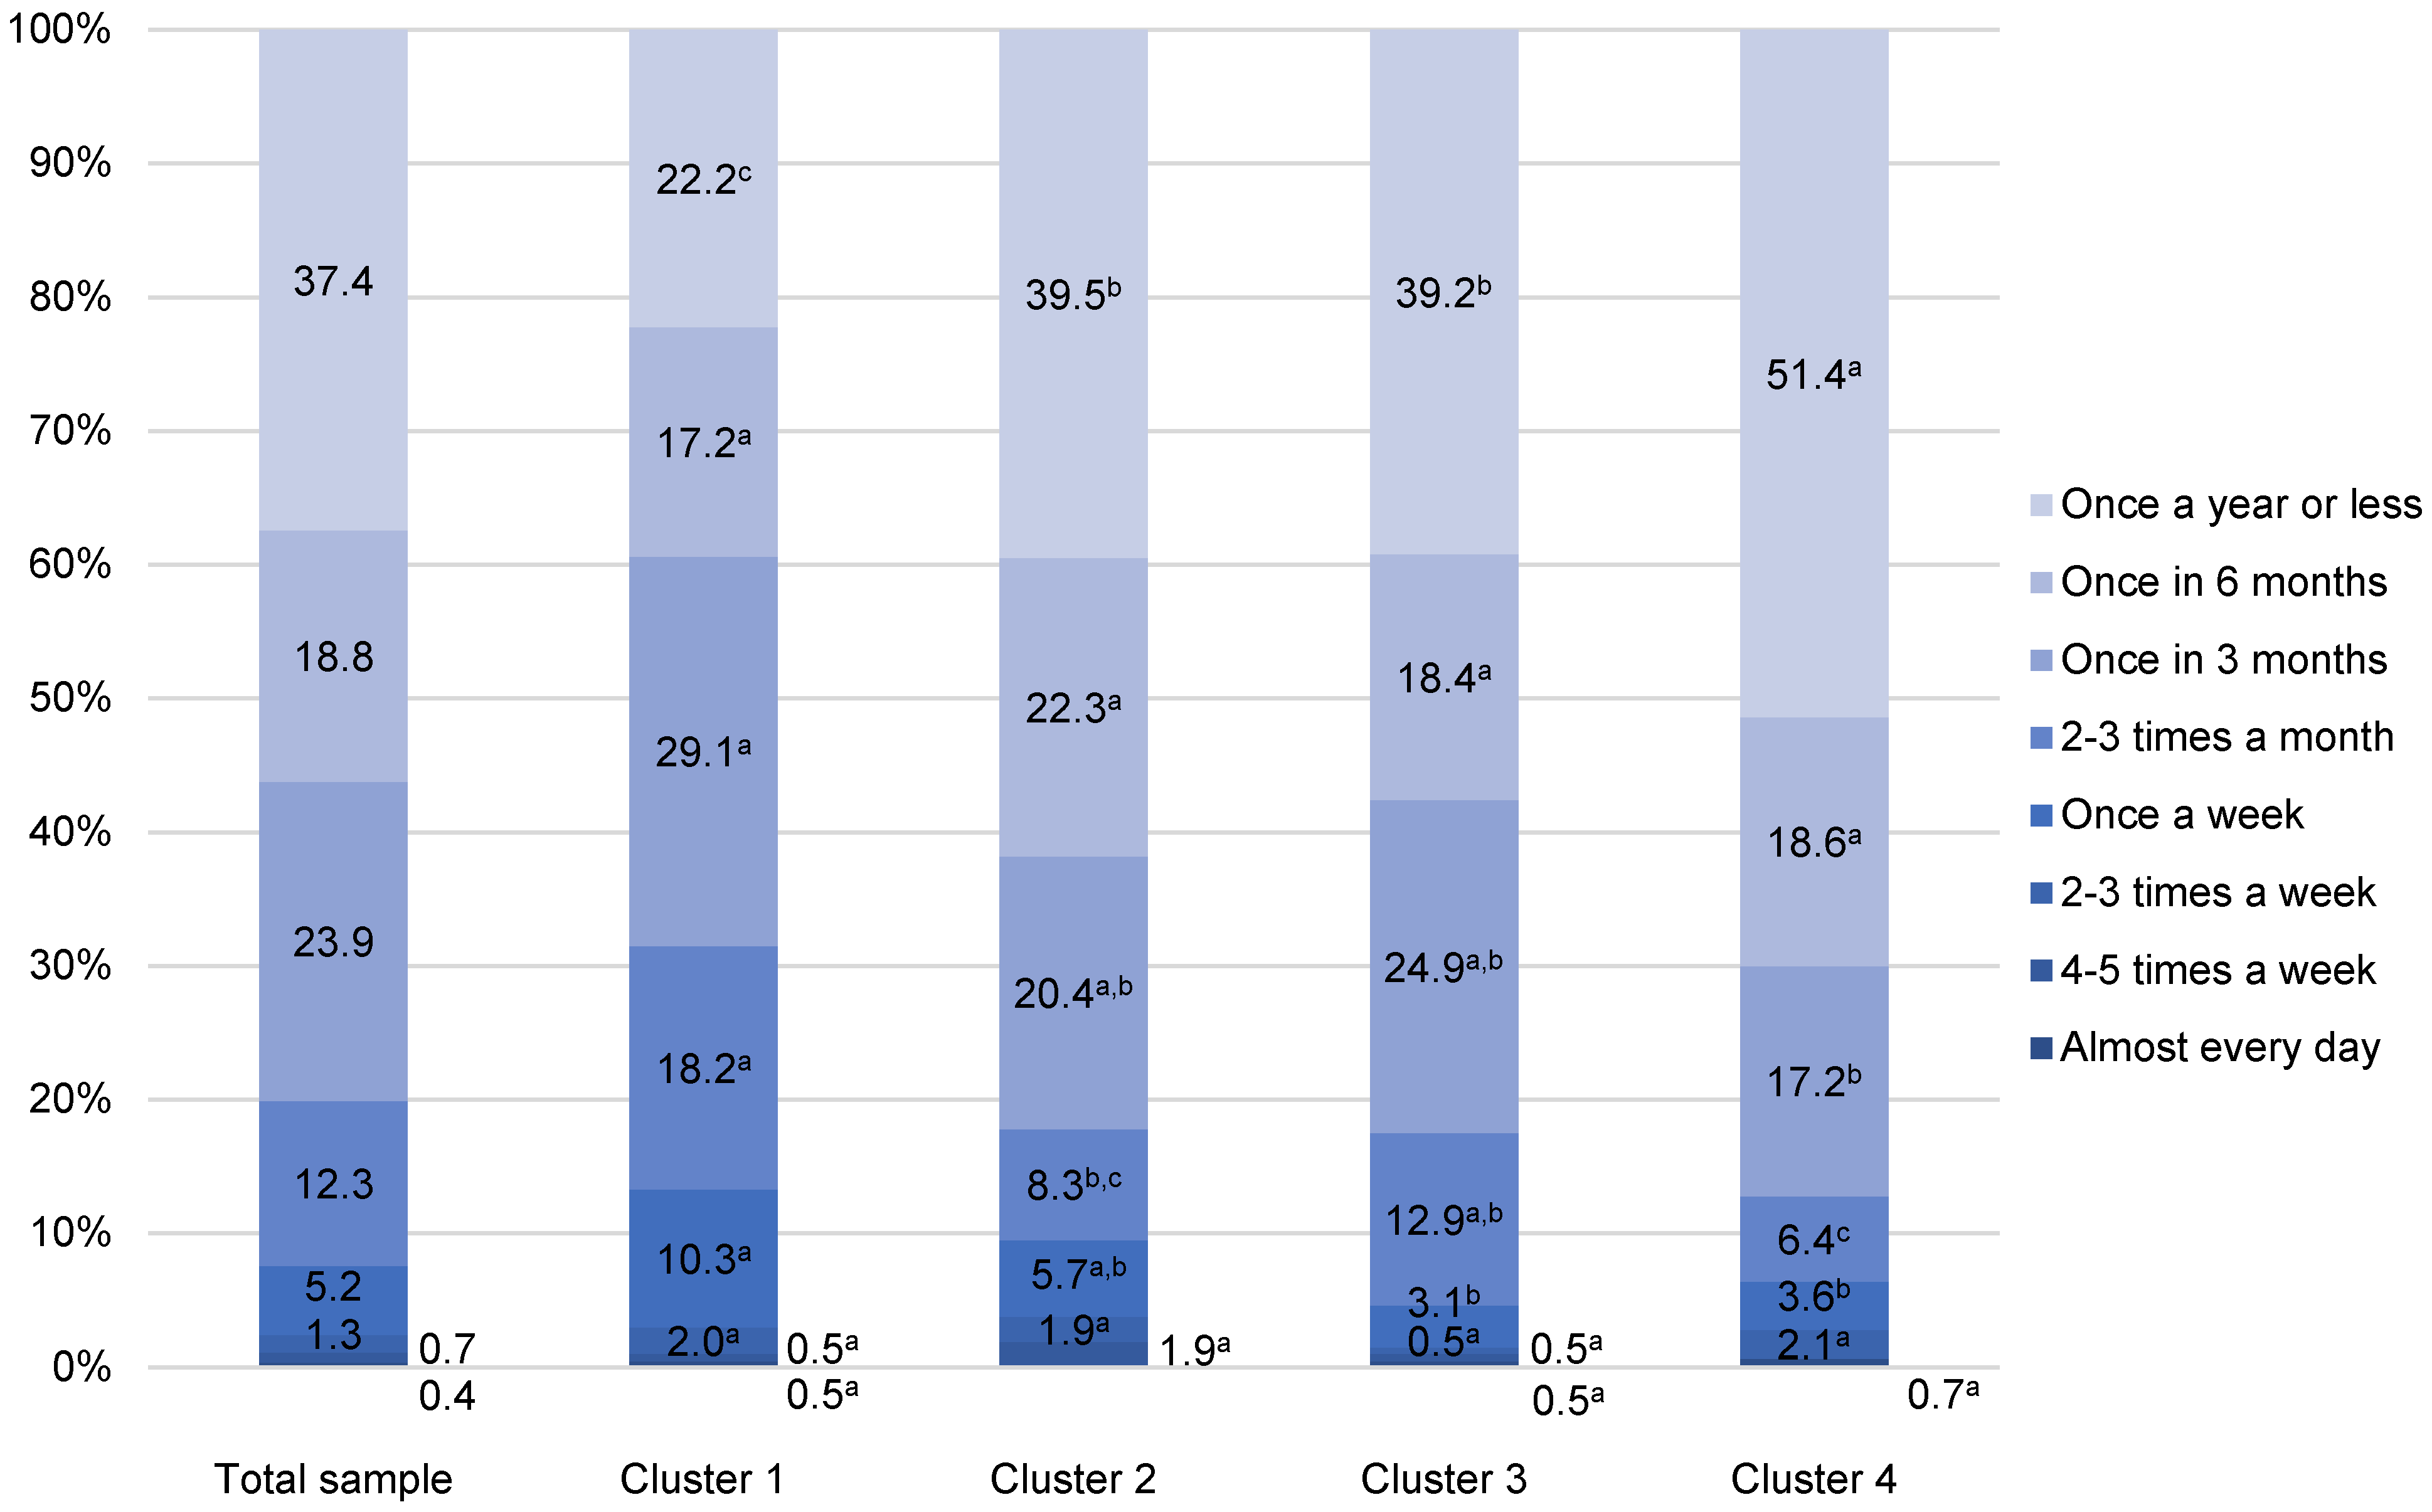
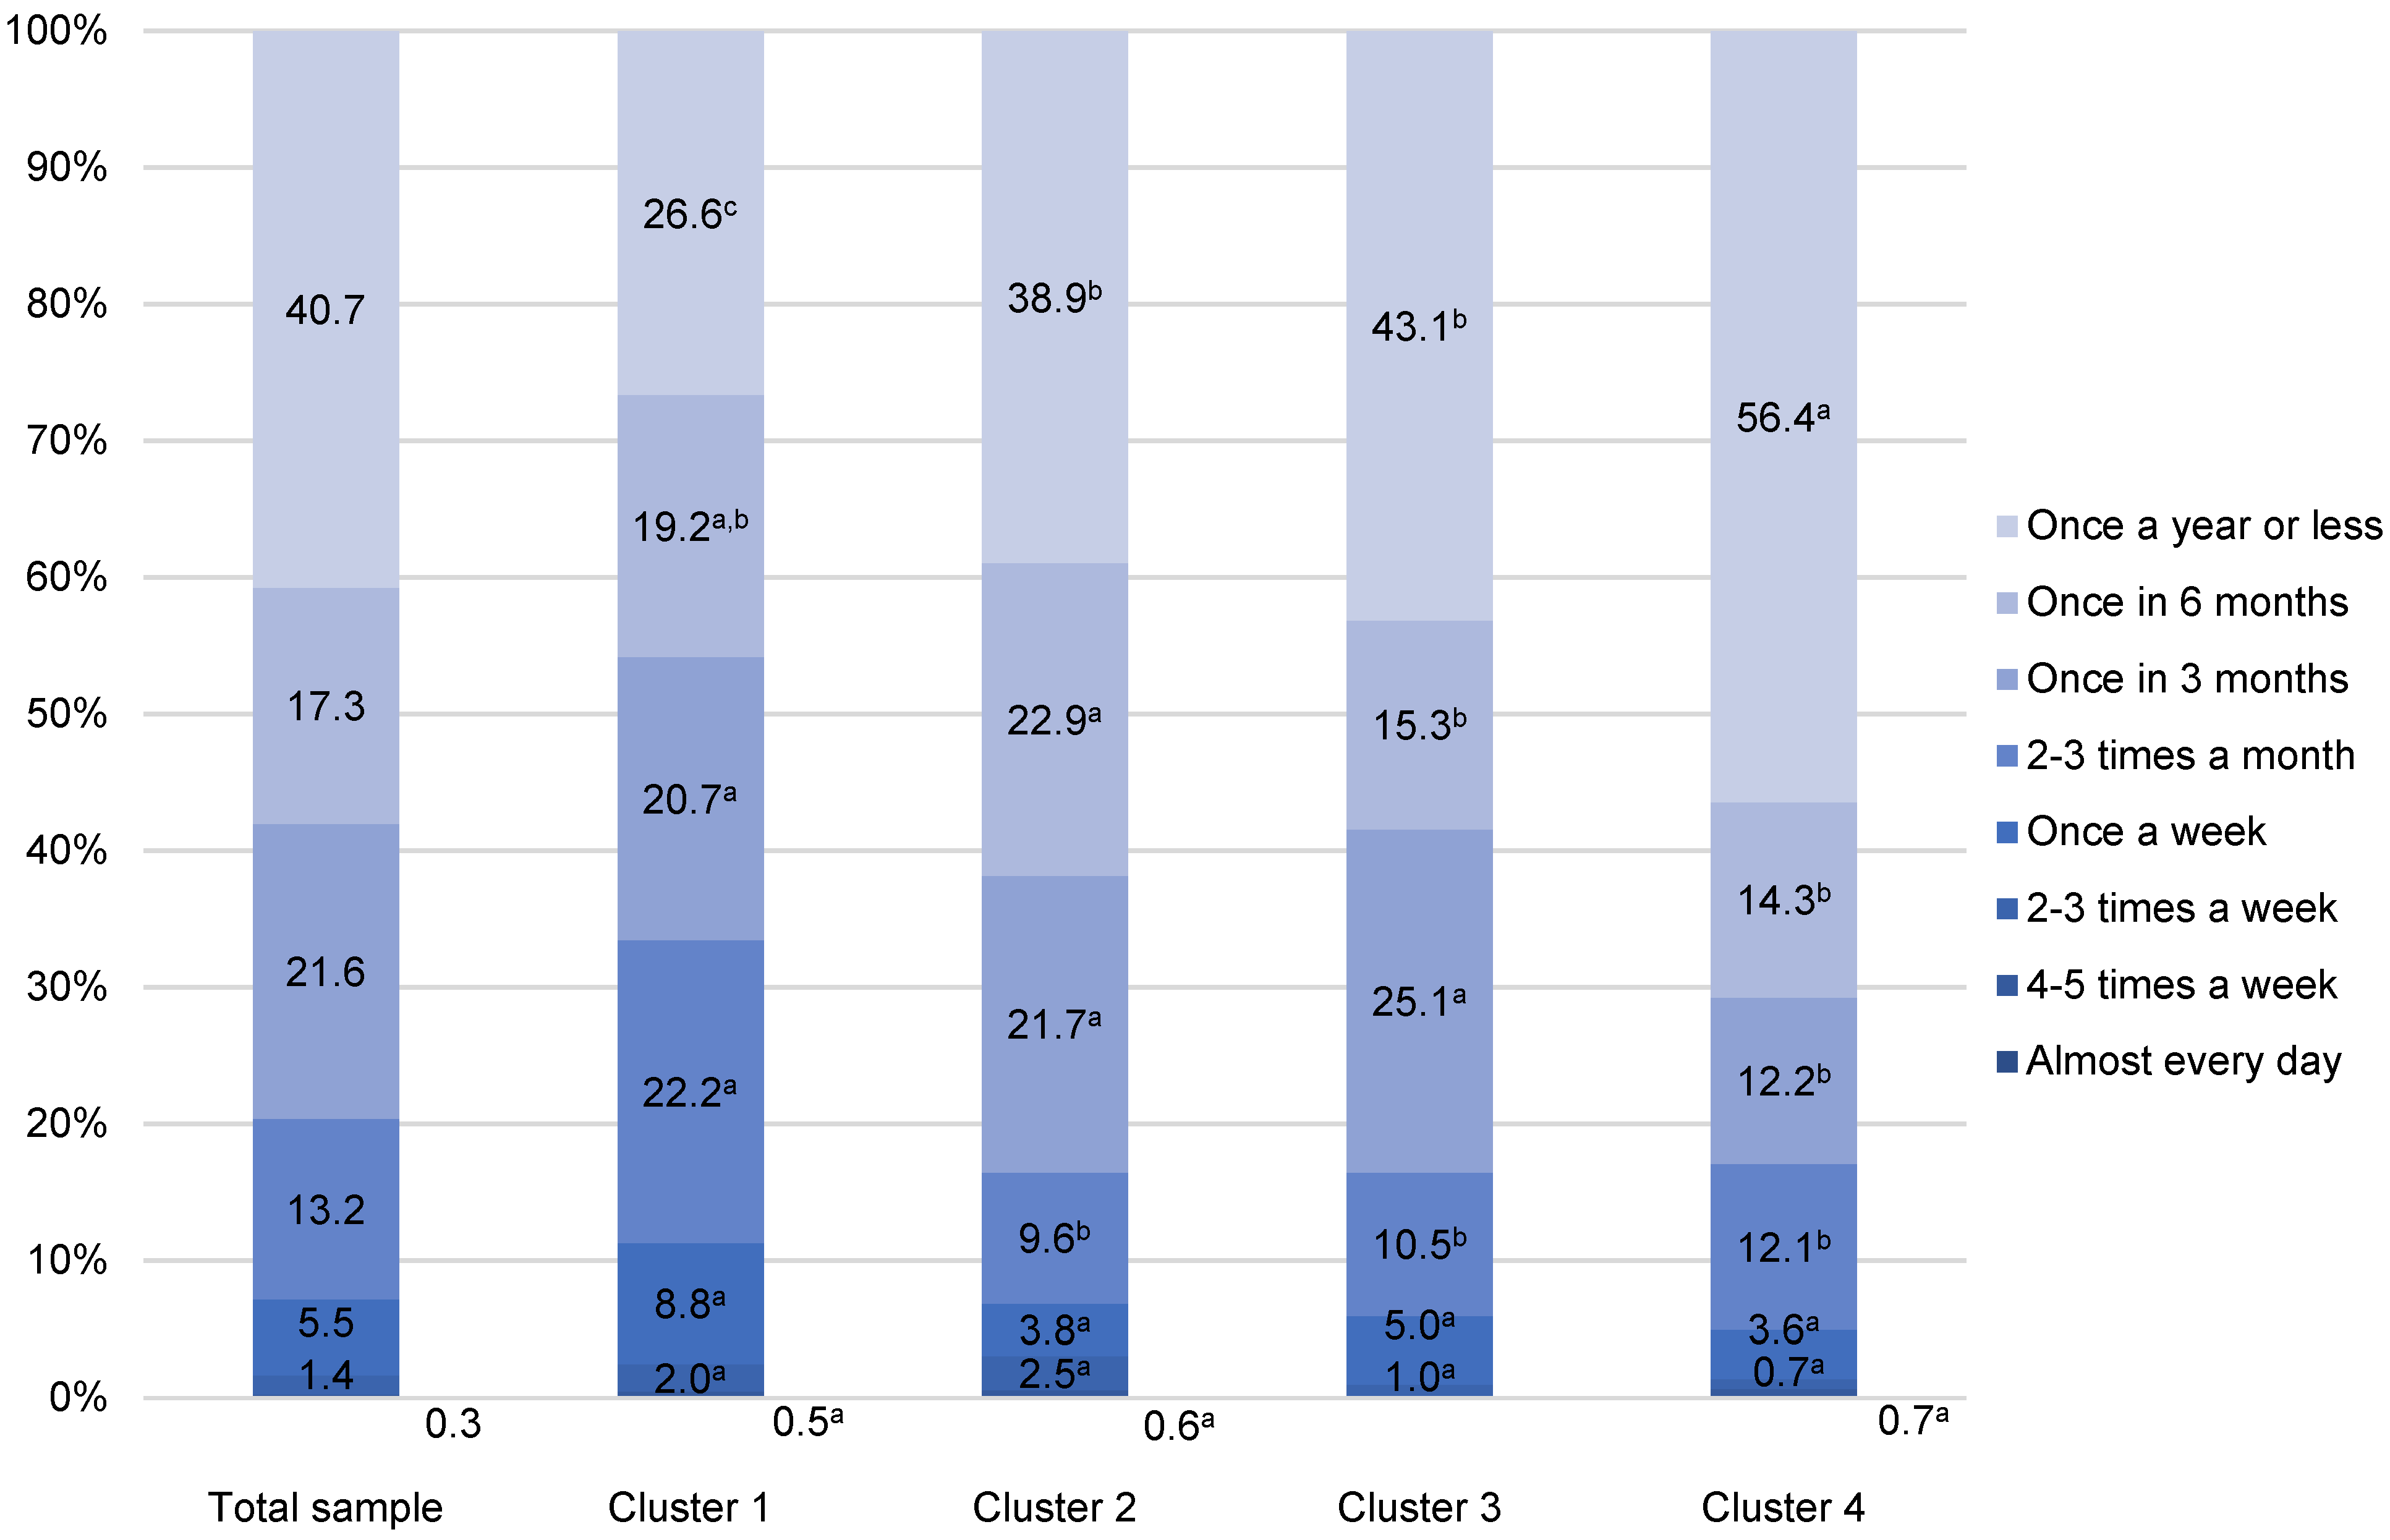
3.3. Frequencies of Away-From-Home White and Fatty Fish Consumption
3.4. Beliefs about Wild and Farmed Fish
3.5. Importance of Product Information
3.6. Preferences for Fishery Products
3.7. Knowledge about Fish
3.8. Place of Purchase
3.9. Source of Information
3.10. Cluster Profiling
4. Conclusions and Policy Implication
Supplementary Materials
Author Contributions
Funding
Institutional Review Board Statement
Informed Consent Statement
Data Availability Statement
Acknowledgments
Conflicts of Interest
References
- EFSA. Scientific Opinion on health benefits of seafood (fish and shellfish) consumption in relation to health risks associated with exposure to methylmercury. EFSA J. 2014, 12, 3761. [Google Scholar] [CrossRef] [Green Version]
- FAO. The State of World Fisheries and Aquaculture 2020, Sustainability in Action; Food and Agriculture Organization of the United Nations: Rome, Italy, 2020. [Google Scholar] [CrossRef]
- Bogard, J.R.; Farmery, A.K.; Little, D.C.; Fulton, E.A.; Cook, M. Will fish be part of future healthy and sustainable diets? Lancet Planet. Health 2019, 3, e159–e160. [Google Scholar] [CrossRef] [Green Version]
- Grosso, G.; Mucek, A.; Marventano, S.; Castellano, S.; Mistretta, A.; Pajak, A.; Galvano, F. Dietary n-3 PUFA, fish consumption and depression: A systematic review and meta-analysis of observational studies. J. Affect. Dissord. 2016, 205, 269–281. [Google Scholar] [CrossRef]
- Jayedi, A.; Shab-Bidar, S. Fish Consumption and the Risk of Chronic Disease: An Umbrella Review of Meta-Analyses of Prospective Cohort Studies. Adv. Nutr. 2020, 11, 1123–1133. [Google Scholar] [CrossRef]
- Béné, C.; Barange, M.; Subasinghe, R.; Pinstrup-Andersen, P.; Merino, G.; Hemre, G.I.; Williams, M. Feeding 9 billion by 2050—Putting fish back on the menu. Food Sec. 2015, 7, 261–274. [Google Scholar] [CrossRef] [Green Version]
- Blanchard, J.L.; Watson, R.A.; Fulton, E.A.; Cottrell, R.S.; Nash, K.L.; Bryndum-Buchholz, A.; Büchner, M.; Carozza, D.A.; Cheung, W.W.L.; Elliott, J.; et al. Linked sustainability challenges and trade-offs among fisheries, aquaculture and agriculture. Nat. Ecol. Evol. 2017, 1, 1240–1249. [Google Scholar] [CrossRef]
- Naylor, R.L.; Hardy, R.W.; Buschmann, A.H.; Bush, S.R.; Cao, L.; Klinger, D.H.; Little, D.C.; Lubchenco, J.; Shumway, S.E.; Troell, M. A 20-year retrospective review of global aquaculture. Nature 2021, 591, 551–563. [Google Scholar] [CrossRef]
- Bergleiter, S.; Meisch, S. Certification standards for aquaculture products: Bringing together the values of producers and consumers in globalised organic food markets. J. Agric. Environ. Ethics 2015, 28, 553–569. [Google Scholar] [CrossRef]
- Edwards, P. Aquaculture environment interactions: Past, present and likely future trends. Aquaculture 2015, 447, 2–14. [Google Scholar] [CrossRef]
- European Commission. A Farm to Fork Strategy for a Fair, Healthy and Environmentally-Friendly FoodSystem; COM (2020) 381 final; European Commission: Brussels, Belgium, 2021. [Google Scholar]
- European Commission. Strategic Guidelines for a More Sustainable and Competitive EU Aquaculture for the Period 2021 to 2030; COM(2021) 236 final; European Commission: Brussels, Belgium, 2021. [Google Scholar]
- FAO. Code of Conduct for Responsible Fisheries; Food and Agriculture Organization of the United Nations: Rome, Italy, 1995. [Google Scholar]
- Cantillo, J.; Martín, J.; Román, C. Discrete choice experiments in the analysis of consumers’ preferences for finfish products: A systematic literature review. Food Qual. Prefer. 2020, 84, 103952. [Google Scholar] [CrossRef]
- Carlucci, D.; Nocella, G.; Devitiis, B.D.; Viscecchia, R.; Bimbo, F.; Nardone, G. Consumer purchasing behaviour towards fish and seafood products. Patterns and insights from a sample of international studies. Appetite 2015, 84, 212–227. [Google Scholar] [CrossRef] [PubMed]
- Claret, A.; Guerrero, L.; Ginés, R.; Grau, A.; Hernández, M.D.; Aguirre, E.; Peleteiro, J.B.; Fernández-Pato, C.; Rodríguez-Rodríguez, C. Consumer beliefs regarding farmed versus wild fish. Appetite 2014, 79, 25–31. [Google Scholar] [CrossRef]
- López-Mas, L.; Claret, A.; Reinders, M.J.; Banovic, M.; Krystallis, A.; Guerrero, L. Farmed or wild fish? Segmenting European consumers based on their beliefs, Aquaculture 2021, 532, 735992. [Google Scholar] [CrossRef]
- Rickertsen, K.; Alfnes, F.; Combris, P.; Enderli, G.; Issanchou, S.; Shogren, J.F. French Consumers’ Attitudes and Preferences Toward Wild and Farmed Fish. Mar. Resour. Econ. 2017, 32, 59–81. [Google Scholar] [CrossRef]
- Verbeke, W.; Brunsø, K. Consumer awareness, perceptions and behaviour towards farmed versus wild fish. In Proceedings of the 95th Seminar of European Association of Agricultural Economists, Civitavecchia, Italy, 9–11 December 2005; pp. 237–251. [Google Scholar] [CrossRef]
- Verbeke, W.; Sioen, I.; Brunsø, K.; Henauw, S.; Camp, J. Consumer perception versus scientific evidence of farmed and wild fish: Exploratory insights from Belgium. Aquac. Int. 2007, 15, 121–136. [Google Scholar] [CrossRef]
- Hall, T.E.; Amberg, S.M. Factors influencing consumption of farmed seafood products in the Pacific northwest. Appetite 2013, 66, 1–9. [Google Scholar] [CrossRef] [PubMed]
- Eurostat. Body Mass Index Database. 2019. Available online: https://ec.europa.eu/eurostat/databrowser/view/sdg_02_10/default/table (accessed on 10 February 2022).
- Eurostat. Causes of Death Database. 2019. Available online: https://ec.europa.eu/eurostat/databrowser/view/hlth_cd_aro/default/table (accessed on 15 May 2022).
- Eurostat. Self-Perceived Health Database. 2019. Available online: https://ec.europa.eu/eurostat/databrowser/view/hlth_silc_01/default/table (accessed on 15 May 2022).
- Eurostat. Fisheries Database. 2020. Available online: https://ec.europa.eu/eurostat/web/fisheries/data/database (accessed on 17 May 2022).
- EUMOFA. The EU Fish Market—2021 Edition; Publications Office of the European Union: Luxembourg, 2021. [Google Scholar]
- Tomić, M.; Kovačićek, T.; Matulić, D. Attitudes as basis for segmenting Croatian fresh fish consumers. New Medit. 2016, 15, 63–71. [Google Scholar]
- Tomić, M.; Matulić, D.; Jelić, M. What determines fresh fish consumption in Croatia? Appetite 2016, 106, 13–22. [Google Scholar] [CrossRef] [Green Version]
- Tomić, M.; Lucević, Z.; Tomljanović, T.; Matulić, D. Wild-Caught Versus Farmed Fish—Consumer Perception. Croat. J. Fish. 2017, 75, 41–50. [Google Scholar] [CrossRef] [Green Version]
- Ferfolja, M.; Cerjak, M.; Matulić, D.; Maksan, M.T. Consumer knowledge and perception about fresh fish from organic farming in Croatia. Croat. J. Fish. 2022, 80, 7–16. [Google Scholar] [CrossRef]
- Gaviglio, A.; Demartini, E.; Mauracher, C.; Pirani, A. Consumer perception of different species and presentation forms of fish: An empirical analysis in Italy. Food Qual. Prefer. 2014, 36, 33–49. [Google Scholar] [CrossRef]
- Myrland, O.; Trondsen, T.; Johnston, R.S.; Lund, E. Determinants of seafood consumption in Norway: Lifestyle, revealed preferences, and barriers to consumption. Food Qual. Prefer. 2020, 11, 169–188. [Google Scholar] [CrossRef]
- Trondsen, T.; Braaten, T.; Lund, E.; Eggen, A.E. Health and seafood consumption patterns among women aged 45–69 years. A Norwegian seafood consumption study. Food Qual. Prefer. 2004, 15, 117–128. [Google Scholar] [CrossRef]
- Almeida, C.; Altintzoglou, T.; Cabral, H.N.; Vaz, S.G. Does seafood knowledge relate to more sustainable consumption? Br. Food J. 2015, 117, 894–914. [Google Scholar] [CrossRef]
- Pieniak, Z.; Verbeke, W.; Olsen, S.O.; Hansen, K.B.; Brunsø, K. Health-related attitudes as a basis for segmenting European fish consumers. Food Policy 2010, 35, 448–455. [Google Scholar] [CrossRef]
- Pieniak, Z.; Vanhonacker, F.; Verbeke, W. Consumer knowledge and use of information about fish and aquaculture. Food Policy 2013, 40, 25–30. [Google Scholar] [CrossRef]
- Eurofish. Konzumacija Ribe u Hrvatskoj; Eurofish: Copenhagen, Denmark, 2017. [Google Scholar]
- Hair, J.F.; Black, W.C.; Babin, B.J.; Anderson, R.E. Multivariate Data Analysis, 8th ed.; Cengage Learning, EMEA: Andover, UK, 2019; pp. 189–256. [Google Scholar]
- Beane, T.P.; Ennis, D.M. Market Segmentation: A Review. Eur. J. Mark. 1987, 21, 20–42. [Google Scholar] [CrossRef]
- Cardoso, C.; Lourenço, H.; Costa, S.; Gonçalves, S.; Nunes, M.L. Survey into the seafood consumption preferences and patterns in the Portuguese population. Gender and regional variability. Appetite 2013, 64, 20–31. [Google Scholar] [CrossRef]
- Vanhonacker, F.; Altintzoglou, T.; Luten, J.; Verbeke, W. Does fish origin matter to European consumers? Insights from a consumer survey in Belgium, Norway and Spain. Br. Food J. 2011, 113, 535–549. [Google Scholar] [CrossRef]
- Güney, O.I. Consumers’ Perceived Differences between Wild and Farmed Fish: A Survey Study in Turkey. J. Aquat. Food Prod. Technol. 2019, 28, 210–220. [Google Scholar] [CrossRef]
- Polymeros, K.; Kaimakoudi, E.; Schinarki, M.; Batzios, C. Analysing consumers’ perceived differences in wild and farmed fish. Br. Food J. 2015, 117, 1007–1016. [Google Scholar] [CrossRef]
- European Commission, Directorate-General for Maritime Affairs and Fisheries. EU Consumer Habits Regarding Fishery and Aquaculture Products: Report; Publications Office of the European Union: Luxembourg, 2021. [Google Scholar] [CrossRef]
- Cantillo, J.; Martín, J.C.; Román, C. Determinants of fishery and aquaculture products consumption at home in the EU28. Food Qual. Prefer. 2021, 88, 104085. [Google Scholar] [CrossRef]
- Pu, B.; Zhang, L.; Tang, Z.; Qiu, Y. The Relationship between Health Consciousness and Home-Based Exercise in China during the COVID-19 Pandemic. Int. J. Environ. Res. Public Health 2020, 17, 5693. [Google Scholar] [CrossRef] [PubMed]
- Hartley, C.; Keast, R.S.; Liem, D.G. The Response of More Health Focused and Less Health Focused People to a Physical Activity Calorie Equivalent Label on Discretionary Snack Foods. Nutrients 2019, 11, 525. [Google Scholar] [CrossRef] [PubMed] [Green Version]
- Edwards, J.S.A. An Overview of the Foodservice Consumer. In Handbook of Eating and Drinking; Meiselman, H.L., Ed.; Springer: Cham, Switzerland, 2019; pp. 1–19. [Google Scholar] [CrossRef]
- Eurostat. Final Consumption Expenditure of Households by Consumption Purpose (COICOP 3 digit). 2019. Available online: https://appsso.eurostat.ec.europa.eu/nui/submitViewTableAction.do (accessed on 20 May 2022).
- Krešić, G.; Dujmić, E.; Lončarić, D.; Pleadin, J.; Buneta, A.; Liović, N. Beliefs about wild and farmed fish among catering customers. In Proceedings of the 13th International Scientific and Professional Conference WITH FOOD TO HEALTH, Osijek, Croatia, 16–17 September 2021; pp. 39–51. [Google Scholar]
- Baptista, R.C.; Rodrigues, H.; Sant’Ana, A.S. Consumption, knowledge, and food safety practices of Brazilian seafood consumers. Food Res. Int. 2020, 132, 109084. [Google Scholar] [CrossRef]
- Cantillo, J.; Martín, J.C.; Román, C. Analysis of the main determinants of away-from-home consumption of fishery and aquaculture products in the EU28. Appetite 2021, 163, 105216. [Google Scholar] [CrossRef]
- Girolametti, F.; Annibaldi, A.; Carnevali, O.; Pignalosa, P.; Illuminati, S.; Truzzi, C. Potential toxic elements (PTEs) in wild and farmed Atlantic bluefin tuna (Thunnus thynnus) from Mediterranean Sea: Risks and benefits for human consumption. Food Control 2021, 125, 108012. [Google Scholar] [CrossRef]
- Hassell, K.L.; Barrett, L.T.; Dempster, T.; Kristiansen, T.S. Impacts of human-induced pollution on wild fish welfare. In The Welfare of Fish; Kristiansen, T.S., Fernö, A., Pavlidis, M.A., van de Vis, H., Eds.; Springer International Publishing: Cham, Switzerland, 2020; pp. 487–507. [Google Scholar] [CrossRef]
- Cahu, C.; Salen, P.; De Lorgeril, M. Farmed and wild fish in the prevention of cardiovascular diseases: Assessing possible differences in lipid nutritional values. Nutr. Metab. Cardiovasc. Dis. 2004, 14, 34–41. [Google Scholar] [CrossRef]
- Reig, L.; Escobar, C.; Carrassón, M.; Constenla, M.; Gil, J.M.; Padrós, F.; Piferrer, F.; Flos, R. Aquaculture perceptions in the Barcelona metropolitan area from fish and seafood wholesalers, fishmongers, and consumers. Aquaculture 2019, 510, 256–266. [Google Scholar] [CrossRef]
- Davidson, K.; Pan, M.; Hu, W.; Poerwanto, D. Consumers’ Willingness To Pay for Aquaculture Fish Products Vs. Wild-Caught Seafood—A Case Study in Hawaii. Aquac. Econ. Manag. 2012, 16, 136–154. [Google Scholar] [CrossRef]
- Musa, S.M.; Aura, C.M.; Kundu, R. Wild-Caught Fish versus Aquaculture Fish Products: A Fish Marketing Concept for Aquaculture Quality Improvement, A Case Study of Nyanza Region, Kenya. Int. J. Sci. Res. 2012, 3, 1972–1978. [Google Scholar]
- Claret, A.; Guerrero, L.; Gartzia, I.; Garcia-Quiroga, M.; Ginés, R. Does information affect consumer liking of farmed and wild fish? Aquaculture 2016, 454, 157–162. [Google Scholar] [CrossRef]
- Kole, A.P.W.; Altintzoglou, T.; Schelvis-Smit, R.A.A.M.; Luten, J.B. The effects of different types of product information on the consumer product evaluation for fresh cod in real life settings. Food Qual. Prefer. 2009, 20, 187–194. [Google Scholar] [CrossRef]
- Bronnmann, J.; Hoffmann, J. Consumer preferences for farmed and ecolabeled turbot: A North German perspective. Aquac. Econ. Manag. 2018, 22, 342–361. [Google Scholar] [CrossRef]
- EFSA. Opinion of the scientific panel on contaminants in the food chain on a request from the European Parliament related to the safety assessment of wild and farmed fish. EFSA J. 2005, 3, 236. [Google Scholar] [CrossRef]
- Saavedra, M.; Pereira, T.G.; Carvalho, L.M.; Pousão-Ferreira, P.; Grade, A.; Teixeira, B.; Quental-Ferreira, H.; Mendes, R.; Bandarra, N.; Gonçalves, A. Wild and farmed meagre, Argyrosomus regius: A nutritional, sensory and histological assessment of quality differences. J. Food Compos. Anal. 2017, 63, 8–14. [Google Scholar] [CrossRef]
- Sprague, M.; Dick, J.; Tocher, D. Impact of sustainable feeds on omega-3 long-chain fatty acid levels in farmed Atlantic salmon, 2006–2015. Sci. Rep. 2016, 6, 21892. [Google Scholar] [CrossRef] [PubMed] [Green Version]
- Pinto, V.R.A.; de Campos, R.F.; Rocha, F.; Emmendoerfer, M.L.; Vidigal, M.C.T.R.; da Rocha, S.J.S.S.; Lucia, S.M.D.; Cabral, L.F.M.; de Carvalho, A.F.; Perrone, Í.T. Perceived healthiness of foods: A systematic review of qualitative studies. Future Foods 2021, 4, 100056. [Google Scholar] [CrossRef]
- Schlag, A.K.; Ystgaard, K. Europeans and aquaculture: Perceived differences between wild and farmed fish. Br. Food J. 2013, 115, 209–222. [Google Scholar] [CrossRef]
- Engle, C.R.; Quagrainie, K.K.; Dey, M.M. Seafood and Aquaculture Marketing Handbook, 2nd ed.; Wiley Blackwell: Chichester, UK, 2017. [Google Scholar] [CrossRef]
- Maesano, G.; Di Vita, G.; Chinnici, G.; Pappalardo, G.; D’Amico, M. The Role of Credence Attributes in Consumer Choices of Sustainable Fish Products: A Review. Sustainability 2020, 12, 10008. [Google Scholar] [CrossRef]
- Giacomarra, M.; Crescimanno, M.; Vrontis, D.; Miret Pastor, L.; Galati, A. The ability of fish ecolabels to promote a change in the sustainability awareness. Mar. Policy 2021, 123, 104292. [Google Scholar] [CrossRef]
- Risius, A.; Janssen, M.; Hamm, U. Consumer preferences for sustainable aquaculture products: Evidence from in-depth interviews, think aloud protocols and choice experiments. Appetite 2017, 113, 246–254. [Google Scholar] [CrossRef] [PubMed]
- Risius, A.; Hamm, U.; Janssen, M. Target groups for fish from aquaculture: Consumer segmentation based on sustainability attributes and country of origin. Aquaculture 2019, 499, 341–347. [Google Scholar] [CrossRef]
- Banovic, M.; Reinders, M.J.; Claret, A.; Guerrero, L.; Krystallis, A. A cross-cultural perspective on impact of health and nutrition claims, country-of-origin and eco-label on consumer choice of new aquaculture products. Food Res. Int. 2019, 123, 36–47. [Google Scholar] [CrossRef] [PubMed] [Green Version]
- Masi, M.; Di Pasquale, J.; Vecchio, Y.; Pauselli, G.; Tribilustova, E.; Adinolfi, F. A cross-sectional study in Mediterranean European countries to support stakeholders in addressing future market demands: Consumption of farmed fish products. Aquac. Rep. 2022, 24, 101133. [Google Scholar] [CrossRef]
- Hoque, M.Z.; Alam, M.N. Consumers’ knowledge discrepancy and confusion in intent to purchase farmed fish. Br. Food J. 2020, 122, 3567–3583. [Google Scholar] [CrossRef]
- Pieniak, Z.; Verbeke, W.; Scholderer, J. Health-related beliefs and consumer knowledge as determinants of fish consumption. J. Hum. Nutr. Diet. 2010, 23, 480–488. [Google Scholar] [CrossRef]
- Brucks, M. The effects of product class knowledge on information search behavior. J. Consum. Res. 1985, 12, 1–16. [Google Scholar] [CrossRef]
- Wongprawmas, R.; Sogaria, G.; Gai, F.; Parisi, G.; Menozzi, D.; Mora, C. How information influences consumers’ perception and purchasing intention for farmed and wild fish. Aquaculture 2022, 547, 737504. [Google Scholar] [CrossRef]
- Herrmann, R.O.; Rauniyar, G.P.; Hanson, G.D.; Wang, G. Identifying frequent seafood purchasers in the Northeastern U.S. Agric. Resour. Econ. Rev. 1994, 23, 226–235. [Google Scholar] [CrossRef] [Green Version]
- Ministry of Agriculture Croatia. Nacionalni Plan Razvoja Akvakulture za Razdoblje 2021–2027; Draft. Available online: https://ribarstvo.mps.hr/UserDocsImages/akvakultura/NPRA/NPRA%20nacrt_prosinac.pdf (accessed on 6 July 2022).

| Intention to Consume Farmed Fish | Cluster 1 (n = 206) | Cluster 2 (n = 170) | Cluster 3 (n = 437) | Cluster 4 (n = 164) | p |
|---|---|---|---|---|---|
| In the future I plan to buy farmed fish | 4.29 (0.62) | 3.81 (0.57) | 2.92 (0.46) | 1.82 (0.75) | <0.001 |
| In the future I plan to consume farmed fish in catering facilities | 4.21 (0.56) | 2.66 (0.64) | 2.95 (0.60) | 1.49 (0.62) | <0.001 |
| I will certainly buy farmed fish | 4.25 (0.64) | 3.84 (0.57) | 2.87 (0.44) | 1.88 (0.82) | <0.001 |
| I will certainly consume farmed fish in catering facility | 4.26 (0.62) | 3.06 (0.83) | 3.06 (0.56) | 1.71 | <0.001 |
| Average score (SD) | 4.25 (0.43) | 3.34 (0.34) | 2.95 (0.26) | 1.73 (0.47) | <0.001 |
| Sociodemographic Variables | Total Sample (n = 977) | Cluster 1 (n = 206) | Cluster 2 (n = 170) | Cluster 3 (n = 437) | Cluster 4 (n = 164) | p | |
|---|---|---|---|---|---|---|---|
| Gender (%) | Female | 49.6 | 47.1 | 44.1 | 51.5 | 53.7 | 0.234 |
| Male | 50.4 | 52.9 | 55.9 | 48.5 | 46.3 | ||
| Age (%) | 18–30 | 21.5 | 17.0 | 20.0 | 24.3 | 21.3 | |
| 31–40 | 22.6 | 27.7 | 20.6 | 23.3 | 16.5 | 0.035 | |
| 41–50 | 25.0 | 24.3 | 30.6 | 24.3 | 22.0 | ||
| 51–65 | 30.9 | 31.1 | 28.8 | 28.1 | 40.2 | ||
| Education level (%) | Primary school or lower | 1.4 | 1.0 | 1.2 | 1.6 | 1.8 | |
| Secondary school | 46.1 | 47.1 | 45.9 | 44.9 | 48.2 | 0.972 | |
| Bachelor’s, master’s or higher | 52.5 | 51.9 | 52.9 | 53.5 | 50.0 | ||
| Number of household members; Mean (SD) | 3.29 (1.33) | 3.48 (1.47) | 3.26 (1.32) | 3.25 (1.30) | 3.20 (1.24) | 0.142 | |
| Number of household members under the age of 18; Mean (SD) | 0.62 (0.91) | 0.74 (0.95) | 0.59 (0.89) | 0.60 (0.91) | 0.56 (0.89) | 0.182 | |
| Employment status (%) | Employed full time | 67.3 | 73.3 | 70.0 | 69.1 | 52.4 | 0.012 |
| Part-time employee | 2.8 | 2.4 | 2.9 | 3.0 | 2.4 | ||
| Unemployed | 8.7 | 7.3 | 8.8 | 7.3 | 14.0 | ||
| Retiree | 13.8 | 12.1 | 10.6 | 13.0 | 21.3 | ||
| Student | 7.4 | 4.9 | 7.6 | 7.6 | 9.8 | ||
| Region of living (%) | City of Zagreb | 30.0 | 29.1 | 30.0 | 30.2 | 30.5 | |
| North | 14.2 | 14.6 | 13.5 | 16.9 | 7.3 | ||
| East | 14.5 | 12.6 | 10.6 | 17.8 | 12.2 | 0.001 | |
| Centre | 7.3 | 7.8 | 8.8 | 6.6 | 6.7 | ||
| South-west | 13.5 | 13.1 | 8.2 | 13.5 | 19.5 | ||
| South | 20.5 | 22.8 | 28.8 | 14.9 | 23.8 | ||
| Average household income per month (%) * | Lower | 8.3 | 6.8 | 7.1 | 7.3 | 14.0 | 0.008 |
| Middle | 59.6 | 61.2 | 52.9 | 62.0 | 57.9 | ||
| Upper | 14.1 | 18.0 | 18.8 | 11.7 | 11.0 | ||
| High | 6.3 | 5.3 | 10.6 | 5.3 | 6.1 | ||
| N/A | 11.7 | 8.7 | 10.6 | 13.7 | 11.0 | ||
| Physical activity (%) | 1 day or less | 34.1 | 30.6 | 38.2 | 35.7 | 29.9 | <0.001 |
| 2–3 days | 33.4 | 35.9 | 39.4 | 28.8 | 36.0 | ||
| 4–5 days | 20.0 | 26.2 | 17.1 | 19.2 | 17.1 | ||
| 6–7 days | 12.6 | 7.3 | 5.3 | 16.2 | 17.1 | ||
| Statement | Total Sample | Cluster 1 | Cluster 2 | Cluster 3 | Cluster 4 | p |
|---|---|---|---|---|---|---|
| Safety | ||||||
| Wild fish is safer than farmed fish | 3.12 (1.04) | 3.06 (1.19) | 3.09 (1.00) | 3.08 (0.88) | 3.35 (1.26) | 0.084 |
| Wild fish is more affected by marine pollution than farmed fish | 2.96 (1.08) | 3.07 (1.31) | 2.90 (1.10) | 3.00 (0.88) | 2.80 (1.20) | 0.150 |
| Wild fish contains more heavy metals than farmed fish | 2.83 (1.00) | 2.84 (1.26) | 2.84 (0.97) | 2.85 (0.81) | 2.77 (1.09) | 0.873 |
| Wild fish contains more antibiotics than farmed fish | 2.22 (1.09) | 2.12 (1.23) | 2.22 (1.02) | 2.33 (0.99) | 2.07 (1.19) | 0.057 |
| Wild fish is more affected by parasites (Anisakis) than farmed fish | 2.90 (0.94) | 3.08 a (1.16) | 2.85 a,b (0.89) | 2.92 a (0.78) | 2.67 b (1.03) | 0.003 |
| Wild fish has a healthier diet than farmed fish | 3.65 (1.05) | 3.76 a,b (1.12) | 3.62 a,b (1.03) | 3.54 a (0.94) | 3.84 b (1.23) | 0.008 |
| Wild fish is healthier than farmed fish | 3.59 (1.08) | 3.63 a,b (1.17) | 3.54 a (1.04) | 3.48 a (0.97) | 3.87 b (1.21) | 0.003 |
| Quality | ||||||
| Wild fish is of better quality than farmed fish | 3.77 (1.06) | 3.87 a (1.07) | 3.78 a,b (1.03) | 3.61 b (0.98) | 4.04 a (1.21) | <0.001 |
| Wild fish is fresher than farmed fish | 3.05 (1.13) | 2.93 a (1.24) | 2.88 a (1.09) | 3.09 a,b (1.00) | 3.28 b (1.29) | 0.008 |
| Wild fish is more nutritious than farmed fish | 3.41 (1.08) | 3.44 a,b (1.19) | 3.29 a (1.15) | 3.34 a (0.92) | 3.70 b (1.22) | 0.004 |
| Wild fish is more fatty than farmed fish | 2.29 (1.17) | 2.27 a,b (1.37) | 2.16 a (1.10) | 2.44 b (1.04) | 2.07 a (1.27) | 0.001 |
| Wild fish tastes better than farmed fish | 3.78 (1.06) | 3.91 a (1.11) | 3.78 a,b (1.00) | 3.62 b (0.96) | 4.05 a (1.21) | <0.001 |
| Wild fish is firmer than farmed fish | 3.57 (1.05) | 3.77 a (1.11) | 3.51 a,b (1.02) | 3.46 b (0.92) | 3.70 a,b (1.25) | 0.002 |
| Control | ||||||
| Wild fish is more controlled than farmed fish | 2.53 (1.05) | 2.44 a,b (1.24) | 2.35 a (1.02) | 2.62 b (0.92) | 2.62 a,b (1.12) | 0.012 |
| Wild fish is more handled than farmed fish | 2.88 (1.02) | 2.96 (1.21) | 2.85 (1.04) | 2.88 (0.88) | 2.79 (1.12) | 0.562 |
| Wild fish is more artificial than farmed fish | 1.99 (1.07) | 1.96 a,b (1.27) | 1.99 a (1.02) | 2.11 a (0.98) | 1.69 b (1.05) | <0.001 |
| Wild fish provides more guarantees than farmed fish | 3.28 (1.09) | 3.24 a (1.25) | 3.08 a (1.03) | 3.25 a (0.93) | 3.62 b (1.26) | <0.001 |
| Purchase | ||||||
| Wild fish is easier to find than farmed fish | 2.39 (1.10) | 2.24 a (1.31) | 2.26 a (1.12) | 2.52 b (0.94) | 2.36 a,b (1.15) | 0.006 |
| Wild fish is cheaper than farmed fish | 2.47 (1.19) | 2.38 (1.35) | 2.34 (1.24) | 2.56 (1.04) | 2.47 (1.28) | 0.128 |
| Information | Total Sample | Cluster 1 | Cluster 2 | Cluster 3 | Cluster 4 | p |
|---|---|---|---|---|---|---|
| Shelf life | 4.45 (0.84) | 4.60 a (0.79) | 4.46 a,b (0.87) | 4.32 b (0.86) | 4.60 a (0.77) | <0.001 |
| Nutritional value | 3.51 (1.07) | 3.53 (1.14) | 3.42 (1.08) | 3.54 (0.95) | 3.51 (1.26) | 0.639 |
| List of ingredients | 3.72 (1.05) | 3.92 a (1.10) | 3.69 a,b (1.07) | 3.61 b (0.96) | 3.79 a,b (1.16) | 0.004 |
| Country of origin | 4.21 (0.94) | 4.48 a (0.71) | 4.21 b (0.95) | 4.05 b (0.92) | 4.26 a,b (1.14) | <0.001 |
| Information about production method (wild or farmed fish) | 3.82 (1.00) | 4.02 a (0.98) | 3.75 b (0.97) | 3.71 b (0.95) | 3.96 a,b (1.16) | <0.001 |
| Product brand (producer) | 3.61 (1.05) | 3.79 a (1.03) | 3.55 a,b (1.04) | 3.49 b (1.00) | 3.76 a (1.15) | 0.002 |
| Processing method | 3.81 (0.96) | 4.12 a (0.88) | 3.78 b (0.94) | 3.65 b (0.90) | 3.86 a,b (1.11) | <0.001 |
| Quality label | 3.97 (0.93) | 4.17 a (0.90) | 3.96 a,b (0.90) | 3.84 b (0.90) | 4.10 a (1.04) | <0.001 |
| Eco-label | 3.63 (1.07) | 3.88 a (1.07) | 3.64 a,b (1.00) | 3.53 b (0.99) | 3.55 b (1.27) | <0.001 |
| If the product was previously frozen | 4.18 (0.94) | 4.46 a (0.82) | 4.21 b (0.97) | 4.03 b (0.90) | 4.22 a,b (1.06) | <0.001 |
| Recommended method of preparation | 3.29 (1.09) | 3.33 (1.16) | 3.19 (1.09) | 3.29 (0.99) | 3.32 (1.21) | 0.645 |
| Type of Product | Total Sample | Cluster 1 | Cluster 2 | Cluster 3 | Cluster 4 | p |
|---|---|---|---|---|---|---|
| Fresh, whole | 3.80 (1.32) | 4.15 a (1.17) | 3.74 b (1.32) | 3.68 b (1.32) | 3.76 b (1.42) | <0.001 |
| Fresh, cleaned | 3.97 (1.15) | 4.16 a (1.11) | 4.02 a,b (1.06) | 3.94 a,b (1.10) | 3.76 b (1.34) | 0.017 |
| Fresh fillets | 3.70 (1.21) | 3.77 (1.30) | 3.65 (1.10) | 3.76 (1.13) | 3.47 (1.35) | 0.074 |
| Frozen, whole | 2.89 (1.23) | 3.11 a (1.26) | 2.88 a (1.25) | 2.95 a (1.19) | 2.43 b (1.20) | <0.001 |
| Frozen fillets | 3.36 (1.18) | 3.55 a (1.13) | 3.34 a (1.16) | 3.45 a (1.11) | 2.90 b (1.34) | <0.001 |
| Canned | 2.88 (1.19) | 3.16 a (1.17) | 2.81 b (1.14) | 2.85 b (1.18) | 2.66 b (1.24) | <0.001 |
| Smoked or dried fish | 2.27 (1.19) | 2.51 a (1.29) | 2.44 a,b (1.17) | 2.24 b (1.15) | 1.88 c (1.10) | <0.001 |
| Fish products (sticks, burger) | 2.49 (1.26) | 2.62 a (1.33) | 2.44 a,b (1.22) | 2.56 a (1.20) | 2.21 b (1.34) | 0.014 |
| Knowledge | Total Sample | Cluster 1 | Cluster 2 | Cluster 3 | Cluster 4 | p |
|---|---|---|---|---|---|---|
| Objective knowledge | 5.60 (0.97) | 5.74 a (0.88) | 5.61 a,b (0.88) | 5.59 a,b (1.02) | 5.42 b (1.04) | 0.021 |
| Subjective knowledge | 3.05 (0.97) | 3.46 a (0.94) | 3.04 b (0.87) | 2.94 b (0.92) | 2.88 b (1.11) | <0.001 |
| Place * | Total Sample (%) | Cluster 1 (%) | Cluster 2 (%) | Cluster 3 (%) | Cluster 4 (%) | p |
|---|---|---|---|---|---|---|
| In shopping mall | 68.4 | 75.7 a | 75.9 a | 68.0 b | 52.4 c | <0.001 |
| In local store | 14.6 | 18.9 a | 14.7 a,b | 14.9 a | 8.5 b | 0.047 |
| At the fish market | 78.1 | 84.5 | 78.8 | 75.1 | 77.4 | 0.062 |
| Directly from fisherman | 23.8 | 21.8 b,c | 26.5 a,b | 19.2 c | 32.3 a | 0.005 |
| On the farm | 9.2 | 17.0 a | 14.1 a | 5.5 b | 4.3 b | <0.001 |
| Self-catch | 14.8 | 16.0 b | 8.8 c | 12.6 b,c | 25.6 a | <0.001 |
| Source * | Total Sample (%) | Cluster 1 (%) | Cluster 2 (%) | Cluster 3 (%) | Cluster 4 (%) | p |
|---|---|---|---|---|---|---|
| Television | 61.8 | 65.0 | 65.9 | 59.3 | 60.4 | 0.327 |
| Internet | 70.9 | 81.6 a | 75.3 a,b | 68.2 b,c | 60.4 c | <0.001 |
| Radio | 16.2 | 18.9 | 16.5 | 14.2 | 17.7 | 0.438 |
| Newspaper | 28.1 | 34.5 a | 34.1 a,b | 24.3 c | 24.4 b,c | 0.009 |
| Fisherman/salesman | 28.2 | 28.2 | 25.3 | 29.1 | 29.3 | 0.811 |
| Friends/relatives/family | 47.8 | 52.9 | 47.6 | 46.7 | 44.5 | 0.378 |
| Doctor | 26.5 | 28.6 | 23.5 | 26.5 | 26.8 | 0.738 |
| Professional and scientific literature | 27.0 | 29.1 | 27.6 | 27.0 | 23.8 | 0.713 |
| Personal experience | 54.9 | 64.1 a | 53.5 b | 51.5 b | 53.7 b | 0.026 |
Publisher’s Note: MDPI stays neutral with regard to jurisdictional claims in published maps and institutional affiliations. |
© 2022 by the authors. Licensee MDPI, Basel, Switzerland. This article is an open access article distributed under the terms and conditions of the Creative Commons Attribution (CC BY) license (https://creativecommons.org/licenses/by/4.0/).
Share and Cite
Krešić, G.; Dujmić, E.; Lončarić, D.; Zrnčić, S.; Liović, N.; Pleadin, J. Profiling of Croatian Consumers Based on Their Intention to Consume Farmed Fish. Foods 2022, 11, 2158. https://doi.org/10.3390/foods11142158
Krešić G, Dujmić E, Lončarić D, Zrnčić S, Liović N, Pleadin J. Profiling of Croatian Consumers Based on Their Intention to Consume Farmed Fish. Foods. 2022; 11(14):2158. https://doi.org/10.3390/foods11142158
Chicago/Turabian StyleKrešić, Greta, Elena Dujmić, Dina Lončarić, Snježana Zrnčić, Nikolina Liović, and Jelka Pleadin. 2022. "Profiling of Croatian Consumers Based on Their Intention to Consume Farmed Fish" Foods 11, no. 14: 2158. https://doi.org/10.3390/foods11142158
APA StyleKrešić, G., Dujmić, E., Lončarić, D., Zrnčić, S., Liović, N., & Pleadin, J. (2022). Profiling of Croatian Consumers Based on Their Intention to Consume Farmed Fish. Foods, 11(14), 2158. https://doi.org/10.3390/foods11142158