Article

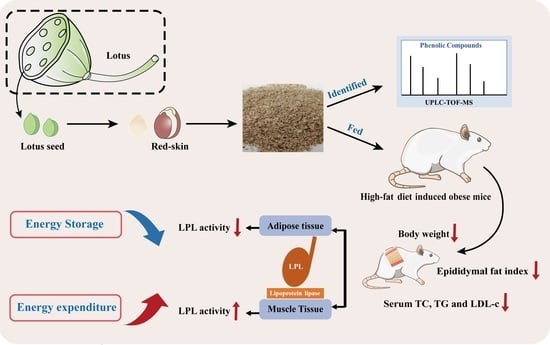
Red-Skin Extracts of Lotus Seeds Alleviate High-Fat-Diet Induced Obesity via Regulating Lipoprotein Lipase Activity

1
China-Canada Joint Laboratory of Food Nutrition and Health (Beijing), Beijing Engineering and Technology Research Center of Food Additives, School of Food and Health, Beijing Technology & Business University (BTBU), Beijing 100048, China
2
Beijing Academy of Food Sciences, Beijing 100068, China
*
Author to whom correspondence should be addressed.
Foods 2022, 11(14), 2085; https://doi.org/10.3390/foods11142085
Submission received: 23 June 2022 / Revised: 8 July 2022 / Accepted: 11 July 2022 / Published: 13 July 2022
(This article belongs to the Special Issue Intervention Effect of Natural Food Products on Chronic Diseases)

Abstract

:
In recent years, obesity has become an epidemic and an important public health concern. This study was designed to explore the anti-obesity effects of red-skin extracts (RSE) from lotus seeds on high-fat-diet (HFD)-fed mice. In this study, a total of 55 phenolic compounds from the RSE were tentatively characterized using a UPLC-Q/TOF-MS system, including 9 phenolic acids and derivatives, 40 flavonoids, 2 proanthocyanidin, and 4 coumarins and derivatives. Our data demonstrated that RSE could significantly ameliorate obesity characteristics of HFD-fed mice by regulating tissue specific lipoprotein lipase (LPL) activities. In detailed, the activity and expression of LPL in adipose tissue was inhibited, and the activity and expression of LPL in skeletal muscle tissue was enhanced. Overall, these findings suggested that RSE from the red skin of lotus seeds could serve as a great candidate for a value-added, functional ingredient due to its anti-obesity effects via the regulation of LPL activity.

Graphical Abstract

1. Introduction

Obesity is often associated with chronic diseases such as arteriosclerosis, hypertension, and diabetes [1,2,3]. It has now become one of the most important health issues of modern society around the world. The occurrence of obesity is due to the energy imbalance between calorie intake and calorie expenditure [4]. Controlling food intake and increasing energy expenditure are the two important principles during the weight-loss process. Lipoprotein lipase (LPL) plays an important role in catalyzing the hydrolysis of the triglycerides-rich lipoproteins, chylomicrons, and very low-density lipoproteins into fatty acids and monoacylglycerol, thereby changing lipids metabolism [5]. These fatty acids and monoacylglycerol are either used by the muscles for metabolic energy or re-esterified into triglyceride (TG) and stored as lipids in adipose tissue. Therefore, if skeletal muscle-specific LPL activity is increased, or adipose tissue-specific LPL activity is decreased, it may be able to reduce fat accumulation and increase energy expenditure, achieving the purpose of anti-obesity. Consequently, compounds that can regulate activity of LPL in muscles tissue and adipose tissue are supposed to function as anti-obesity agents. Recently, it has been proven that polyphenols could regulate the activity of LPL and then ameliorate obesity and its associated ailments. Huang et al. [6] found that green tea polyphenols notably up-regulated LPL activity in skeletal muscles to alleviate obesity in broiler chickens. Liu et al. [7] suggested that polyphenol-enriched extract of Rosa rugosa thunb. could significantly increase LPL activity by induction of AMPK signaling activity. Serisier et al. [8] reported that dogs who were given green-tea extract for 12 weeks could significantly down-regulate LPL expression in adipose tissues and up-regulate LPL expression in skeletal muscle compared with baseline.
Lotus (Nelumbo nucifera Gaertn.) is an important flowering aquatic plant that has been cultivated for over 3000 years in China [9]. Today, lotus is widely cultivated and honored in Asia, America, and Oceania [10]. The Chinese herb “Lian-Zi”, which is the seed of the lotus, has been used for medicinal purposes as an astringent, tonic, and sedative in oriental countries [11]. Lotus seed red skin is the seed coat of lotus seed, which is the inedible part and thus the by-product of lotus seed manufacturing. According to statistics, the production of red skin from lotus seed reaches about 5000 tons per year in China, resulting in the waste of resources and environmental pollution [12]. Nowadays, red skin from lotus seed is attracting more and more attention due to its healthy properties [13]. Red skin from lotus seed contains abundant functional components, including polysaccharide, polyphenols, and alkaloids, which are associated with anti-oxidation, anti-obesity, anti-inflammatory, and other pharmacological activities. Kredy et al. [14] proved that red skin of lotus seed contained high level of glycosylated flavonols, which exhibited beneficial disease prevention due to the high antioxidant properties. Red skin from lotus seed has been reported to possess the abundance of polyphenols, thereby supporting anti-obesity effects. Cao et al. [15] found that the phenol extract of lotus seed red skin administration significantly lowered the serum leptin level and improved the serum and liver lipid profiles, suppressing lipid peroxidation in hepatic tissue. Further, the extract ameliorated obesity, insulin resistance, and oxidative damage in obese mice. However, there is no other detailed information about the anti-obesity property of the red skin from lotus seed, especially via regulating lipoprotein lipase activity. Moreover, the interaction mechanism between lotus seed red skin and anti-obesity has not been clarified.
Therefore, this study was designed to explore the anti-obesity effects of RSE from lotus seed on high-fat diet-fed mice and determine the anti-obesity properties through regulating the LPL activity in vivo. Furthermore, the interaction mechanism between RSE and LPL were identified to explore the action of regulating LPL activity. The obtained information may help in elucidating the novel intervention effect of RSE from lotus seeds in high-fat-diet-induced obesity and seeking a potential compound with excellent anti-obesity attributes.

2. Materials and Methods

2.1. Materials and Chemicals

Red skin of lotus seeds was purchased from Sanxianglianye Trading Co., Ltd. (Hangzhou, China) Polyamide was purchased from Changfeng Chemical Co., Ltd. (Changzhou, China) All the other chemicals used were either of analytical grade or of the highest purity commercially available.

2.2. Preparation of Lotus Seed Red-Skin Extracts

A portion of 10 g sample powder was dissolved in 180 mL of 60% ethanol overnight at 49 °C. The mixture was ultrasonicated for 9.5 min at 30 °C at 300 W. The ethanol extracts of red skin were then concentrated in a rotary evaporator at 40 °C [16]. The concentrated solution was purified on a polyamide resin column. The column was stepwise eluted successively with deionized water and 90% ethanol solution. The organic phase was collected and freeze-dried as the red-skin extracts [2]. The extracts were stored at −20 °C for chemical composition and biological activity analysis.

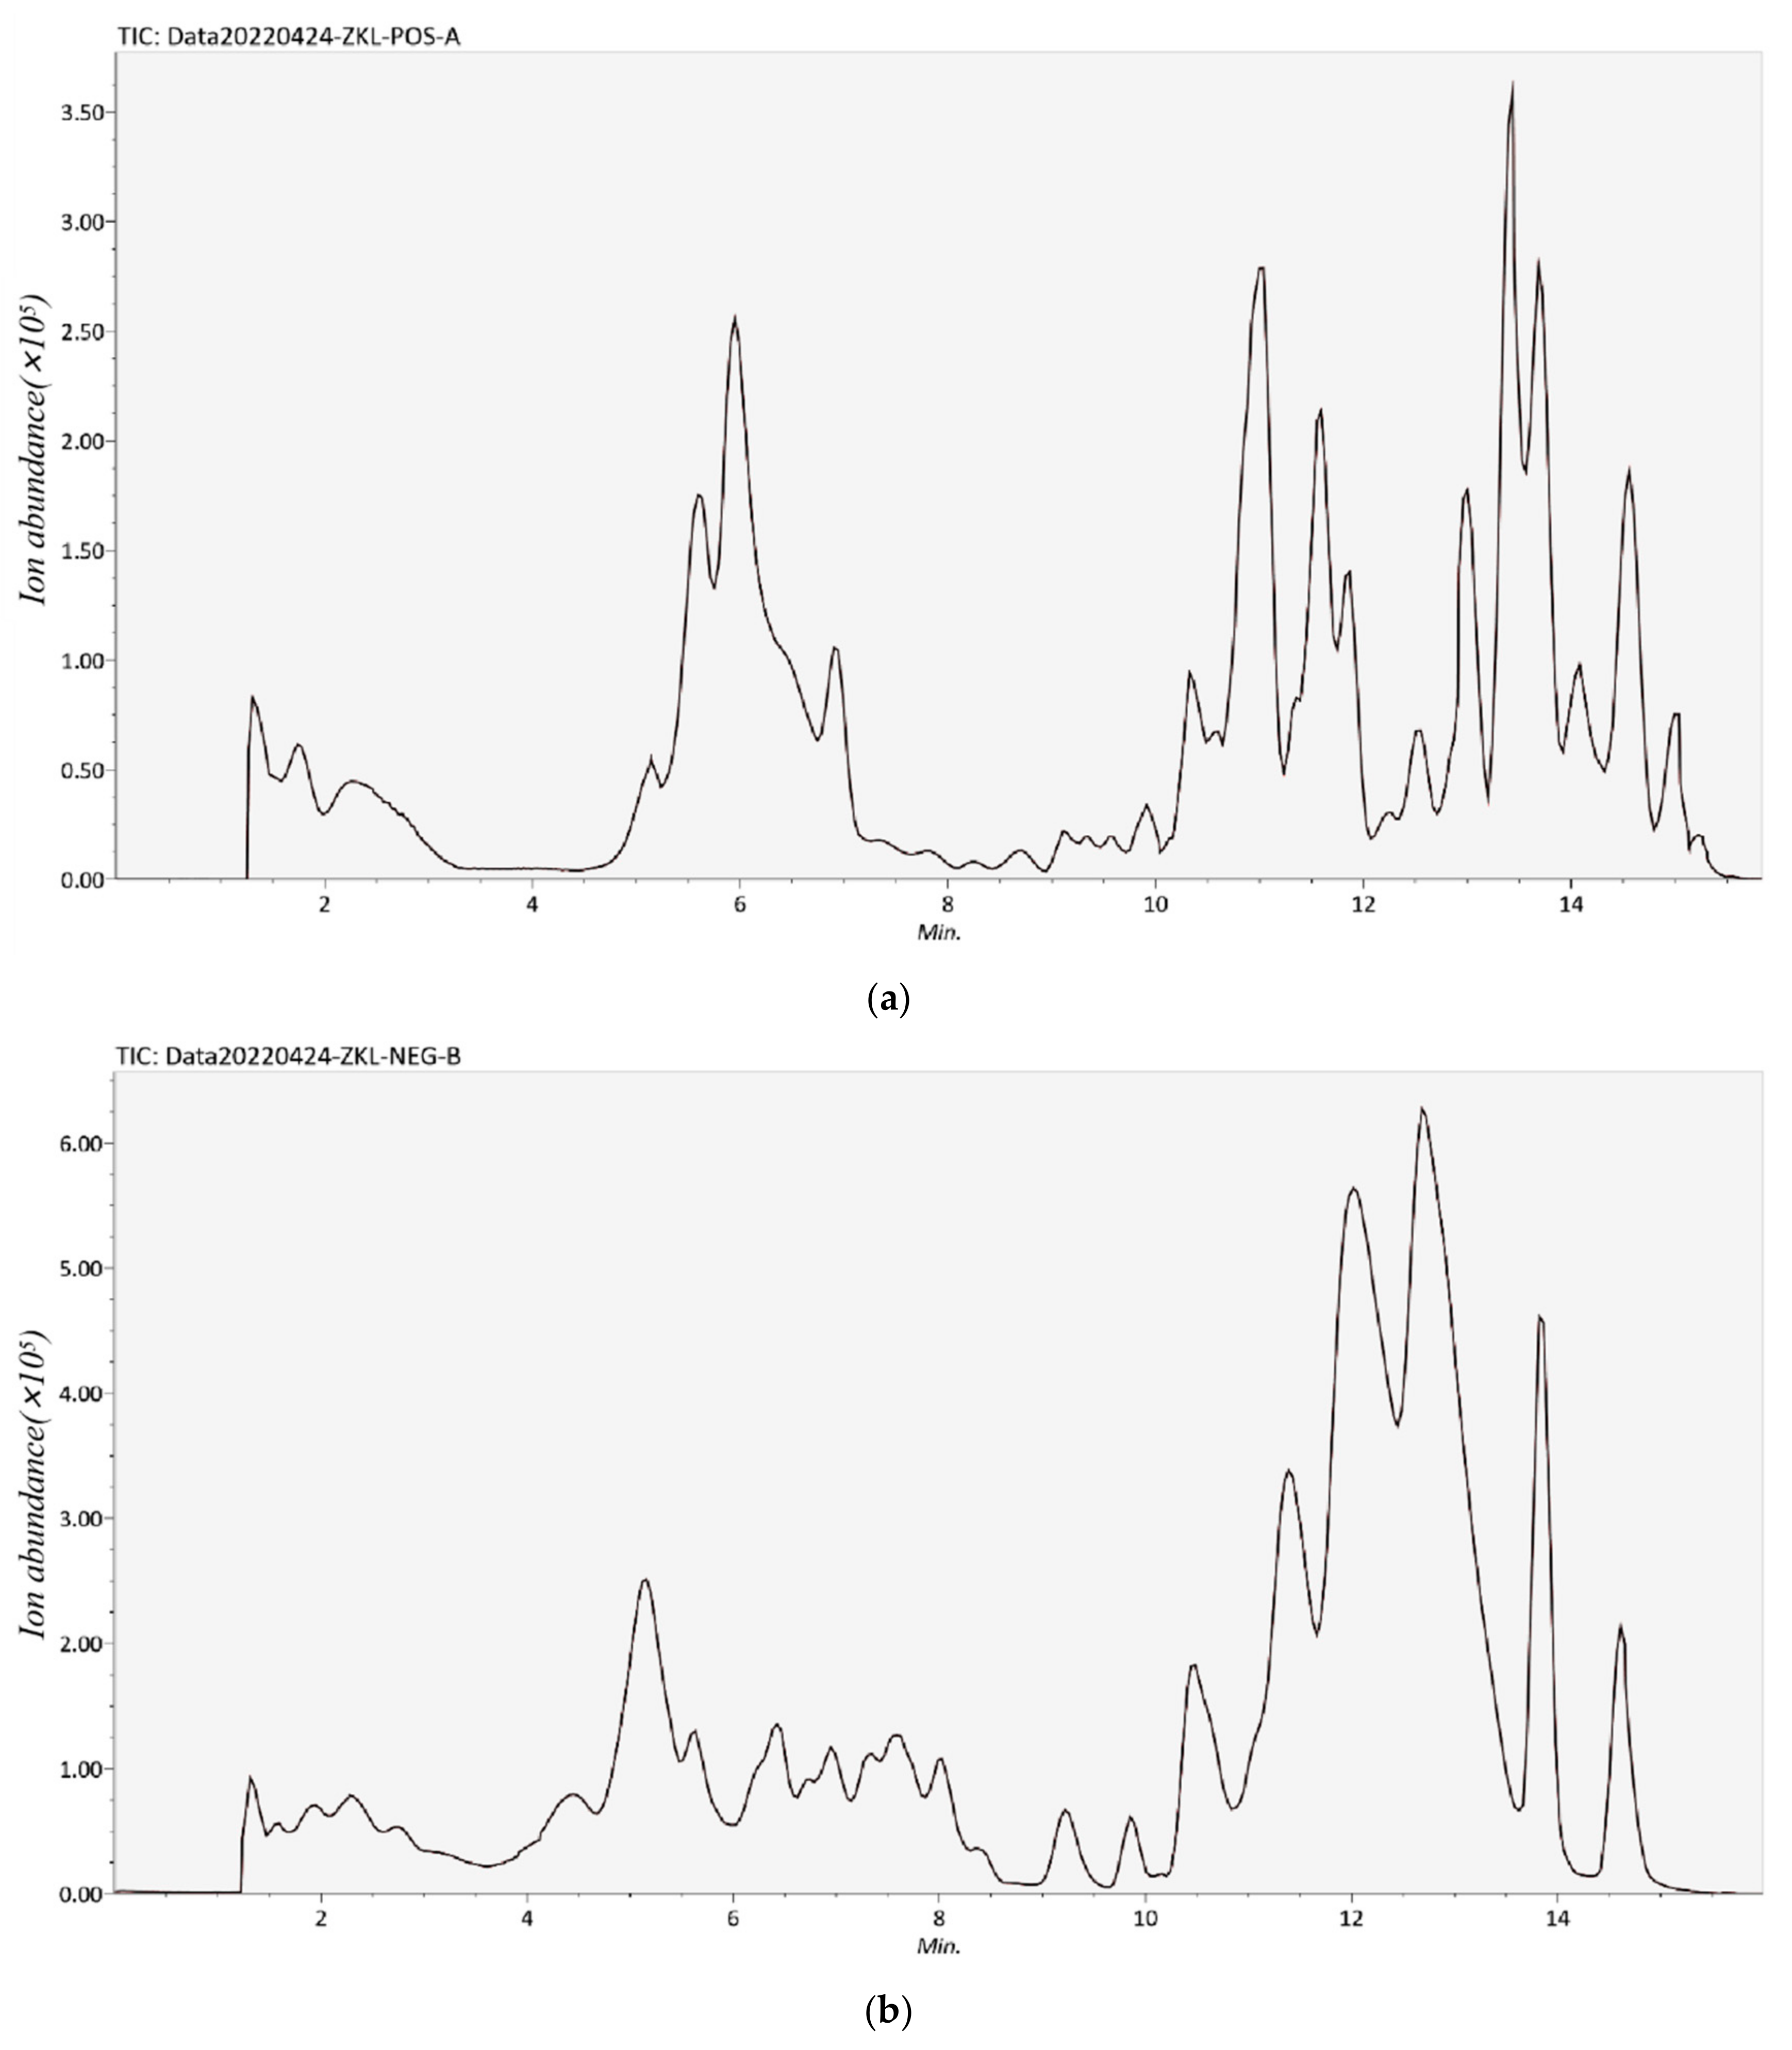
2.3. Identification of Phenolic Compounds by UPLC-TOF-MS

The UPLC-TOF/MS analysis was performed using a Nexera LC-30A (Shimadzu) coupled to the Triple TOFTM 5600+ (AB SCIEXTM, Singapore), a Hybrid Quadrupole-TOF LC/MS/MS Mass Spectrometer, with electrospray ionization (ESI) in positive and negative modes. The separation was performed on a UHPLC column (150 mm × 2.1 mm, 1.7 μm, Waters BEH C18) at a flow rate of 0.3 mL/min. The mobile phase composed of an association of solvent A (water with 0.1% formic acid) and solvent B (acetonitrile). The initial composition of B was 5% and increased to 20% at 4 min, 95% at 12 min, and was then maintained at 95% to 16 min.
For MS analysis, in an information-dependent acquisition (IDA) model, the optimized mass condition was as follows: positive ion source temperature 500 °C, negative ion source temperature 450 °C, ion source gas 1 (GAS 1) 50 psi, ion source gas 2 (GAS 2) 50 psi, Curtain gas (CUR) 25 psi, and ion spray voltage floating (ISVF) 5500 V (positive) and 4400 V (negative). The TOF mass scan range was m/z 100–1200 Da with an accumulation time of 0.2 s, and the product ion scan range was 50–1000 Da with an accumulation time of 0.01 s. SWATH MS/MS experiments acquired spectra in high-sensitivity mode (declustering potential (DP) ± 60 V, collision energy 35 ± 15 eV).

2.4. Animals Study

Ninety male Kunming mice (6 weeks old, body eight 20.0 ± 2.0 g) were purchased from Beijing Vital River Laboratory Animal Technology Co., Ltd. (Beijing, China) All the animal experiments were allowed and performed according to the Guidelines of the Laboratory Animal Ethical Committee of Beijing Vital River Laboratory Animal Technology Co., Ltd. (P2020033). The mice were kept in a regular environment room; the temperature was maintained at 20 ± 2 °C; the humidity was 40–60%; and a light and dark cycle of 12 h was implemented in specific, pathogen-free conditions. After an adaptation period of 1 week, mice were weighed and randomly divided into three treatment groups (n = 30 per group). The normal chow group (NC group) was fed with normal chow diet (D12450J: 10 kcal% fat, 20 kcal% protein, 70% kcal carbohydrate, Beijing vital river laboratory animal technology Co., Ltd. (Beijing, China) with supplementary 200 μL water by intragastric gavage. The high-fat-diet group (HFD group) was fed with a high-fat diet (D12492: 60 kcal% fat, 20 kcal% protein, 20% kcal carbohydrate, Beijing vital river laboratory animal technology Co., Ltd.) (Beijing, China) with administration of 200 μL water by intragastric gavage. The RSE treatment group (RSE group) had HFD with treatments of 500 mg/kg·bw/d red-skin extracts by intragastric gavage. All the mice had ad libitum access to diet and water. During the period of experiment, the food consumption and body weight were recorded weekly. At weeks 3, 6, and 9, 30 mice (including 10 mice from NC group, 10 mice from HFD group, and 10 mice from RSE group) were anesthetized with diethyl ether after overnight fasting for 12 h, and blood samples were collected using vacuum tubes containing sodium citrate. The plasma was isolated by centrifugation under 3000 r/min at 4 °C for 10 min and stored at −80 °C for further analysis. Epididymis adipose tissues and skeletal muscle tissues were immediately frozen in liquid nitrogen and stored at −80 °C for further studies.

2.5. Serum Biochemical Analyses

Serum levels of total cholesterol (TC), triglyceride (TG), low-density lipoprotein cholesterol (LDL-C), and high-density lipoprotein cholesterol (HDL-C) were analyzed using commercial kits (Nanjing Jiancheng Bioengineering Institute, Nanjing, China).

2.6. LPL Activity Measurements

Frozen epididymis adipose tissues and skeletal muscle tissues were homogenized in 9 volumes of physiological saline. The homogenates were centrifuged for 20 min at 3100× g, 4 °C. Aliquots of the supernatants were used for determination of tissue LPL activity according to the direction of commercial kits (Nanjing Jiancheng Bioengineering Institute, Nanjing, China). Activity of LPL was expressed in μmol fatty acid liberated per (hour mg protein).

2.7. Western Blot Analysis

Western blot analysis was performed according to a previously reported literature with some slight modifications [17]. Briefly, epididymis adipose tissues and skeletal muscle tissue samples were homogenized and lysed in radio immunoprecipitation assay (RIPA) buffer. Then, the lysates were centrifuged at 14,000× g for 20 min at 4 °C to obtain the supernatant. The protein content of the supernatant was quantified by using a protein assay kit. The protein concentration for each sample was adjusted to an equal amount with different volumes of loading buffer and denatured in boiling water for 5 min. Then, equal amounts (20 μg) of proteins were loaded onto 10% SDS-polyacrylamide gel electrophoresis and then transferred to polyvinyl difluoride membranes under the condition of 1.5 A and 20 V for 60 min. The membranes were blocked with 5% albumin bovine serum containing 0.1% Tween-20 (TBST) for 60 min and washed with 0.1% Tris Buffered Saline Tween incubated (TBST) for three times followed by incubation overnight at 4 °C with primary antibodies. After that, the membranes were washed with 0.1% TBST for 15 min and incubated with secondary antibodies for another 1.5 h. Finally, membranes were visualized with ECL kit and scanned by ChemiDoc XRS+. β-actin was used as the internal control.

2.8. RNA Extraction and RT-PCR Analysis

Epididymis adipose tissues and skeletal muscle tissues samples were cut into small pieces and homogenized. The total RNA was extracted with the TRIzol reagent following the manufacturer’s protocol and quantified using a Nanodrop 1000 spectrophotometer. First-strand cDNA synthesis was performed using an iScript reverse transcriptase kit. Quantitative real-time polymerase chain reaction (qRT-PCR) was conducted using the SYBR Green mix and ABI 7900 HT. qRT-PCR conditions were operated by the procedure as described in commercial introduction. Statistical analysis of qRT-PCR was performed using the 2−ΔΔCT method, which calculated the relative changes in gene expression of the target normalized to endogenous reference gene GAPDH [18]. Specific forward and reverse primer sequences as follows were used in this study: LPL (Forward: 5′- GCCTGAGTTGTAGAAAGAATCG -3′, Reverse: 5′- CTCAGTCCCAGAAAAGTGAATC-3′); GAPDH (Forward: 5′- ACAGCAACAGGGTGGTGGAC -3′, Reverse: 5′-TTTGAGGGTGCAGCGAACTT-3′).

2.9. Statistical Analysis

Data are reported as the mean ± standard deviation (SD). Statistical significance was assessed by the one-way ANOVA procedure followed by Tukey test using SPSS software (Version 22 for Windows, IBM, New York, NY, USA). Statistical significance was declared at p < 0.05 or p < 0.01.

3. Results and Discussions

3.1. Identification or Tentatively Characterization of Phenolic Compounds in RSE

A total of 55 phenolic compounds from the RSE were identified or tentatively characterized using a UPLC-Q/TOF-MS system, including 9 phenolic acids and derivatives, 40 flavonoids, 2 proanthocyanidin, and 4 coumarins and derivatives (Table 1). Base peak intensity chromatograms in positive and negative mode of RSE are shown in Figure 1. The phenolic compounds were tentatively identified by analyzing and comparing their retention times, observed m/z, MS spectra, major MS2 fragment ions, as well as the MS data in the MassBank, Respect, and GNPS databases.
The detected phenolic acid compounds included 2-acetylacteoside (1), 1-(3,4-dimethoxycinnamoyl) piperidine (3), (E)-3-[2-[ (2S,3R,4S,5S,6R) -3,4,5- trihydroxy-6- (hydroxymethyl) oxan-2-yl] oxyphenyl] prop-2-enoic acid (7), 2,5-dihydroxybenzoic acid (10), protocatechuic aldehyde (18), methyl rosmarinate (19), isoferulic acid (38), sinapic acid (42), taxifolin (46), and sinapoylcholine (54). Among them, components 1, 7, 19, and 55 were coumaric acid derivatives, component 3 was a cinnamic acid derivative, and component 45 was a sinapic acid derivative. The monomers easily produced fragment ions by eliminating small molecules, such as H2O (18 Da), CO (28 Da), and CO2 (43Da).
The 41 flavonoids tentatively identified in RSE could be further divided into flavone aglycones, C-glycosyl flavonoids, and O-glycosyl flavonoids. The identified flavone aglycones included gallocatechin (6), casticin (11), 5,7-dihydroxy-2-(3-hydroxy-4-methoxyphenyl)-2,3-dihydro-4H-chromen-4-one (15), catechin (17), (–)-epigallocatechin (21), 7-hydroxy-3-phenyl-4H-chromen-4-one (25), quercetin (27), 8-(azepan-1-ium-1-ylmethyl)-3- (2,4-dimethoxyphenyl) -2-oxo-2H-chromen-7-olate (30), 4′,7-Di-O-methylnaringenin (31), 2-(3,4-dihydroxyphenyl)-5-hydroxy-10-isopropyl-9,10-dihydropyrano [2,3-f] chromene-4,8-dione (33), 7-hydroxy-3-phenyl-4H-chromen-4-on (36), isoquercitin (39), kaempferol (43), 4′,5,7-Trihydroxy-6,8-diprenylisoflavone (44), isorhamnetin (48), genistein (51), and diosmetin (52).
Overall, there were 13 O-glycosyl flavonoids, including 2 isoflavonoid derivates (14, 45), 1 myricetin derivate (23), 3 quercetin derivates (28, 29, 40), 1 isorhamnetin derivate (49), 1 vitexin derivate (53), 9-(2,3-dihydroxypropoxy)-9-oxononanoic acid (50), spiraeoside (32), liquiritin (34), hyperoside (41), and 3-[(2S,3R,4S,5R,6R)-3,5-dihydroxy-6- (hydroxymethyl)-4- [(2S,3R,4R,5R,6S)-3,4,5- trihydroxy-6-methyloxan-2-yl]oxyoxan-2-yl]oxy-5,7-dihydroxy-2-(4-hydroxyphenyl)chromen-4-one (47). The O-glycosyl flavonoids showed high intensity of aglycone via losing saccharide groups, such as rhamnose (146 Da), C6H10O5 (162 Da), and rhamnosylglucose (308Da). Components 2, 4, 20, 22, 24, 35, and 37 were all categorized as C-glucosides flavonoids.
Besides flavonoids, there were four coumarins and derivatives, including 6-methylcoumarin (5), 6-methoxy-4-methyl-2H-chromen-2-one (8), praeruptorin A (13), and 3,4-dihydrocoumarin (55); two retrocharlcones, including chalcone (9) and 2-hydroxychalcone (26); and two proanthocyanidins, including procyanidin B2 (12) and procyanidin C1 (16).

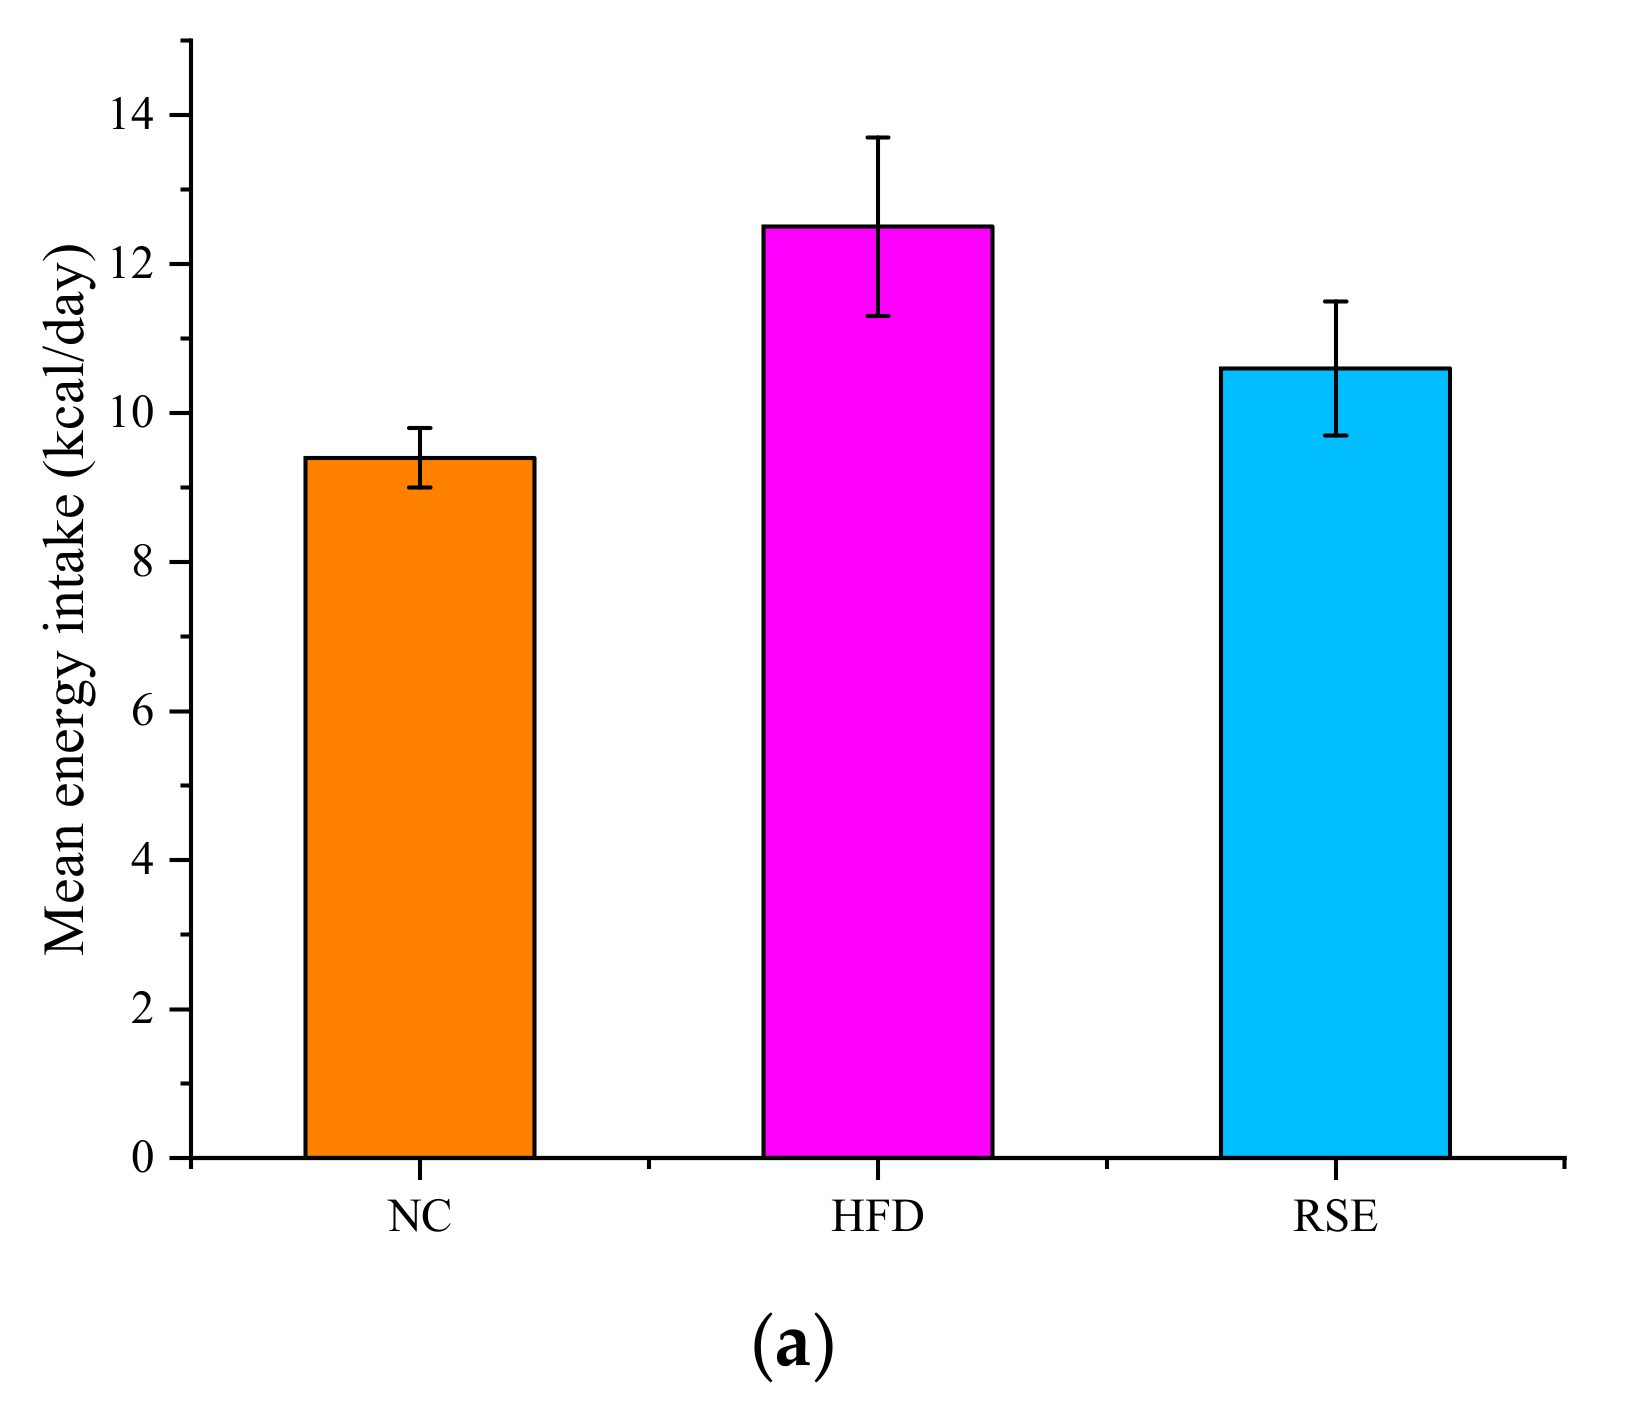
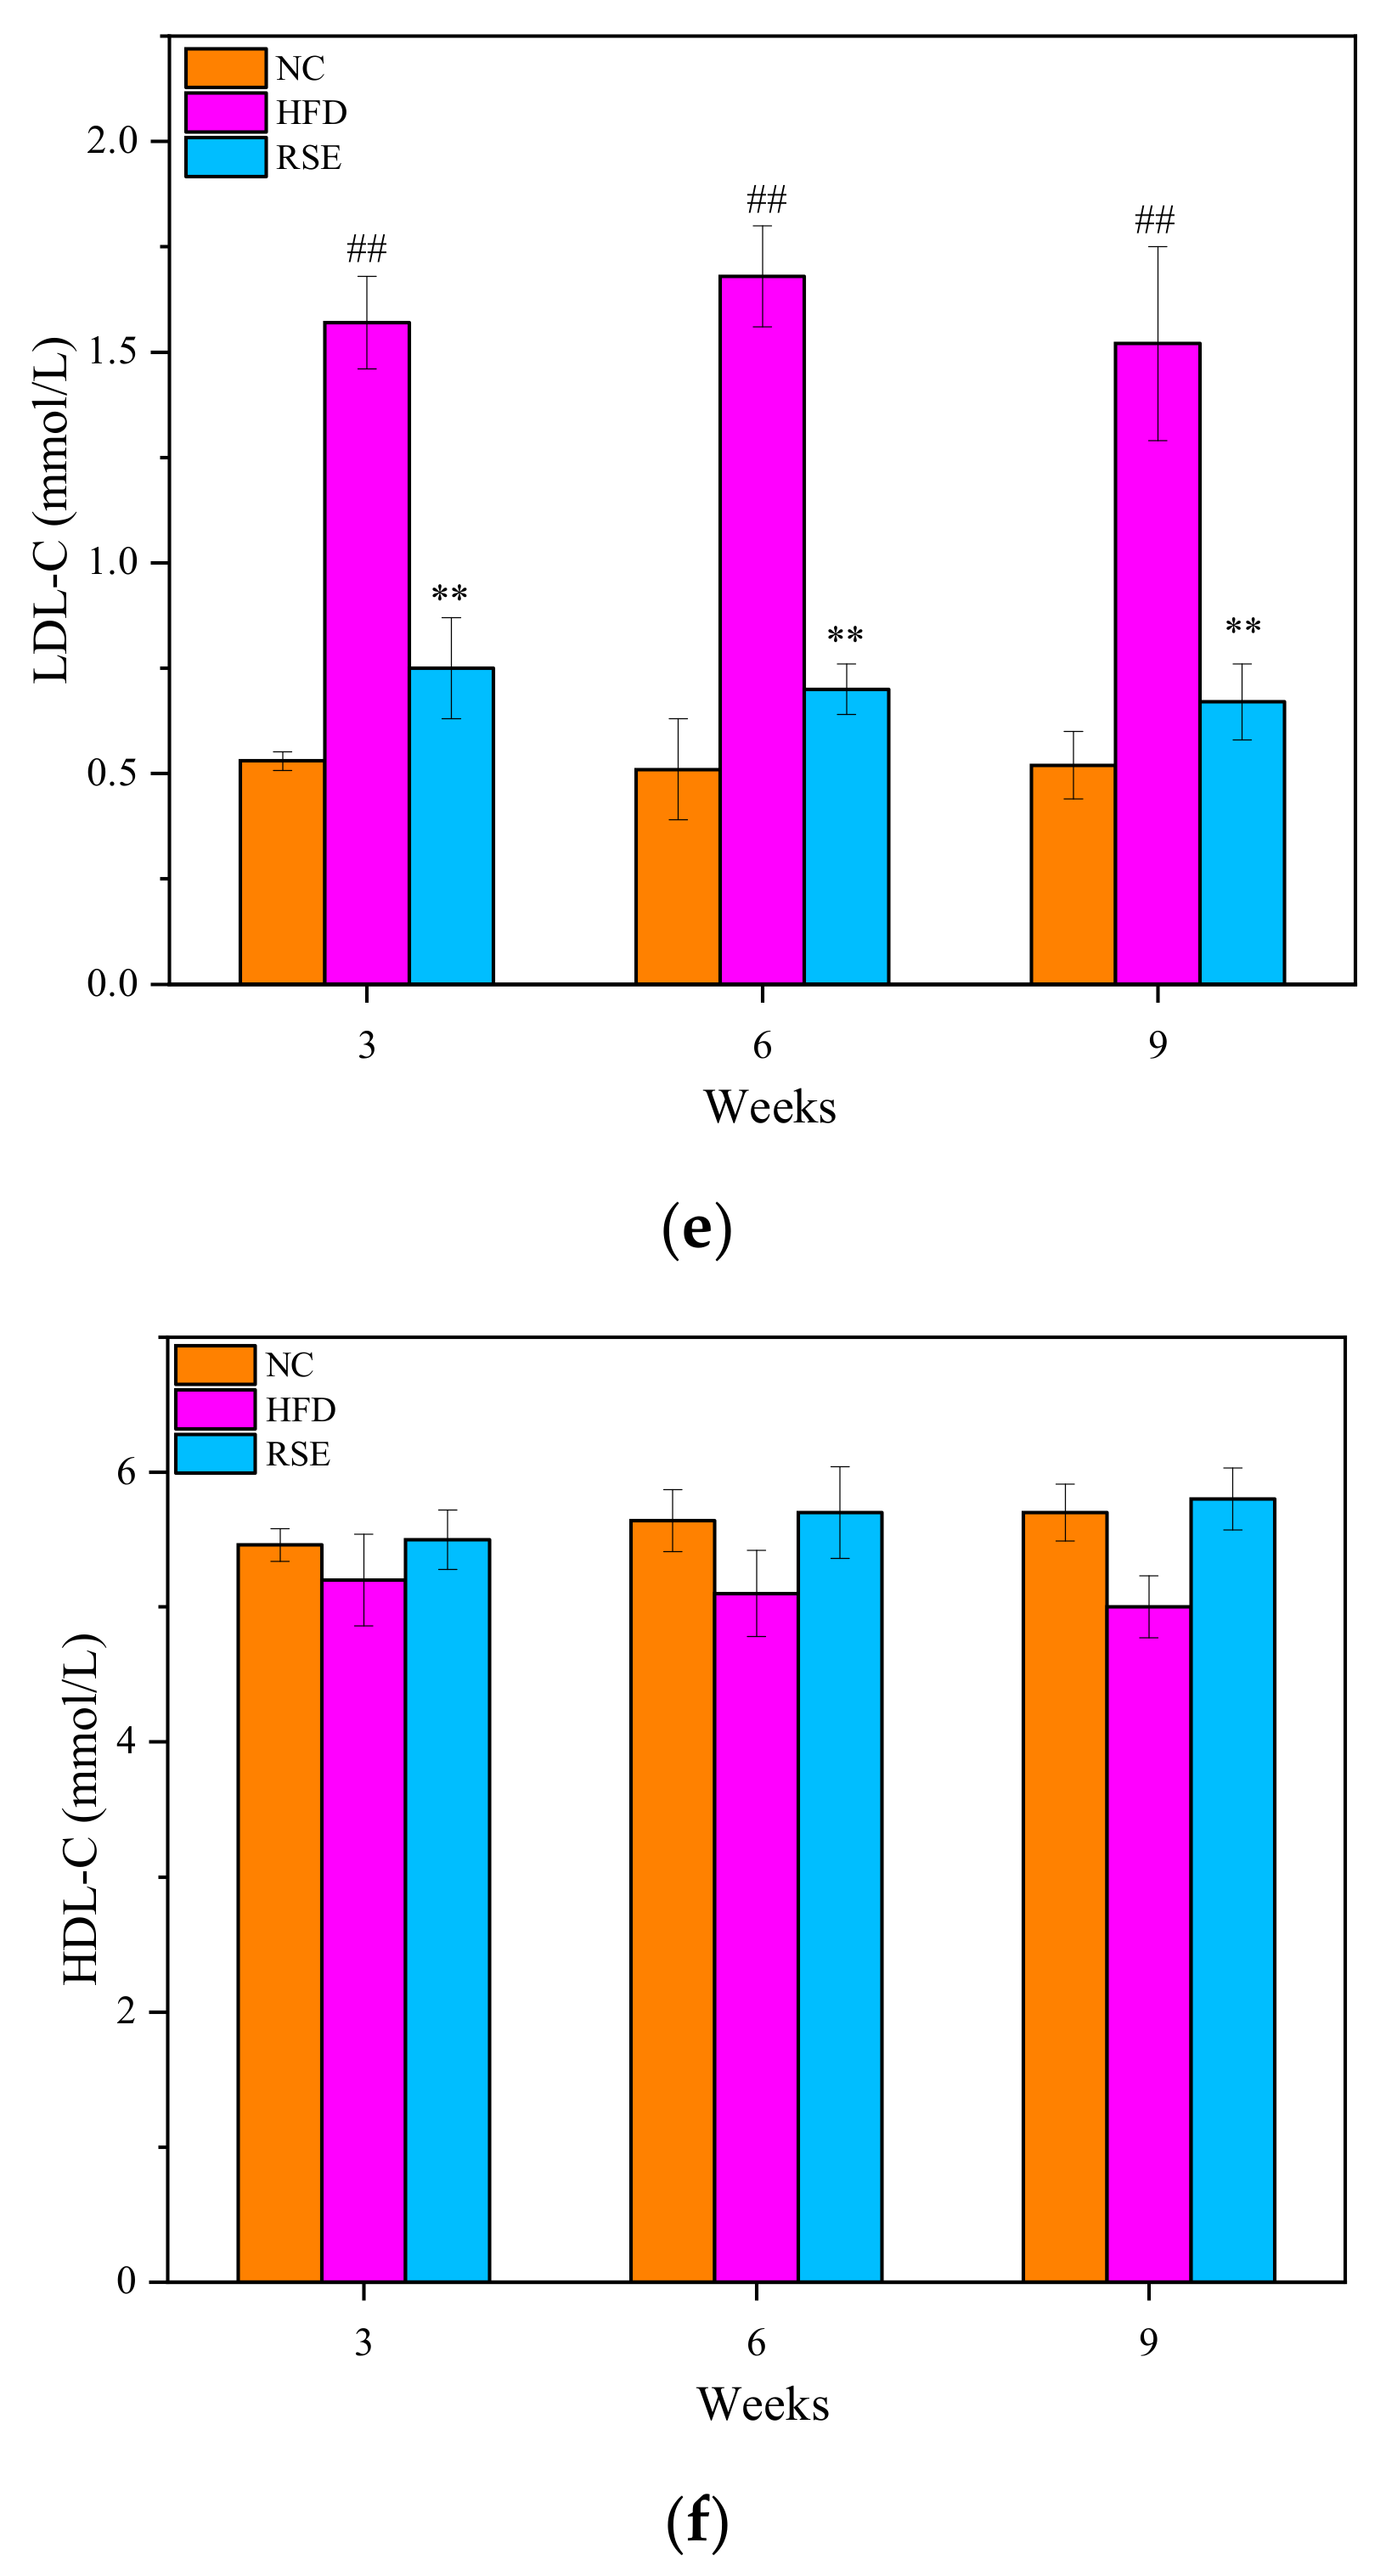
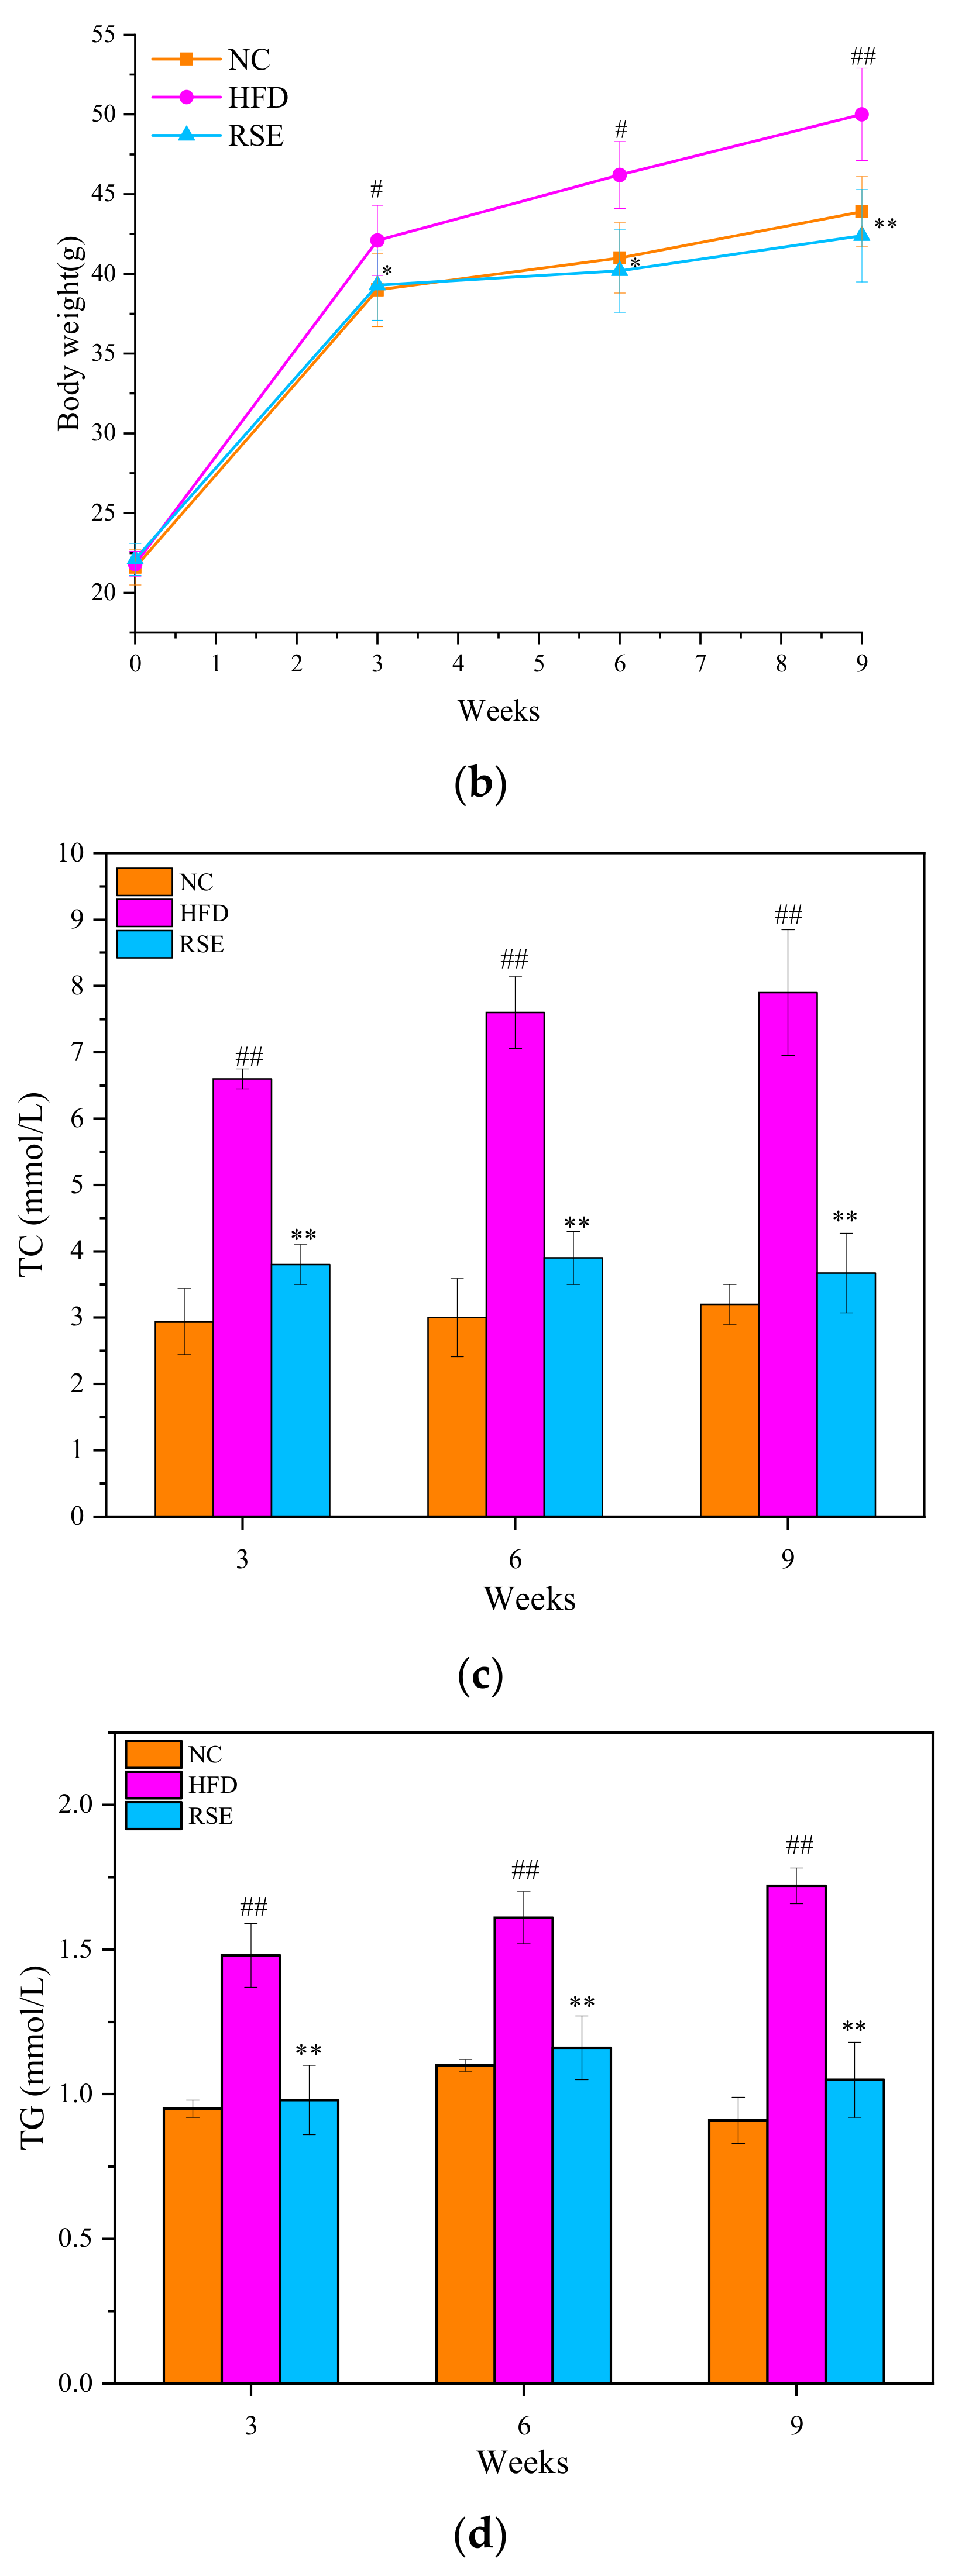
3.2. RSE Attenuated the Features of Obesity and Dyslipidaemia in HFD-Fed Mice

As shown in Figure 2a, the impact of RSE on the above obesity parameters was not attributed to reduced energy intake but primarily due to RSE intervention since no significant difference was found in energy intake between all the groups (Figure 2a). As shown in Figure 2b, there were no significant differences in the initial body weight of mice among the three groups. However, after 3 weeks of intervention, mice fed with HFD had higher body weight (Figure 2b) and epididymal fat index (Table 2) and developed hallmark features of dyslipidemia, including elevated TC (Figure 2c), TG (Figure 2d), and LDL-c (Figure 2e) levels. The HDL-c levels had no differences among the groups. Intervention with RSE significantly attenuated HFD-induced overweight, epididymal fat index, and serum TC, TG, and LDL-c levels of obese mice (p < 0.01).

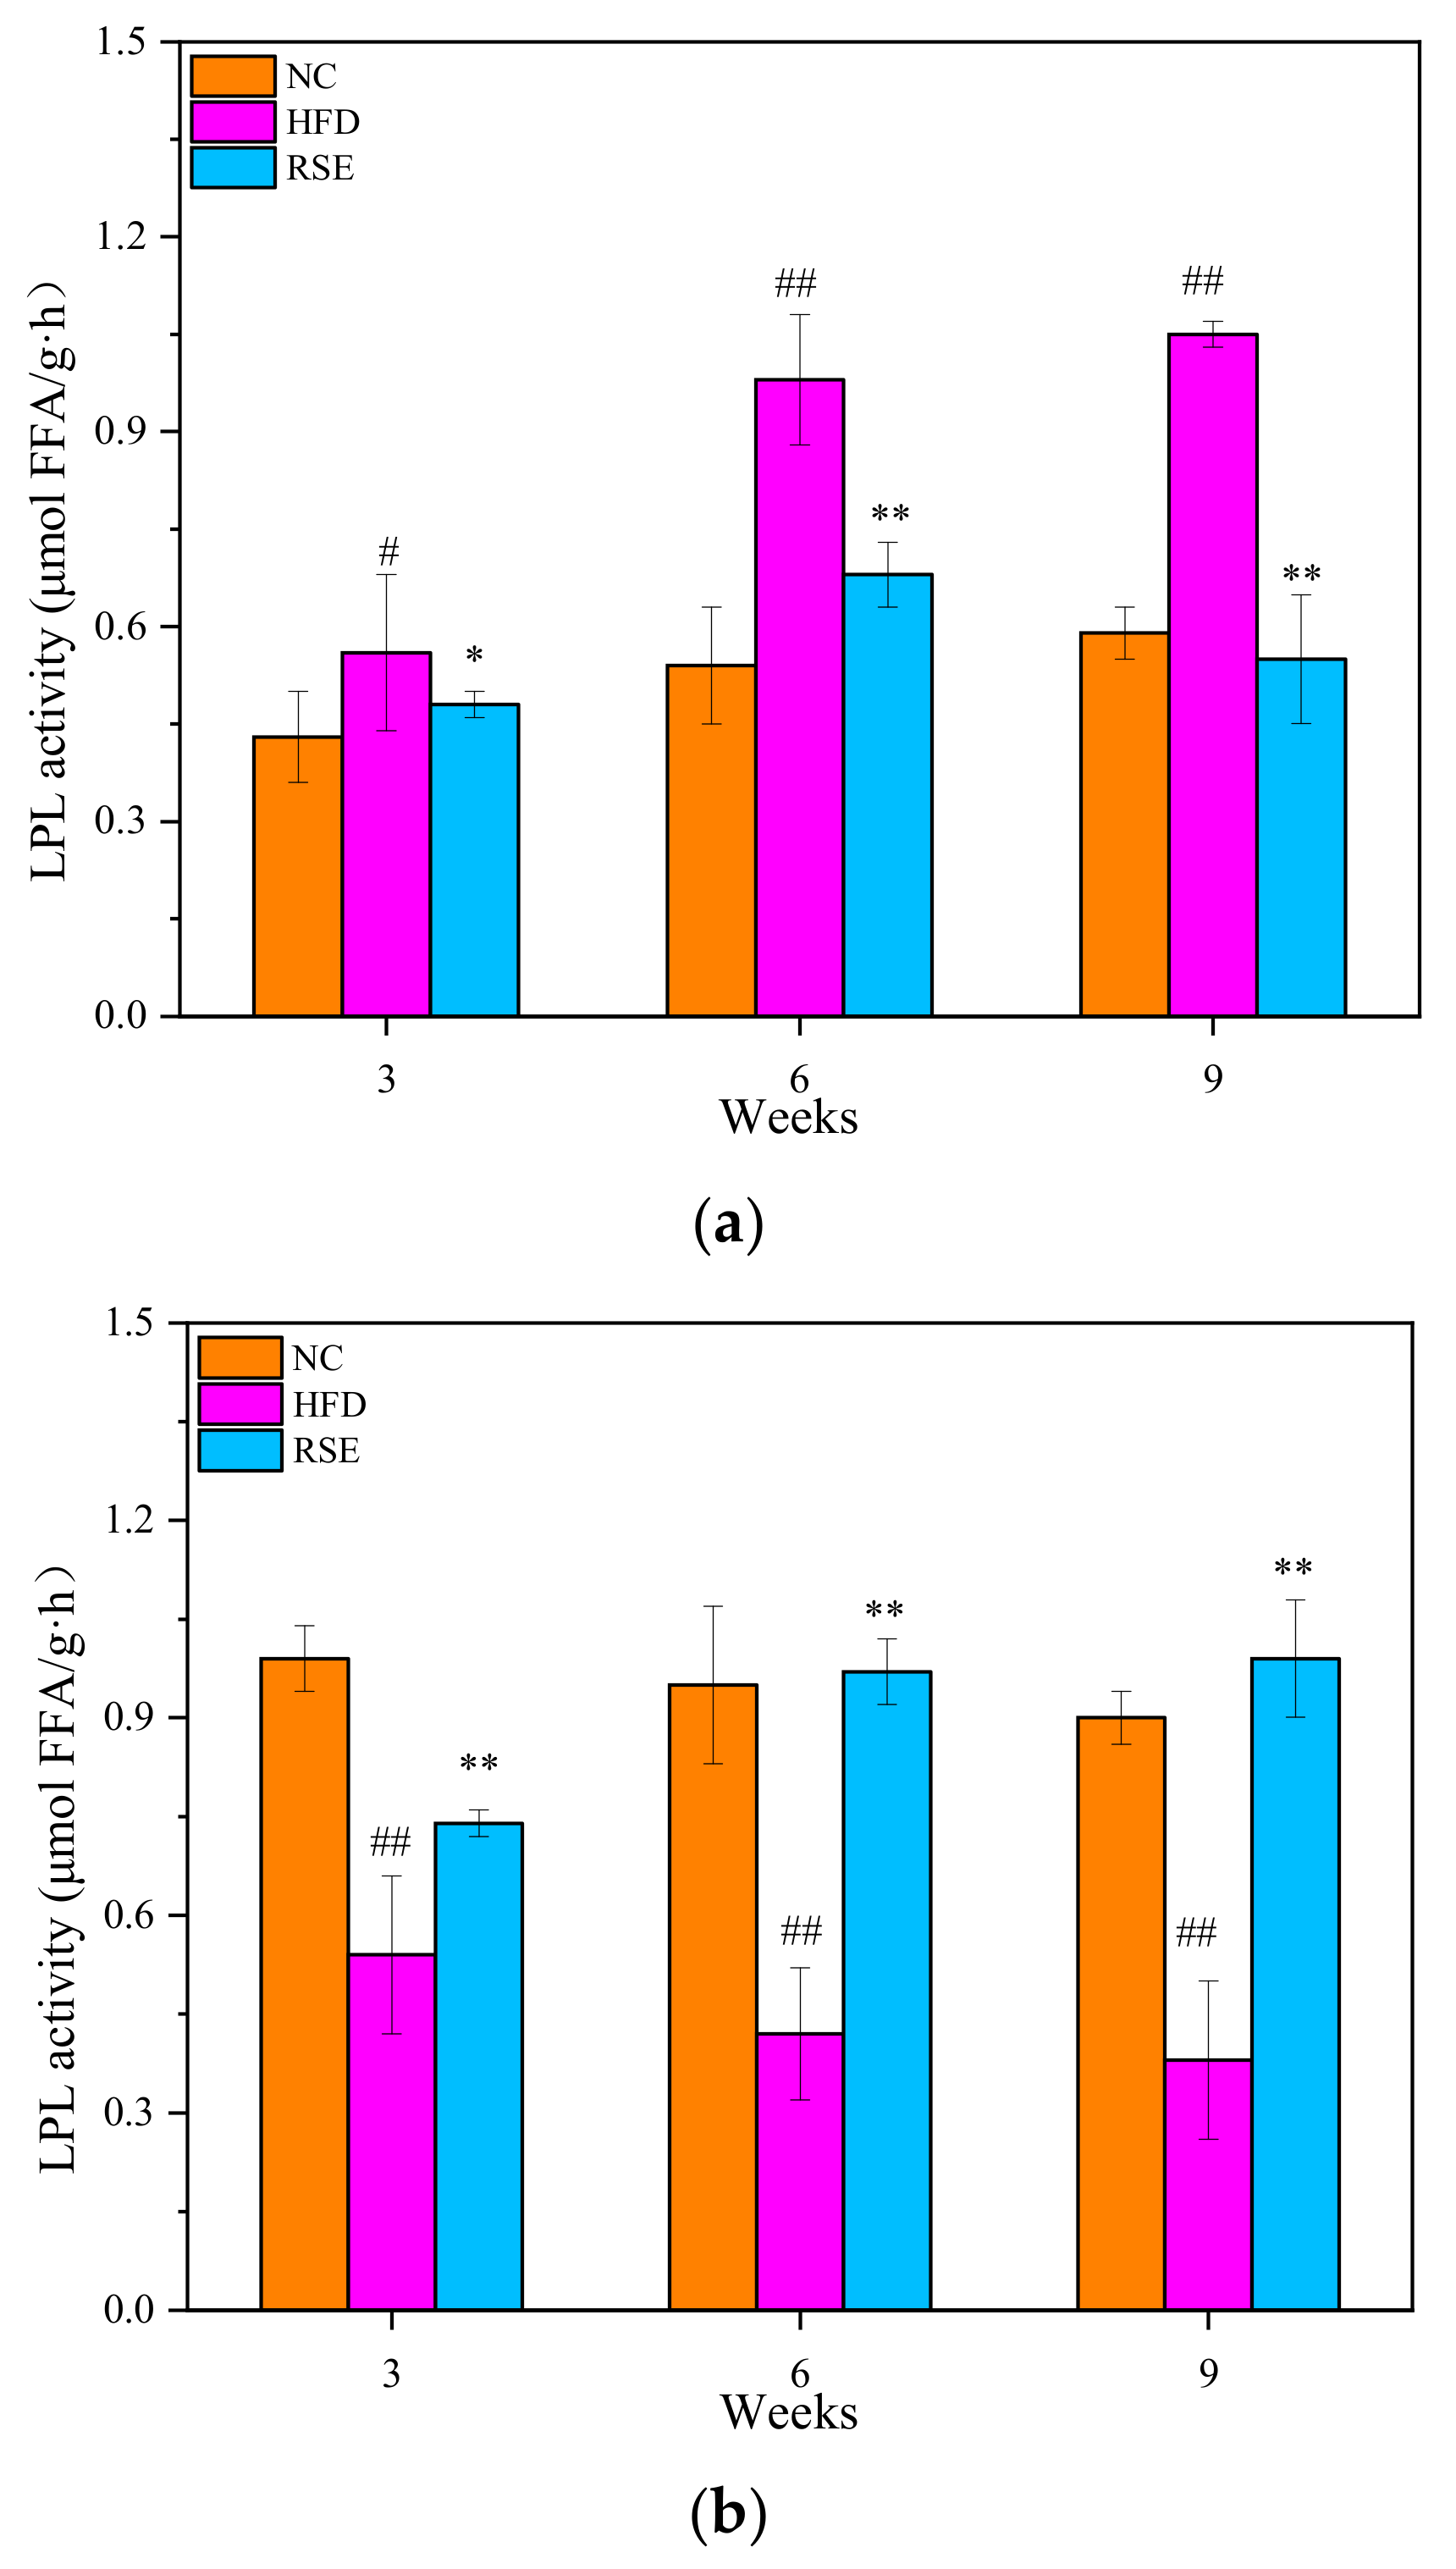
3.3. RSE Regulated the LPL Activity in HFD-Fed Mice

The effects of RSE on the LPL activity in epididymal adipose and skeletal muscle were shown in Figure 3. Compared with NC group, the LPL activity of epididymal adipose in the HFD group was elevated 77.96%, whereas the LPL activity in skeletal muscle tissue was markedly depressed 49.44% (of the control value) at 9 weeks. After 9 weeks of RSE intervention, the LPL activity of epididymal adipose in the obese mice was markedly depressed by 90.90% compared to HFD group. In contrast, the LPL activity of skeletal muscle in the RSE-treated mice significantly increased by 1.22 times as compared with HFD group. Our study suggested that the LPL activity could be modulated by RSE to regulate the state of obesity.

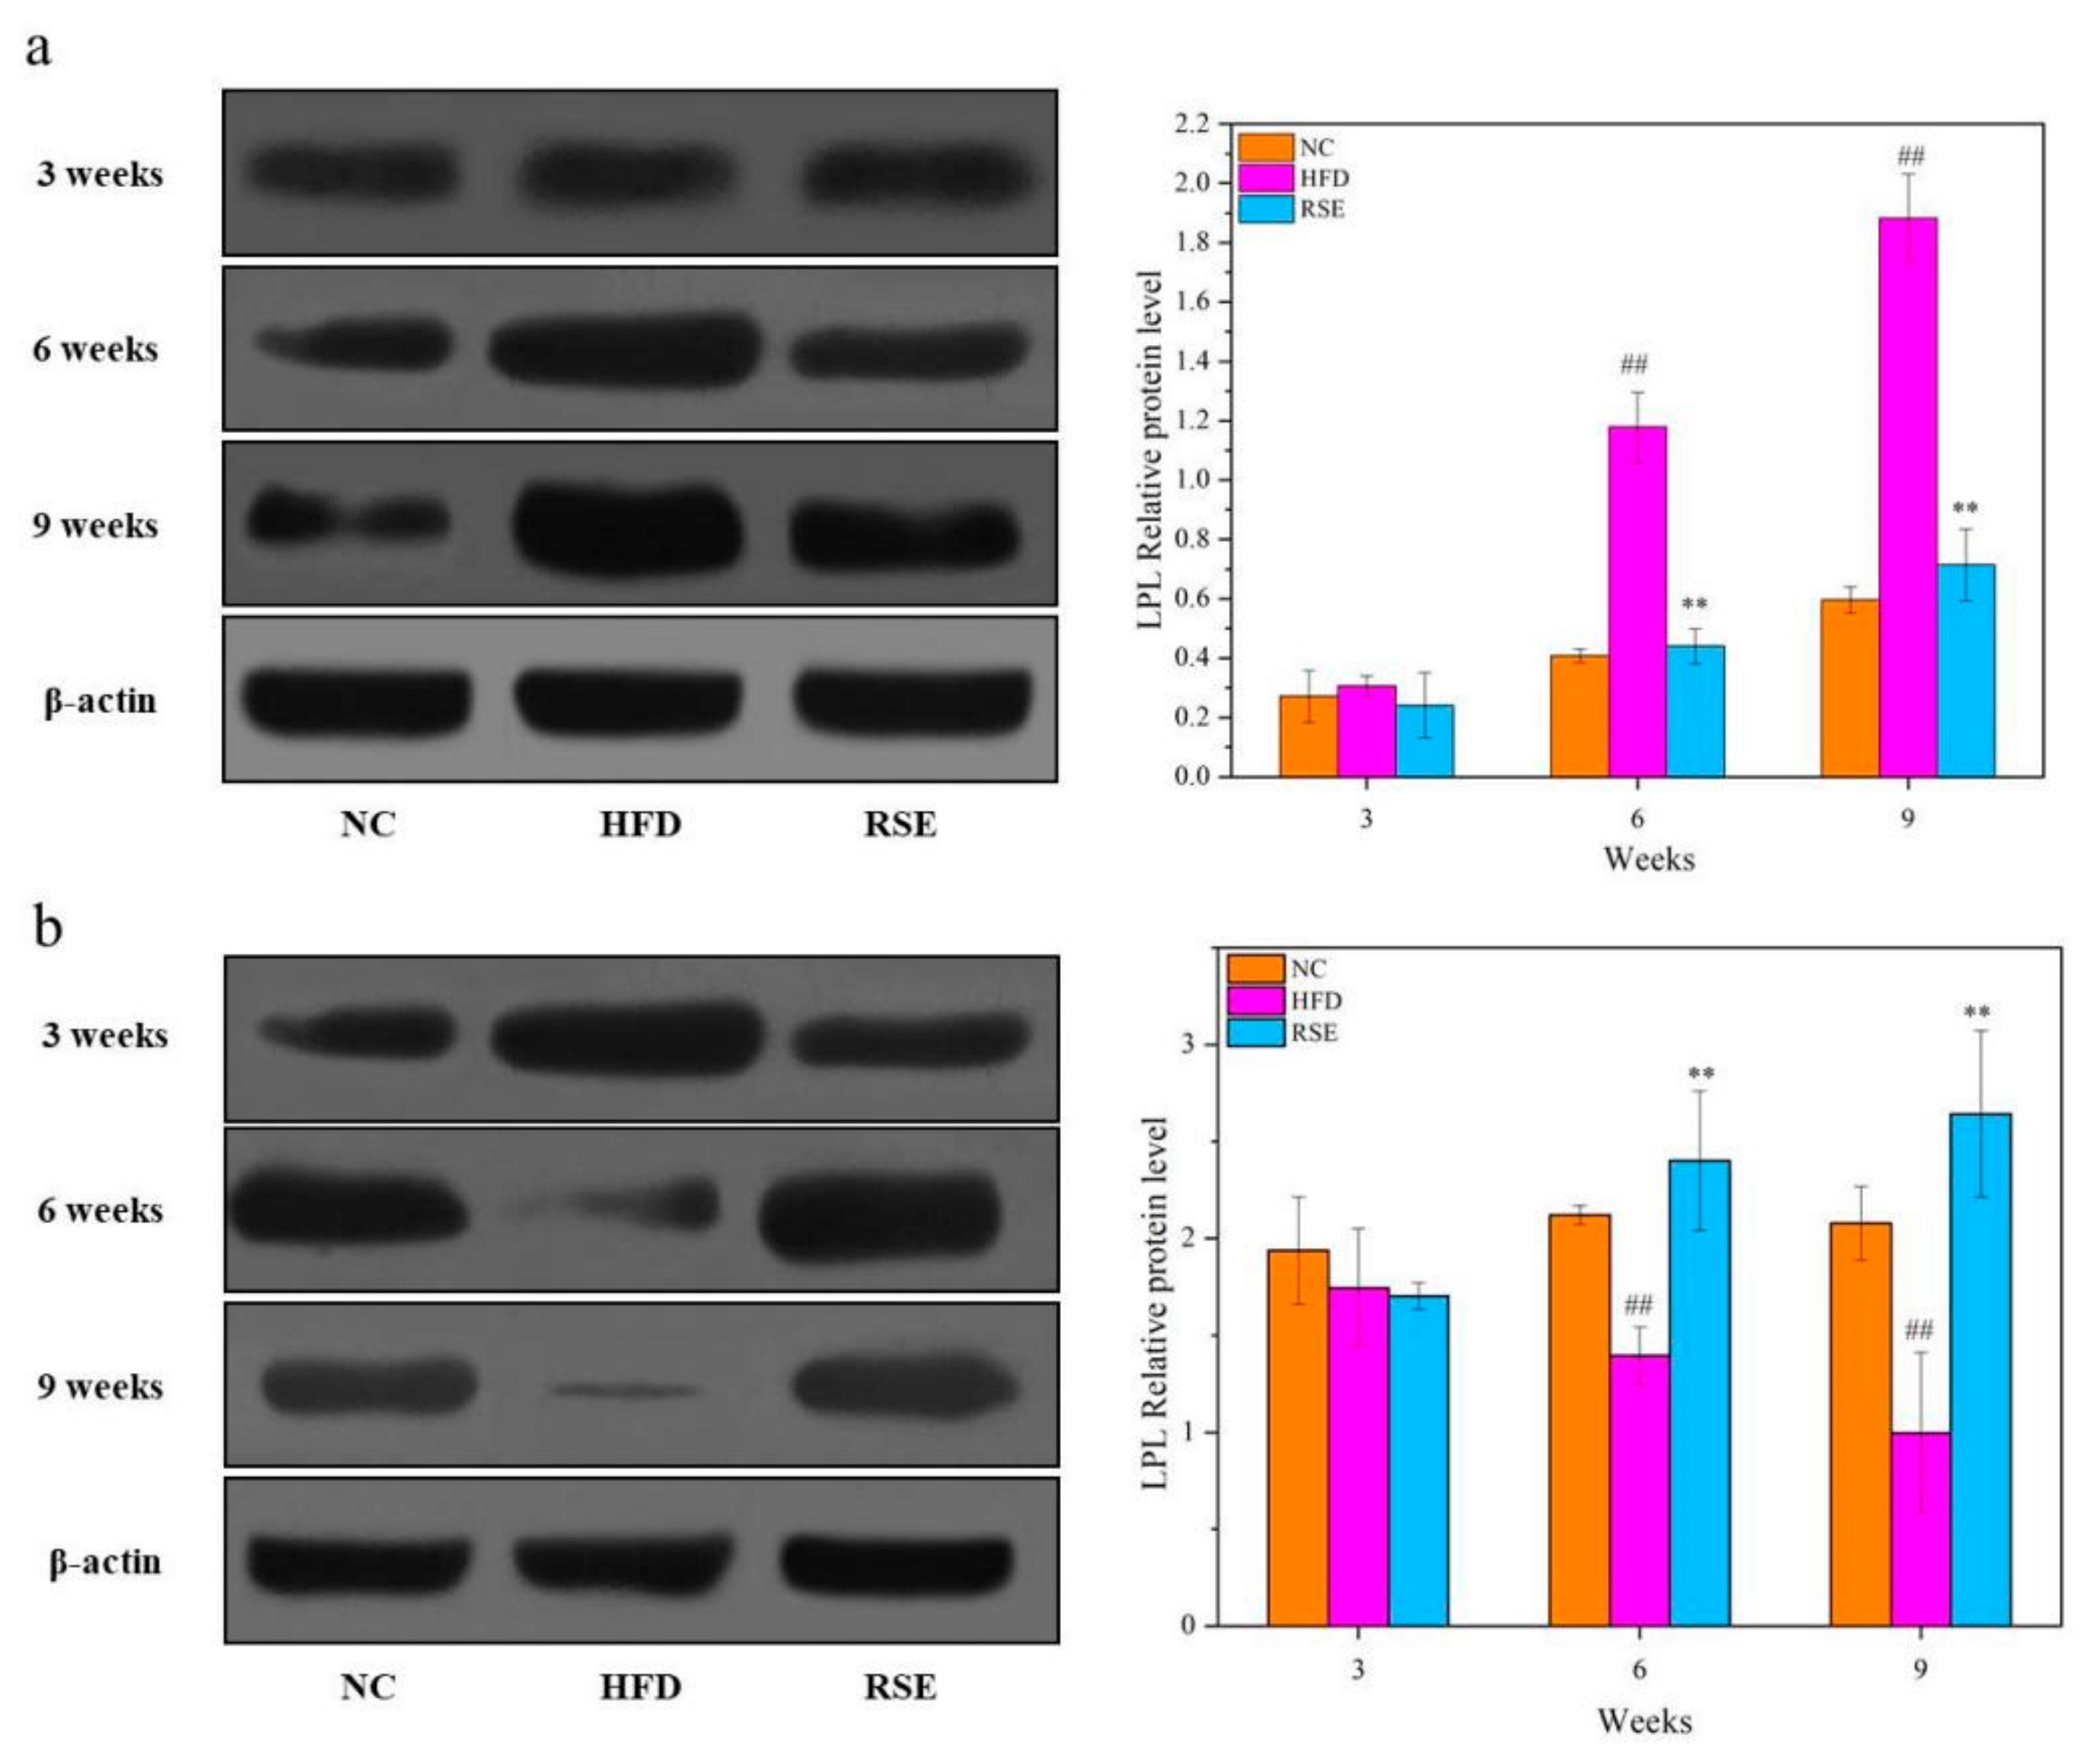
3.4. RSE Regulated the LPL Protein Expression in HFD-Fed Mice

Figure 4 indicates the effect of RSE interventions on LPL protein expression in different tissues, respectively. Notably, LPL protein level increased significantly in adipose tissue in response to HFD treatment, while it was reduced in skeletal muscle under HFD (p < 0.01). Additionally, the LPL protein expression showed time-dependency in adipose or skeletal muscle tissues in HFD group. As expected, after 9 weeks of RSE treatment, the LPL protein level markedly decreased in adipose tissue (p < 0.01, Figure 4a) and significantly increased in skeletal muscle (p < 0.01, Figure 4b).

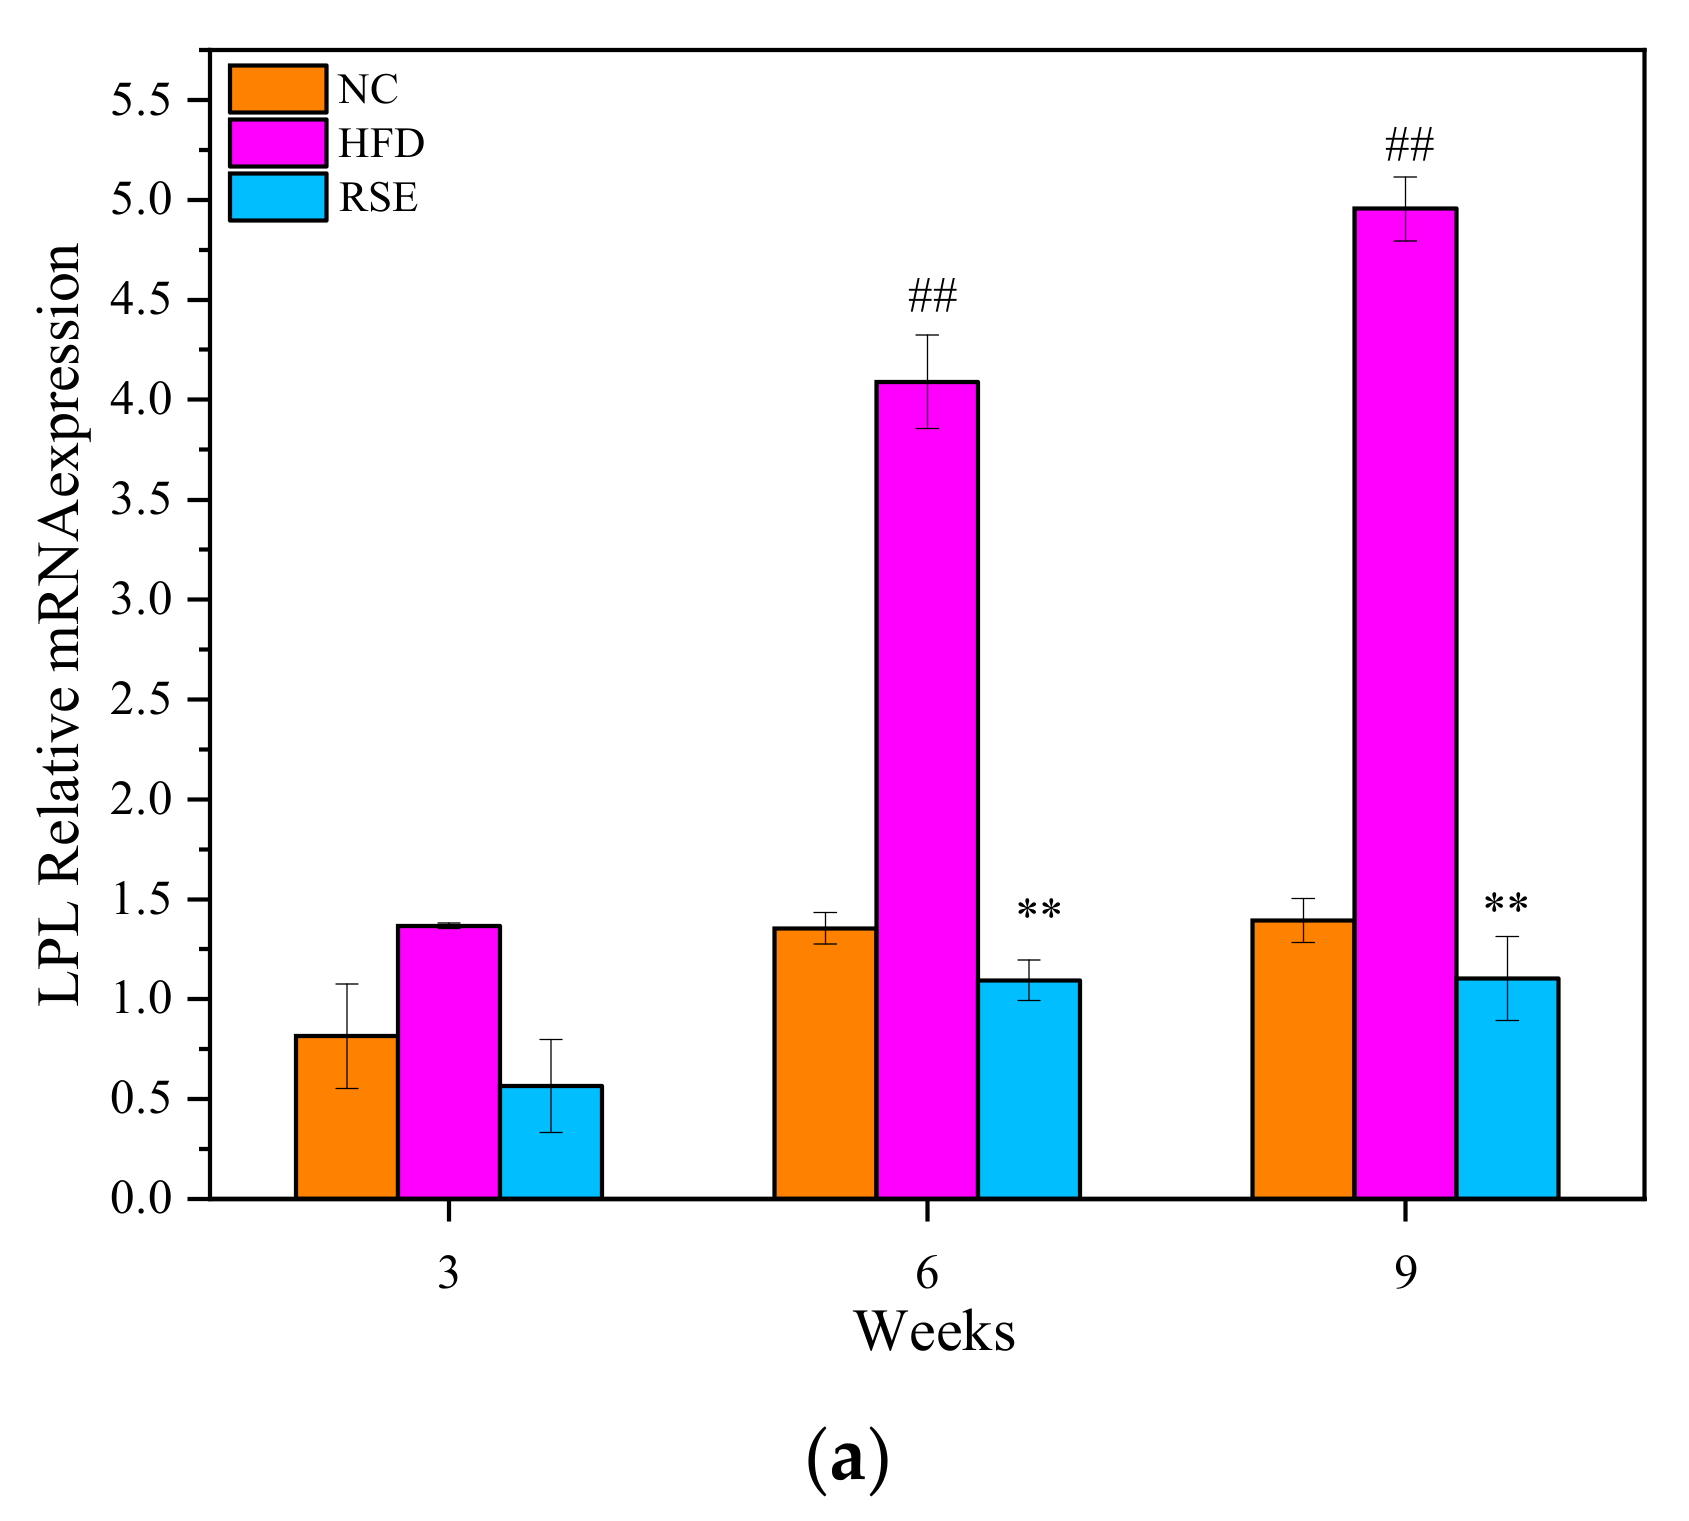
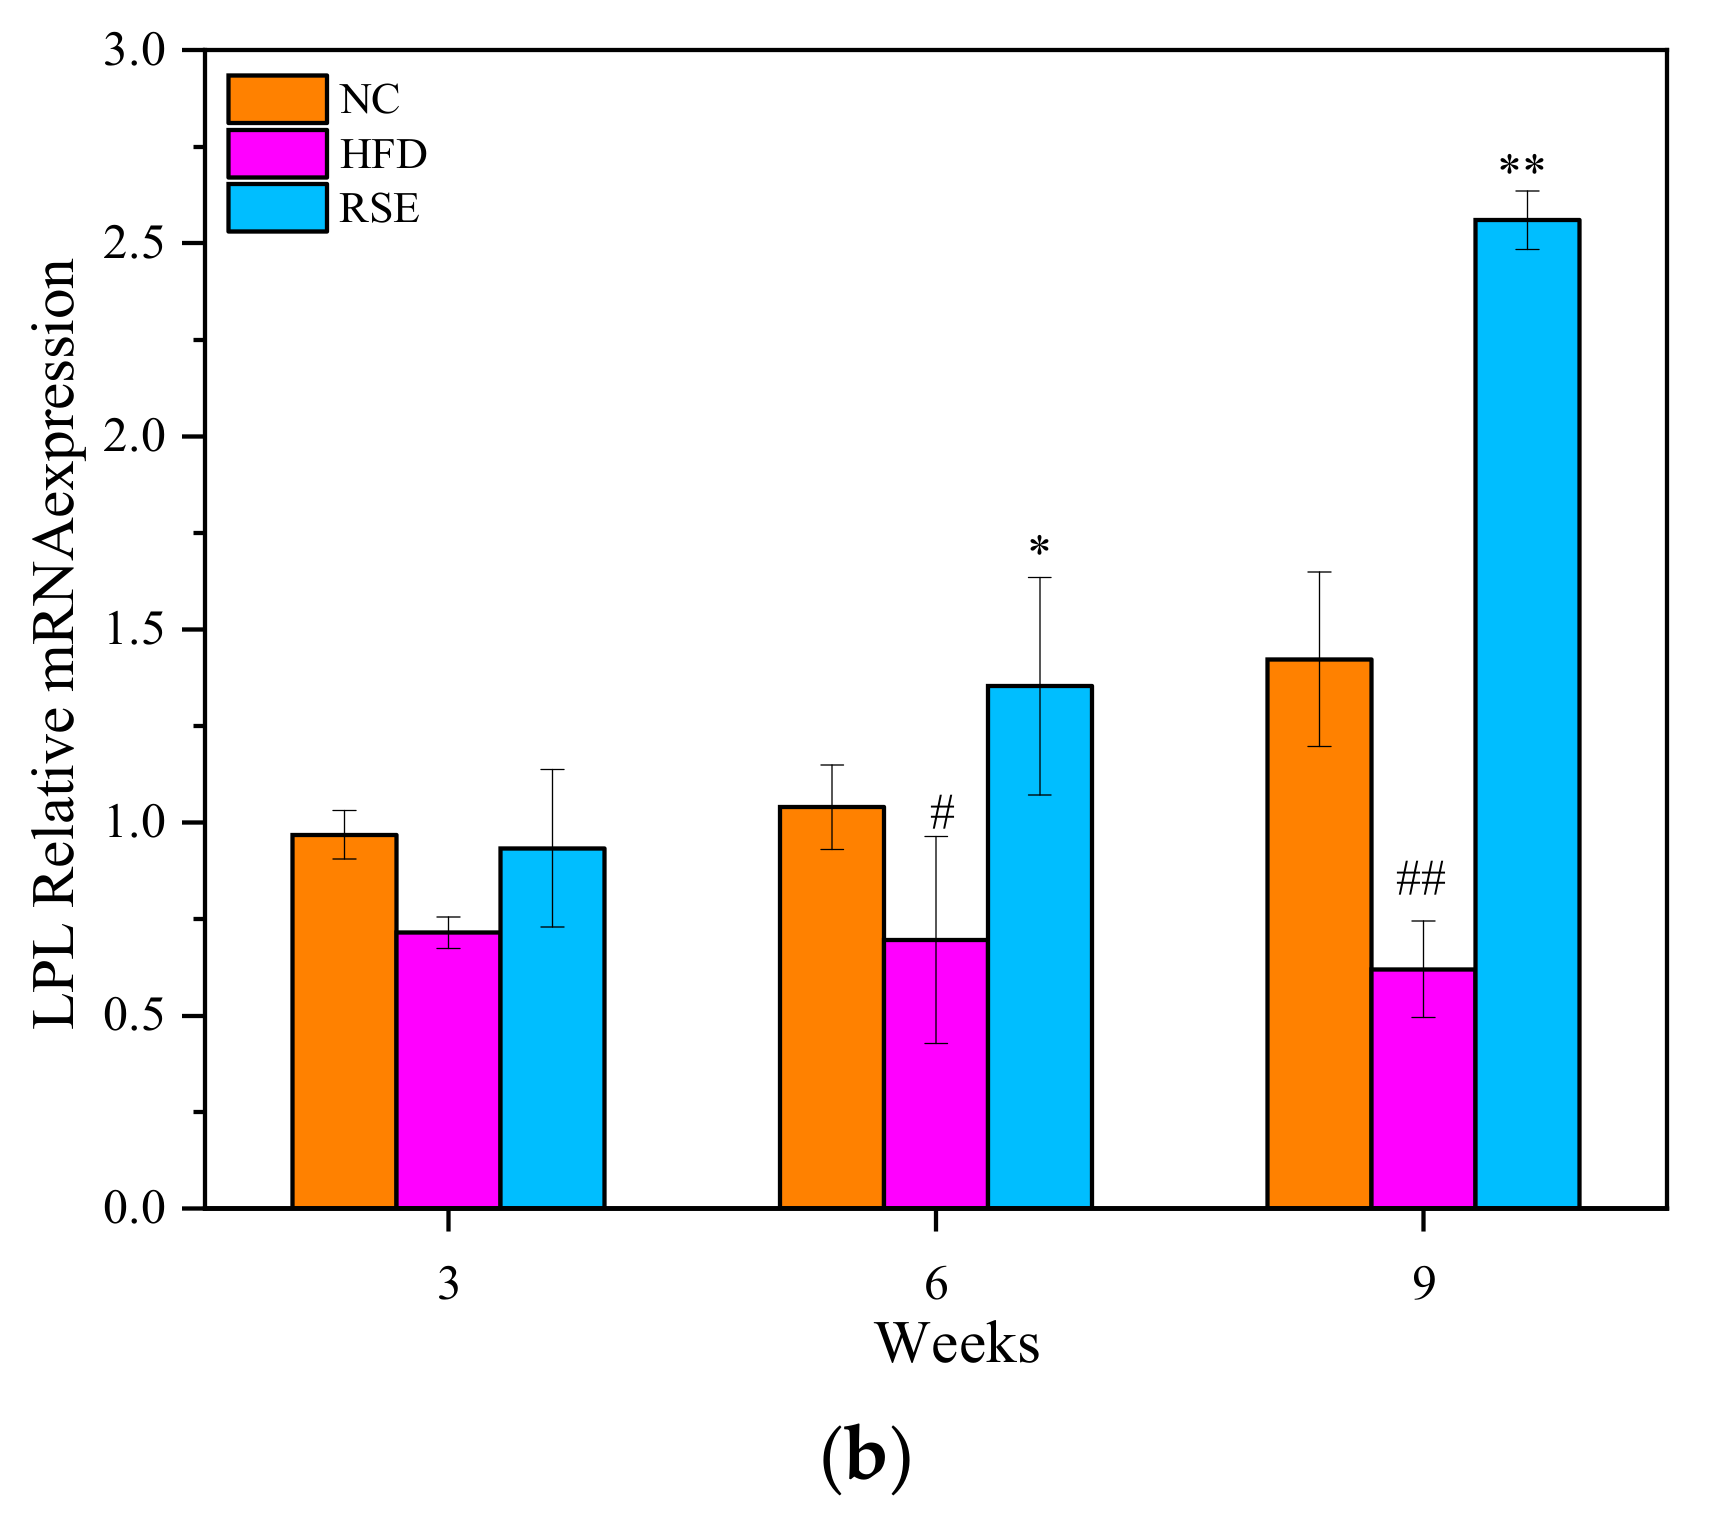
3.5. RSE Regulated the LPL mRNA Expression in HFD-Fed Mice

As shown in Figure 5, LPL mRNA levels were found to be significantly increased in epididymal adipose tissue, whereas it significantly decreased in skeletal muscle after HFD treatment for 6 weeks (p < 0.01). The intervention of RSE significantly reduced the LPL mRNA expression in the epididymal adipose of mice fed HFD (p < 0.01). Besides, RSE treatment increased the LPL mRNA expression in skeletal muscle by 4.3-fold as compared with the HFD group.

4. Discussions

Obesity, a worldwide epidemic nowadays, is a metabolic disease associated with high blood pressure and diabetes [1]. The imbalance between calorie intake and calorie expenditure is highly related to the occurrence of obesity [19]. It has been reported that the LPL plays a vital role in energy expenditure and lipid metabolism. LPL is a multifunctional enzyme produced in various tissues, especially adipose and skeletal muscle tissue, where it plays different roles. Skeletal muscle contains at least half the total body LPL, and the free fatty acids generated by muscle LPL are catabolized for energy. Therefore, muscle, not adipose tissue, was the primary site of chylomicron triglyceride fatty acid clearance and energy balance [20]. Accumulating evidence suggests that the decrease of LPL activity in epididymal adipose and the improvement in skeletal muscle has the beneficial effect of preventing diet-induced obesity [21]. Herein, we investigated whether the anti-obesity effect of RSE is due to LPL activity regulation. In this study, RSE intervention significantly attenuated increased body weight and obesity characteristics, including serum TC, TG, and LDL-c levels. Lotus-leaf extract is reported to prevent body weight increase and reduce the TC, TG, and LDL-c levels and increase the HDL-c levels in the high-fat-diet-induced obese mice [22]. However, few reports to date have elucidated the effect of red-skin extract on obesity.
Notably, a remarkable decreased activity of LPL was detected in epididymal adipose, and a significant increased activity of LPL was detected in skeletal muscle after intervention with RSE for 9 weeks. Additionally, the intervention of RSE significantly reduced the LPL mRNA expression in the epididymal adipose but increased the LPL mRNA expression in skeletal muscle. The results of this study demonstrated that RSE mediates LPL expression in mice with tissue-specific differences.
As reported, the increase in adipose tissue weight and lipid contents were concomitant with the increase in LPL activities involved in the lipid storage [23]. LPL overexpression in muscle attenuates weight gain by potentiating energy expenditure [24]. In agreement with our findings, Del Bas et al. reported that LPL mRNA levels are decreased in adipose tissue and increased in muscle after administration of grape seed procyanidins in rats [25]. Moreover, extract of fermented Curcuma longa L., which is rich in curcuminoids, prevented obesity by inducing a statistically significant decrease in the mRNA expressions of LPL in the white adipose tissue of obese mice [26]. Similar results were for the effect the activity of LPL in the skeletal muscle of polysaccharide from Auricularia auricula in cholesterol-enriched-diet-fed mice [27]. Additionally, extracts of lotus leaves, abundant with flavonoids (kaempferitrin, hyperoside, and astragalin), significantly upregulated mRNA expression in the livers of obese mice [22]. These findings of our study indicate that red-skin extract of lotus may partially inhibit adipogenesis by controlling fatty acid uptake into adipose tissue from circulating lipoproteins. The results also suggested that RSE prevented obesity through preferentially directing triglycerides to energy production by the muscle instead of to energy storage by the adipose tissue via the regulation of LPL activity in different tissues. As demonstrated, the LPL expression is regulated by several upstream tissue-specific regulatory factors, such as uncoupling proteins (UCPs), adenosine monophosphate (AMP)-activated protein kinase phosphorylation (pAMPK), and angiopoietin-like proteins (ANGPTLs). These regulators in adipose and muscle tissues were reported to have tissue-specific responses to dietary interventions. For example, the LPL activator NO-1886 increased the UCP 3 expression and LPL activity only in skeletal muscle [28]. AMPK activation or its phosphorylation resulted in the decreases of LPL activity in adipocytes and the increase of LPL activity in skeletal muscle tissue [29]. Further studies should be undertaken to better understand the molecular mechanisms of these opposing regulation effects of RSE on LPL activity in different tissues.
It has been shown that phenolic compounds may influence the lipoprotein composition by regulating LPL, which is involved in the dynamic exchange of lipids between the different lipoproteins in tissues [30]. Phenolic compounds comprise an array of substances such as procyanidins, rutin, vitexin, vitexin-glucoside, hyperoside, and quercetin, and may have direct or indirect effect of the regulation of LPL [25,31,32]. However, this effect is not clear because no changes are observed in LPL mRNA levels of muscle and adipose tissue after the administration of chronic grape seed procyanidins to hyperlipidemic rats [33]. Moreover, hawthorn flavonoids, with a purity of 93.8%, comprised of vitexin, vitexin-rhamnoside, vitexin-glucoside, rutin, hyperoside, pinnatifin, and quercetin, mediated LPL expression in mice with tissue-specific differences by which LPL increased significantly in muscular tissues and decreased in adipose tissues [30].
Phenolic compounds, especially flavonoids, have been widely accepted as a category of the most important bioactive compounds of lotus. The phenolic compounds in lotus-derived parts were mainly identified as phenolic acids, flavonoids, and their glycoside derivatives [9]. Among all the tentatively identified phenolic compounds in this study, catechin, gallocatechin, quercetin, quercetin-3-glucuronide, isoquercetin, kaempferol, and rutin were reported in lotus leaf, flower, embryo, or/and stamen [34]. Of note, luteolin glucoside, hyperin, kaempferol glycoside, quercetin glycoside, diosmetin 7-O-hexose, and isorhamnetin 3-O-arabino-pyranosyl-(1,2)-glucopyranoside were also identified in lotus-leaf extract [35]. For lotus seed skins, procyanidin B1, (+)-catechin, procyanidin B4, procyanidin B2, and (+)-gallocatechin were identified. And these isolated procyanidin dimers exhibited in vivo antioxidant activities via the activation of nuclear factor-E2-related factor 2 (Nrf2)–antioxidant response element (ARE) signaling pathway [12]. Most of the phenolic compounds in the red skin of lotus seed, including phenolic acids, flavonoids, proanthocyanidin, coumarins, and derivatives, were first identified in this study. Moreover, among these compounds, vitexin, vitexin-glucoside, rutin, hyperoside, and quercetin were reported to modulate the LPL activity with tissue-specific way. Therefore, the LPL modulation effect of RSE may directly relate to the phenolic compounds. Further study should be conducted to identify the components of RSE that affect LPL activity and its regulators.

5. Conclusions

In conclusion, our results revealed that red-skin extract of lotus seeds, which is composed of 55 phenolic compounds, could alleviate body weight, adipose tissue weight, and serum TC, TG, and LDL-c in high-fat-diet-induced obese mice. These results can be associated with the promotion of energy expenditure in the muscle and suppression energy storage in the adipose tissue via the regulation of LPL activity. The present study demonstrated that red-skin extract of lotus seed has great potential as a functional food in the prevention of obesity-related diseases.

Author Contributions

Conceptualization, H.X. and L.G.; Data curation, F.L. and L.G.; Funding acquisition, H.X.; Investigation, H.G. and L.G.; Methodology, H.G.; Supervision, H.X.; Writing—original draft, H.G. and L.G.; Writing—review & editing, F.L. and L.G. All authors have read and agreed to the published version of the manuscript.

Funding

This research was funded by Beijing Natural Science Foundation (6202001).

Institutional Review Board Statement

The animal study were approved by the Committee of Animal Experimentation and were performed under the institutional guidelines for animal experiments of the Beijing Vital River Laboratory Animal Technology Co., Ltd. (P2020033).

Data Availability Statement

Data are contained within the article.

Conflicts of Interest

The authors declare no conflict of interest.

References

  1. Gates, P. Arteriosclerosis with superimposed atherosclerosis is the cause not the consequence of essential hypertension. Med. Hypotheses 2020, 144, 110236. [Google Scholar] [CrossRef] [PubMed]
  2. Kiernan, R.; Persand, D.; Maddie, N.; Carrillo-Sepulveda, M.A. Vascular Glucagon-like Peptide 1 (GLP-1) Signaling Is Reduced In Obesity-related Hypertension In Female Rats. Hypertension 2021, 78, A59. [Google Scholar] [CrossRef]
  3. Pillon, N.J.; Loos, R.J.; Marshall, S.M.; Zierath, J.R. Metabolic consequences of obesity and type 2 diabetes: Balancing genes and environment for personalized care. Cell 2021, 184, 1530–1544. [Google Scholar] [CrossRef] [PubMed]
  4. Montserrat-de la Paz, S.; Pérez-Pérez, A.; Vilariño-García, T.; Jiménez-Cortegana, C.; Muriana, F.J.G.; Millán-Linares, M.C.; Sánchez-Margalet, V. Nutritional modulation of leptin expression and leptin action in obesity and obesity-associated complications. J. Nutr. Biochem. 2021, 89, 108561. [Google Scholar] [CrossRef]
  5. Basu, D.; Goldberg, I.J. Regulation of lipoprotein lipase-mediated lipolysis of triglycerides. Curr. Opin. Lipidol. 2020, 31, 154. [Google Scholar] [CrossRef]
  6. Huang, J.; Zhang, Y.; Zhou, Y.; Zhang, Z.; Xie, Z.; Zhang, J.; Wan, X. Green tea polyphenols alleviate obesity in broiler chickens through the regulation of lipid-metabolism-related genes and transcription factor expression. J. Agric. Food Chem. 2013, 61, 8565–8572. [Google Scholar] [CrossRef]
  7. Liu, L.; Yasen, M.; Tang, D.; Ye, J.; Aisa, H.A.; Xin, X. Polyphenol-enriched extract of Rosa rugosa Thunb regulates lipid metabolism in diabetic rats by activation of AMPK pathway. Biomed. Pharmacother. 2018, 100, 29–35. [Google Scholar] [CrossRef]
  8. Serisier, S.; Leray, V.; Poudroux, W.; Magot, T.; Nguyen, P. Green tea improves, at nutritional doses, insulin sensitivity and plasma lipids concentrations in obese dog by increase PPARγ expression. FASEB J. 2007, 21, A5. [Google Scholar] [CrossRef]
  9. Wang, Z.; Cheng, Y.; Zeng, M.; Wang, Z.; Qin, F.; Wang, Y.; Chen, J.; He, Z. Lotus (Nelumbo nucifera Gaertn.) leaf: A narrative review of its Phytoconstituents, health benefits and food industry applications. Trends Food Sci. Technol. 2021, 112, 631–650. [Google Scholar] [CrossRef]
  10. Guo, Y.; Ding, X.; Ni, Y. The combination of NIR spectroscopy and HPLC chromatography for differentiating lotus seed cultivars and quantitative prediction of four main constituents in lotus with the aid of chemometrics. Anal. Methods 2017, 9, 6420–6429. [Google Scholar] [CrossRef]
  11. Yen, G.-C.; Duh, P.-D.; Su, H.-J.; Yeh, C.-T.; Wu, C.-H. Scavenging effects of lotus seed extracts on reactive nitrogen species. Food Chem. 2006, 94, 596–602. [Google Scholar] [CrossRef]
  12. Li, T.; Li, Q.; Wu, W.; Li, Y.; Hou, D.; Xu, H.; Zheng, B.; Zeng, S.; Shan, Y.; Lu, X.; et al. Lotus seed skin proanthocyanidin extract exhibits potent antioxidant property via activation of the Nrf2–ARE pathway. Acta Biochim. Biophys. Sin. 2018, 51, 31–40. [Google Scholar] [CrossRef] [PubMed]
  13. Wu, J.-Z.; Zheng, Y.-B.; Chen, T.-Q.; Yi, J.; Qin, L.-P.; Rahman, K.; Lin, W.-X. Evaluation of the quality of lotus seed of Nelumbo nucifera Gaertn from outer space mutation. Food Chem. 2007, 105, 540–547. [Google Scholar] [CrossRef]
  14. Kredy, H.M.; Huang, D.; Xie, B.; He, H.; Yang, E.; Tian, B.; Xiao, D. Flavonols of lotus (Nelumbo nucifera, Gaertn.) seed epicarp and their antioxidant potential. Eur. Food Res. Technol. 2010, 231, 387–394. [Google Scholar] [CrossRef]
  15. Cao, J.; Yu, X.; Deng, Z.; Pan, Y.; Zhang, B.; Tsao, R.; Li, H. Chemical compositions, antiobesity, and antioxidant effects of proanthocyanidins from Lotus seed epicarp and Lotus seed pot. J. Agric. Food Chem. 2018, 66, 13492–13502. [Google Scholar] [CrossRef]
  16. Vuong, Q.V.; Golding, J.B.; Stathopoulos, C.E.; Nguyen, M.H.; Roach, P.D. Optimizing conditions for the extraction of catechins from green tea using hot water. J. Sep. Sci. 2011, 34, 3099–3106. [Google Scholar] [CrossRef]
  17. Castellano-Castillo, D.; Moreno-Indias, I.; Fernández-García, J.C.; Alcaide-Torres, J.; Moreno-Santos, I.; Ocana, L.; Gluckman, E.; Tinahones, F.; Queipo-Ortuño, M.I.; Cardona, F. Adipose tissue LPL methylation is associated with triglyceride concentrations in the metabolic syndrome. Clin. Chem. 2018, 64, 210–218. [Google Scholar] [CrossRef] [Green Version]
  18. Li, L.; Xu, W.; Fu, X.; Huang, Y.; Wen, Y.; Xu, Q.; He, X.; Wang, K.; Huang, S.; Lv, Z. Blood miR-1275 is associated with risk of ischemic stroke and inhibits macrophage foam cell formation by targeting ApoC2 gene. Gene 2020, 731, 144364. [Google Scholar] [CrossRef]
  19. Benchoula, K.; Parhar, I.S.; Hwa, W.E. The molecular mechanism of vgf in appetite, lipids, and insulin regulation. Pharmacol. Res. 2021, 172, 105855. [Google Scholar] [CrossRef]
  20. Bessesen, D.H.; Rupp, C.L.; Eckel, R.H. Trafficking of dietary fat in lean rats. Obes. Res. 1995, 3, 191–203. [Google Scholar] [CrossRef]
  21. Vienberg, S.G.; Kleinridders, A.; Suzuki, R.; Kahn, C.R. Differential effects of angiopoietin-like 4 in brain and muscle on regulation of lipoprotein lipase activity. Mol. Metab. 2015, 4, 144–150. [Google Scholar] [CrossRef] [PubMed]
  22. Wu, Y.; Tan, F.; Zhang, T.; Xie, B.; Ran, L.; Zhao, X. The anti-obesity effect of lotus leaves on high-fat-diet-induced obesity by modulating lipid metabolism in C57BL/6J mice. Appl. Biol. Chem. 2020, 63, 61. [Google Scholar] [CrossRef]
  23. Imessaoudene, A.; Merzouk, H.; Berroukeche, F.; Mokhtari, N.; Bensenane, B.; Cherrak, S.; Merzouk, S.A.; Elhabiri, M. Beneficial effects of quercetin–iron complexes on serum and tissue lipids and redox status in obese rats. J. Nutr. Biochem. 2016, 29, 107–115. [Google Scholar] [CrossRef] [PubMed]
  24. Presby, D.M.; Rudolph, M.C.; Sherk, V.D.; Jackman, M.R.; Foright, R.M.; Jones, K.L.; Houck, J.A.; Johnson, G.C.; Higgins, J.A.; Neufer, P.D. Lipoprotein lipase overexpression in skeletal muscle attenuates weight regain by potentiating energy expenditure. Diabetes 2021, 70, 867–877. [Google Scholar] [CrossRef] [PubMed]
  25. Del Bas, J.M.; Fernández-Larrea, J.; Blay, M.; Ardèvol, A.; Salvadó, M.J.; Arola, L.; Bladé, C. Grape seed procyanidins improve atherosclerotic risk index and induce liver CYP7A1 and SHP expression in healthy rats. FASEB J. 2005, 19, 479–481. [Google Scholar] [CrossRef] [PubMed]
  26. Kim, J.H.; Kim, O.-K.; Yoon, H.-G.; Park, J.; You, Y.; Kim, K.; Lee, Y.-H.; Choi, K.-C.; Lee, J.; Jun, W. Anti-obesity effect of extract from fermented Curcuma longa L. through regulation of adipogenesis and lipolysis pathway in high-fat diet-induced obese rats. Food. Nutr. Res. 2016, 60, 30428. [Google Scholar] [CrossRef] [Green Version]
  27. Chen, G.; Luo, Y.C.; Ji, B.P.; Li, B.; Guo, Y.; Li, Y.; Su, W.; Xiao, Z.L. Effect of polysaccharide from Auricularia auricula on blood lipid metabolism and lipoprotein lipase activity of ICR mice fed a cholesterol-enriched diet. J. Food Sci. 2008, 73, H103–H108. [Google Scholar] [CrossRef]
  28. Kusunoki, M.; Tsutsumi, K.; Iwata, K.; Yin, W.; Nakamura, T.; Ogawa, H.; Nomura, T.; Mizutani, K.; Futenma, A.; Utsumi, K.; et al. NO-1886 (ibrolipim), a lipoprotein lipase activator, increases the expression of uncoupling protein 3 in skeletal muscle and suppresses fat accumulation in high-fat diet–induced obesity in rats. Metabolism 2005, 54, 1587–1592. [Google Scholar] [CrossRef]
  29. Wei, X.; Wang, D.; Yang, Y.; Xia, M.; Li, D.; Li, G.; Zhu, Y.; Xiao, Y.; Ling, W. Cyanidin-3-O-β-glucoside improves obesity and triglyceride metabolism in KK-Ay mice by regulating lipoprotein lipase activity. J. Sci. Food Agric. 2011, 91, 1006–1013. [Google Scholar] [CrossRef]
  30. Ahmad, B.; Friar, E.P.; Vohra, M.S.; Garrett, M.D.; Serpell, C.J.; Fong, I.L.; Wong, E.H. Mechanisms of action for the anti-obesogenic activities of phytochemicals. Phytochemistry 2020, 180, 112513. [Google Scholar] [CrossRef]
  31. Fan, C.; Yan, J.; Qian, Y.; Wo, X.; Gao, L. Regulation of lipoprotein lipase expression by effect of hawthorn flavonoids on peroxisome proliferator response element pathway. J. Pharmacol. 2006, 100, 51–58. [Google Scholar] [CrossRef] [PubMed] [Green Version]
  32. Seo, Y.-S.; Kang, O.-H.; Kim, S.-B.; Mun, S.-H.; Kang, D.-H.; Yang, D.-W.; Choi, J.-G.; Lee, Y.-M.; Kang, D.-K.; Lee, H.-S. Quercetin prevents adipogenesis by regulation of transcriptional factors and lipases in OP9 cells. Int. J. Mol. Med. 2015, 35, 1779–1785. [Google Scholar] [PubMed]
  33. Quesada, H.; Del Bas, J.; Pajuelo, D.; Díaz, S.; Fernandez-Larrea, J.; Pinent, M.; Arola, L.; Salvadó, M.; Bladé, C. Grape seed proanthocyanidins correct dyslipidemia associated with a high-fat diet in rats and repress genes controlling lipogenesis and VLDL assembling in liver. Int. J. Obes. 2009, 33, 1007–1012. [Google Scholar] [CrossRef] [PubMed] [Green Version]
  34. Paudel, K.R.; Panth, N. Phytochemical profile and biological activity of Nelumbo nucifera. Evid.-Based Complement. Altern. Med. 2015, 2015, 789124. [Google Scholar] [CrossRef] [Green Version]
  35. Zhu, M.-Z.; Wu, W.; Jiao, L.-L.; Yang, P.-F.; Guo, M.-Q. Analysis of flavonoids in lotus (Nelumbo nucifera) leaves and their antioxidant activity using macroporous resin chromatography coupled with LC-MS/MS and antioxidant biochemical assays. Molecules 2015, 20, 10553–10565. [Google Scholar] [CrossRef] [Green Version]
Figure 1. Base peak intestine chromatograms of RSE in positive ion mode (a) and negative ion mode (b).
Foods 11 02085 g001
Figure 2. RSE prevented high-fat-diet-induced obesity. (a) Mean energy intake per mouse per day. (b) Body weight changes during 9-week intervention. (c) Serum total cholesterol (TC) level. (d) Serum triglyceride (TG) level. (e) Serum low-density lipoprotein cholesterol (LDL-C) level. (f) Serum high-density lipoprotein cholesterol (HDL-C) level. Data are expressed as the mean ± SEM. # p < 0.05 and ## p < 0.01 for NC vs. HFD; * p < 0.05 and ** p < 0.01 for RSE vs. HFD. NC, the normal chow group; HFD, the high-fat-diet group; RSE, the RSE treatment group.
Foods 11 02085 g002aFoods 11 02085 g002bFoods 11 02085 g002c
Figure 3. Effect of RSE on the LPL activity in epididymal adipose (a) and skeletal muscle (b). Data are expressed as the mean ± SEM. # p < 0.05 and ## p < 0.01 for NC p. HFD; * p < 0.05 and ** p < 0.01 for RSE vs. HFD. Group abbreviations: refer to Figure 2 caption.
Foods 11 02085 g003
Figure 4. Effects of RSE on the LPL relative protein level in epididymal adipose tissue (a) and skeletal muscle (b). Data are expressed as the mean ± SEM. ## p < 0.01 for NC vs. HFD; ** p < 0.01 for RSE vs. HFD. Group abbreviations: refer to Figure 2 caption.
Foods 11 02085 g004
Figure 5. Effects of RSE on the LPL relative mRNA expression in epididymal adipose tissue (a) and skeletal muscle (b). Data are expressed as the mean ± SEM. # p < 0.05 and ## p < 0.01 for NC vs. HFD; * p < 0.05 and ** p < 0.01 for RSE vs. HFD. Group abbreviations: refer to Figure 2 caption.
Foods 11 02085 g005aFoods 11 02085 g005b
Table 1. The information of compounds identified in RSE.
No.Proposed CompoundRT (min)Observed m/zAdductTheoretical m/zFormulaOntologyMajor Fragment Ions m/z
12-Acetylacteoside1.315689.2020[M+Na]+689.2000C31H38O16Coumaric acids and derivatives527, 525, 509, 467, 365, 347
2Luteolin-6-C-glucoside1.433447.0968[M-H]−447.0933C21H20O11Flavonoid C-glycosides401, 357, 327, 297, 285
31-(3,4-Dimethoxycinnamoyl) piperidine1.434298.1414[M+Na]+298.1400C16H21NO3Cinnamic acids and derivatives283, 282, 254, 240, 190, 107
4Apigenin 6-C-glucoside 8-C-arabinoside1.472563.1463[M-H]−563.1406C26H28O14Flavone C and C-glycosides473, 443, 383, 353
56-Methylcoumarin1.593161.0593[M+H]+161.0600C10H8O2Coumarins and derivatives143, 115
6(+)-Gallocatechin1.671305.0669[M-H]−305.0667C15H14O7Flavanol125
7(E)-3-[2-[(2S,3R,4S,5S,6R)-3,4,5-trihydroxy-6-(hydroxymethyl) oxan-2-yl] oxyphenyl] prop-2-enoic acid1.671371.1010[M+FA-H]−371.0980C15H18O8Coumaric acids and derivatives163, 119
86-methoxy-4-methyl-2H-chromen-2-one1.673191.0861[M+H]+191.0800C11H10O3Coumarins and derivatives189
9Chalcone1.713209.0936[M+H]+209.0961C15H12ORetrochalcones189
102,5-dihydroxybenzoic acid1.751153.0198[M-H]−153.0193C7H6O4Hydroxybenzoic acid derivatives152, 124, 109, 107
11Casticin1.832397.0908[M+Na]+397.0900C19H18O87-O-methylated flavonoids283
12Procyanidin B21.909577.1404[M-H]−577.1351C30H26O12Biflavonoids and polyflavonoids289, 245, 205, 125
13Praeruptorin A1.912409.0904[M+Na]+409.0890C21H22O7Angular pyranocoumarins325
146″-O-Acetylglycitin1.912511.1231[M+Na]+511.1200C24H24O11Isoflavonoid O-glycosides475, 379
155,7-dihydroxy-2-(3-hydroxy-4-methoxyphenyl)-2,3-dihydro-4H-chromen-4-one1.951325.0706[M+Na]+325.0700C16H14O64′-O-methylated flavonoids325
16Procyanidin C11.989865.2050[M-H]−865.198C45H38O18Biflavonoids and polyflavonoids739, 695, 577, 407, 287
17Catechin2.276289.0721[M-H]−289.0718C15H14O6Flavanol245, 203, 151, 125, 109
18Protocatechuic aldehyde2.752137.0244[M-H]−137.0244C7H6O3Hydroxybenzaldehydes136, 119, 109, 108
19Methyl rosmarinate4.943397.0910[M+Na]+397.0900C19H18O8Coumaric acids and derivatives379, 349, 307, 295
20Swertisin4.943469.1074[M+Na]+469.1100C22H22O10Flavonoid C-glycosides433, 375
21(-)-Epigallocatechin 5.024329.0643[M+Na]+329.0640C15H14O7Flavonal311, 300, 286, 283, 255, 149
22Isoshaftoside5.064587.1323[M+Na]+587.1300C26H28O14Flavonoid 8-C-glycosides569, 551, 509, 497
23Myricetin-3-Galactoside5.237479.0872[M-H]−479.0831C21H20O13Flavonoid-3-O-glycosides433, 316, 271
24Homoorientin5.316447.0942[M-H]−447.0933C21H20O11Flavonoid C-glycosides369, 357,327, 299, 298, 297, 285
257-hydroxy-3-phenyl-4H-chromen-4-one5.353239.0678[M+H]+239.0700C15H10O3Isoflavones224, 181
262-Hydroxychalcone5.393225.0904[M+H]+225.0910C15H12O2Retrochalcones197, 182
27Quercetin5.513303.0482[M+H]+303.0500C15H10O7Flavonols285, 274, 257, 247, 229, 201, 153, 137
28Rutin5.513633.1376[M+Na]+633.1405C27H30O16Flavonols O-glycoside331
29Quercetin-3-O-rutinoside5.593609.1476[M-H]-609.1461C27H30O16Flavonoid O-glycosides343, 301, 300, 271, 255, 242, 178
308-(azepan-1-ium-1-ylmethyl)-3-(2,4-dimethoxyphenyl)-2-oxo-2H-chromen-7-olate5.593432.1784[M+Na]+432.1800C24H27NO5Hydroxyisoflavonoids297, 174
314′,7-Di-O-methylnaringenin5.633323.0882[M+Na]+323.0900C17H16O57-O-methylated flavonoids295
32Spiraeoside5.633465.1124[M+H]+465.1030C21H20O12Flavonoid O-glycosides303
332-(3,4-dihydroxyphenyl)-5-hydroxy-10-isopropyl-9,10-dihydropyrano [2,3-f] chromene-4,8-dione5.644405.0939[M+Na]+405.0900C21H18O7Pyranoflavonoids387, 377
34liquiritin5.644441.1163[M+Na]+441.1200C21H22O9Flavonoid O-glycosides423, 405, 379, 351, 325
35Vitexin5.671431.1003[M-H]−431.0984C21H20O10Flavonoid 8-C-glycosides341, 323, 311, 283
367-hydroxy-3-phenyl-4H-chromen-4-one5.683239.0677[M+H]+239.0700C15H10O3Isoflavones211, 183, 165, 153
375,7-dihydroxy-2-(4-hydroxyphenyl)-6-[(2S,3R,4R,5S,6R)-3,4,5-trihydroxy-6-(hydroxymethyl)oxan-2-yl]-8-[(2S,3R,4R,5R,6S)-3,4,5-trihydroxy-6-methyloxan-2-yl]chromen-4-one5.710577.1602[M-H]−577.1570C27H30O14Flavonoid 8-C-glycosides487, 473, 457, 383, 353, 179
383-Hydroxy-4-methoxycinnamic acid (isoferulic acid)5.750193.0518[M-H]−193.0506C10H10O4Hydroxycinnamic acids178, 134
39Isoquercitin5.750463.0902[M-H]−463.0880C21H20O12Flavonoid-3-O-glycosides301, 300, 271, 255
40Quercetin-3-Glucuronide5.750477.0706[M-H]−477.0675C21H18O13Flavonoid-3-O-glucuronides301, 255, 179, 151
41Hyperoside5.750927.1992[2M-H]−927.1837C21H20O12Flavonoid-3-O-glycosides463, 301
42Sinapic acid5.789223.0645[M-H]−223.0612C11H12O5Hydroxycinnamic acids193, 149
43Kaempferol5.803287.0529[M+H]+287.0550C15H10O6Flavonols287, 269, 241, 161, 153, 135
444′,5,7-Trihydroxy-6,8-diprenylisoflavone5.803429.1610[M+Na]+429.1700C25H26O56-prenylated isoflavanones309
45(2R,3R,4S,5R,6R)-2-(acetoxymethyl)-6-((3-(benzo[d][1,3]dioxol-5-yl)-6-ethyl-4-oxo-4H-chromen-7-yl)oxy)tetrahydro-2H-pyran-3,4,5-triyl triacetate5.962663.1678[M+Na]+663.1600C32H32O14Isoflavonoid O-glycosides417
46taxifolin5.868303.0550[M-H]−303.0510C15H12O7Sinapic acid derivative285, 177, 125
473-[(2S,3R,4S,5R,6R)-3,5-dihydroxy-6-(hydroxymethyl)-4-[(2S,3R,4R,5R,6S)-3,4,5-trihydroxy-6-methyloxan-2-yl]oxyoxan-2-yl]oxy-5,7-dihydroxy-2-(4-hydroxyphenyl)chromen-4-one5.868593.1551[M-H]−593.1512C27H30O15Flavanone glycosides547, 285, 255
48Isorhamnetin5.962317.0674[M+H]+317.0656C16H12O7Flavonol 302, 285, 274, 245, 229, 153
49Isorhamnetin-3-O-rutinoside6.027623.1674[M-H]−623.1617C28H32O16Flavonol O-glycosides315, 314, 300
509-(2,3-dihydroxypropoxy)-9-oxononanoic acid6.187261.1359[M-H]−261.1348C12H22O6Flavonol O-glycosides187, 125
51Genistein6.121271.0629[M+H]+271.0601C15H10O5Isoflavones153
52Diosmetin6.200301.0710[M+H]+301.0700C16H12O64′-O-methylated flavonoids286, 258, 229
534′-O-Glucosylvitexin6.680617.1353[M+Na]+617.1400C27H30O15Flavonoid O-glycosides555
54Sinapoylcholine7.320310.1599[M]+310.1643C16H24NO5Coumaric acids and derivatives278, 253
553,4-Dihydrocoumarin11.650149.0583[M+H]+149.0597C9H8O23,4-dihydrocoumarins121, 103
Table 2. Epididymal fat index during the intervention periods.
Group3 Weeks6 Weeks9 Weeks
NC4.76 ± 1.13411.61 ± 2.8412.26 ± 3.67
HFD24.61 ± 9.49 ##24.35 ± 7.67 ##29.30 ± 8.95 ##
RSE14.35 ± 4.42 ##**17.38 ± 5.35 ##**19.67 ± 3.07 ##**
Data are expressed as the mean ± SEM. ## p < 0.01 as compared with NC group; ** p < 0.01 as compared with HFD group. The epididymal fat index is expressed as mg/g. Group abbreviations refer to Figure 2 caption.
Publisher’s Note: MDPI stays neutral with regard to jurisdictional claims in published maps and institutional affiliations.

