Abstract
We conducted a large-scale, high-throughput phenotyping analysis of the effects of various pre-harvest and postharvest features on the quality of ‘Rustenburg’ navel oranges, in order to develop shelf-life prediction models to enable the use of the First Expired, First Out logistics strategy. The examined pre-harvest features included harvest time and yield, and the examined postharvest features included storage temperature, relative humidity during storage and duration of storage. All together, we evaluated 12,000 oranges (~4 tons) from six different orchards and conducted 170,576 measurements of 14 quality parameters. Storage time was found to be the most important feature affecting fruit quality, followed by storage temperature, harvest time, yield and humidity. The examined features significantly affected (p < 0.001) fruit weight loss, firmness, decay, color, peel damage, chilling injury, internal dryness, acidity, vitamin C and ethanol levels, and flavor and acceptance scores. Four regression models were evaluated for their ability to predict fruit quality based on pre-harvest and postharvest features. Extreme gradient boosting (XGBoost) combined with a duplication approach was found to be the most effective approach. It allowed for the prediction of fruit-acceptance scores among the full data set, with a root mean square error (RMSE) of 0.217 and an R2 of 0.891.
1. Introduction
Orange (Citrus sinensis) is the world’s fifth largest fruit crop (after banana, watermelons, apples and grapes), with an annual global production of 75.4 million tons [1]. Oranges, similar to other citrus fruits, are very popular and consumers appreciate their delicate, fruity and refreshing flavor, as well as their high nutritional value [2].
‘Rustenburg’ navel orange, which originated in South Africa, is a high-quality late-season orange that is seedless, relatively easy to peel, has a rich fruity flavor and is excellent for fresh consumption [3]. For these reasons, it is a widely cultivated late-season cultivar in several citrus-growing countries, including Israel, and ‘Rustenburg’ fruits are commercially stored for relatively long periods of up to 3–4 months, in order to extend the marketing season [4].
The postharvest storage performance of oranges may be affected by various pre-harvest and postharvest features [5]. Pre-harvest features such as climate conditions, cultivation practices, harvest time, choice of rootstock, tree age and yield may affect postharvest quality [6,7]. For example, during ripening, the fruit undergoes continuous metabolic changes, such as the accumulation of sugars and a decrease in acidity levels, which cause changes in fruit flavor and nutritional quality over the course of the ripening period [8]. Furthermore, early-harvested oranges are relatively sensitive to postharvest chilling injury and more tolerant to postharvest decay, whereas late-harvested fruits are more tolerant to chilling, but more sensitive to microbial spoilage [9]. It has also been reported that the maturity stage at harvest may affect peel pitting during storage [10]. Other pre-harvest features, such as tree age and yield, may affect the sugar and acidity levels, firmness and physiological behaviors, manifested as respiration and the rate of ethylene production [11].
The postharvest storage performance of oranges is greatly influenced by the environmental conditions under which the fruits are stored, especially temperature and relative humidity (RH) [12]. Temperature is the most important environmental factor affecting fruit quality after harvest, as low storage temperatures reduce respiration, water loss and pathogen growth, but can also cause chilling injury (CI) [12]. The optimal RH for postharvest storage of most fruit species is between 90–95%. Lower RH levels lead to greater water loss and RH levels that are too high may lead to condensation and the enhanced growth of pathogens [13]. Overall, it is recommended that oranges be stored at 3–8 °C and 90–95% RH [12].
Currently, the postharvest storage management of fruits and vegetables is principally governed by the First In, First Out (FIFO) logistics strategy, meaning that marketing decisions are based solely on storage time irrespective of the initial quality of the produce and its remaining potential shelf life [14,15]. Although the FIFO approach is straightforward and easy to implement, it is based on the assumption that all products arriving at the cold-storage facility on a particular date have the same shelf-life potential, which all too often is not the actual case [14]. In contrast, the adoption of the more advanced First Expired, First Out (FEFO) logistics strategy would enable more efficient inventory management based on shelf-life predictions for each particular batch of produce, to ensure that only high-quality produce will reach the distinct marketing destinations [15]. However, the adoption of an intelligent FEFO logistics-management system requires the development of accurate shelf-life prediction models that will provide reliable information regarding the remaining shelf-life of each batch of produce.
In recent years, various models have been developed to predict numerous postharvest storage traits, including respiration rate, microbial growth, physical, chemical, and sensorial characteristics, and storage life [16,17,18,19]. Advanced machine learning and artificial intelligence technologies now allow the development of even more accurate forecasting and prediction models for important agriculture outputs [20,21]. Nonetheless, the development of accurate and advanced shelf-life prediction models requires the acquisition of large amounts of postharvest storage data and the consideration of all of the factors that may affect produce quality, including various pre-harvest and postharvest features [22,23].
Overall, the main objective of the current research was to conduct a large-scale, high-throughput phenotyping analysis of the postharvest storage performance of ‘Rustenburg’ navel oranges, in order to develop shelf-life prediction models to enable the implementation of the FEFO method. To that end, we evaluated 12,000 oranges (~4 tons) harvested from six different orchards and conducted 170,576 measurements of 14 quality parameters.
2. Materials and Methods
2.1. Plant Material
‘Rustenburg’ navel oranges were harvested from six commercial orchards on different dates between 21 February 2021 and 6 April 2022, as described in Table 1. The rational for choosing different harvest times was to examine the postharvest performances of fruit with different maturity indices, i.e., different total soluble solids (TSS), acidity, peel color, etc. The day after harvest, the fruits were treated in a commercial citrus packinghouse. This treatment included washing, waxing, the application of fungicides, sorting and packaging according to common commercial practices. Then, the fruits were transferred to the Department of Postharvest Science, ARO, The Volcani Institute, where they were placed in cold storage rooms as described below.

Table 1.
Harvest times and yields for the six different orchards used for the current experiment.
2.2. Postharvest Storage Conditions
Fruits from each orchard were stored at 90% RH and at 3 different storage temperatures: 2, 5 and 8 °C. Fruits from Harvest 5 (Table 1) were also stored at 5 °C under high humidity (RH = 95%) and low humidity conditions (RH = 70%). The high RH was achieved by using a PARKOO PH06LB ultrasonic humidifier (ANIA, Kfar Aviv, Israel) and the low RH was achieved by using an IVLTD08 dehumidifier (Vogel Refrigeration Services, Ltd., Rishon LeZion, Israel). The normal RH at 5 °C without modifications was ~90%. Each harvest included 60 10 kg cartons of oranges (20 cartons were stored at each temperature), while the Harvest 5 included 100 10 kg cartons of oranges (20 cartons stored at each temperature and/or RH condition). Overall, the experiment included 400 10 kg cartons of oranges (i.e., a total of 4 tons of oranges).
2.3. Evaluations of Fruit Quality
Evaluations of fruit quality were conducted at Time 0 and at weekly intervals over a period of 20 weeks (~4.5 months). The quality evaluations were conducted after one additional week of storage under shelf-life conditions at 20 °C. The different quality evaluations are described below.
2.3.1. Firmness
Firmness was tested with a texture analyzer (TA-XT plus, Stable Micro Systems, Surrey, UK) with a 50-kg load cell, using a 75 mm (diam.) cylindrical probe. The machine compressed the samples (15 replicates for each treatment and storage time) in the equatorial zone until 5% deformation at a speed of 1 mm·s−1. Results were expressed as the force required to induce that level of deformation.
2.3.2. Weight Loss
Weight loss was evaluated by weighing the produce at Time 0 and then again after the different storage periods. Weight-loss data are expressed as percentages of weight lost relative to the initial weight.
2.3.3. Peel Color
Peel color was determined by measuring lightness (L*), chroma (C*) and hue angle (H°) values, using a Minolta Chromo Meter, Model CR-400 (Minolta, Tokyo, Japan). The presented data are means of 15 measurements.
2.3.4. Peel Damage, Decay and Internal Dryness
Peel damage, the incidence of decay and internal dryness were evaluated for the different storage periods following the manual sorting of the produce. Results are expressed as the percentage of infected fruits among the total amount of produce.
2.3.5. Total Soluble Solids (TSS) and Titratable Acidity (TA)
The total soluble solids (TSS) contents of the extracted juice were determined with a Model PAL-1 digital refractometer (Atago, Tokyo, Japan), and acidity levels (%) were measured by titration to pH 8.3 with 0.1 M NaOH using a Model CH-9101 automatic titrator (Metrohm, Herisau, Switzerland). Each measurement was replicated three times, with juice collected from three fruits used each time.
2.3.6. Vitamin C
The vitamin C (ascorbic acid) content of the orange juice was determined by titration with 2,6-dichlorophenolindophenol, as described previously [24]. Levels of ascorbic acid were determined by comparing the titration volumes of the fruit juices with those of a standard solution containing 0.1% ascorbic acid.
2.3.7. Ethanol Levels
Juice ethanol concentrations were determined as described by Davis and Chace [25]. Generally, 10 mL aliquots of juice were incubated at 37 °C for 30 min in 25 mL Erlenmeyer flasks. In parallel, Erlenmeyer flasks containing 10 mL of 100 µL L−1 ethanol were used as internal standards for quantity evaluations. After the incubation, 2 mL gas samples were withdrawn from the Erlenmeyers’ headspaces into syringes and ethanol levels were determined with a Varian 3300 gas chromatograph. The results are means of three replications; each replicate included juice collected from three different fruits.
2.3.8. Flavor
Flavor evaluations were conducted by three trained judges, who used a 1–9 hedonic scale, in which 1 = very bad and 9 = excellent.
2.3.9. Acceptance Scores
Visual and final acceptance scores were assigned by three trained judges using a 5-grade scale, in which 1 = very bad, 2 = poor, 3 = fair, 4 = good and 5 = excellent.
2.4. Statistical Analysis
Feature-importance values were analyzed using mean Shapley additive explanation (SHAP) values [26] and the mean decrease accuracy (MDA) method [27]. The ClusViz tool was used for heatmap graphical representation [28]. Pearson correlation values were calculated using the open-source R software (available from: http://www.r-project.org; accessed on 10 April 2022).
2.5. Quality-Prediction Models
2.5.1. Data-Set Preparation
The experiment produced 400-labeled data points; each data point represented one carton in the experiment. The input features were two pre-harvest variables (harvest date and yield) and three postharvest variables (storage time, temperature, humidity). The main model’s output (i.e., label) was the 5-grade scale final acceptance score assigned to each carton.
2.5.2. Prediction Models
We tested four different linear and non-linear regression models for their ability to predict fruit-acceptance scores. These models are described below.
Multiple Linear Regression (MLR)—This basic model attempts to establish a linear relationship between the features and the label [29]. The MLR uses two or more independent features to predict the outcome of a dependent output label by fitting a hyperplane. The model finds the optimal parameters that minimize the mean squared error for the predicted quality scores.
Support Vector Regression (SVR)—SVR is a generalization of support vector machine (SVM) for regression tasks [30,31]. Unlike other models, SVR attempts to predict the label within a small range of allowed error. In other words, while MLR punishes every prediction error, SVR tolerates small errors as long as they fall within a predefined range. SVR models often employ kernels, which enable non-linearity in the input space. Non-linearity is achieved by transforming the data to a higher dimensional space, in which the relation between the inputs and label will be a linear one. In this work, a radial basis function (RBF) kernel was found to produce the best results, hence the results below relate to the use of SVR with an RBF kernel.
Random Forests (RF)—RF is a supervised ensemble method that is widely used for regression problems [32]. The RF model employs multiple regression trees (i.e., forests) to reduce the variance error [33]. For each tree, the model introduces different subsets of samples and features with replacements, also known as the bagging approach [34]. At prediction time (inference), each individual tree predicts a different value and the average of all of the predictions is used. The tree structure enables non-linearity and by averaging multiple predictions of different trees, RF often produces more accurate results than SVR or MLR.
Extreme Gradient Boosting (XGBoost)—This is a state-of-the-art ensemble method that has become popular in recent years for tabular data predictions [35]. Similar to RF, this model is based on regression trees. However, unlike RF, it uses a boosting approach instead of bagging. In boosting, the trees are built sequentially, with each tree trying to minimize the remaining error of all previous trees [36].
2.5.3. Evaluation of the Models
A great deal of laboratory work was done to evaluate the 12,000 oranges and produce a data set of 400-labeled points. However, machine-learning models usually require many more data to learn and make predictions [37]. The common 80–20% train-set test-set split is risky when the data set is very small, since it is more likely to introduce bias. Hence, a K fold cross-validation method was used [38], with five folds and 20 repetitions producing 100 samples. If needed, pre-processing parameter scaling was applied to each iteration separately. Two metrics were used for the model evaluations: root mean squared error (RMSE) to compare the competing alternatives and the coefficient of determination (R2) to measure the amount of variance explained by each model.
2.5.4. Duplication as a Way to Deal with Unbalanced Data Sets
In this study, the target label (i.e., acceptance score) is a 5-grade scale variable, with 5 denoting that the produce is very suitable for marketing and 1 denoting produce unlikely to be purchased. The advanced FEFO logistics strategy is expected to enable an efficient inventory management based on shelf-life predictions, and thus has great interest in predicting low-scoring fruit. However, low scores were relatively rare in the current data set, as only 14.75% of the samples in the total data set had scores of 3 (“fair”) or less. To cope with this challenge, training set samples with scores that were equal or lower than 3.25 were duplicated. Overall, six modes of duplication were compared: no duplication (i.e., 0) and 1 to 5 duplications.
3. Results
3.1. Effects of Pre-Harvest and Postharvest Features on the Quality of ‘Rustenburg’ Navel Oranges
To collect the high-throughput phenotyping data required to develop shelf-life prediction models, we examined the effects of various pre-harvest and postharvest features on the quality of ‘Rustenburg’ navel oranges. The examined pre-harvest features included harvest time (with six different harvest times ranging from 21 February 2021 to 6 April 2021) and orchard yield, which ranged between 18 and 48 Ton/Hectare (Table 1). The examined postharvest features included storage temperature (2, 5 or 8 °C), RH level during storage (70, 90 or 95%) and duration of storage, with the fruits being evaluated weekly over a period of 20 weeks.
The effects of the different features on the postharvest storage performance of ‘Rustenberg’ navel oranges, including weight loss, firmness, color, decay, peel damage, CI and internal dryness, are presented in Figure 1.
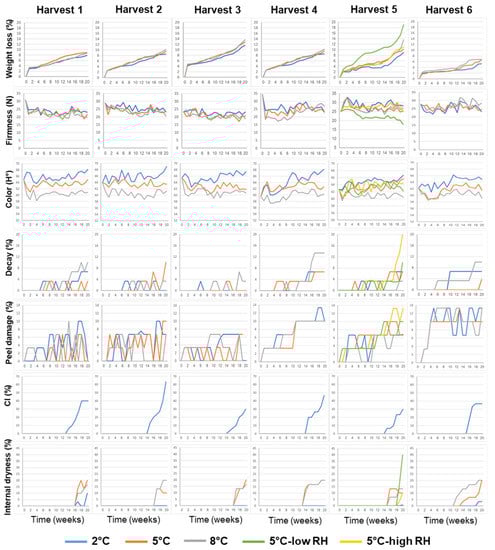
Figure 1.
Effects of various pre-harvest and postharvest features on the postharvest storage quality of ‘Rustenburg’ navel oranges harvested from six different orchards. The harvest times and yields of the different orchards are presented in Table 1. The postharvest features included storage temperature (2, 5 or 8 °C) and storage RH level (70, 90 or 95%). Fruit quality was evaluated every week after one additional week of storage under shelf conditions (at 20 °C) for a period of 20 weeks.
It can be seen that weight loss gradually increased during storage under all of the examined conditions, but reached its highest levels following storage under low-RH conditions. Firmness levels remained more or less stable over the course of the postharvest storage period, but gradually decreased under low-RH conditions.
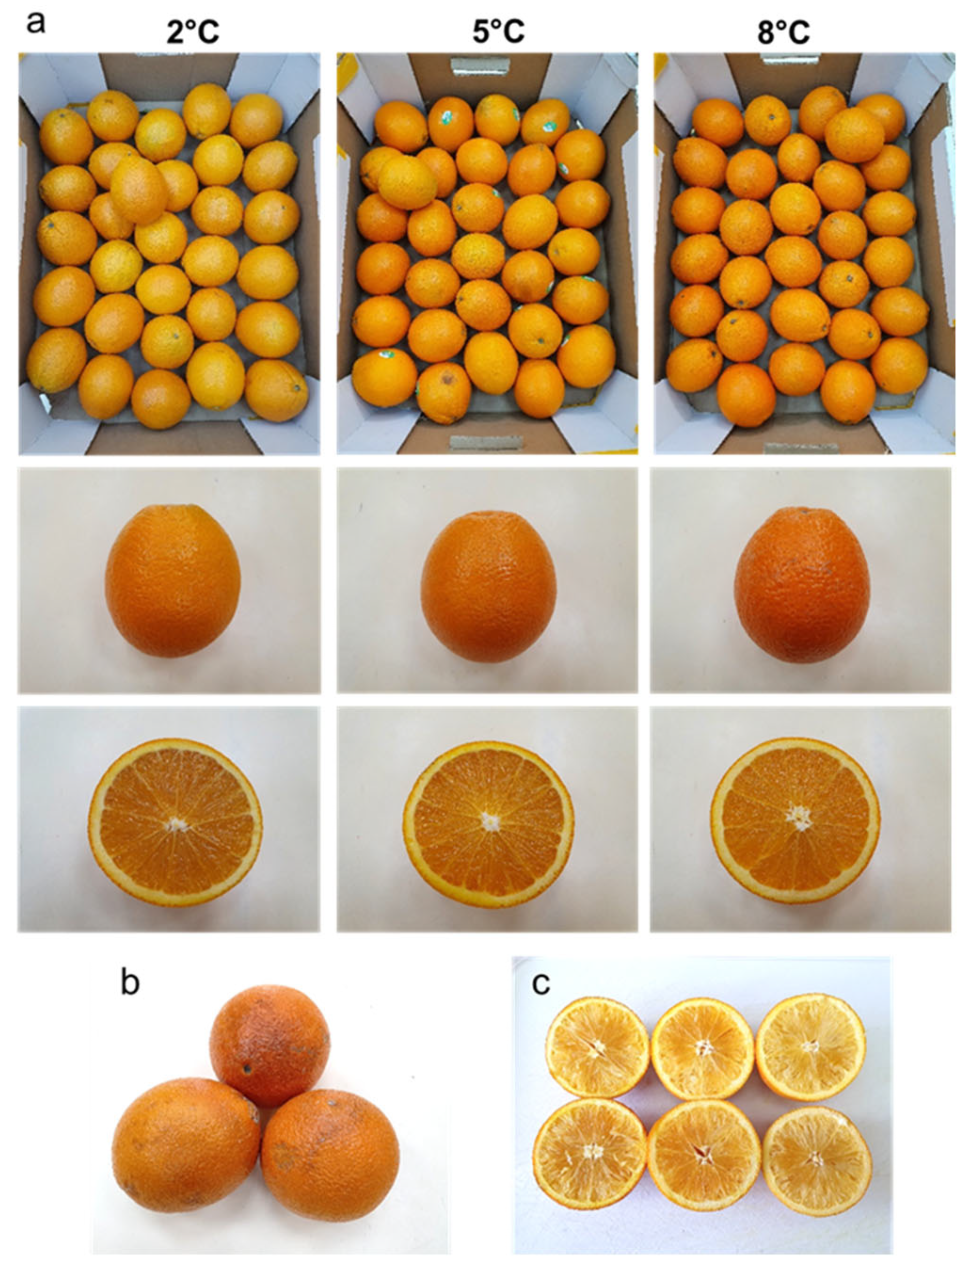
It is worth noting that the fruits from all of the orchards had a yellowish pale color (hue angle between 59–61°) following storage at the low temperature of 2 °C, a normal orange color (hue angle between 62–64°) following storage at 5 °C and a deep orange/reddish color (hue angle between 66–69°) following storage at 8 °C (Figure 1 and Figure 2a). It is also worth noting that CI symptoms developed only upon storage at the low temperature of 2 °C, whereas internal dryness symptoms developed mainly during storage at the moderate and higher temperatures of 5 °C and 8 °C (Figure 1 and Figure 2b,c).

Figure 2.
Photographs of ‘Rustenburg’ navel oranges. (a) Fruit stored at 2, 5 and 8 °C, (b) chilling injury, and (c) internal dryness symptoms.
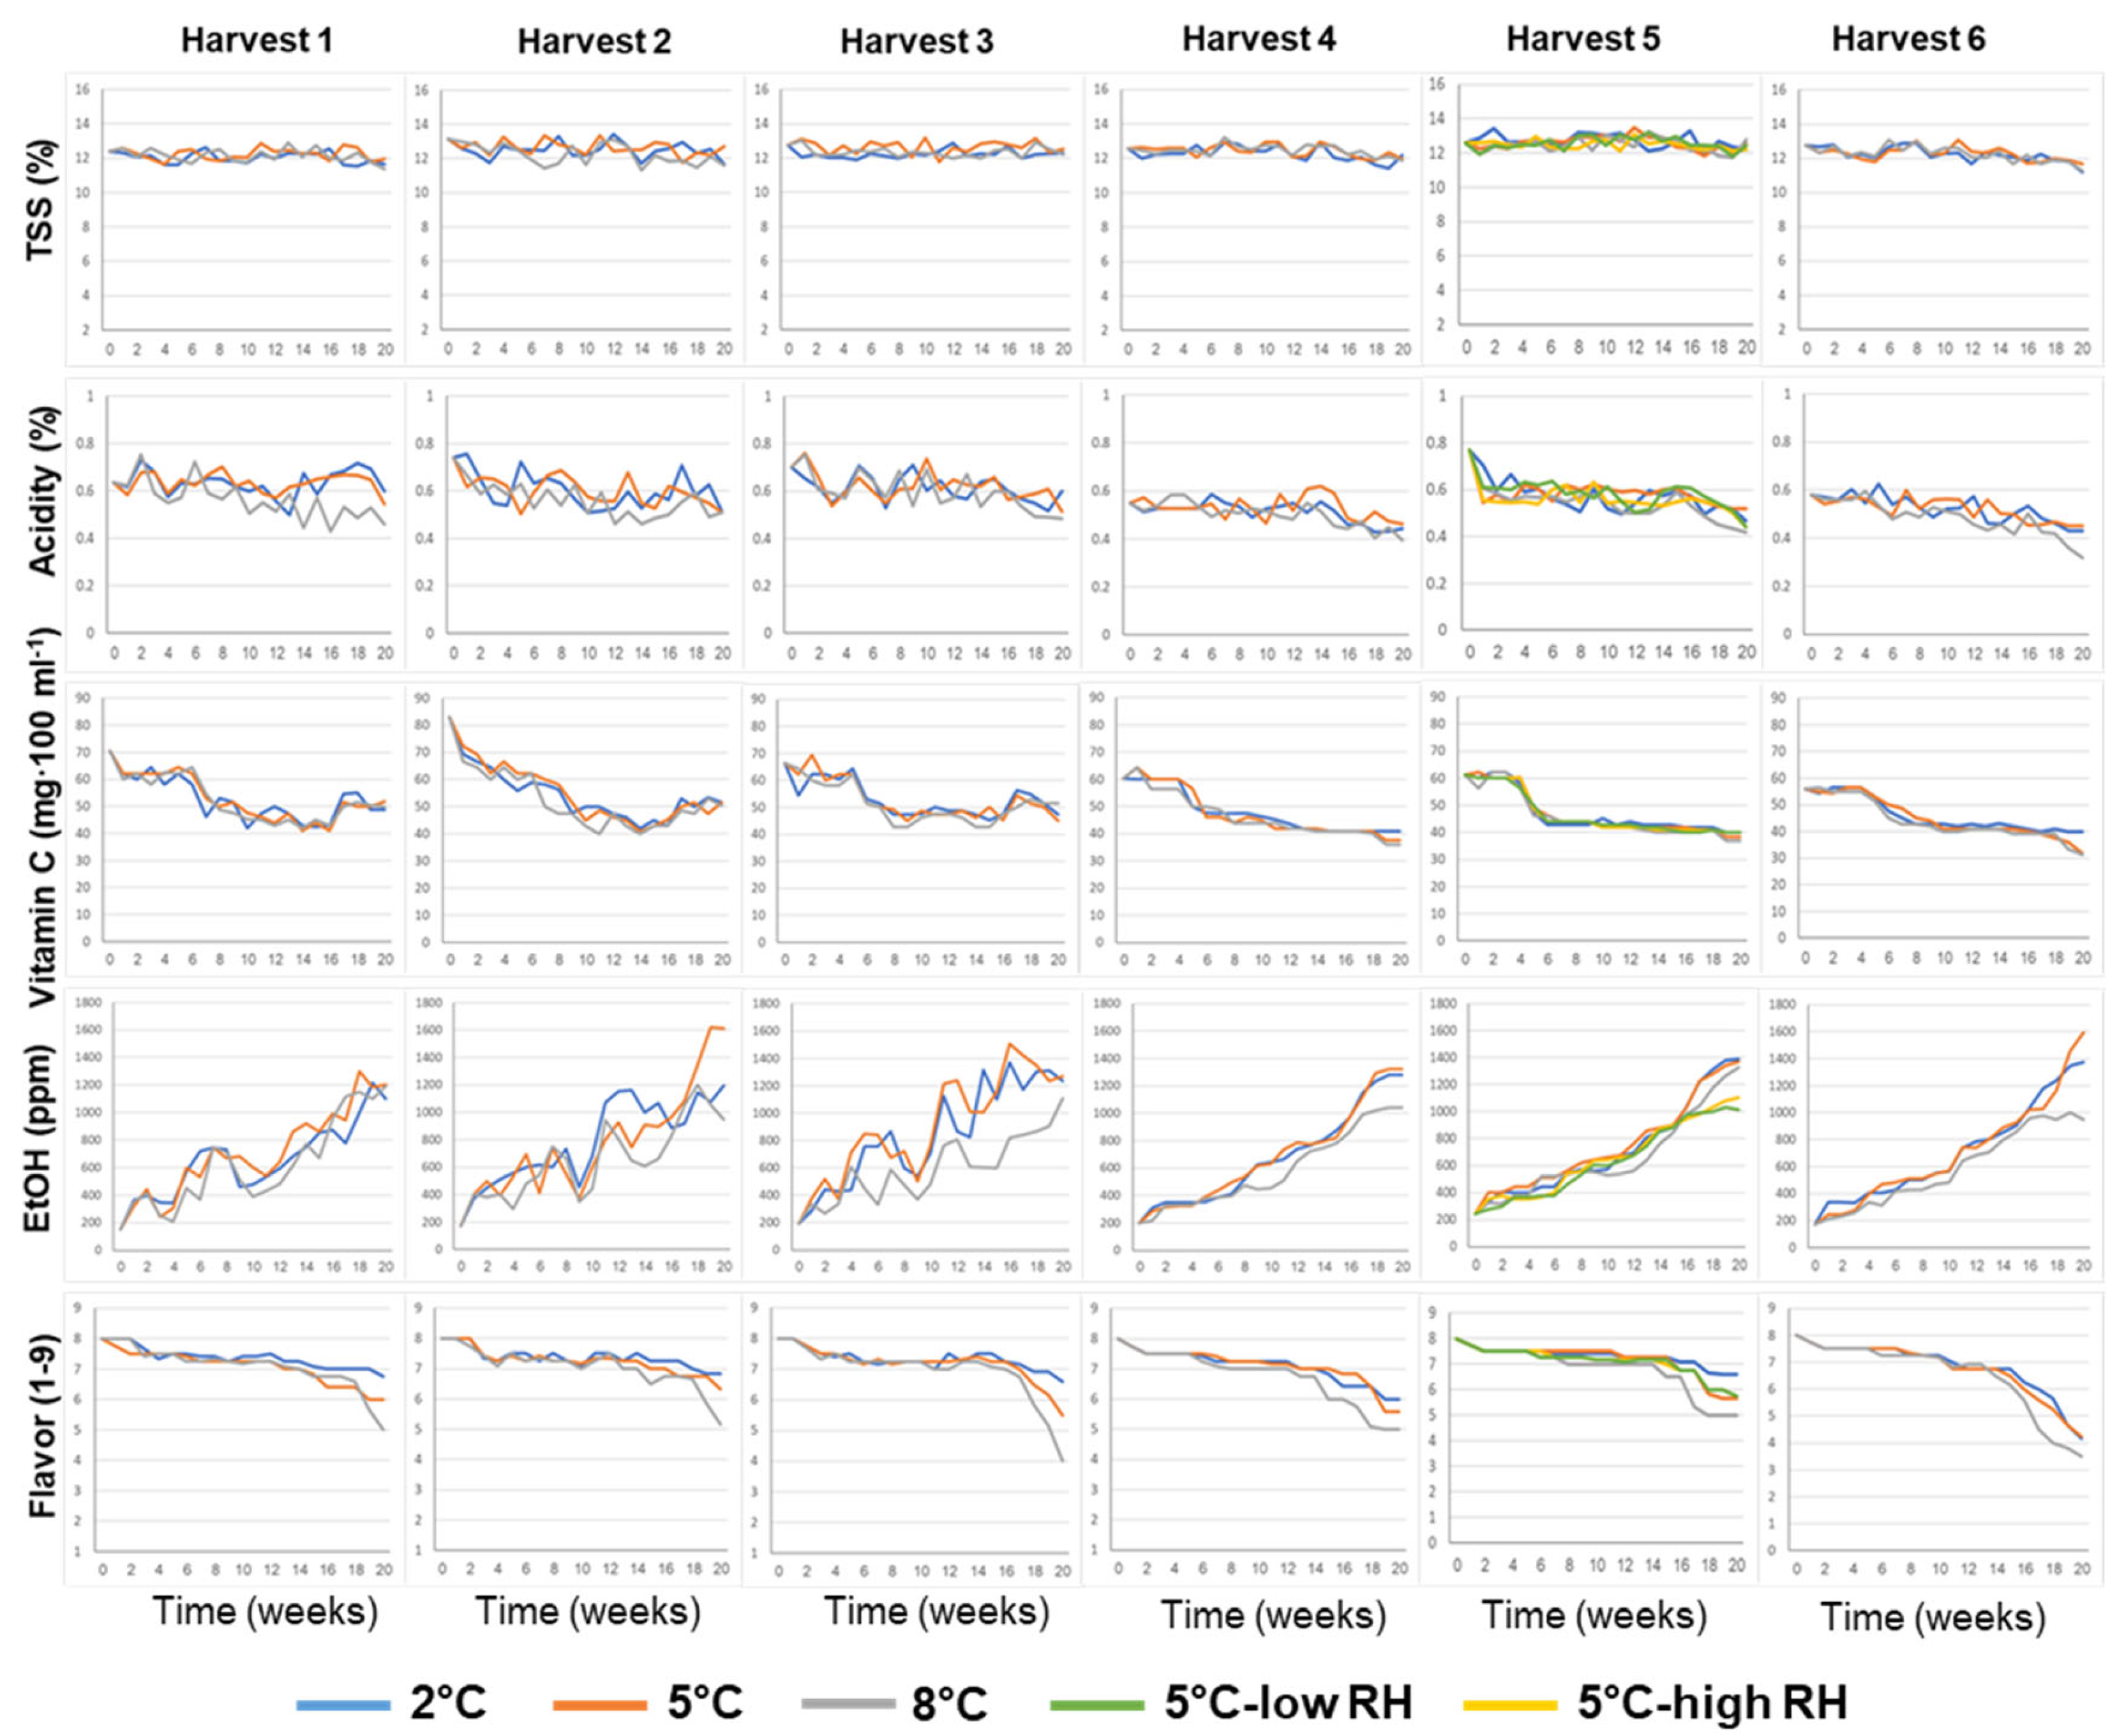
The effects of the various pre-harvest and postharvest features on the biochemical composition of the juice of ‘Rustenburg’ navel oranges, including TSS, acidity and vitamin C and ethanol levels, as well as flavor acceptance, are presented in Figure 3. The TSS levels remained relatively stable during storage, whereas acidity and vitamin C levels decreased and ethanol levels increased during storage. Fruit flavor acceptability remained relatively high (flavor acceptance score ≥ 7.0, on a scale of 1 to 9) for 14–18 weeks for the different orchards and treatments, but then tended to decrease, doing so somewhat more rapidly at the higher storage temperature of 8 °C.
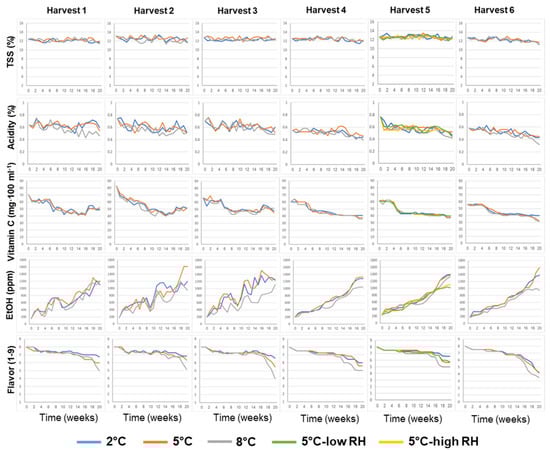
Figure 3.
Effects of various pre-harvest and postharvest features on the biochemical composition and flavor of ‘Rustenburg’ navel oranges harvested from six different orchards. The harvest times and yields of the different orchards are presented in Table 1. The postharvest features included storage temperature (2, 5 or 8 °C) and storage RH (70, 90 or 95%). Fruit quality was evaluated every week after one additional week of storage under shelf conditions (20 °C) for a period of 20 weeks.
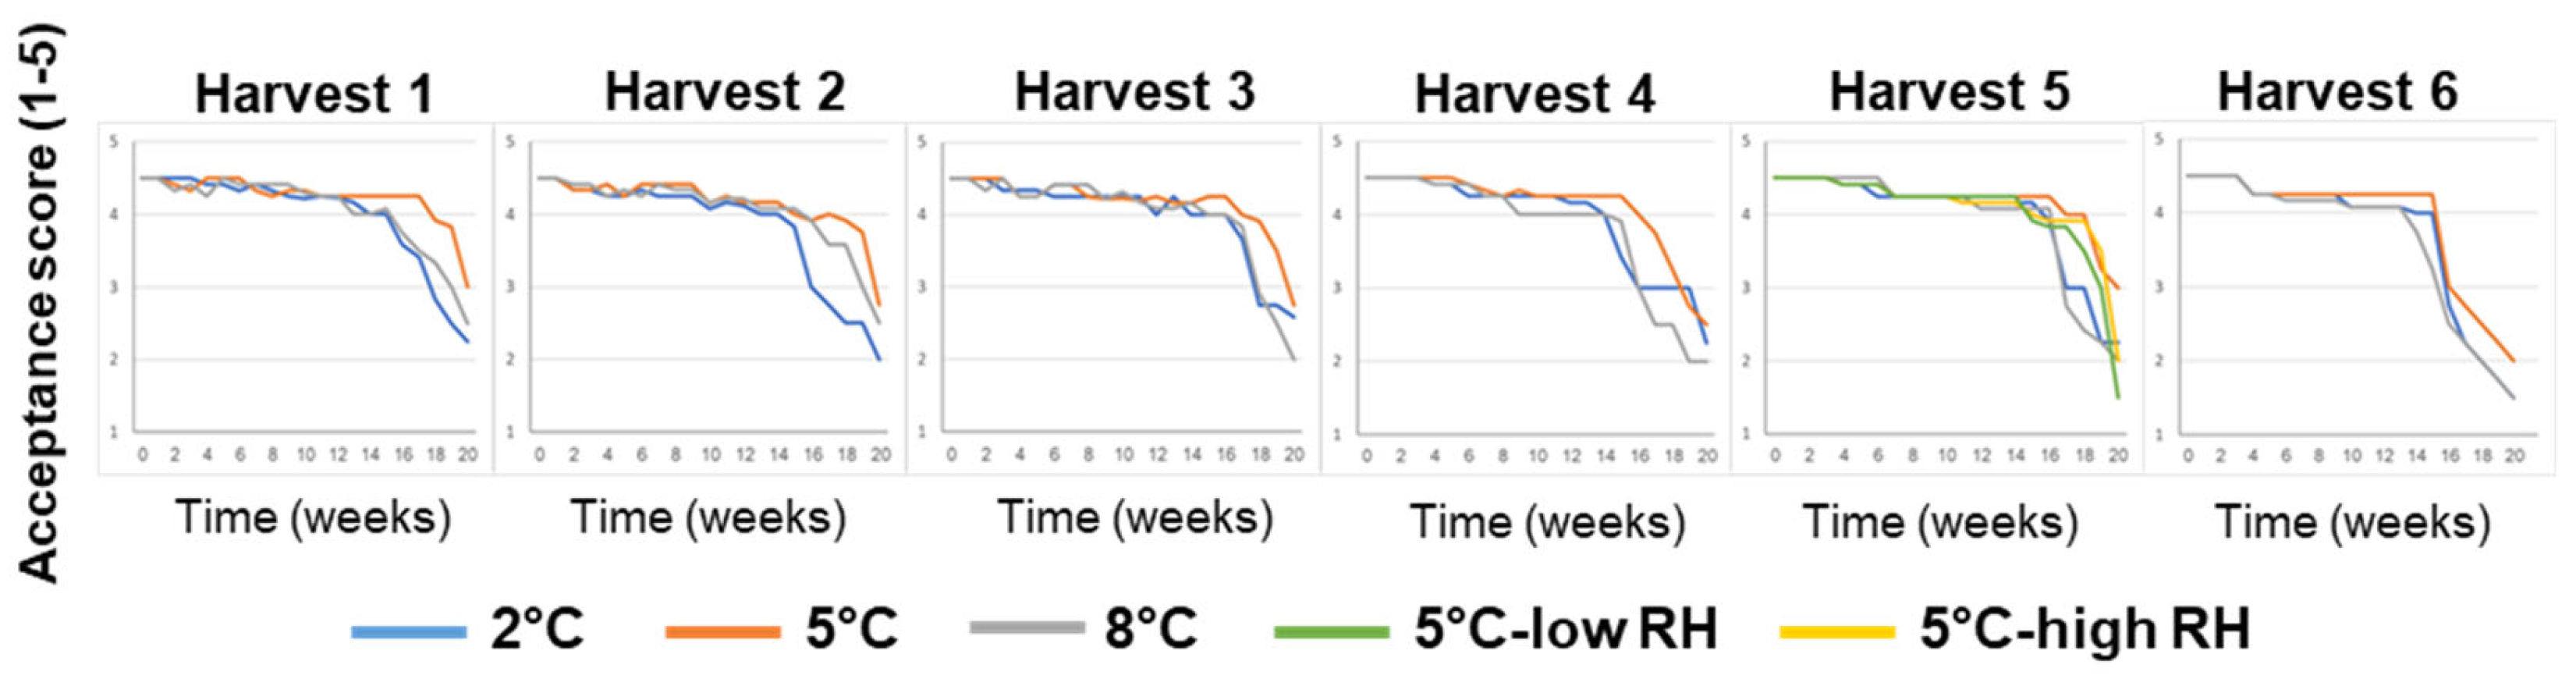
Overall, fruit-acceptance scores remained relatively high (acceptance score ≥ 4, on a scale of 1 to 5) for 14–19 weeks, depending on the various pre-harvest and postharvest features (Figure 4). It is worth noting that the fruits stored at 5 °C maintained high acceptance scores for longer periods when compared to the fruits stored at a lower temperature of 2 °C or a higher temperature of 8 °C.
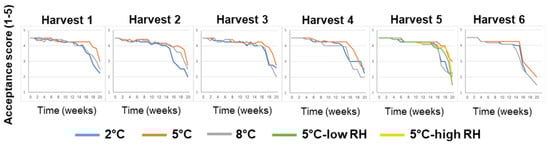
Figure 4.
Effects of various pre-harvest and postharvest features on the acceptance scores of ‘Rustenburg’ navel oranges harvested from six different orchards. The harvest times and yields of the different orchards are presented in Table 1. The postharvest features included storage temperature (2, 5 or 8 °C) and storage RH (70, 90 or 95%). Fruit quality was evaluated every week after one additional week of storage under shelf conditions (at 20 °C) for a period of 20 weeks.
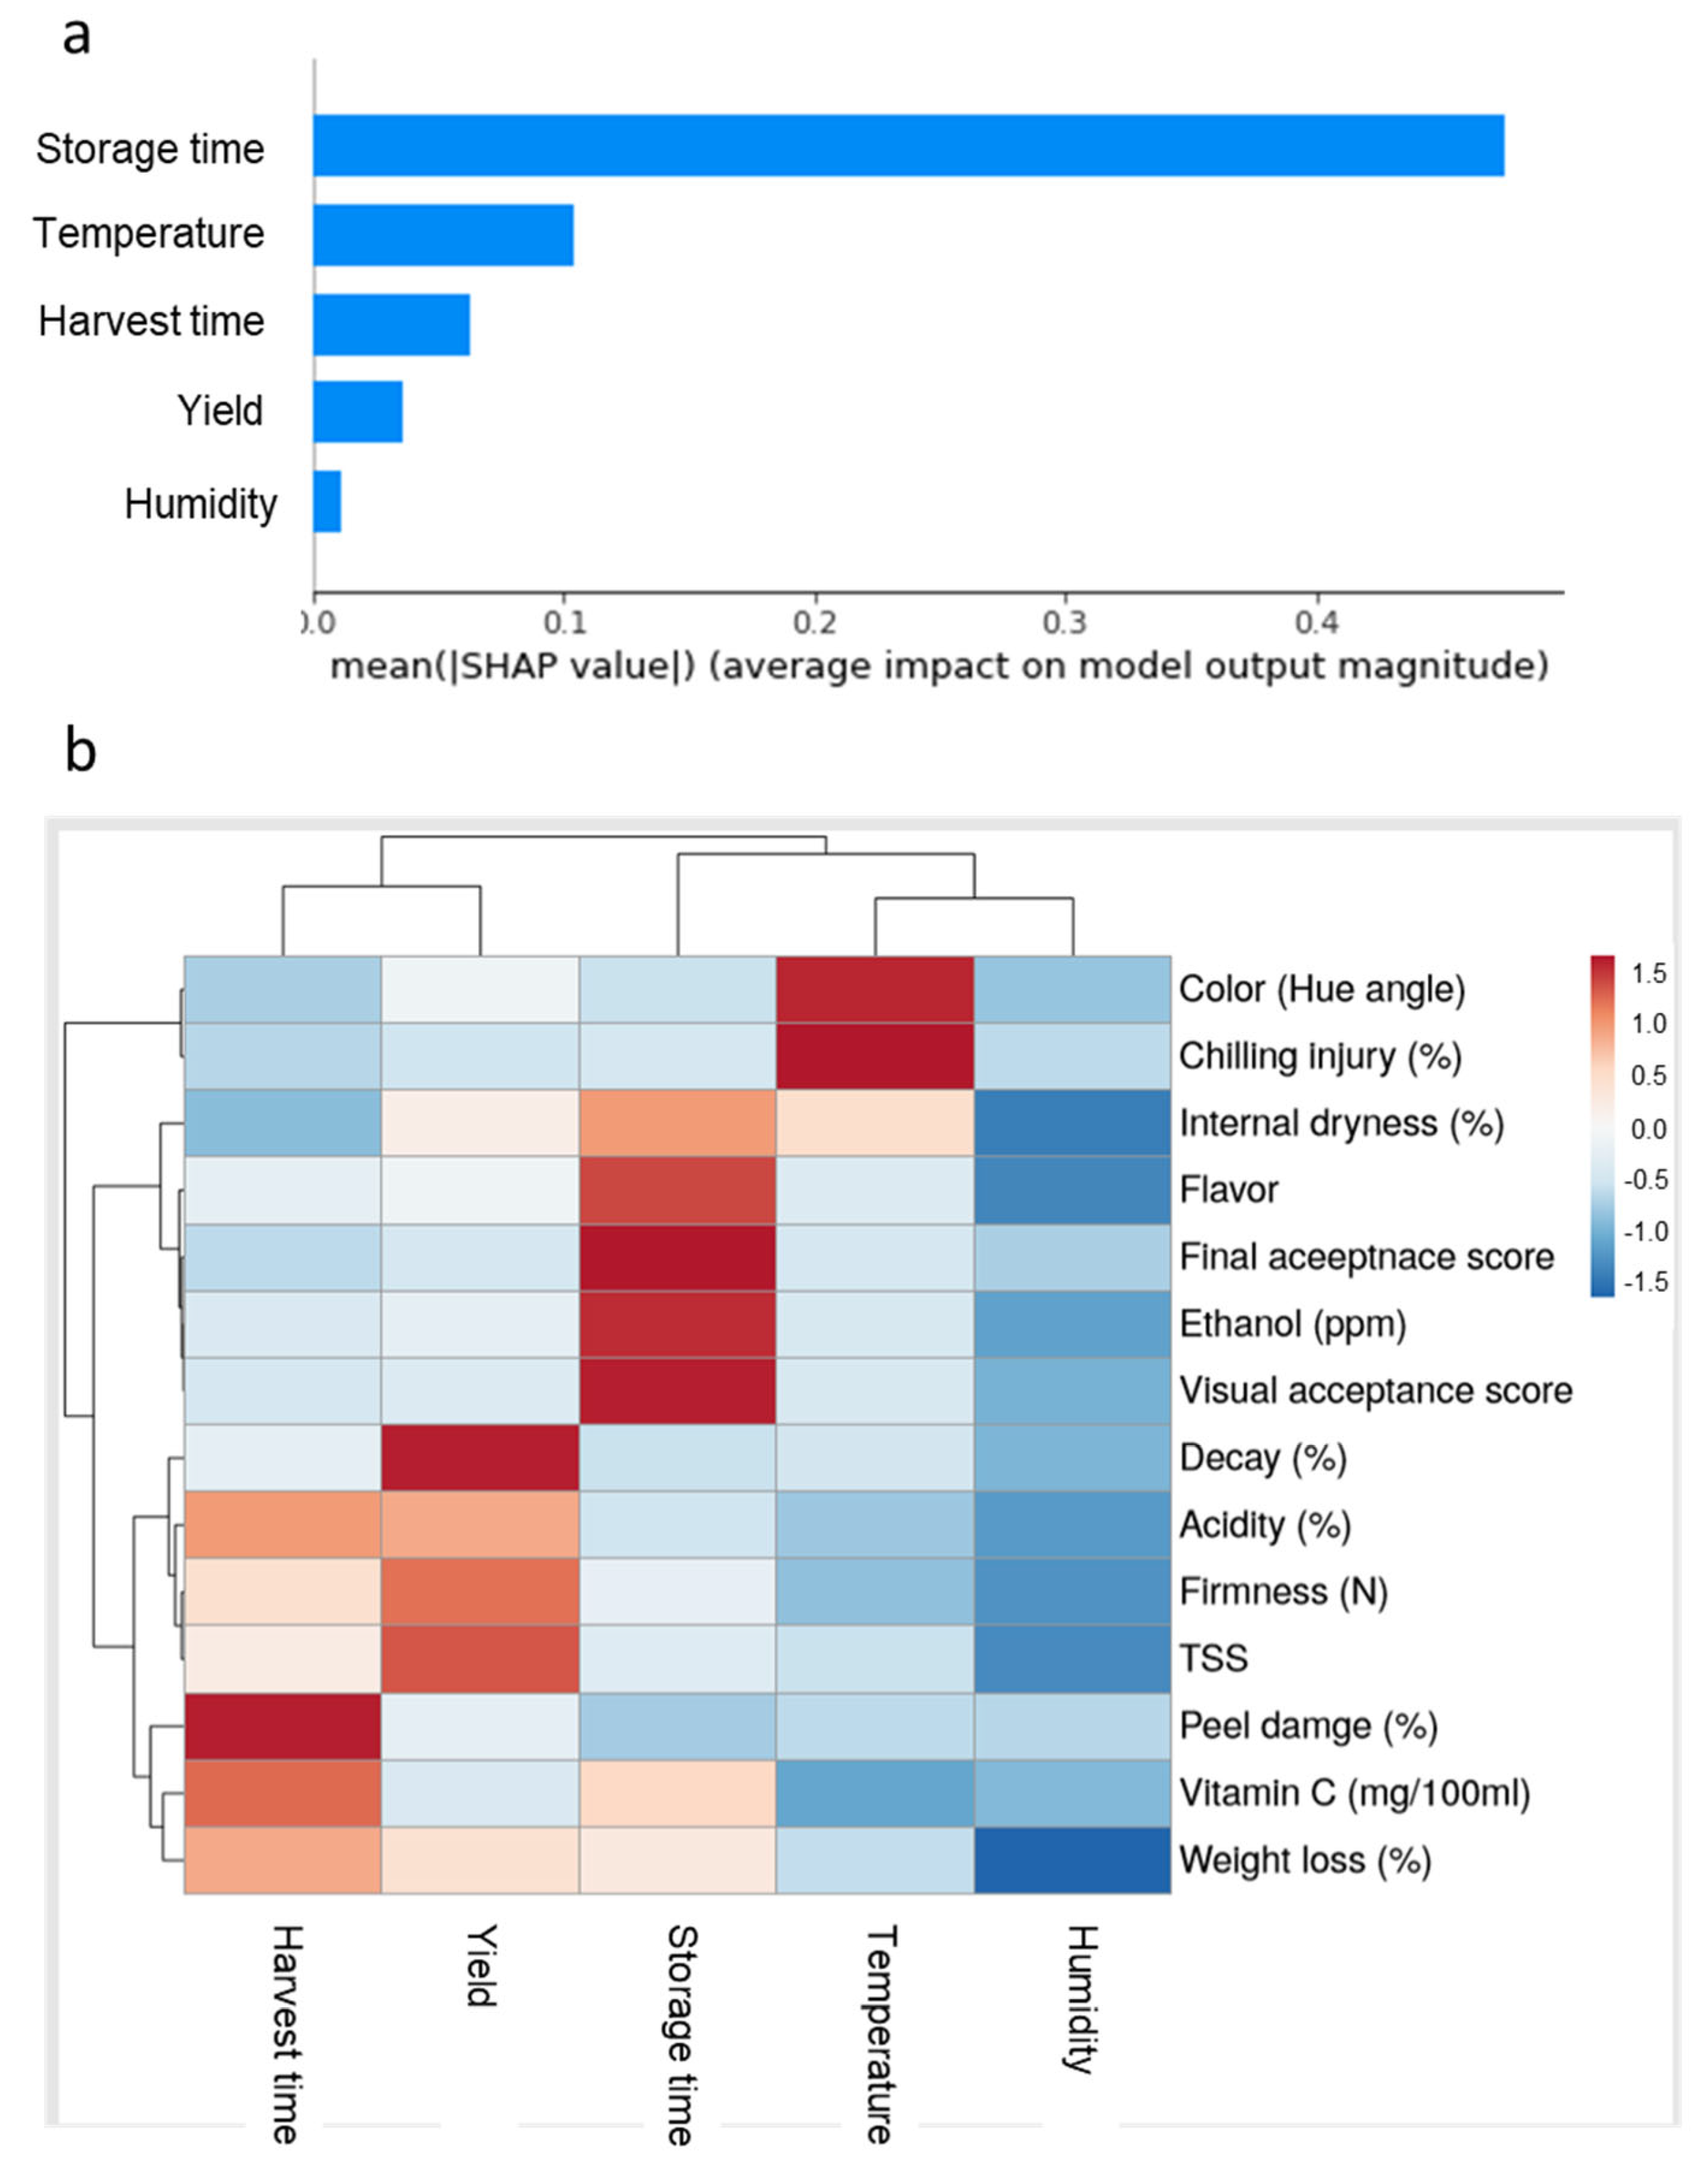
To evaluate the importance of the various pre-harvest and postharvest features on the quality of ‘Rustenburg’ navel oranges, we used various statistical analysis tools, including SHAP and RF MDA methods (Figure 5a,b). A feature importance analysis using mean SHAP values revealed that storage time was the most important feature affecting fruit quality, followed by storage temperature, harvest time, yield and humidity conditions (Figure 5a). Furthermore, RF MDA analysis revealed that harvest time had major effects on peel damage and vitamin C levels, and that orchard yield had major effects on decay, firmness and TSS. Regarding the postharvest features, storage time had major effects on ethanol accumulation, fruit flavor and acceptance scores; storage temperature had major effects on CI and peel color; humidity conditions during storage had a major effect on fruit weight loss (Figure 5b). It is worth noting that the different pre-harvest and postharvest features affected different postharvest quality parameters. For example, storage time mainly affected flavor, ethanol levels and acceptance scores, whereas storage temperature mainly affected color and CI (Figure 5b).
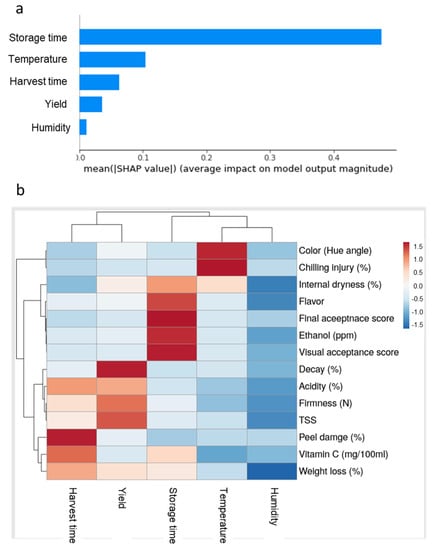
Figure 5.
Importance of the various pre-harvest and postharvest features on the quality of ‘Rustenburg’ navel oranges. (a) Feature importance analysis using the SHAP method. (b) Feature importance and heat-map analyses using the RF MDA method.
ANOVA revealed that the harvest date significantly affected acidity, vitamin C levels, decay, flavor, firmness, weight loss, peel damage, color and final acceptance scores, and orchard yields significantly affected acidity, vitamin C, flavor, weight loss and peel damage (p < 0.001; Table 2). Among the postharvest features, storage time significantly affected all of the examined parameters, with the exception of TSS. Storage temperature significantly affected all the parameters except for decay and TSS, and storage humidity significantly affected firmness and weight loss (Table 2).
Table 2.
Effects of different pre-harvest and postharvest features on the quality attributes of ‘Rustenburg’ navel oranges. The presented data are ANOVA p values. Gray shading indicates statistical significance (p ≤ 0.001).
Pearson correlations between the various quality parameters revealed positive correlations among flavor, visual and final acceptance scores and acidity and vitamin C levels, as well as negative correlations between these attributes and changes in ethanol levels, weight loss, decay, internal dryness, peel damage, color and CI (Figure 6; red and blue boxes, respectively). We also observed positive correlations between ethanol content, decay, weight loss and internal dryness, as well as negative correlations between weight loss and firmness (Figure 6; pink and black boxes, respectively).
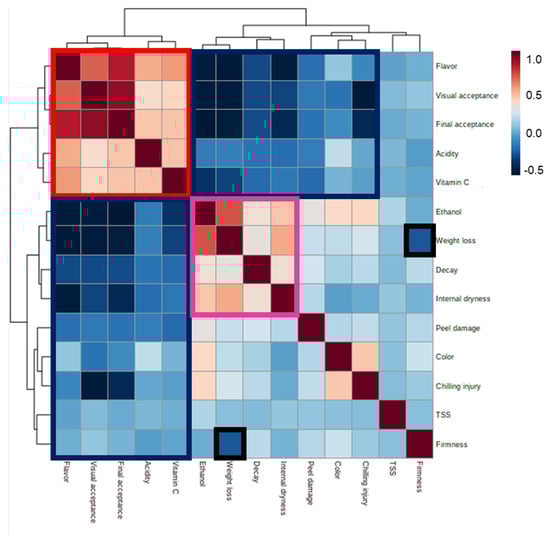
Figure 6.
Pearson correlations and heat-map analysis of the various fruit-quality parameters. Red and pink boxes indicate parameters that are positively correlated with one another, and blue and black boxes indicate parameters that are negatively correlated with one another.
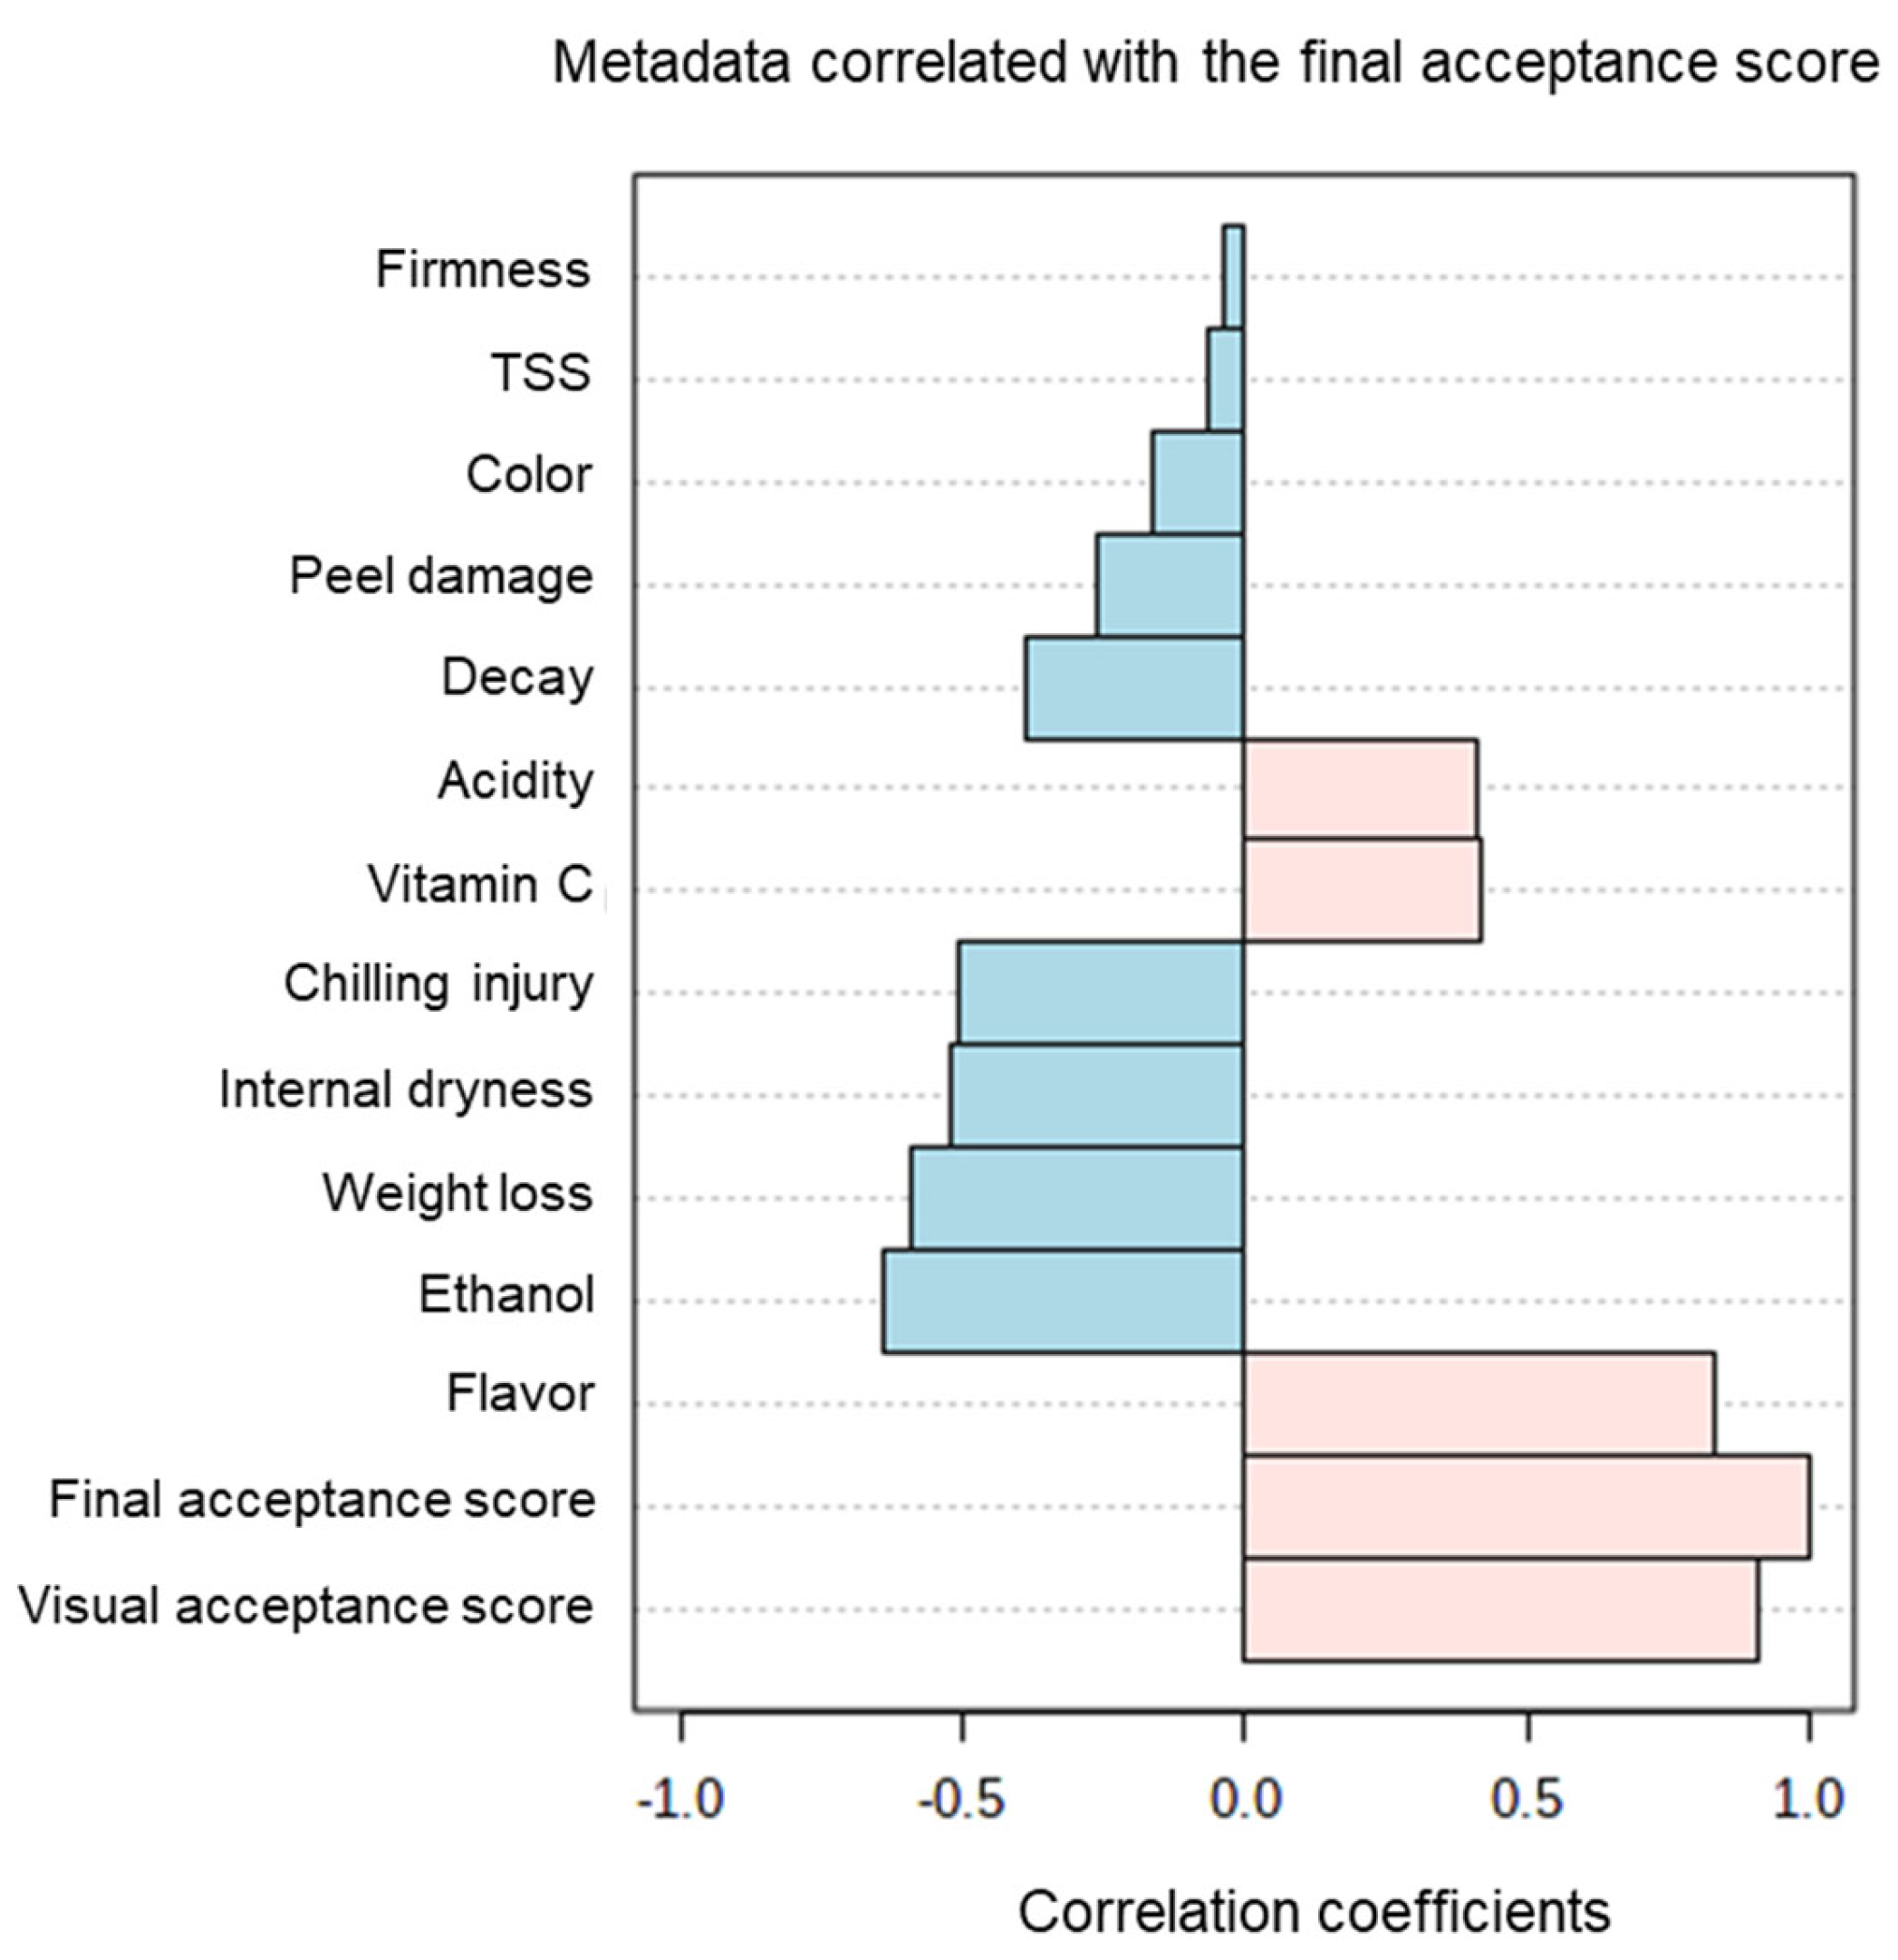
Finally, Pearson correlations revealed positive correlations between final acceptance scores and acidity, vitamin C, flavor and visual acceptance scores, and negative correlations between final acceptance scores and changes in TSS, firmness, color, peel damage, decay, CI, internal dryness, weight loss and ethanol accumulation (Figure 7).
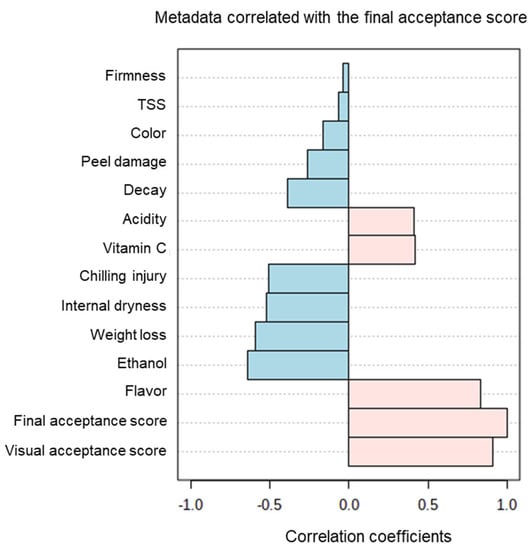
Figure 7.
Pearson correlations between the various fruit-quality parameters and the final acceptance scores.
3.2. Quality-Prediction Models
Four regression models, including one linear model (MLR) and three non-linear models (SVR, RF and XGBoost), were evaluated for their abilities to predict acceptance scores based on two pre-harvest and three postharvest features (Table 3). Since the data set was not balanced, the models were evaluated twice. First, we evaluated the entire test sets (referred to as the “full set”) and then we evaluated a subset of the full set that consisted only of samples with acceptance scores equal or lower than 3.25 (i.e., low-quality samples, referred to here as the “low-score subset”). RMSE and R2 were calculated using a cross-validation method, which produced 100 samples, and the Wilcoxon non-parametric signed-rank test was applied to the results. As shown in Table 3, the XGBoost regression model outperformed the other models (p < 0.01). The observed RMSE values of the XGBoost model for the full set and the low-score subset were 0.195 and 0.380, respectively; and the R2 values were 0.914 and 0.305, respectively. As expected, the RMSE and R2 model prediction values were higher for the full set than for the low-score subset.
Table 3.
RMSE and R2 values for the MLR, SVR, RF and XGBoost regression models for the full data set and the low-score subset.
To further improve the XGBoost prediction model, especially for the low-score subset, we used a duplication approach in which low-quality samples in the training set were duplicated for each repetition and fold. Overall, six duplication modes were compared: no duplication (i.e., zero) and one to five duplications. The RMSE and R2 of the full set and low-score subset were measured again for each duplication mode (Table 4). The duplications had a relatively small diminishing effect on the RMSE and R2 of the full set (RMSE increased from 0.195 to 0.217; R2 decreased from 0.914 to 0.891), but substantially reduced the RMSE of the low-score subset from 0.380 to 0.329 and increased the R2 of the low-score subset from 0.305 to 0.479.
Table 4.
RMSE and R2 values for the XGBoost regression model for the full data set and the low-score subset with 0 to 5 duplications.
The FIFO logistic management method is based on the notion that storage time is the most crucial feature for predicting fruit quality. This was supported by the SHAP analysis, which revealed that storage time was the most important feature affecting the postharvest quality of oranges (Figure 5a). However, the results suggest that the other pre-harvest and postharvest features had additional effects on fruit quality. To evaluate the relative importance of the other examined pre-harvest and postharvest features in the prediction model, we conducted post hoc analyses to explore the contributions of various feature subsets on fruit-quality predictions. The data subgroups included: (1) storage time only, (2) storage time and pre-harvest features (harvest time and yield), (3) storage time and postharvest features (temperature and humidity) and (4) storage time and all pre-harvest and postharvest features (harvest time, yield, storage time, storage temperature and storage humidity).
XGBoost models with five duplications of the training sets were used to compare these subgroups. RMSE and R2 values for the full set and the low-score subset are presented in Table 5. For the full data set, the addition of either pre-harvest (Subgroup 2) or postharvest data (Subgroup 3) lowered the RMSE from 0.371 (Subgroup 1; i.e., storage time) to 0.304 and 0.340, respectively, and increased the R2 from 0.687 (Subgroup 1), based on storage time alone, to 0.790 (Subgroup 2) and 0.739 (Subgroup 3). The inclusion of all features (Subgroup 4) further reduced RMSE to 0.217 and increased R2 to 0.891. For the low-score subset, the neither did the addition of either pre-harvest (Subgroup 2) or postharvest data (Subgroup 3) improve the RMSE and R2 values. However, we observed an improved RMSE of 0.329 and R2 of 0.479 when all of the pre-harvest and postharvest features were included in the model (Subgroup 4), relative to storage time alone (Subgroup 1), with an RMSE of 0.473 and an R2 of −0.074.
Table 5.
The RMSE and R2 values for the XGBoost regression model with five duplications for the full data set and low-score subset, using four different feature subgroups.
4. Discussion
The main goal of the current study was to conduct a large-scale, high-throughput phenotyping analysis of the effects of various pre-harvest and postharvest features on the quality of ‘Rustenburg’ navel oranges, in order to develop quality-prediction models to enable the implementation of the more efficient FEFO logistic management system [14,15].
Performing the current postharvest storage evaluations of ‘Rustenburg’ navel oranges yielded two main outcomes: (1) they contribute to our current understanding of the importance of various pre-harvest and postharvest features on the quality of navel oranges, and (2) they allowed for the generation of quality-prediction models for oranges.
The SHAP analysis revealed that storage time is the most important feature affecting the postharvest quality of oranges, but also showed that other pre-harvest and postharvest features also have meaningful effects on fruit quality (Figure 5a). Furthermore, feature-importance analysis conducted using RF MDA revealed that different pre-harvest and postharvest features affect different aspects of fruit quality. For example, storage temperature mainly affects color and CI, whereas RH mainly affects weight loss (Figure 5b). More specifically, ANOVA revealed that the harvest time, storage time and storage temperature features significantly affected most examined fruit quality parameters, whereas tree yield significantly affected acidity, vitamin C, flavor, weight loss and peel damage, and humidity significantly affected fruit firmness and weight loss (Table 2). Thus, we conclude that all of the examined pre-harvest and postharvest features eventually influence the postharvest quality of navel oranges and that the most comprehensive quality-prediction models will include as many factors as possible.
Similar findings regarding the importance of both pre-harvest and postharvest features for shelf-life predictions were recently reported for nectarines. That work found that pre-harvest features, such as irrigation methods and fruit load, and postharvest features, such as storage temperature and storage RH, all have major effects on the postharvest quality of nectarines [39]. Other studies involving the development of shelf-life prediction models for strawberries, rocket leaves and mushrooms have reported that storage temperature is the most important feature affecting shelf life and quality [40,41,42]. However, another study pointed to the importance of RH for preserving the postharvest quality of strawberries [43].
The calculation of Pearson correlations between various orange fruit-quality parameters and final acceptance scores revealed that the fruit quality parameters that were positively correlated with high acceptance scores were acidity, vitamin C level and flavor, and that these parameters were also positively correlated with one another (Figure 6 and Figure 7). In contrast, changes in firmness, weight loss, decay, internal dryness, peel damage, CI, ethanol accumulation and fruit color were all negatively correlated with the fruit acceptance scores (Figure 6 and Figure 7).
The second main goal of the current study was to develop fruit quality prediction models. To that end, we examined four regression models and found that RF and XGBoost provided very effective quality predictions when the full experimental data set was used. The XGBoost regression model had a low RMSE value of just 0.195 for an acceptance score scale of one to five, as well as a high R2 value of 0.914 (Table 3). A more or less similar RMSE value of 0.184 and an R2 value of 0.911 were recently reported for the development of a shelf life prediction model of table grapes using an optimized radial basis function (RBF) and neural network [16]. However, unfortunately, the collected data were not fairly balanced, as low acceptance scores (equal or below three on a scale of one to five) accounted for only 14.75% of the total data set and, accordingly, the observed RMSE and R2 values for the low-scoring data set were only 0.380 and 0.305, respectively. Thus, the tested regression models provided much better quality predictions for fruits with higher acceptance scores than for fruits with lower acceptance scores.
To address this obstacle, we added a further duplication of the low-score subset and found that doing so helped to reduce the observed RMSE from 0.380 to 0.329 and increased the R2 from 0.305 to 0.479 (Table 4). Nonetheless, a further improvement of the quality predictions of low-acceptance-score fruits will require the performance of additional experiments and the generation of larger data sets of fruit with low acceptance scores.
Finally, post hoc analyses revealed that quality prediction models based on storage-time data alone were much less accurate than quality prediction models based on storage time together with the other examined pre-harvest and postharvest features (Table 5). Thus, the development of accurate quality-prediction models required for the implementation of the FEFO intelligent logistic management system necessitates the collection and use of as much pre-harvest and postharvest data as possible.
5. Conclusions
The main objective of the current research was to conduct a large-scale, high-throughput phenotyping analysis of the postharvest storage performance of ‘Rustenburg’ navel oranges, in order to develop shelf-life prediction models to enable the implementation of the FEFO logistic management method. The key findings were that the storage time appeared to be the most important feature affecting fruit quality, but also other features, including harvest time, storage temperature, yield and humidity, majorly influenced fruit postharvest quality. Based on the achieved data, we examined the efficacy of different regression models for their ability to predict fruit quality, and found that using XGBoost combined with a duplication approach provided the most effective approach, and allowed the prediction of fruit-acceptance scores among the full data set, with an RMSE of 0.217 and an R2 of 0.891. The development of accurate shelf-life prediction models should now allow the implementation of the FEFO logistic management system for more efficient inventory management and reduction of losses.
Author Contributions
All authors contributed substantially to this work. Conceptualization, R.P., A.L., N.K. and Y.S.; Data curation, A.O. and O.J.; Formal analysis, A.D.-F., O.J. and N.K.; Funding acquisition, R.P., A.L. and Y.S.; Investigation, A.O., O.J. and R.P.; Methodology, R.P., N.K. and Y.S.; Project administration, R.P. and Y.S.; Software, A.D.-F. and O.J.; Supervision, R.P., A.L., N.K. and Y.S.; Visualization, A.O. and R.P.; Writing–original draft, R.P. and O.J; Writing–review and editing, A.O., R.P., A.L., O.J., N.K. and Y.S. All authors have read and agreed to the published version of the manuscript.
Funding
This research was funded by The Israel Innovation Authority, grant number 70076.
Data Availability Statement
The data presented in this study are available on request from the corresponding author.
Conflicts of Interest
The authors declare no conflict of interest.
References
- Fruit: World Production by Type 2020|Statista, (n.d.). Available online: https://www.statista.com/statistics/264001/worldwide-production-of-fruit-by-variety/ (accessed on 19 May 2022).
- Ranganna, S.; Govindarajan, V.S.; Ramana, K.V.R.; Kefford, J.F. Citrus fruits–Varieties, chemistry, technology, and quality evaluation. Part II. Chemistry, technology, and quality evaluation. A. Chemistry. Crit. Rev. Food Sci. Nutr. 1983, 18, 313–386. [Google Scholar] [CrossRef] [PubMed]
- Marloth, R.H.; Basson, W.J. Relative Performance of Washington Navel Orange Selections and other Navel Varieties. J. Hortic. Sci. 1959, 34, 133–141. [Google Scholar] [CrossRef]
- Gao, Y.; Liu, Y.; Kan, C.; Chen, M.; Chen, J. Changes of peel color and fruit quality in navel orange fruits under different storage methods. Sci. Hortic. 2019, 256, 108522. [Google Scholar] [CrossRef]
- Kader, A.A. A Perspective on Postharvest Horticulture (1978–2003). HortScience 2003, 38, 1004–1008. [Google Scholar] [CrossRef] [Green Version]
- Arpaia, M. Preharvest factors influencing postharvest quality of tropical and subtropical fruit. HortScience 1994, 29, 982–985. [Google Scholar] [CrossRef] [Green Version]
- Tyagi, S.; Sahay, S.; Imran, M.; Rashmi, K.; Mahesh, S.S. Pre-harvest Factors Influencing the Postharvest Quality of Fruits: A Review. Curr. J. Appl. Sci. Technol. 2017, 23, 1–12. [Google Scholar] [CrossRef]
- Tadeo, J.L.; Ortiz, J.M.; Estellés, A. Sugar changes in Clementine and orange fruit during ripening. J. Hortic. Sci. 1987, 62, 531–537. [Google Scholar] [CrossRef]
- Schirra, M.; D’Hallewin, G.; Cabras, P.; Angioni, A.; Garau, V.L. Seasonal Susceptibility of Tarocco Oranges to Chilling Injury As Affected by Hot Water and Thiabendazole Postharvest Dip Treatments. J. Agric. Food Chem. 1998, 46, 1177–1180. [Google Scholar] [CrossRef]
- Alferez, F.; Zacarías, L. Influence of fruit maturity in the susceptibility of Navelina oranges to develop postharvest non-chilling peel pitting. Food Sci. Technol. Int. 2014, 20, 183–191. [Google Scholar] [CrossRef]
- Khalid, S.; Malik, A.U.; Khan, A.S.; Khan, M.N.; Ullah, M.I.; Abbas, T.; Khalid, M.S. Tree age and fruit size in relation to postharvest respiration and quality changes in ‘Kinnow’ mandarin fruit under ambient storage. Sci. Hortic. 2017, 220, 183–192. [Google Scholar] [CrossRef]
- Kader, A.A.; Arpaia, M.L. Postharvest handling systems: Subtropical fruit. In Postharvest Technology of Horticultural Crops, 3rd ed.; University of California, Agriculture and Natural Resources: Oakland, CA, USA, 2002; pp. 375–384. [Google Scholar]
- Paull, R. Effect of temperature and relative humidity on fresh commodity quality. Postharvest Biol. Technol. 1999, 15, 263–277. [Google Scholar] [CrossRef]
- Hertog, L.A.T.M.; Uysal, I.; McCarthy, U.; Verlinden, B.M.; Nicolaï, B.M. Shelf life modelling for first-expired-first-out warehouse management. Philos. Trans. R. Soc. A Math. Phys. Eng. Sci. 2014, 372, 20130306. [Google Scholar] [CrossRef] [PubMed]
- Jedermann, R.; Nicometo, M.; Uysal, I.; Lang, W. Reducing food losses by intelligent food logistics. Philos. Trans. R. Soc. London. Ser. A: Math. Phys. Eng. Sci. 2014, 372, 20130302. [Google Scholar] [CrossRef] [PubMed]
- Li, Y.; Chu, X.; Fu, Z.; Feng, J.; Mu, W. Shelf life prediction model of postharvest table grape using optimized radial basis function (RBF) neural network. Br. Food J. 2019, 121, 2919–2936. [Google Scholar] [CrossRef]
- Song, Y.; Hu, Q.; Wu, Y.; Pei, F.; Kimatu, B.M.; Su, A.; Yang, W. Storage time assessment and shelf-life prediction models for postharvest Agaricus bisporus. LWT 2019, 101, 360–365. [Google Scholar] [CrossRef]
- Jalali, A.; Linke, M.; Geyer, M.; Mahajan, P.V. Shelf life prediction model for strawberry based on respiration and transpiration processes. Food Packag. Shelf Life 2020, 25, 100525. [Google Scholar] [CrossRef]
- Salehi, F. Recent Advances in the Modeling and Predicting Quality Parameters of Fruits and Vegetables during Postharvest Storage: A Review. Int. J. Fruit Sci. 2020, 20, 506–520. [Google Scholar] [CrossRef]
- Cammarota, G.; Ianiro, G.; Ahern, A.; Carbone, C.; Temko, A.; Claesson, M.J.; Gasbarrini, A.; Tortora, G. Gut microbiome, big data and machine learning to promote precision medicine for cancer. Nat. Rev. Gastroenterol. Hepatol. 2020, 17, 635–648. [Google Scholar] [CrossRef]
- Neethirajan, S. The role of sensors, big data and machine learning in modern animal farming. Sens. Bio-Sens. Res. 2020, 29, 100367. [Google Scholar] [CrossRef]
- La Scalia, G.; Nasca, A.; Corona, O.; Settanni, L.; Micale, R. An Innovative Shelf Life Model Based on Smart Logistic Unit for an Efficient Management of the Perishable Food Supply Chain. J. Food Process Eng. 2017, 40, e12311. [Google Scholar] [CrossRef]
- Chaudhuri, A.; Dukovska-Popovska, I.; Subramanian, N.; Chan, H.K.; Bai, R. Decision-making in cold chain logistics using data analytics: A literature review. Int. J. Logist. Manag. 2018, 29, 839–861. [Google Scholar] [CrossRef] [Green Version]
- Hiromi, K.; Kuwamoto, C.; Ohnishi, M. A rapid sensitive method for the determination of ascorbic acid in the excess of 2,6-dichlorophenolindophenol using a stopped-flow apparatus. Anal. Biochem. 1980, 101, 421–426. [Google Scholar] [CrossRef]
- Davis, P.L.; Chace, W.G. Determination of alcohol in citrus juice by gas chromatographic analysis of headspace. Hortscience 1969, 2, 168–169. [Google Scholar]
- Lundberg, S.M.; Lee, S.U. A unified approach to interpreting model predictions. Adv. Neural. Info Process. Syst. 2017, 30, 1–10. [Google Scholar] [CrossRef] [Green Version]
- Louppe, G.; Wehenkel, L.; Sutera, A.; Geurts, P. Understanding variable importances in Forests of randomized trees. Adv. Neural Inf. Process. Syst. 2013, 26, 431–439. [Google Scholar]
- Metsalu, T.; Vilo, J. ClustVis: A web tool for visualizing clustering of multivariate data using Principal Component Analysis and heatmap. Nucleic Acids Res. 2015, 43, W566–W570. [Google Scholar] [CrossRef]
- Lewis-Beck, C.; Lewis-Beck, M. Applied Regression: An Introduction; Sage Publications: Thousand Oaks, CA, USA, 2015. [Google Scholar]
- Drucker, H.; Surges, C.J.C.; Kaufman, L.; Smola, A.; Vapnik, V. Support vector regression machines. Adv. Neural Info Process Syst. 1997, 1, 155–161. [Google Scholar]
- Awad, M.; Khanna, R. Support vector regression. In Efficient Learning Machines; Apress; Springer: New York, NY, USA, 2015; pp. 67–80. [Google Scholar] [CrossRef] [Green Version]
- Breiman, L. Random Forests. Mach. Learn. 2001, 45, 5–32. [Google Scholar] [CrossRef] [Green Version]
- Breiman, L.; Friedman, J.H.; Olshen, R.A.; Stone, C.J. Classification and Regression Trees; Chapman & Hall/CRC Press: Boca Raton, FL, USA, 2017. [Google Scholar] [CrossRef]
- Breiman, L. Bagging predictors. Mach. Learn. 1996, 24, 123–140. [Google Scholar] [CrossRef] [Green Version]
- Chen, T.; Guestrin, C. XGBoost: A Scalable Tree Boosting System. In Proceedings of the 22nd ACM SIGKDD International Conference on Knowledge Discovery and Data Mining, San Francisco, CA, USA, 13–17 August 2016; pp. 785–794. [Google Scholar]
- Polikar, R. Ensemble based systems in decision making. IEEE Circuits Syst. Mag. 2006, 6, 21–44. [Google Scholar] [CrossRef]
- Lin, Y.; Guan, Y.; Asudeh, A.; Jagadish, H.V.; Michigan, Y.L.U.; Michigan, Y.G.U.; Illinois, A.A.U.; Michigan, H.V.J.U. Identifying insufficient data coverage in databases with multiple relations. Proc. VLDB Endow. 2020, 13, 2229–2242. [Google Scholar] [CrossRef]
- Efron, B. Estimating the error rate of a prediction rule: Improvement on cross-validation. J. Amer. Statist. Assoc. 1983, 78, 316–331. [Google Scholar] [CrossRef]
- Casagrande, E.; Génard, M.; Lurol, S.; Charles, F.; Plénet, D.; Lescourret, F. A process-based model of nectarine quality development during pre- and post-harvest. Postharvest Biol. Technol. 2021, 175, 111458. [Google Scholar] [CrossRef]
- Amodio, M.L.; Derossi, A.; Mastrandrea, L.; Colelli, G. A study of the estimated shelf life of fresh rocket using a non-linear model. J. Food Eng. 2015, 150, 19–28. [Google Scholar] [CrossRef]
- Wang, W.; Hu, W.; Ding, T.; Ye, X.; Liu, D. Shelf-life prediction of strawberry at different temperatures during storage using kinetic analysis and model development. J. Food Process. Preserv. 2018, 42, e13693. [Google Scholar] [CrossRef]
- Niu, Y.; Yun, J.; Bi, Y.; Wang, T.; Zhang, Y.; Liu, H.; Zhao, F. Predicting the shelf life of postharvest Flammulina velutipes at various temperatures based on mushroom quality and specific spoilage organisms. Postharvest Biol. Technol. 2020, 167, 111235. [Google Scholar] [CrossRef]
- Ktenioudaki, A.; O’Donnell, C.P.; do Nascimento Nunes, M.C. Modelling the biochemical and sensory changes of strawberries during storage under diverse relative humidity conditions. Postharvest Biol. Technol. 2019, 154, 148–158. [Google Scholar] [CrossRef]


Publisher’s Note: MDPI stays neutral with regard to jurisdictional claims in published maps and institutional affiliations. |
© 2022 by the authors. Licensee MDPI, Basel, Switzerland. This article is an open access article distributed under the terms and conditions of the Creative Commons Attribution (CC BY) license (https://creativecommons.org/licenses/by/4.0/).