
The Effect of Multiple Freeze–Thaw Cycles on the Microstructure and Quality of Trachurus murphyi


Abstract
1. Introduction
2. Materials and Methods
2.1. Preparation for F–T Treatment
2.2. Preparation of Myofibrillar Protein and Sample Treatment
2.3. Determination of Centrifuge Loss
2.4. Determination of Cooking Loss
2.5. Conductivity Analysis
2.6. Determination of TVB-N
2.7. Determination of K-Values
2.8. Amino Acid Composition
2.9. FAA Analysis
2.10. Fourier-Transform Infrared Spectroscopy (FT-IR)
2.11. Differential Scanning Calorimetry Measurement (DSC)
2.12. SEM Observations
2.13. Determination of Pores Using X-ray CT Scans
2.14. Statistical Analysis
3. Results
3.1. Determination of Centrifuge Loss
3.2. Determination of Cooking Loss
3.3. Conductivity Analysis
3.4. TVB-N Analysis
3.5. K-Value Determination
3.6. Amino Acid Composition
3.7. FAA Analysis
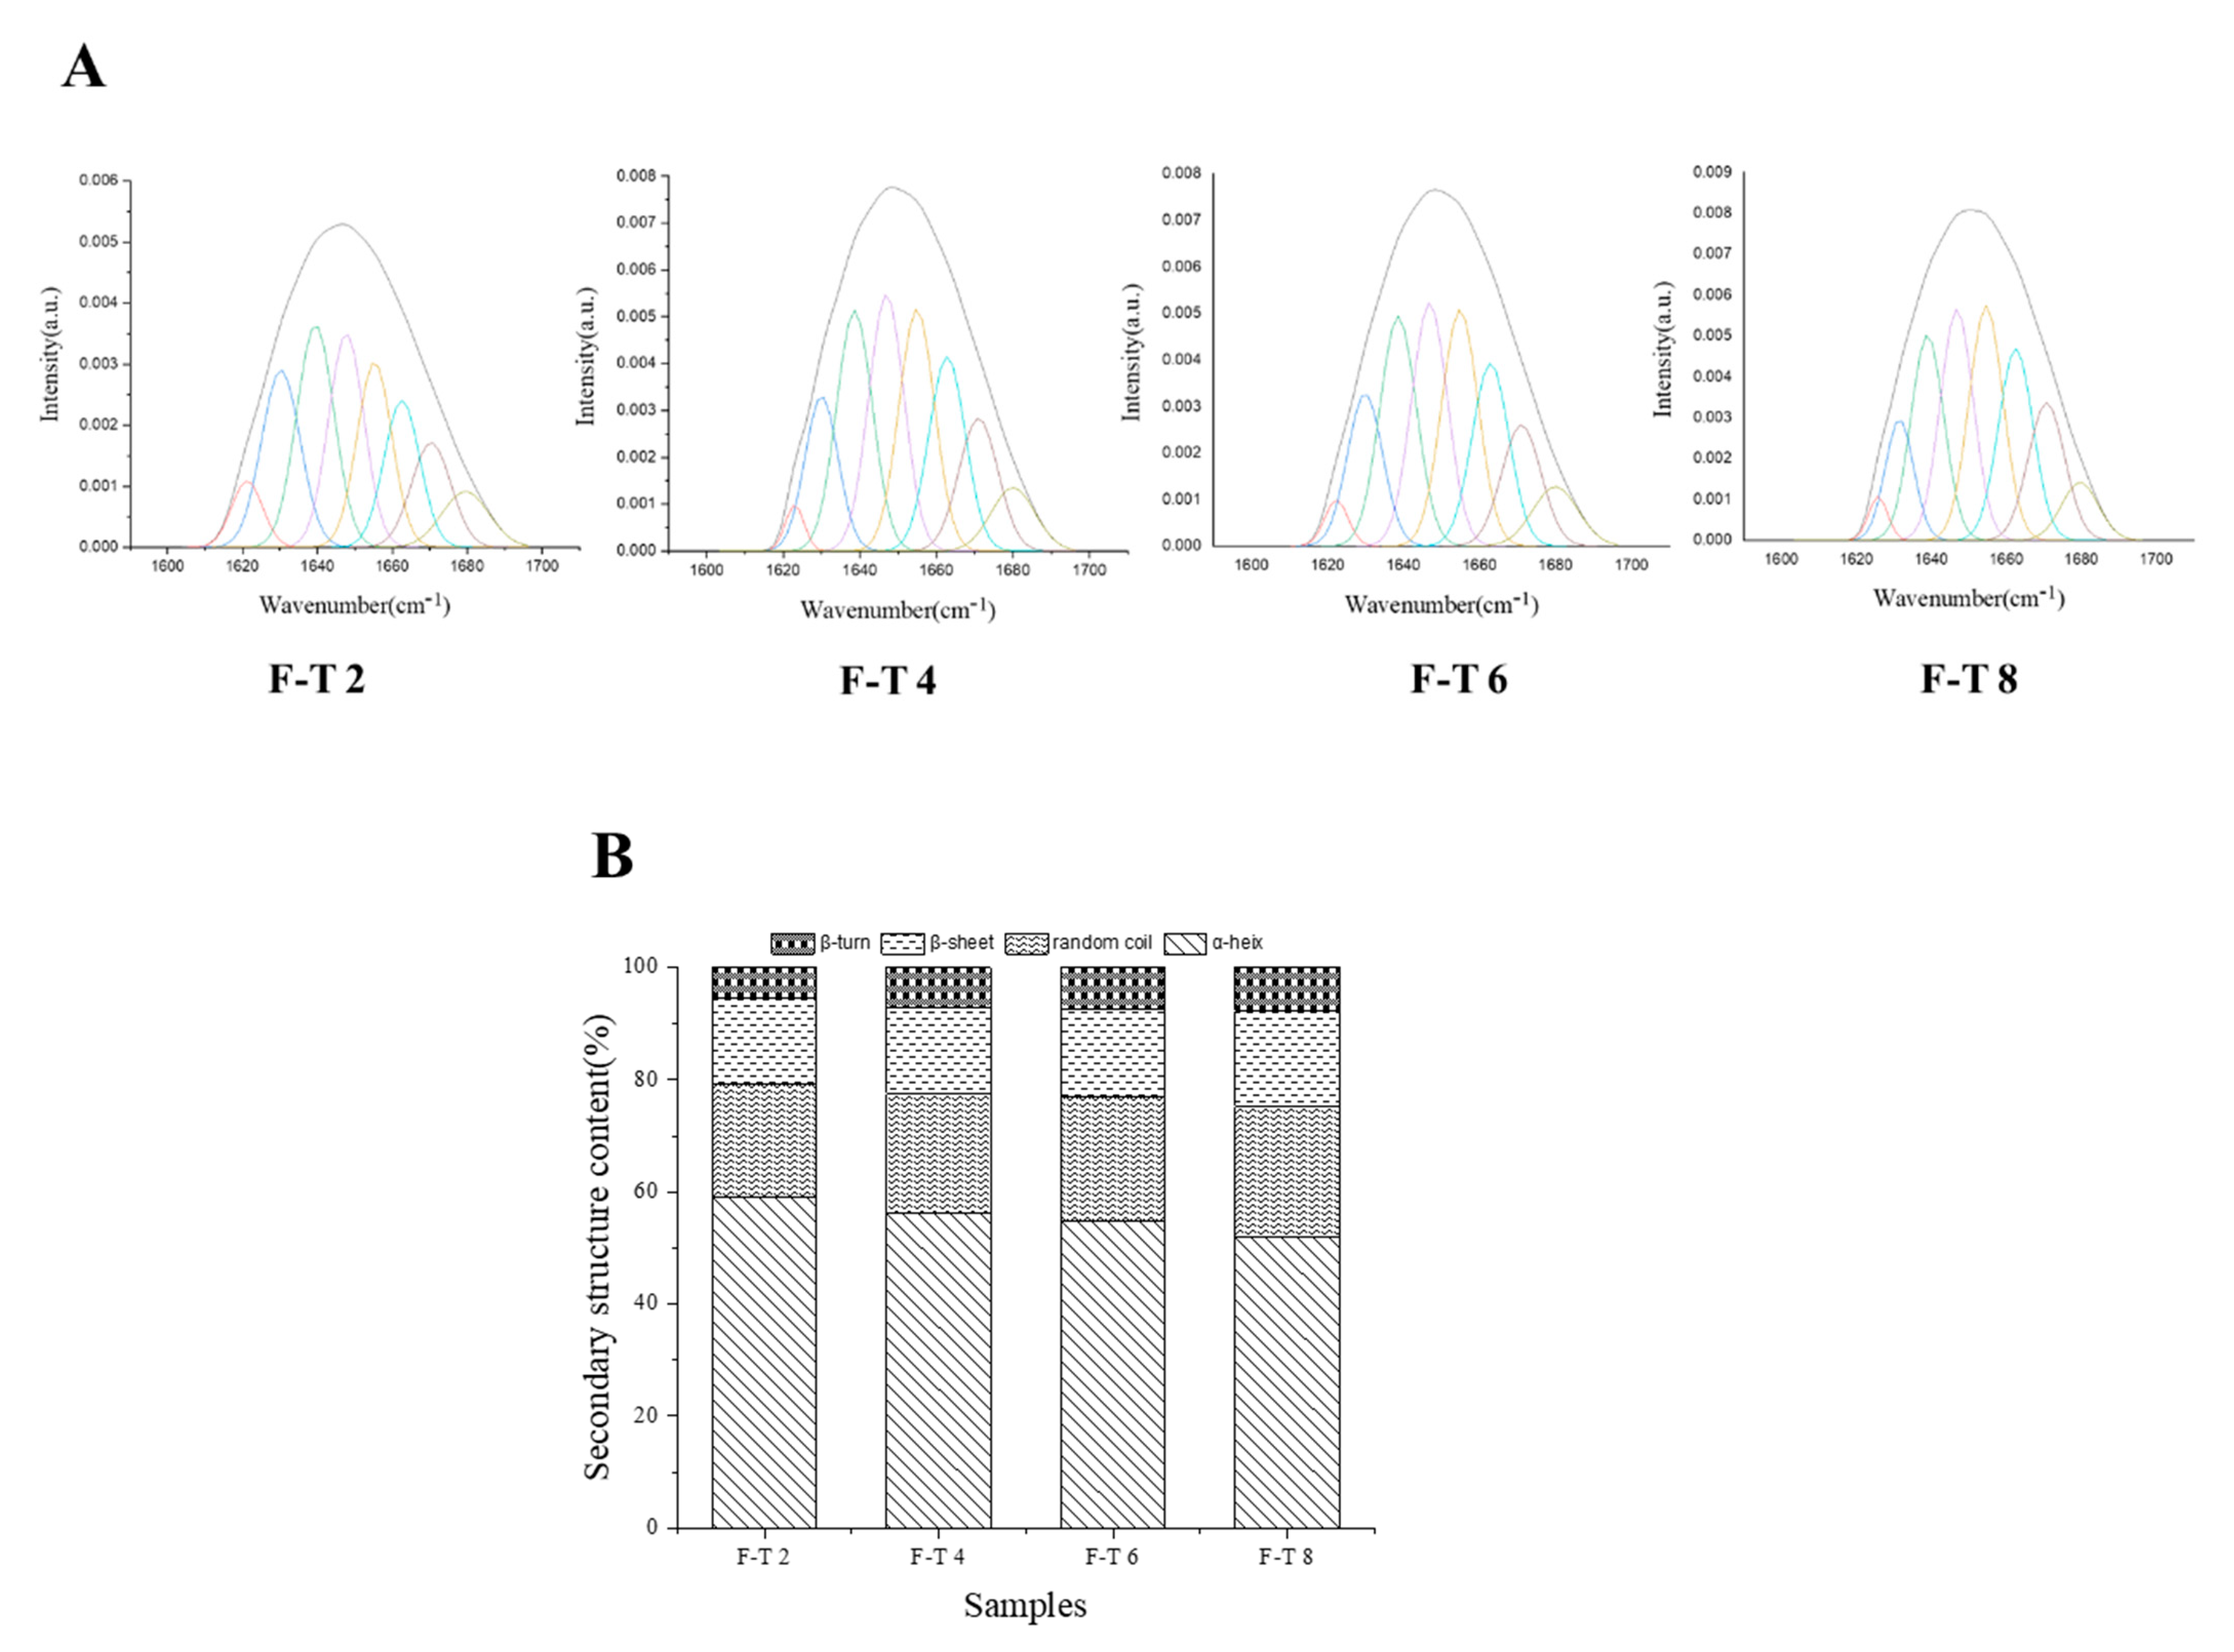
3.8. FT-IR Analysis
3.9. DSC Analysis
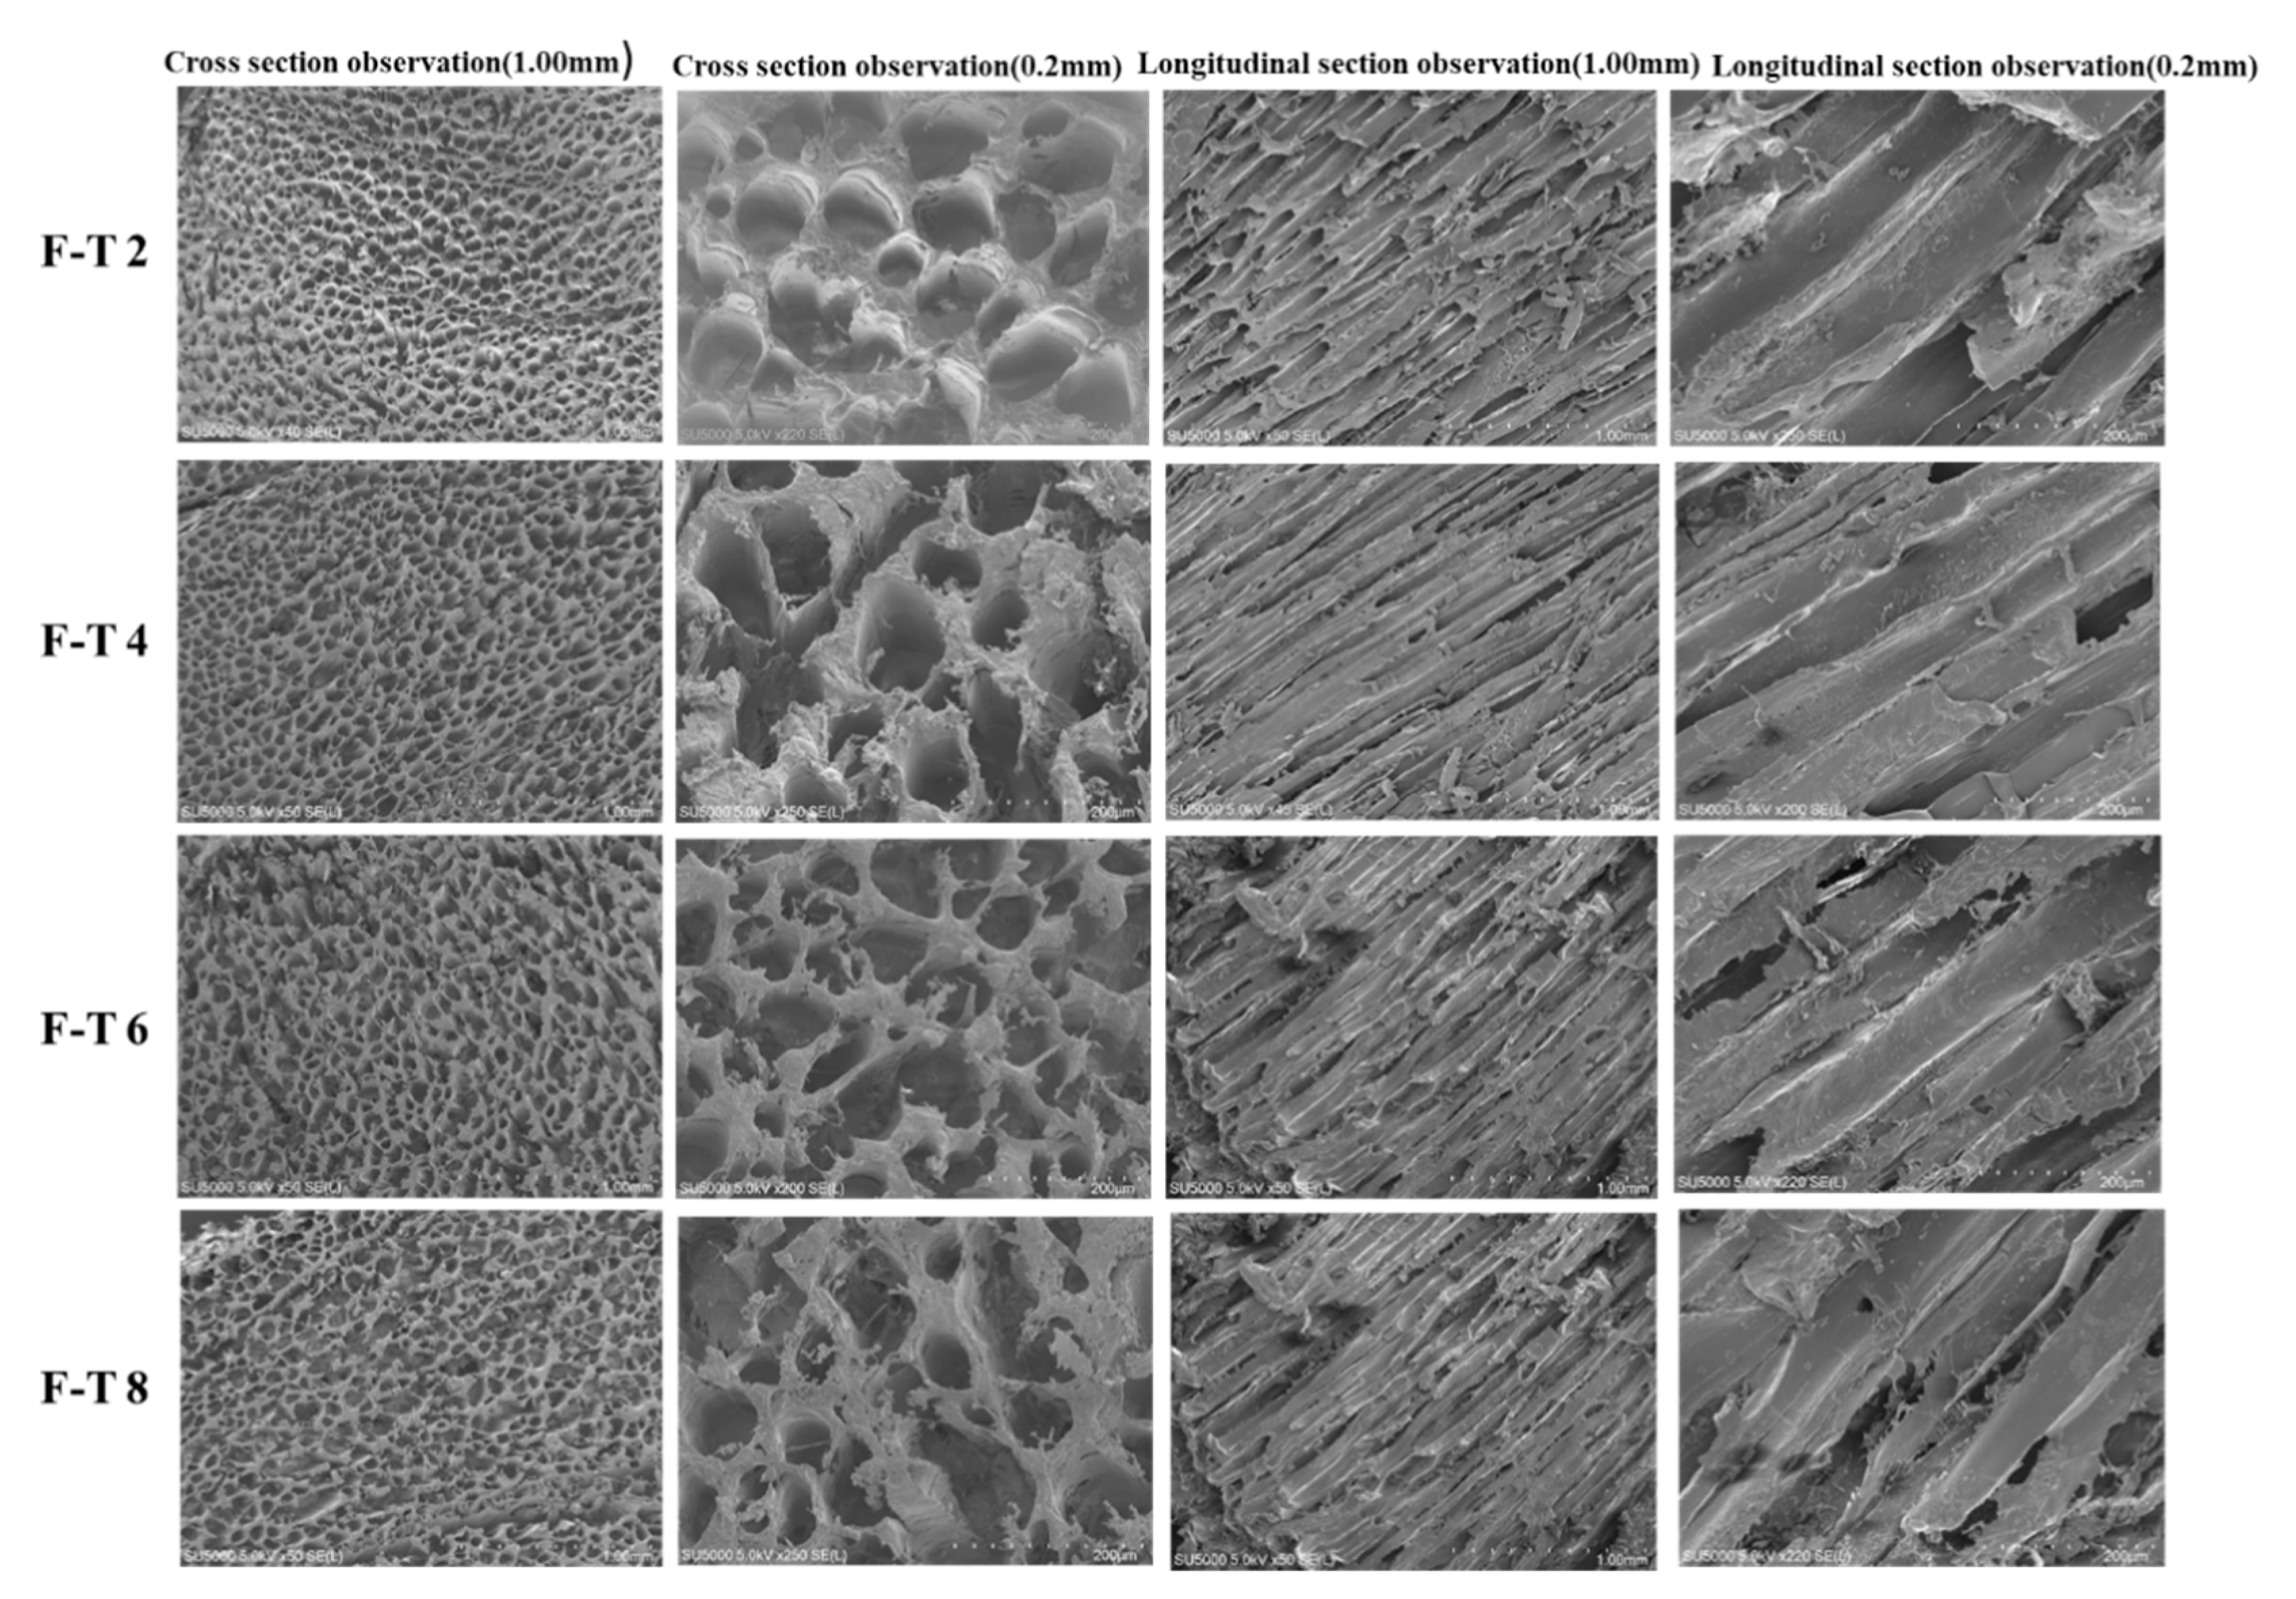
3.10. SEM Analysis
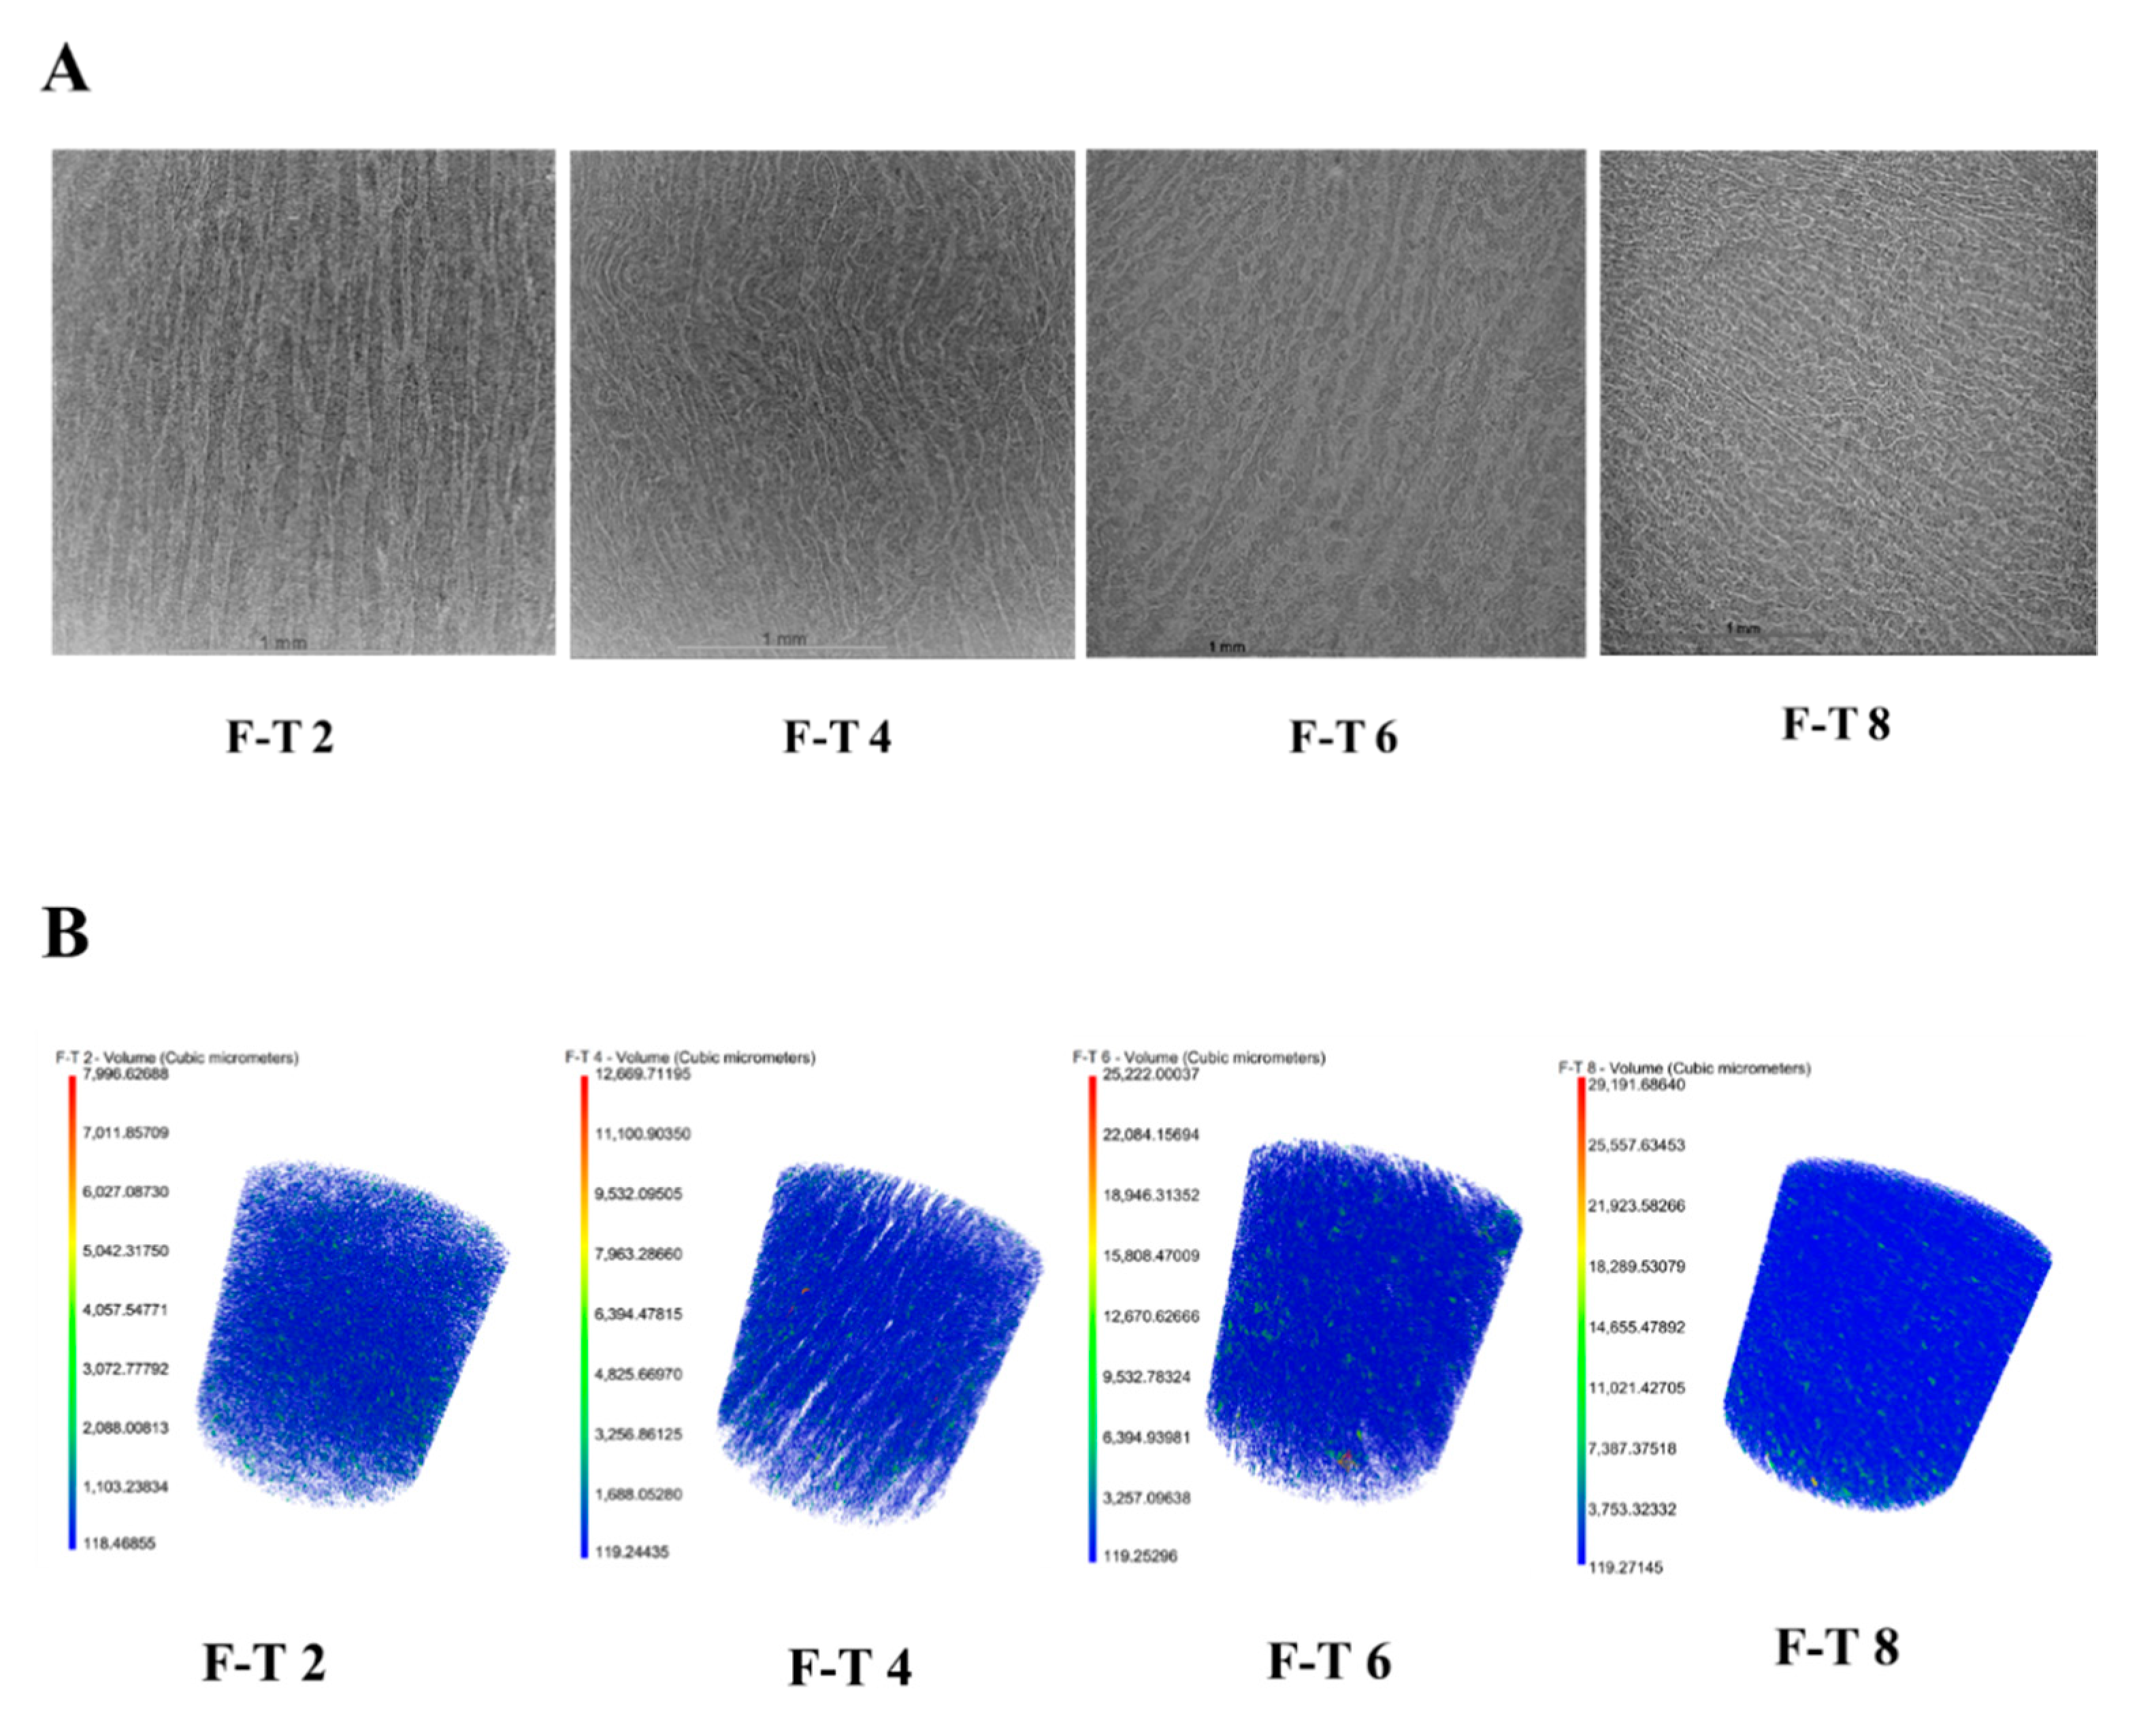
3.11. uCT Analysis
4. Conclusions
Author Contributions
Funding
Institutional Review Board Statement
Informed Consent Statement
Data Availability Statement
Conflicts of Interest
References
- Alberio, G.R.A.; Barbagallo, R.N.; Todaro, A.; Bono, G.; Spagna, G. Effect of freezing/thawing process in different sizes of blue fish in the Mediterranean through lysosomal enzymatic tests. Food Chem. 2014, 148, 47–53. [Google Scholar] [CrossRef]
- Kaewthong, P.; Pomponio, L.; Carrascal, J.R.; Knochel, S.; Wattanachant, S.; Karlsson, A.H. Changes in the Quality of Chicken Breast Meat due to Superchilling and Temperature Fluctuations during Storage. J. Poult. Sci. 2019, 56, 308–317. [Google Scholar] [CrossRef]
- Bevilacquaja, A.E.; Zaritzky, N.E. Ice Recrystallization in Frozen Beef. J. Food Sci. 1982, 47, 1410–1414. [Google Scholar] [CrossRef]
- Syamaladevi, R.M.; Manahiloh, K.N.; Muhunthan, B.; Sablani, S.S. Understanding the Influence of State/Phase Transitions on Ice Recrystallization in Atlantic Salmon (Salmo salar) during Frozen Storage. Food Biophys. 2012, 7, 57–71. [Google Scholar] [CrossRef]
- Miyazaki, K.; Wang, Y.; Miyazaki, R.; Tanaka, M.; Saito, S.; Takeshita, S.; Hirasaka, K.; Tachibana, K.; Taniyama, S. A comparison of flesh quality of freeze-thawed mantle muscle of oval squid with dorsal ordinary muscle of horse mackerel. Nippon Suisan Gakkaishi 2019, 85, 49–54. [Google Scholar] [CrossRef]
- Mulot, V.; Fatou-Toutie, N.; Benkhelifa, H.; Pathier, D.; Flick, D. Investigating the effect of freezing operating conditions on microstructure of frozen minced beef using an innovative X-ray micro-computed tomography method. J. Food Eng. 2019, 262, 13–21. [Google Scholar] [CrossRef]
- Wang, A.; Kang, D.; Zhang, W.; Zhang, C.; Zou, Y.; Zhou, G. Changes in calpain activity, protein degradation and microstructure of beef M. semitendinosus by the application of ultrasound. Food Chem. 2018, 245, 724–730. [Google Scholar] [CrossRef] [PubMed]
- Iida, Y.; Matsuoka, M.; Shimizu, I.; Wakisaka, T.; Katsumata, A. Micro-CT observation of test food materials for videofluoroscopic swallowing studies. Oral Radiol. 2013, 29, 56–63. [Google Scholar] [CrossRef]
- Mousavi, R.; Miri, T.; Cox, P.W.; Fryer, P.J. Imaging food freezing using X-ray microtomography. Int. J. Food Sci. Technol. 2007, 42, 714–727. [Google Scholar] [CrossRef]
- Park, D.; Xiong, Y.L.L.; Alderton, A.L. Concentration effects of hydroxyl radical oxidizing systems on biochemical properties of porcine muscle myofibrillar protein. Food Chem. 2007, 101, 1239–1246. [Google Scholar] [CrossRef]
- Zang, J.H.; Xu, Y.S.; Xia, W.S.; Jiang, Q.X. The impact of desmin on texture and water-holding capacity of ice-stored grass carp (Ctenopharyngodon idella) fillet. Int. J. Food Sci. Technol. 2017, 52, 464–471. [Google Scholar] [CrossRef]
- Yu, D.W.; Xu, Y.S.; Regenstein, J.M.; Xia, W.S.; Yang, F.; Jiang, Q.X.; Wang, B. The effects of edible chitosan-based coatings on flavor quality of raw grass carp (Ctenopharyngodon idellus) fillets during refrigerated storage. Food Chem. 2018, 242, 412–420. [Google Scholar] [CrossRef] [PubMed]
- Yuan, Y.; Wang, X.X.; Jin, M.; Jiao, L.F.; Sun, P.; Betancor, M.B.; Tocher, D.R.; Zhou, Q.C. Modification of nutritional values and flavor qualities of muscle of swimming crab (Portunus trituberculatus): Application of a dietary lipid nutrition strategy. Food Chem. 2020, 308, 11. [Google Scholar] [CrossRef] [PubMed]
- Ma, R.; Meng, Y.Q.; Zhang, W.B.; Mai, K.S. Comparative study on the organoleptic quality of wild and farmed large yellow croaker Larimichthys crocea. J. Oceanol. Limnol. 2020, 38, 260–274. [Google Scholar] [CrossRef]
- Zhang, C.; Sun, Q.; Chen, Q.; Kong, B.; Diao, X. Effects of ultrasound-assisted immersion freezing on the muscle quality and physicochemical properties of chicken breast. Int. J. Refrig. 2020, 117, 247–255. [Google Scholar] [CrossRef]
- Wang, Y.; Liang, H.; Xu, R.Y.; Lu, B.Y.; Song, X.Y.; Liu, B.L. Effects of temperature fluctuations on the meat quality and muscle microstructure of frozen beef. Int. J. Refrig. 2020, 116, 1–8. [Google Scholar] [CrossRef]
- Doube, M.; Klosowski, M.M.; Arganda-Carreras, I.; Cordelieres, F.P.; Dougherty, R.P.; Jackson, J.S.; Schmid, B.; Hutchinson, J.R.; Shefelbine, S.J. BoneJ: Free and extensible bone image analysis in ImageJ. Bone 2010, 47, 1076–1079. [Google Scholar] [CrossRef] [PubMed]
- Dalvi-Isfahan, M.; Hamdami, N.; Le-Bail, A. Effect of freezing under electrostatic field on the quality of lamb meat. Innov. Food Sci. Emerg. Technol. 2016, 37, 68–73. [Google Scholar] [CrossRef]
- Sun, Q.X.; Kong, B.H.; Liu, S.C.; Zheng, O.; Zhang, C. Ultrasound-assisted thawing accelerates the thawing of common carp (Cyprinus carpio) and improves its muscle quality. LWT-Food Sci. Technol. 2021, 141, 10. [Google Scholar] [CrossRef]
- Vieira, C.; Diaz, M.T.; Martinez, B.; Garcia-Cachan, M.D. Effect of frozen storage conditions (temperature and length of storage) on microbiological and sensory quality of rustic crossbred beef at different states of ageing. Meat Sci. 2009, 83, 398–404. [Google Scholar] [CrossRef]
- Wang, B.; Li, F.F.; Pan, N.; Kong, B.H.; Xia, X.F. Effect of ice structuring protein on the quality of quick-frozen patties subjected to multiple freeze-thaw cycles. Meat Sci. 2021, 172, 9. [Google Scholar] [CrossRef]
- Xie, Y.; Zhou, K.; Chen, B.; Wang, Y.; Nie, W.; Wu, S.J.; Wang, W.; Li, P.J.; Xu, B.C. Applying low voltage electrostatic field in the freezing process of beef steak reduced the loss of juiciness and textural properties. Innov. Food Sci. Emerg. Technol. 2021, 68, 8. [Google Scholar] [CrossRef]
- Li, H.H.; Chen, Q.S.; Zhao, J.W.; Wu, M.Z. Nondestructive detection of total volatile basic nitrogen (TVB-N) content in pork meat by integrating hyperspectral imaging and colorimetric sensor combined with a nonlinear data fusion. LWT-Food Sci. Technol. 2015, 63, 268–274. [Google Scholar] [CrossRef]
- Ruan, C.C.; Zhang, Y.M.; Sun, Y.; Gao, X.L.; Xiong, G.Y.; Liang, J. Effect of sodium alginate and carboxymethyl cellulose edible coating with epigallocatechin gallate on quality and shelf life of fresh pork. Int. J. Biol. Macromol. 2019, 141, 178–184. [Google Scholar] [CrossRef] [PubMed]
- Shao, Y.; Wang, L.; Chen, C.S.; Xiong, G.Q.; Hu, Y.Q.; Qiao, Y.; Wu, W.J.; Li, X.; Wang, J.; Liao, L.; et al. Antioxidant capacity of fermented soybeans and their protective effect on protein oxidation in largemouth bass (Micropterus salmoides) during repeated freezing-thawing (FT) treatments. LWT-Food Sci. Technol. 2018, 91, 213–221. [Google Scholar] [CrossRef]
- Prabhakar, P.K.; Vatsa, S.; Srivastav, P.P.; Pathak, S.S. A comprehensive review on freshness of fish and assessment: Analytical methods and recent innovations. Food Res. Int. 2020, 133, 17. [Google Scholar] [CrossRef] [PubMed]
- Chang, W.C.W.; Wu, H.Y.; Yeh, Y.; Liao, P.C. Untargeted foodomics strategy using high-resolution mass spectrometry reveals potential indicators for fish freshness. Anal. Chim. Acta 2020, 1127, 98–105. [Google Scholar] [CrossRef]
- Alasalvar, C.; Taylor, K.D.A.; Oksuz, A.; Shahidi, F.; Alexis, M. Comparison of freshness quality of cultured and wild sea bass (Dicentrarchus labrax). J. Food Sci. 2002, 67, 3220–3226. [Google Scholar] [CrossRef]
- Cai, L.; Tong, F.; Tang, T.; Ao, Z.; Wei, Z.; Yang, F.; Shu, Y.; Liu, S.; Mai, K. Comparative evaluation of nutritional value and flavor quality of muscle in triploid and diploid common carp: Application of genetic improvement in fish quality. Aquaculture 2021, 541. [Google Scholar] [CrossRef]
- Zhao, F.; Zhuang, P.; Song, C.; Shi, Z.H.; Zhang, L.Z. Amino acid and fatty acid compositions and nutritional quality of muscle in the pomfret, Pampus punctatissimus. Food Chem. 2010, 118, 224–227. [Google Scholar] [CrossRef]
- Unnikrishnan, U.; Paulraj, R. Dietary protein requirement of giant mud crab Scylla serrata juveniles fed iso-energetic formulated diets having graded protein levels. Aquac. Res. 2010, 41, 278–294. [Google Scholar] [CrossRef]
- Gomez-Limia, L.; Franco, I.; Martinez-Suarez, S. Effects of processing step, filling medium and storage on amino acid profiles and protein quality in canned European eels. J. Food Compos. Anal. 2021, 96, 8. [Google Scholar] [CrossRef]
- Sikorski, Z.E. Chemical & Functional Properties of Food Proteins; CRC Press: Boca Raton, FL, USA, 2001; pp. 485–490. [Google Scholar]
- Berardo, A.; Claeys, E.; Vossen, E.; Leroy, F.; De Smet, S. Protein oxidation affects proteolysis in a meat model system. Meat Sci. 2015, 106, 78–84. [Google Scholar] [CrossRef] [PubMed]
- Shi, C.; Cui, J.Y.; Qin, N.; Luo, Y.K.; Lu, H.; Wang, H. Effect of ginger extract and vinegar on ATP metabolites, IMP-related enzyme activity, reducing sugars and phosphorylated sugars in silver carp during postslaughter storage. Int. J. Food Sci. Technol. 2017, 52, 413–423. [Google Scholar] [CrossRef]
- Guyon, C.; Le Vessel, V.; Meynier, A.; de Lamballerie, M. Modifications of protein-related compounds of beef minced meat treated by high pressure. Meat Sci. 2018, 142, 32–37. [Google Scholar] [CrossRef]
- Sow, L.C.; Toh, N.Z.Y.; Wong, C.W.; Yang, H.S. Combination of sodium alginate with tilapia fish gelatin for improved texture properties and nanostructure modification. Food Hydrocoll. 2019, 94, 459–467. [Google Scholar] [CrossRef]
- Xia, M.Q.; Chen, Y.X.; Guo, J.J.; Feng, X.L.; Yin, X.L.; Wang, L.; Wu, W.J.; Li, Z.S.; Sun, W.Q.; Ma, J. Effects of oxidative modification on textural properties and gel structure of pork myofibrillar proteins. Food Res. Int. 2019, 121, 678–683. [Google Scholar] [CrossRef]
- Sun, Q.X.; Sun, F.D.; Xia, X.F.; Xu, H.H.; Kong, B.H. The comparison of ultrasound-assisted immersion freezing, air freezing and immersion freezing on the muscle quality and physicochemical properties of common carp (Cyprinus carpio) during freezing storage. Ultrason. Sonochem. 2019, 51, 281–291. [Google Scholar] [CrossRef]
- Korzeniowska, M.; Cheung, I.W.Y.; Li-Chan, E.C.Y. Effects of fish protein hydrolysate and freeze-thaw treatment on physicochemical and gel properties of natural actomyosin from Pacific cod. Food Chem. 2013, 138, 1967–1975. [Google Scholar] [CrossRef] [PubMed]
- Cai, L.; Cao, M.; Cao, A.; Regenstein, J.; Li, J.; Guan, R. Ultrasound or microwave vacuum thawing of red seabream (Pagrus major) fillets. Ultrason Sonochem 2018, 47, 122–132. [Google Scholar] [CrossRef] [PubMed]
- Lan, W.; Hu, X.; Sun, X.; Zhang, X.; Xie, J. Effect of the number of freeze-thaw cycles number on the quality of Pacific white shrimp (Litopenaeus vannamei): An emphasis on moisture migration and microstructure by LF-NMR and SEM. Aquac. Fish. 2020, 5, 193–200. [Google Scholar] [CrossRef]
- Wang, Y.Y.; Tayyab Rashid, M.; Yan, J.K.; Ma, H. Effect of multi-frequency ultrasound thawing on the structure and rheological properties of myofibrillar proteins from small yellow croaker. Ultrason Sonochem 2021, 70, 105352. [Google Scholar] [CrossRef]
- Nugraha, B.; Verboven, P.; Janssen, S.; Hertog, M.L.A.T.M.; Boone, M.; Josipovic, I.; Nicolaï, B.M. Oxygen diffusivity mapping of fruit and vegetables based on X-ray CT. J. Food Eng. 2021, 306. [Google Scholar] [CrossRef]
- Chigwaya, K.; Karuppanapandian, T.; Schoeman, L.; Viljoen, D.W.; Crouch, I.J.; Nugraha, B.; Verboven, P.; Nicolaï, B.M.; Crouch, E.M. X-ray CT and porosity mapping to determine the effect of ‘Fuji’ apple morphological and microstructural properties on the incidence of CO2 induced internal browning. Postharvest Biol. Technol. 2021, 174. [Google Scholar] [CrossRef]
- Singh, N.; Kumar, S.; Udawatta, R.P.; Anderson, S.H.; de Jonge, L.W.; Katuwal, S. X-ray micro-computed tomography characterized soil pore network as influenced by long-term application of manure and fertilizer. Geoderma 2021, 385. [Google Scholar] [CrossRef]


| Sample | Centrifuge Loss/% | Cooking Loss/% | Conductivity/Ms/cm | TVB-N/mg N/100 g |
|---|---|---|---|---|
| F–T 2 | 22.40 ± 1.06 d | 22.32 ± 0.51 c | 15.28 ± 0.95 a | 16.32 ± 0.75 d |
| F–T 4 | 23.48 ± 1.02 c | 23.46 ± 0.74 b | 15.37 ± 0.14 a | 18.2 ± 0.15 c |
| F–T 6 | 24.33 ± 0.86 b | 24.83 ± 1.54 b | 15.50 ± 0.07 a | 19.47 ± 0.67 b |
| F–T 8 | 25.69 ± 0.85 a | 25.19 ± 1.00 a | 15.70 ± 0.41 a | 19.94 ± 0.31 a |
| Amino Acids | Sample | |||
|---|---|---|---|---|
| F–T 2 | F–T 4 | F–T 6 | F–T 8 | |
| Asp | 201.51 ± 5.98 d | 214.24 ± 6.42 a | 213.50 ± 9.39 bc | 184.95 ± 5.19 e |
| Thr | 87.15 ± 2.77 c | 94.62 ± 2.85 a | 91.58 ± 4.26 b | 81.33 ± 2.19 d |
| Ser | 83.94 ± 4.82 b | 86.96 ± 2.42 a | 85.52 ± 5.06 b | 76.75 ± 3.14 c |
| Glu | 280.17 ± 12.49 c | 297.81 ± 8.83 a | 294.43 ± 15.21 b | 253.11 ± 7.73 d |
| Gly | 94.22 ± 2.89 c | 94.85 ± 2.89 a | 104.64 ± 4.57 b | 104.22 ± 2.63 d |
| Ala | 125.32 ± 3.98 b | 129.22 ± 3.85 a | 133.43 ± 6.05 b | 120.87 ± 4.42 c |
| Cys | 11.84 ± 0.41 c | 17.57 ± 0.79 a | 15.12 ± 0.92 b | 10.50 ± 0.62 d |
| Val | 69.69 ± 1.39 c | 80.48 ± 2.56 a | 72.94 ± 3.13 b | 65.59 ± 1.11 d |
| Met | 64.11 ± 1.53 c | 69.03 ± 2.18 a | 67.72 ± 2.81 b | 59.96 ± 1.09 d |
| Ile | 58.79 ± 1.41 c | 69.72 ± 2.34 a | 61.92 ± 2.54 b | 55.83 ± 1.44 d |
| Leu | 150.65 ± 3.94 c | 163.91 ± 5.28 a | 159.71 ± 6.58 b | 140.05 ± 3.28 d |
| Tyr | 70.19 ± 1.32 c | 76.97 ± 2.68 a | 74.95 ± 2.95 b | 65.62 ± 1.26 d |
| Phe | 81.52 ± 1.88 c | 86.71 ± 3.17 a | 86.22 ± 3.30 b | 76.51 ± 1.69 d |
| Lys | 172.55 ± 2.99 c | 191.77 ± 6.27 a | 185.49 ± 7.57 b | 162.19 ± 3.89 d |
| His | 78.88 ± 2.57 c | 94.12 ± 3.45 a | 92.35 ± 3.35 b | 77.01 ± 1.91 d |
| Arg | 110.26 ± 2.51 c | 118.08 ± 3.46 a | 116.93 ± 5.22 b | 106.33 ± 2.29 d |
| FAAs | Sample | |||
|---|---|---|---|---|
| F–T 2 | F–T 4 | F–T 6 | F–T 8 | |
| Asp | 10.39 ± 0.25 d | 13.73 ± 0.35 c | 16.36 ± 0.34 b | 30.20 ± 2.07 a |
| Thr | 274.53 ± 10.07 e | 176.65 ± 9.92 d | 157.24 ± 22.86 bc | 296.4 ± 13.71 a |
| Ser | 134.53 ± 4.45 d | 149.38 ± 13.82 c | 149.9 ± 13.62 b | 226.77 ± 3.98 a |
| Glu | 577.70 ± 61.78 c | 530.06 ± 21.59 d | 612.19 ± 67.42 b | 743.68 ± 16.47 a |
| Gly | 201.31 ± 20.43 d | 216.13 ± 16.60 c | 281.08 ± 9.87 b | 292.55 ± 9.73 a |
| Ala | 383.85 ± 19.29 d | 446.49 ± 11.54 c | 499.73 ± 12.92 b | 522.67 ± 34.77 a |
| Val | 336.27 ± 33.93 d | 281.10 ± 1.89 c | 307.64 ± 8.57 b | 425.05 ± 14.86 a |
| Met | 141.40 ± 8.93 d | 144.94 ± 7.32 c | 171.70 ± 15.05 b | 239.38 ± 17.97 a |
| Ile | 95.51 ± 7.68 c | 72.11 ± 13.03 d | 121.52 ± 4.18 b | 151.53 ± 12.07 a |
| Leu | 160.24 ± 8.73 c | 140.46 ± 12.52 d | 303.34 ± 10.99 b | 352.98 ± 7.90 a |
| Tyr | 112.06 ± 8.80 c | 106.51 ± 9.92 d | 137.39 ± 11.00 b | 281.46 ± 11.67 a |
| Phe | 157.91 ± 15.77 c | 149.52 ± 14.00 d | 719.27 ± 10.87 b | 846.54 ± 32.31 a |
| Lys | 647.97 ± 12.98 c | 579.72 ± 14.22 d | 972.78 ± 34.61 b | 1093.79 ± 16.83 a |
| His | 7194.97 ± 103.42 c | 6240.25 ± 293.92 d | 9199.40 ± 132.47 a | 7987.21 ± 225.89 b |
| Arg | 75.36 ± 10.89 d | 110.50 ± 13.33 c | 137.58 ± 14.46 b | 156.79 ± 8.48 a |
Publisher’s Note: MDPI stays neutral with regard to jurisdictional claims in published maps and institutional affiliations. |
© 2021 by the authors. Licensee MDPI, Basel, Switzerland. This article is an open access article distributed under the terms and conditions of the Creative Commons Attribution (CC BY) license (https://creativecommons.org/licenses/by/4.0/).
Share and Cite
Hu, C.; Xie, J. The Effect of Multiple Freeze–Thaw Cycles on the Microstructure and Quality of Trachurus murphyi. Foods 2021, 10, 1350. https://doi.org/10.3390/foods10061350
Hu C, Xie J. The Effect of Multiple Freeze–Thaw Cycles on the Microstructure and Quality of Trachurus murphyi. Foods. 2021; 10(6):1350. https://doi.org/10.3390/foods10061350
Chicago/Turabian StyleHu, Chunlin, and Jing Xie. 2021. "The Effect of Multiple Freeze–Thaw Cycles on the Microstructure and Quality of Trachurus murphyi" Foods 10, no. 6: 1350. https://doi.org/10.3390/foods10061350
APA StyleHu, C., & Xie, J. (2021). The Effect of Multiple Freeze–Thaw Cycles on the Microstructure and Quality of Trachurus murphyi. Foods, 10(6), 1350. https://doi.org/10.3390/foods10061350