
Whey Protein Powder Analysis by Mid-Infrared Spectroscopy


Abstract
1. Introduction
2. Infrared (IR) Spectroscopy
3. Materials and Methods
3.1. Equipment
3.2. Materials, Samples and Standards
3.3. Reagents for the Kjeldahl Method
3.4. Protein Powder Analysis
3.4.1. Digestion
3.4.2. Distillation
3.4.3. Titration
3.5. Ammonium Sulfate Chemical Check
4. Results
4.1. Kjeldahl Method Data
4.1.1. Protein Powder Results
4.1.2. Protein Spiking Results
4.2. Mid-Infrared (MIR) Spectroscopy Data
4.2.1. Protein Powder Results
4.2.2. Protein Spiking Results
4.2.3. Amino Acid Spiking Results
5. Discussion
6. Conclusions
Supplementary Materials
Author Contributions
Funding
Data Availability Statement
Acknowledgments
Conflicts of Interest
References
- Alberts, B.; Bray, D.; Hopkin, K.; Johnson, A.; Lewis, J.; Raff, M.; Roberts, K.; Walter, P. Essential Cell Biology: Protein Structure and Function, 3rd ed; Garland Science: New York, NY, USA, 2010; pp. 119–168. [Google Scholar]
- Edwards, P.B.; Creamer, L.K.; Jameson, G.B. Milk Proteins: From Expression to Food: Structure and Stability of Whey Proteins; Thompson, A., Boland, M., Singh, H., Eds.; Massey University: Auckland, New Zealand; Elsevier Inc.: Amsterdam, The Netherlands, 2009; pp. 163–203. [Google Scholar]
- Otter, D. Encyclopedia of Food Sciences and Nutrition: MILK|Physical and Chemical Properties, 2nd ed.; Elsevier Science Ltd.: Amsterdam, The Netherlands, 2003; pp. 3957–3963. [Google Scholar]
- Torkova, A.A.; Ryazantseva, K.A.; Agarkova, E.Y.; Kruchinin, A.G.; Tsentalovich, M.Y.; Fedorova, T.V. Rational design of enzyme compositions for the production of functional hydrolysates of cow milk whey proteins. Appl. Biochem. Microbiol. 2017, 53, 669–679. [Google Scholar] [CrossRef]
- Rao, E.; Foderà, V.; Leone, M.; Vetri, V. Direct observation of alpha-lactalbumin, adsorption and incorporation into lipid membrane and formation of lipid/protein hybrid structures. Biochim. Biophys. Acta (BBA) Gen. Subj. 2019, 1863, 784–794. [Google Scholar] [CrossRef] [PubMed]
- Ramos, O.L.; Pereira, R.N.; Rodrigues, R.M.; Teixeira, J.A.; Vicente, A.; Malcata, F. The Encyclopedia of Food and Health: Whey and Whey Powders: Production and Uses; Caballero, B., Finglas, P., Toldrá, F., Eds.; Academic Press: Oxford, UK, 2016; Volume 5, pp. 498–505. [Google Scholar]
- Fee, C.J.; Billakanti, J.M.; Sauf, S.M. Separation, Extraction and Concentration Processes in the Food, Beverage and Nutraceutical Industries: Methods for Purification of Dairy Nutraceuticals; Rizvi, S.S.H., Ed.; Elsevier Science & Technology: Amsterdam, The Netherlands, 2010; pp. 450–482. [Google Scholar]
- Butler, J.E. Bovine immunoglobulins: A Review. J. Dairy Sci. 1969, 52, 1895–1909. [Google Scholar] [CrossRef]
- Gapper, L.W.; Copestake, D.E.J.; Otter, D.E.; Indyk, H.E. Analysis of bovine immunoglobulin G in milk, colostrum and dietary supplements: A review. Anal. Bioanal. Chem. 2007, 389, 93–109. [Google Scholar] [CrossRef] [PubMed]
- Schroeder, H.W., Jr.; Imboden, J.B.; Torres, R.M. Antigen receptor genes, gene products, and co-receptors. Clin. Immunol. Principles Pract. 2013, 2013, 47–67. [Google Scholar]
- Nitrogen Spiking: Is Your Protein Powder Giving You What You Paid for? Available online: https://boxlifemagazine.com/nitrogen-spiking-is-you-protein-powder-giving-you-what-you-paid-for/ (accessed on 24 November 2020).
- Pei, X.; Tandon, A.; Alldrick, A.; Giorgi, L.; Huang, W.; Yang, R. The China melamine milk scandal and its implications for food safety regulation. Food Policy 2011, 36, 412–420. [Google Scholar] [CrossRef]
- World Health Organization. Melamine and Cyanuric Acid: Toxicity, Preliminary Risk Assessment and Guidance on Levels in Food; World Health Organization: Geneva, Switzerland, 2008. [Google Scholar]
- Wojciechowski, K.L.; Barbano, D.M. Modification of the Kjeldahl noncasein nitrogen method to include bovine milk concentrates and milks from other species. J. Dairy Sci. 2015, 98, 7510–7526. [Google Scholar] [CrossRef] [PubMed]
- Rowland, S.J. 176. The Determination of the nitrogen distribution in milk. J. Dairy Res. 1938, 9, 42–46. [Google Scholar] [CrossRef]
- Official Method 930.29. In Official Methods of Analysis of AOAC INTERNATIONAL (2007), 18th ed.; AOAC International: Gaithersburg, MD, USA, 2007.
- Official Method 991.20. In Official Methods of Analysis of AOAC INTERNATIONAL (2007), 18th ed.; AOAC International: Gaithersburg, MD, USA, 2007.
- Official Method 991.21. In Official Methods of Analysis of AOAC INTERNATIONAL (2007), 18th ed.; AOAC International: Gaithersburg, MD, USA, 2007.
- Official Method 998.05. In Official Methods of Analysis of AOAC INTERNATIONAL (2007), 18th ed.; AOAC International: Gaithersburg, MD, USA, 2007.
- Rowland, S.J. 147. The soluble protein fraction of milk. J. Dairy Res. 1937, 8, 6. [Google Scholar] [CrossRef]
- Laporte, M.-F.; Paquin, P. Near-Infrared Analysis of Fat, Protein, and Casein in Cow’s Milk. J. Agric. Food Chem. 1999, 47, 2600–2605. [Google Scholar] [CrossRef]
- Andrade, J.; Pereira, C.G.; Ranquine, T.; Azarias, C.A.; Bell, M.J.V.; de Carvalho dos Anjos, V. Long-Term Ripen-ing Evaluation of Ewes’ Cheeses by Fourier-Transformed Infrared Spectroscopy under Real Industrial Conditions. J. Spectrosc. 2018, 2018, 1–9. [Google Scholar] [CrossRef]
- Garrido, B.C.; Souza, G.H.M.F.; Lourenco, D.C.; Fasciotti, M. Proteomics in quality control: Whey protein-based supple-ments. J. Proteom. 2016, 147, 48–55. [Google Scholar] [CrossRef]
- Almeida, C.C.; Álvares, T.S.; Costa, M.P.; Conte-Junior, C.A. Protein and Amino Acid Profiles of Different Whey Protein Supplements. J. Diet. Suppl. 2015, 13, 313–323. [Google Scholar] [CrossRef]
- Sturaro, A.; De Marchi, M.; Masi, A.; Cassandro, M. Quantification of whey proteins by reversed phase-HPLC and effectiveness of mid-infrared spectroscopy for their rapid prediction in sweet whey. J. Dairy Sci. 2014, 99, 68–76. [Google Scholar] [CrossRef]
- Vincent, D.; Elkins, A.; Condina, M.R.; Ezernieks, V.; Rochfort, S. Quantitation and Identification of Intact Major Milk Proteins for High-Throughput LC-ESI-Q-TOF MS Analyses. PLoS ONE 2016, 11, e0163471. [Google Scholar] [CrossRef]
- Da Rocha, R.A.; Paiva, I.M.; Anjos, V.; Furtado, M.A.M.; Bell, M.J.V. Quantification of whey in fluid milk using confocal Raman microscopy and artificial neural network. J. Dairy Sci. 2015, 98, 3559–3567. [Google Scholar] [CrossRef]
- Lynch, J.M.; Barbano, D.M. Kjeldahl Nitrogen Analysis as a Reference Method for Protein Determination in Dairy Prod-ucts. J. AOAC Int. 1999, 82, 1389–1401. [Google Scholar] [CrossRef]
- Sáez-Plaza, P.; Michałowski, T.; Navas, M.J.; Asuero, A.G.; Wybraniec, S. An Overview of the Kjeldahl Method of Nitrogen Determination. Part I. Early History, Chemistry of the Procedure, and Titrimetric Finish. Crit. Rev. Anal. Chem. 2013, 43, 178–223. [Google Scholar] [CrossRef]
- Gallagher, W. FTIR Analysis of Protein Structure. Available online: http://www.chem.uwec.edu/Chem455_S05/Pages/Manuals/FTIR_of_proteins.pdf (accessed on 23 November 2020).
- Krimm, S.; Bandekar, J. Advances in Protein Chemistry: Vibrational Spectroscopy and Conformation of Peptide, Poly-Peptides, and Proteins; Anfinsen, C.B., Edsall, J.T., Richards, F.M., Eds.; Academic Press, Inc.: Cambridge, MA, USA, 1986; Volume 38, pp. 181–364. [Google Scholar]
- Venyaminov, S.Y.; Kalnin, N.N. Quantitative IR Spectrophotomerty of Peptide Compounds in Water (H2O) Solutions. I. Spectral Parameters of Amino Acid Residue Absorption Bands. Biopolymers 1990, 30, 1243–1257. [Google Scholar] [CrossRef]
- Rubinovitz, R. Food Protein Powders Classification and Discrimination by FTIR Spectroscopy and Principal Component Analysis. Thermo Fisher Scientific Application Note AN53037. Available online: https://www.tecnofrom.com/moduloNotas/noti_66/archivosAdjuntos/Analysis-of-food-proteins-r18-08-17_1_544.pdf (accessed on 6 May 2021).
- Kaya-Celiker, H.; Mallikarjunan, P.K.; Kaaya, A. Mid-infrared spectroscopy for discrimination and classification of As-pergillus spp. contamination in peanuts. Food Control 2015, 52, 103–111. [Google Scholar] [CrossRef]
- Grube, M.; Bekers, M.; Upite, D.; Kaminska, E. Infrared spectra of some fructans. Spectroscopy 2002, 16, 289–296. [Google Scholar] [CrossRef]
- Jenkins, A.L.; Larsen, R.A.; Williams, T.B. Characterization of amino acids using Raman spectroscopy. Spectrochim. Acta Part A Mol. Biomol. Spectrosc. 2005, 61, 1585–1594. [Google Scholar] [CrossRef] [PubMed]
- Jones, M., Jr.; Fleming, S.A. Organic Chemistry: Amino Acids and Polyamino Acids (Peptides and Proteins), 4th ed.; Fahlgren, E., Ed.; W.W. Norton & Compay, Inc.: New York, NY, USA, 2010; pp. 1173–1220. [Google Scholar]
- Kong, J.; Yu, S. Fourier Transform Infrared Spectroscopic Analysis of Protein Secondary Structures. Acta Biochim. Biophys. Sin. 2007, 39, 549–559. [Google Scholar] [CrossRef] [PubMed]
- Rahmelow, K.; Hübner, W.; Ackermann, T. Infrared Absorbances of Protein Side Chains. Anal. Biochem. 1998, 257, 1–11. [Google Scholar] [CrossRef]
- RStudio Team. RStudio: Integrated Development for R; RStudio, Inc.: Boston, MA, USA, 2019; Available online: http://www.rstudio.com/ (accessed on 6 May 2021).
- Thiex, N.J.; Manson, H.; Anderson, S.; Persson, J. Determination of Crude Protein in Animal Feed, Forage, Grain, and Oilseeds by Using Block Digestion with a Copper Catalyst and Steam Distillation into Boric Acid: Collaborative Study. J. AOAC Int. 2002, 85, 309–317. [Google Scholar] [CrossRef]
- Panreac Applichem Application Note. Nitrogen Determination by Kjeldahl Method, ITW Reagents Application Note: A173_EN. Available online: https://www.itwreagents.com/uploads/20180114/A173_EN.pdf (accessed on 8 January 2021).
- Goulding, D.A. Milk Proteins: From Expression to Food: Milk Proteins: An Overview, 3rd ed.; Elsevier: Amsterdam, The Netherlands, 2020; pp. 21–98. [Google Scholar]
- Persson, J.-Å.; Wennerholm, M.; O’Halloran, S. Handbook of Kjeldahl Digestion, 4th ed.; C.A. Andersson: Malmoe, Sweden, 2008; ISBN 91-630-3471-9. [Google Scholar]

 = ISO100 protein powder,
  = JYM protein powder,
  = NitroTech protein powder,
  = Signature protein powder and
  = Vega protein powder.
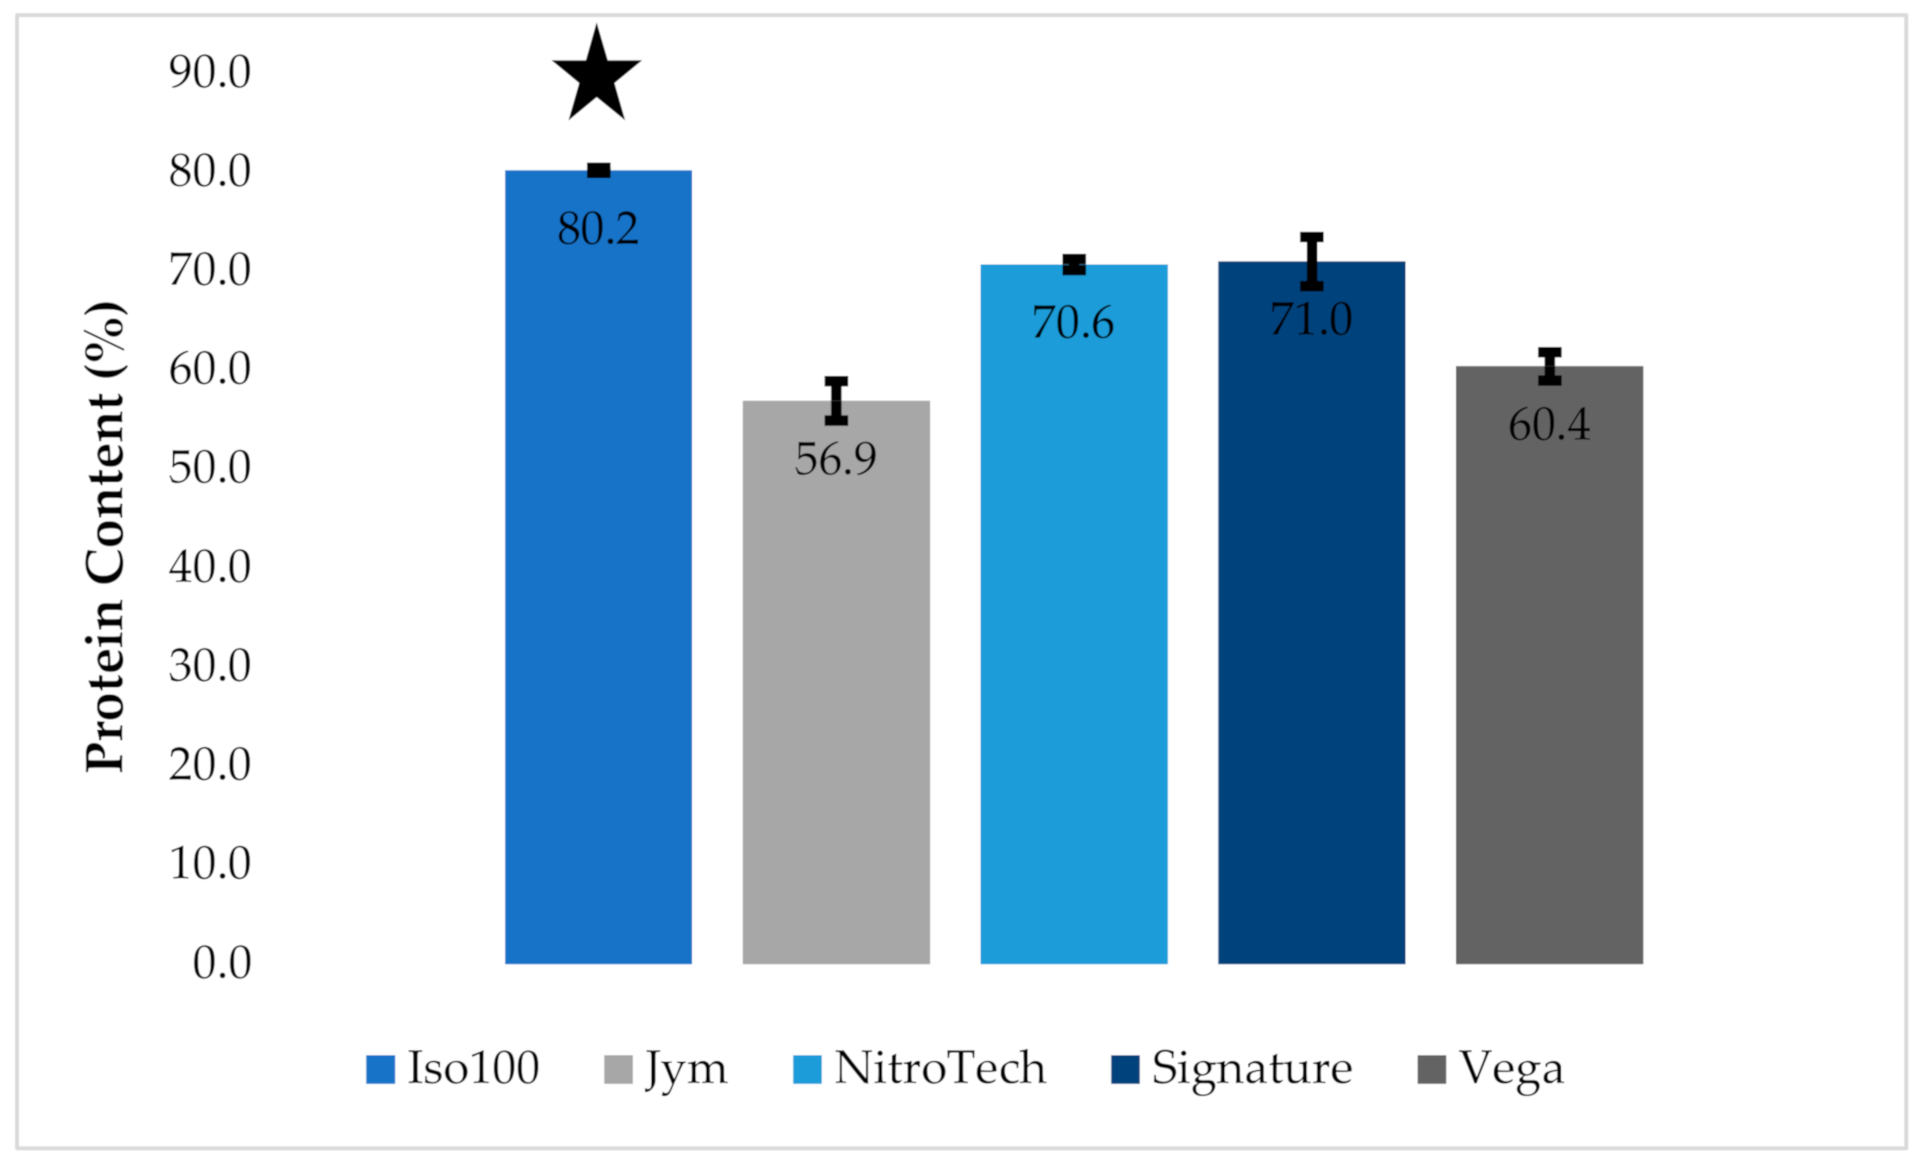
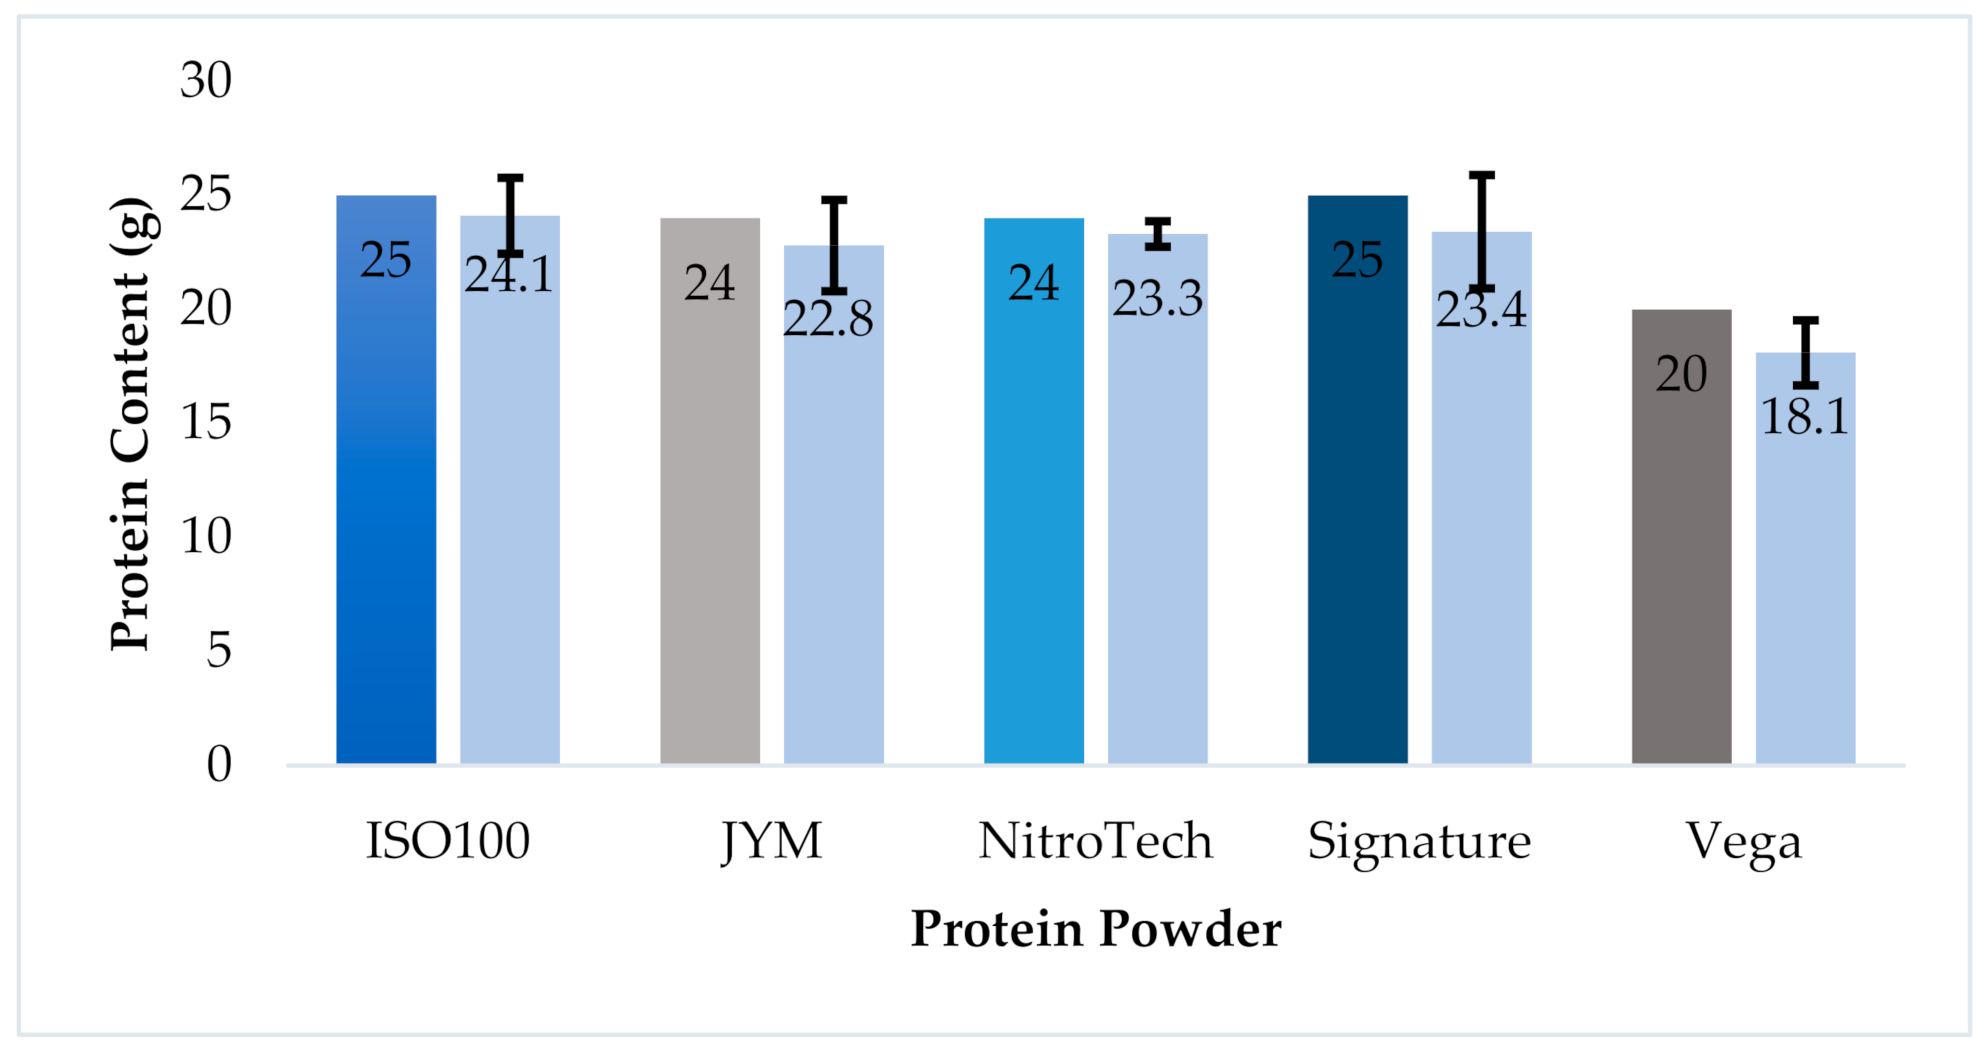
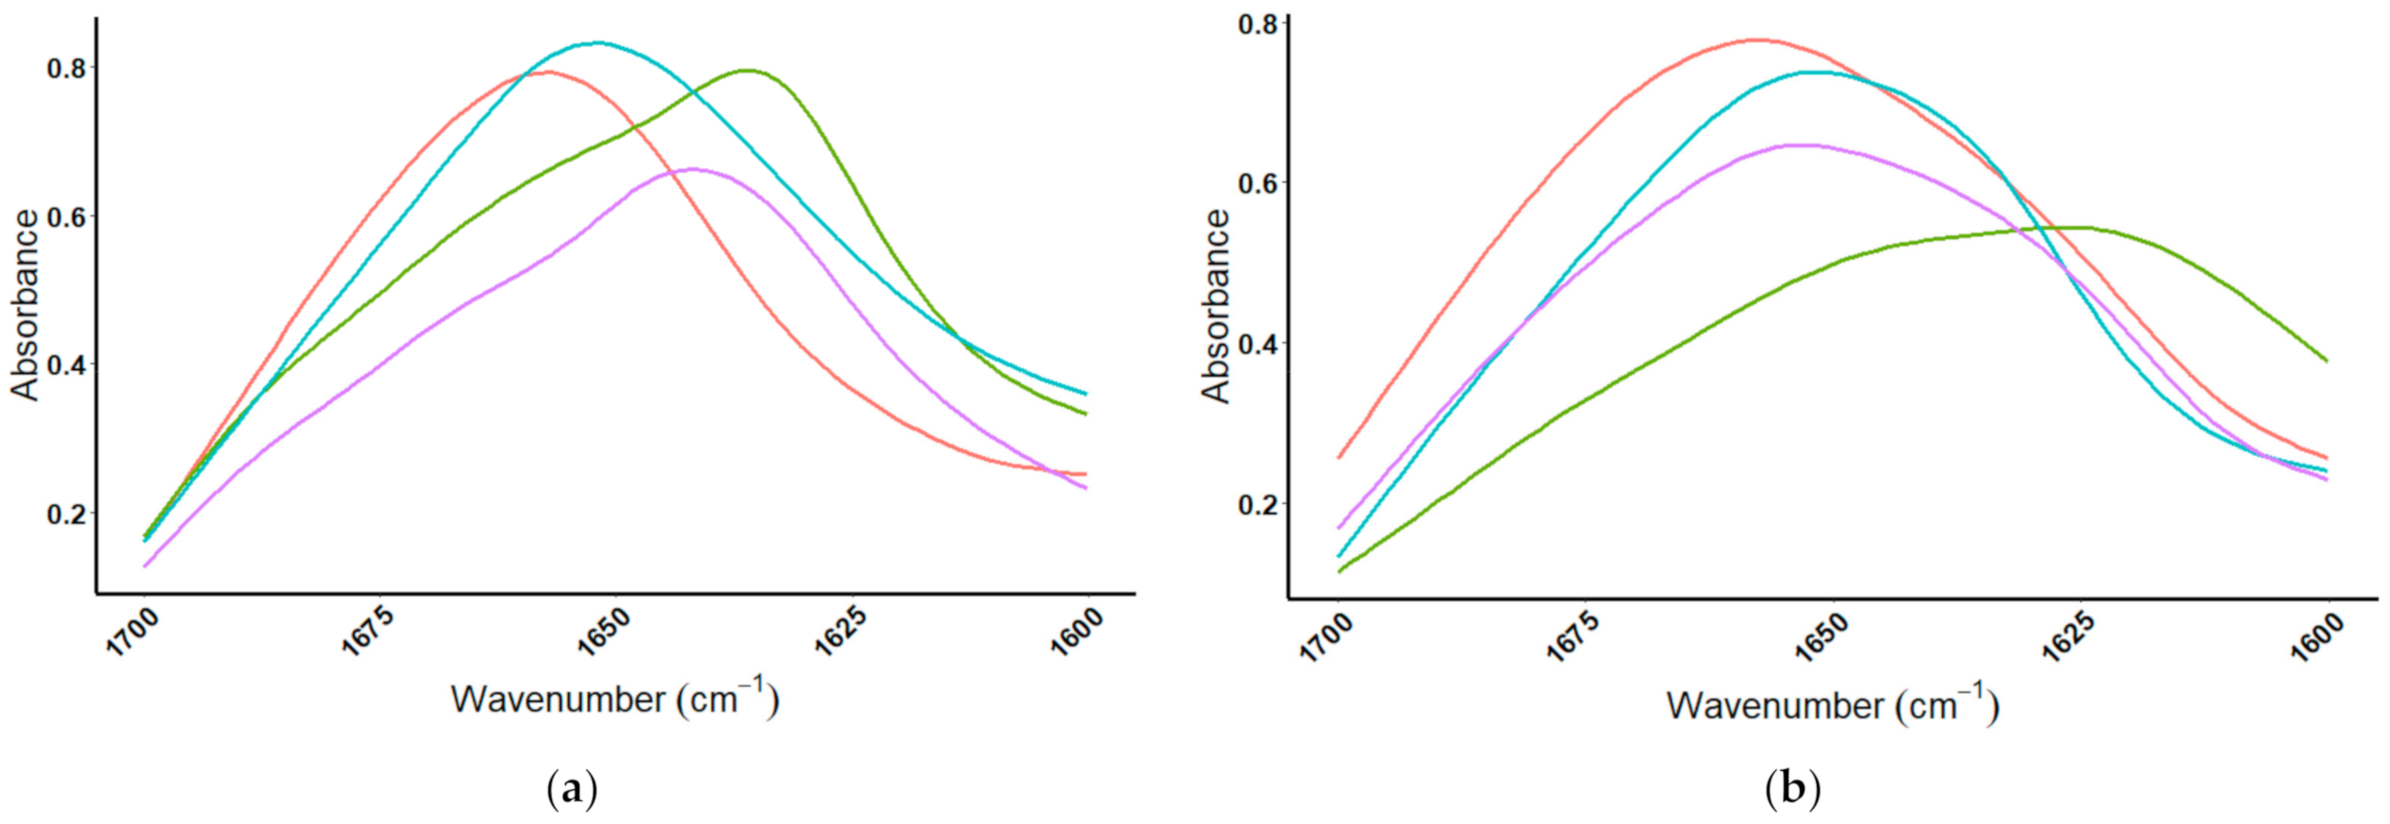
= ISO100 protein powder, = JYM protein powder, = NitroTech protein powder, = Signature protein powder and = Vega protein powder.
= Vega protein powder.
= ISO100 protein powder, = JYM protein powder, = NitroTech protein powder, = Signature protein powder and = Vega protein powder.


 = β-lactoglobulin,
  = α-lactalbumin,
  = BSA,
  = IgG, and (b) non-whey proteins:
  = brown rice,
  = casein,
  = egg albumin, and
  = pea.
= β-lactoglobulin, = α-lactalbumin, = BSA, = IgG, and (b) non-whey proteins: = brown rice, = casein, = egg albumin, and = pea.
= pea.
= β-lactoglobulin, = α-lactalbumin, = BSA, = IgG, and (b) non-whey proteins: = brown rice, = casein, = egg albumin, and = pea.
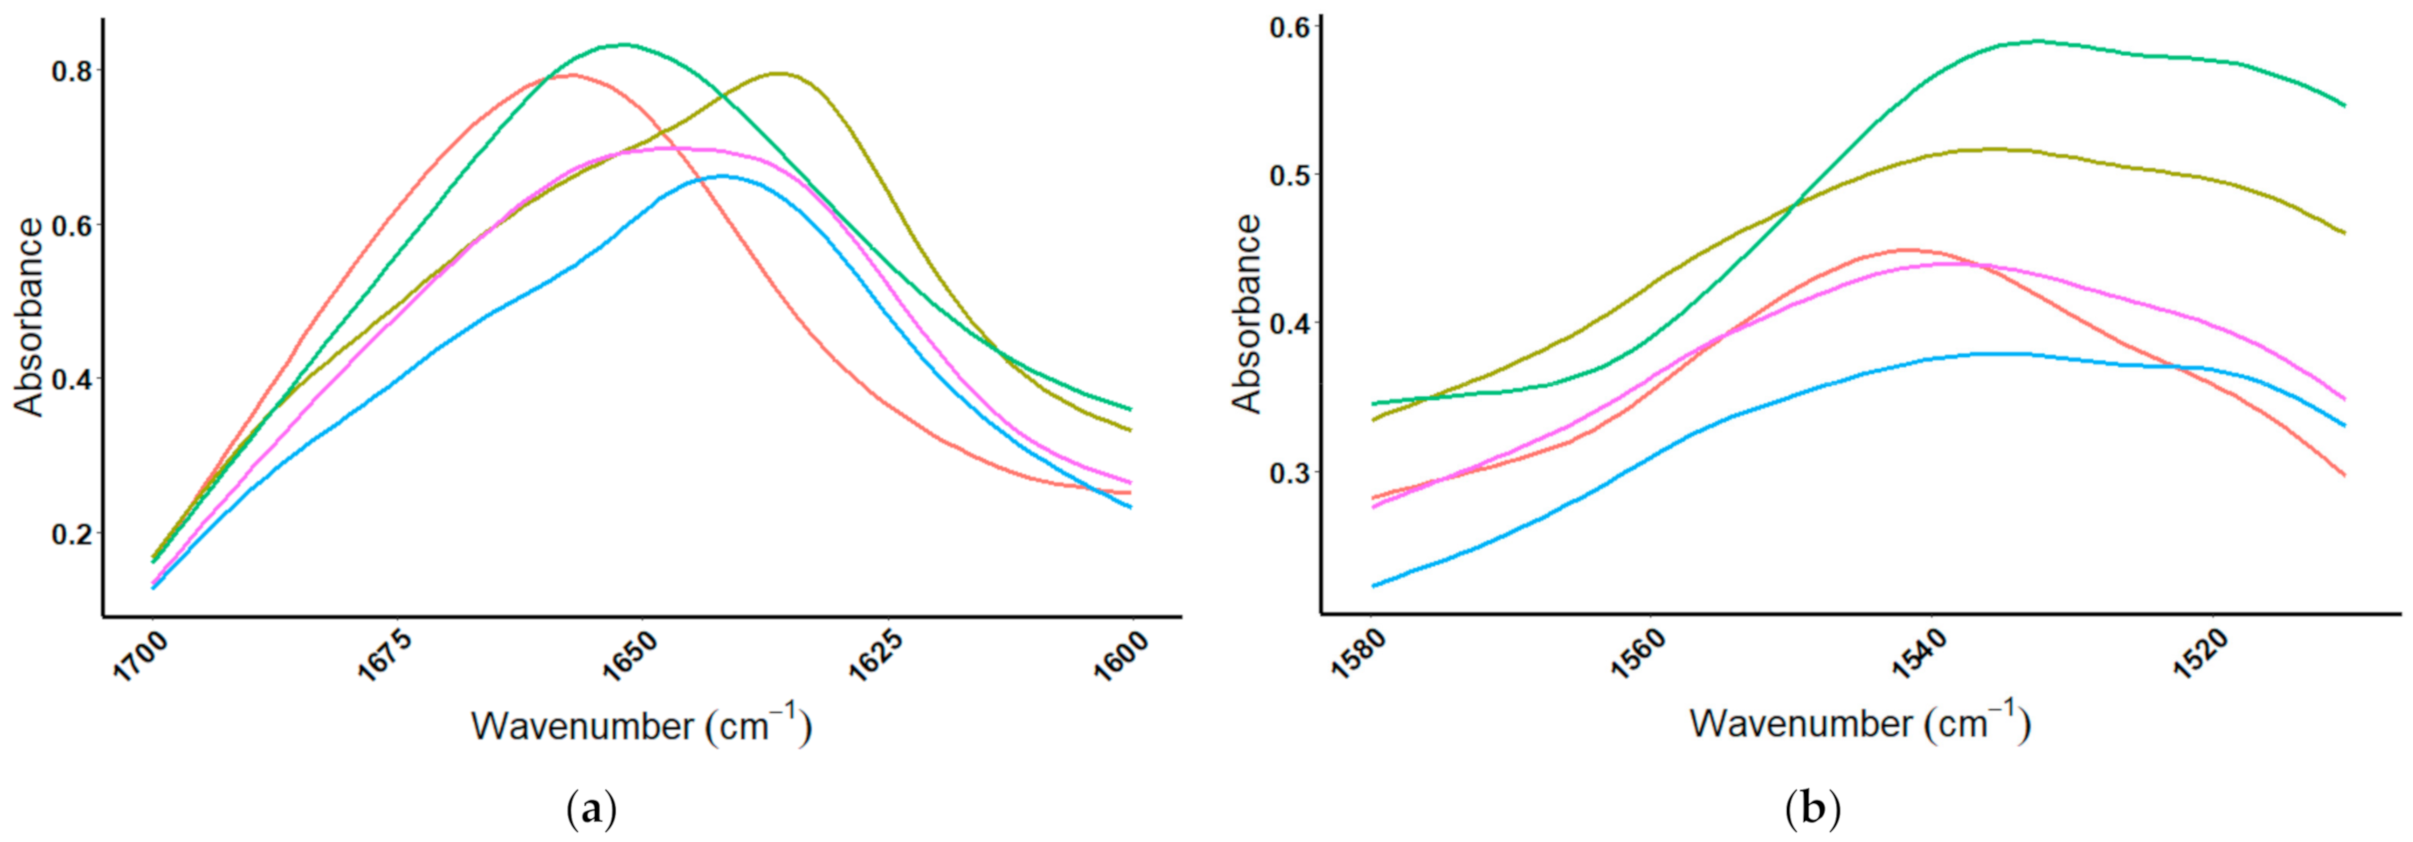
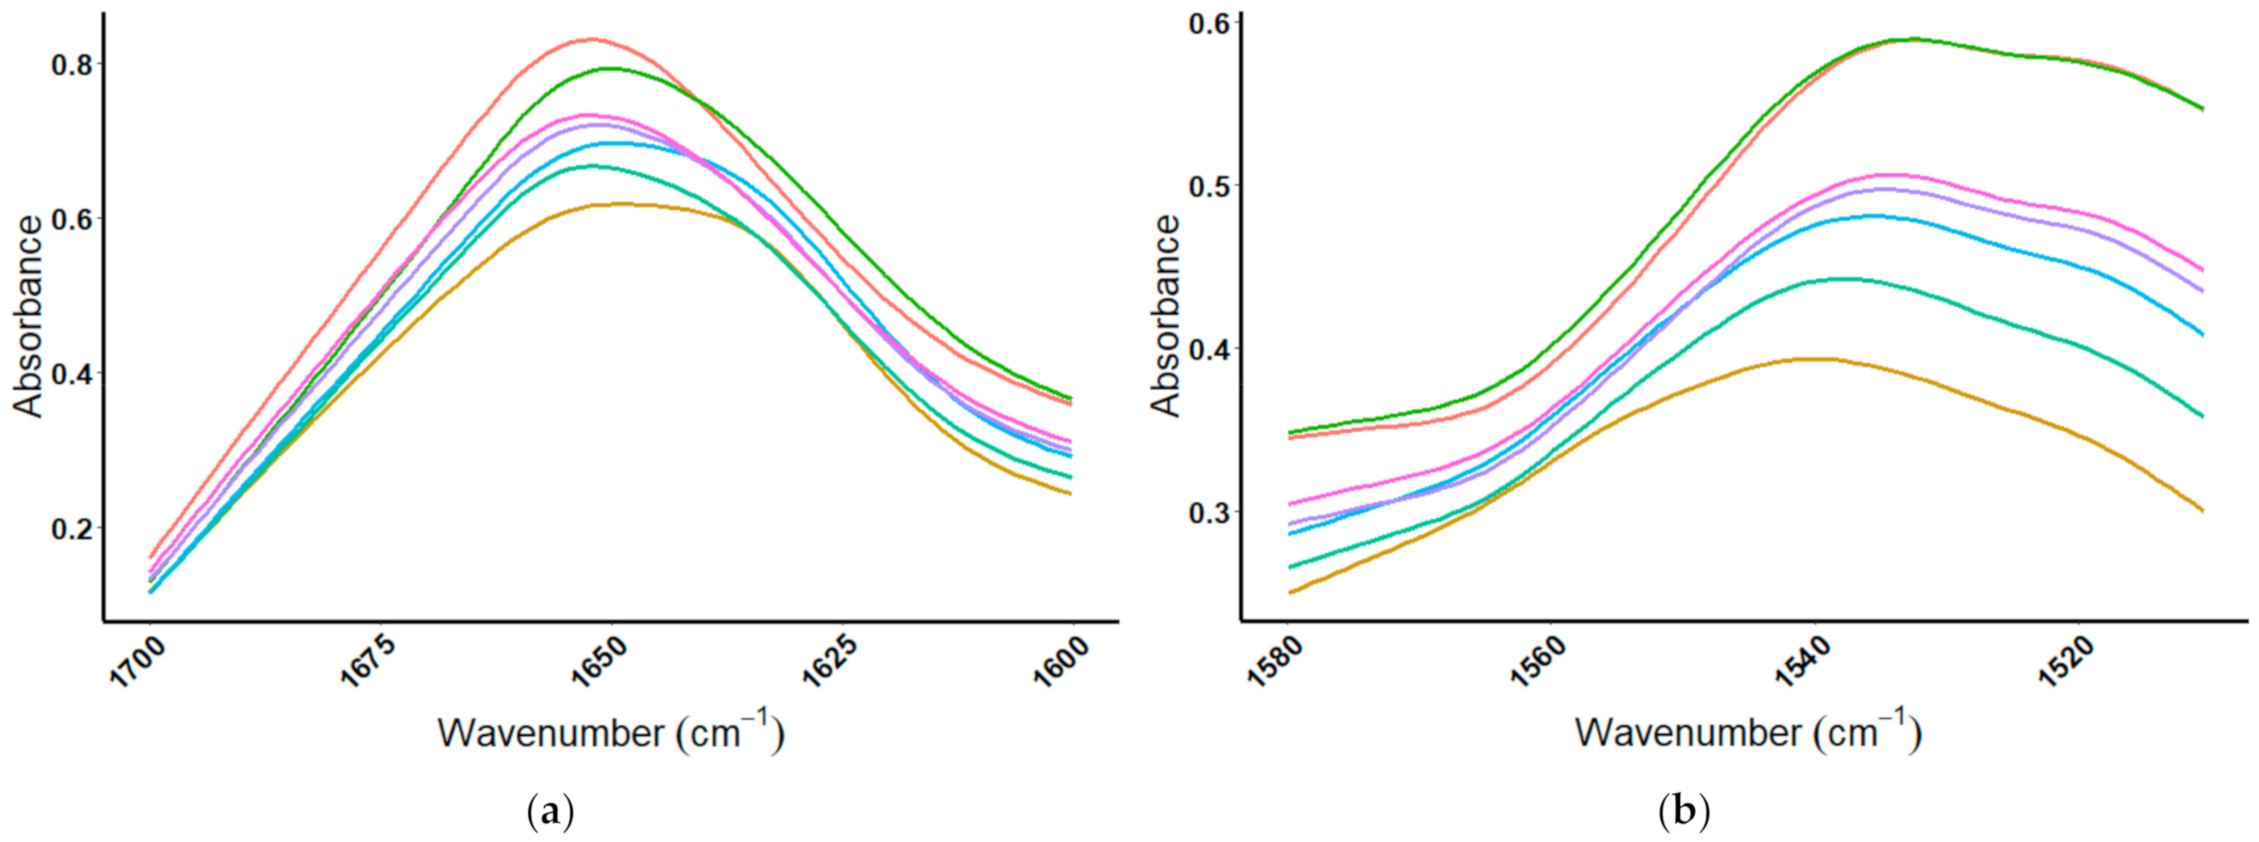
 = Vega) and protein standards (
 = Brown Rice and
  = Pea, observing (a) the amide I spectral region (1700–1600 cm−1), and (b) the amide II spectral region (1580–1510 cm−1).
= Vega) and protein standards ( = Brown Rice and = Pea, observing (a) the amide I spectral region (1700–1600 cm−1), and (b) the amide II spectral region (1580–1510 cm−1).
= Pea, observing (a) the amide I spectral region (1700–1600 cm−1), and (b) the amide II spectral region (1580–1510 cm−1).
= Vega) and protein standards ( = Brown Rice and = Pea, observing (a) the amide I spectral region (1700–1600 cm−1), and (b) the amide II spectral region (1580–1510 cm−1).
 = β-lactoglobulin,
  = α-lactalbumin,
  = BSA,
  = IgG), and whey protein product
  = ISO100, in (a) the amide I spectral region (1700–1600 cm−1), and (b) the amide II spectral region (1580–1510 cm−1).
= β-lactoglobulin, = α-lactalbumin, = BSA, = IgG), and whey protein product = ISO100, in (a) the amide I spectral region (1700–1600 cm−1), and (b) the amide II spectral region (1580–1510 cm−1).
= ISO100, in (a) the amide I spectral region (1700–1600 cm−1), and (b) the amide II spectral region (1580–1510 cm−1).
= β-lactoglobulin, = α-lactalbumin, = BSA, = IgG), and whey protein product = ISO100, in (a) the amide I spectral region (1700–1600 cm−1), and (b) the amide II spectral region (1580–1510 cm−1).
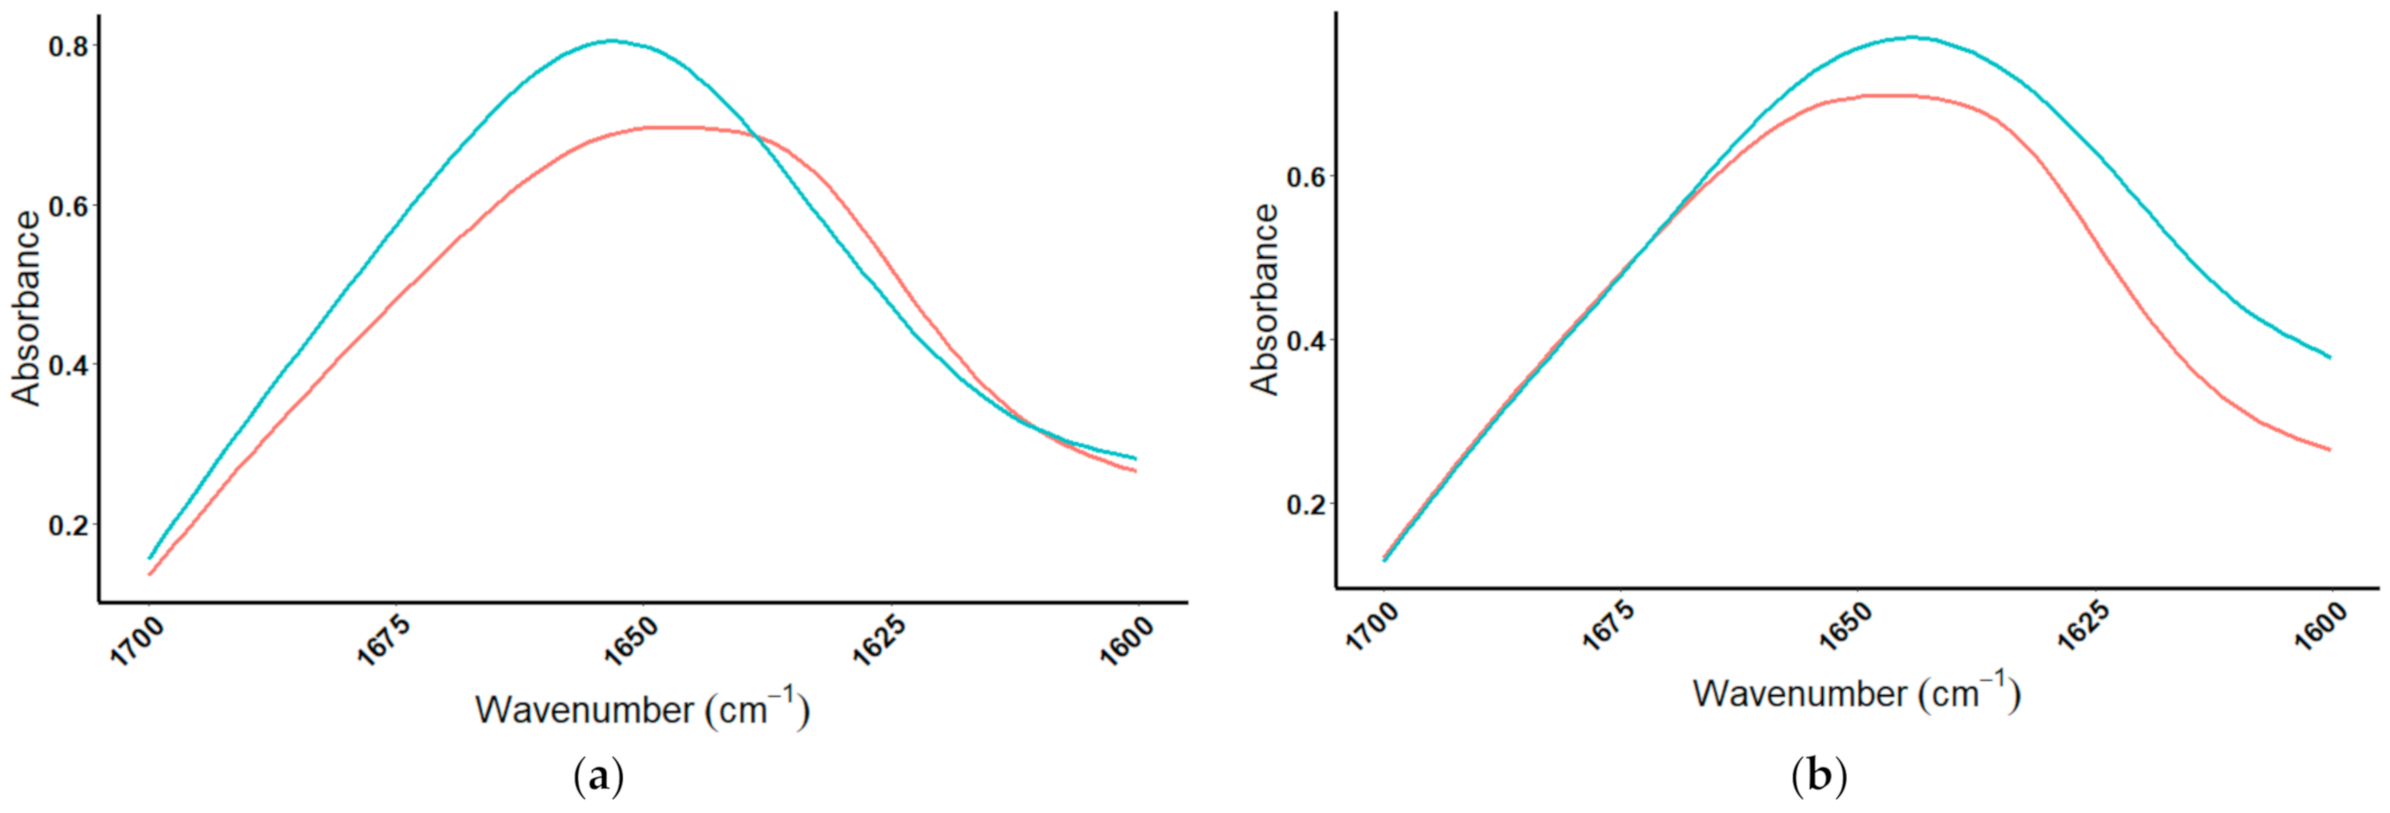
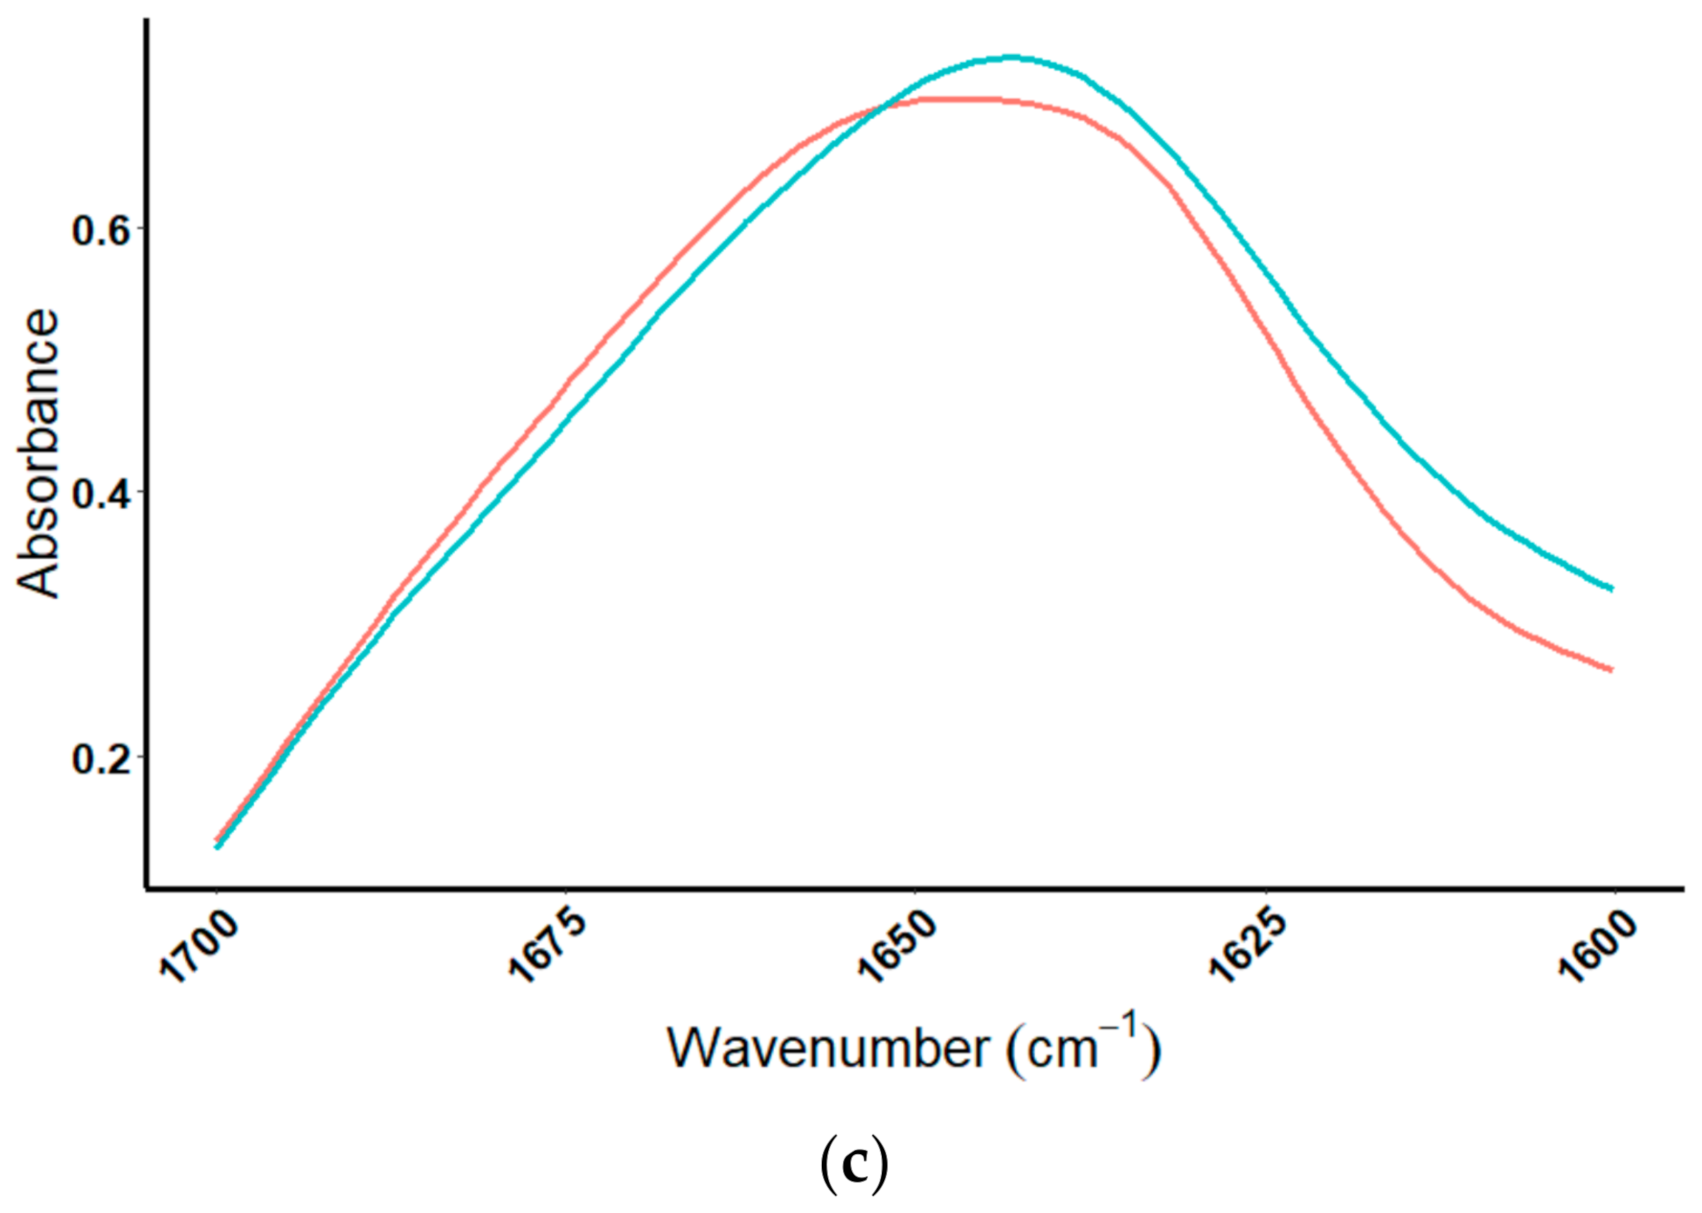
 = ISO100 protein powder and
  = mixture of proteins.
= ISO100 protein powder and = mixture of proteins.
= mixture of proteins.
= ISO100 protein powder and = mixture of proteins.

 = NitroTech protein powder,
  = NitroTech:BSA(1:2),
  = NitroTech:BSA(1:4),
  = NitroTech:BSA(1:6),
  = NitroTech:BSA(1:8),
  = NitroTech:BSA(1:10),
  = BSA.
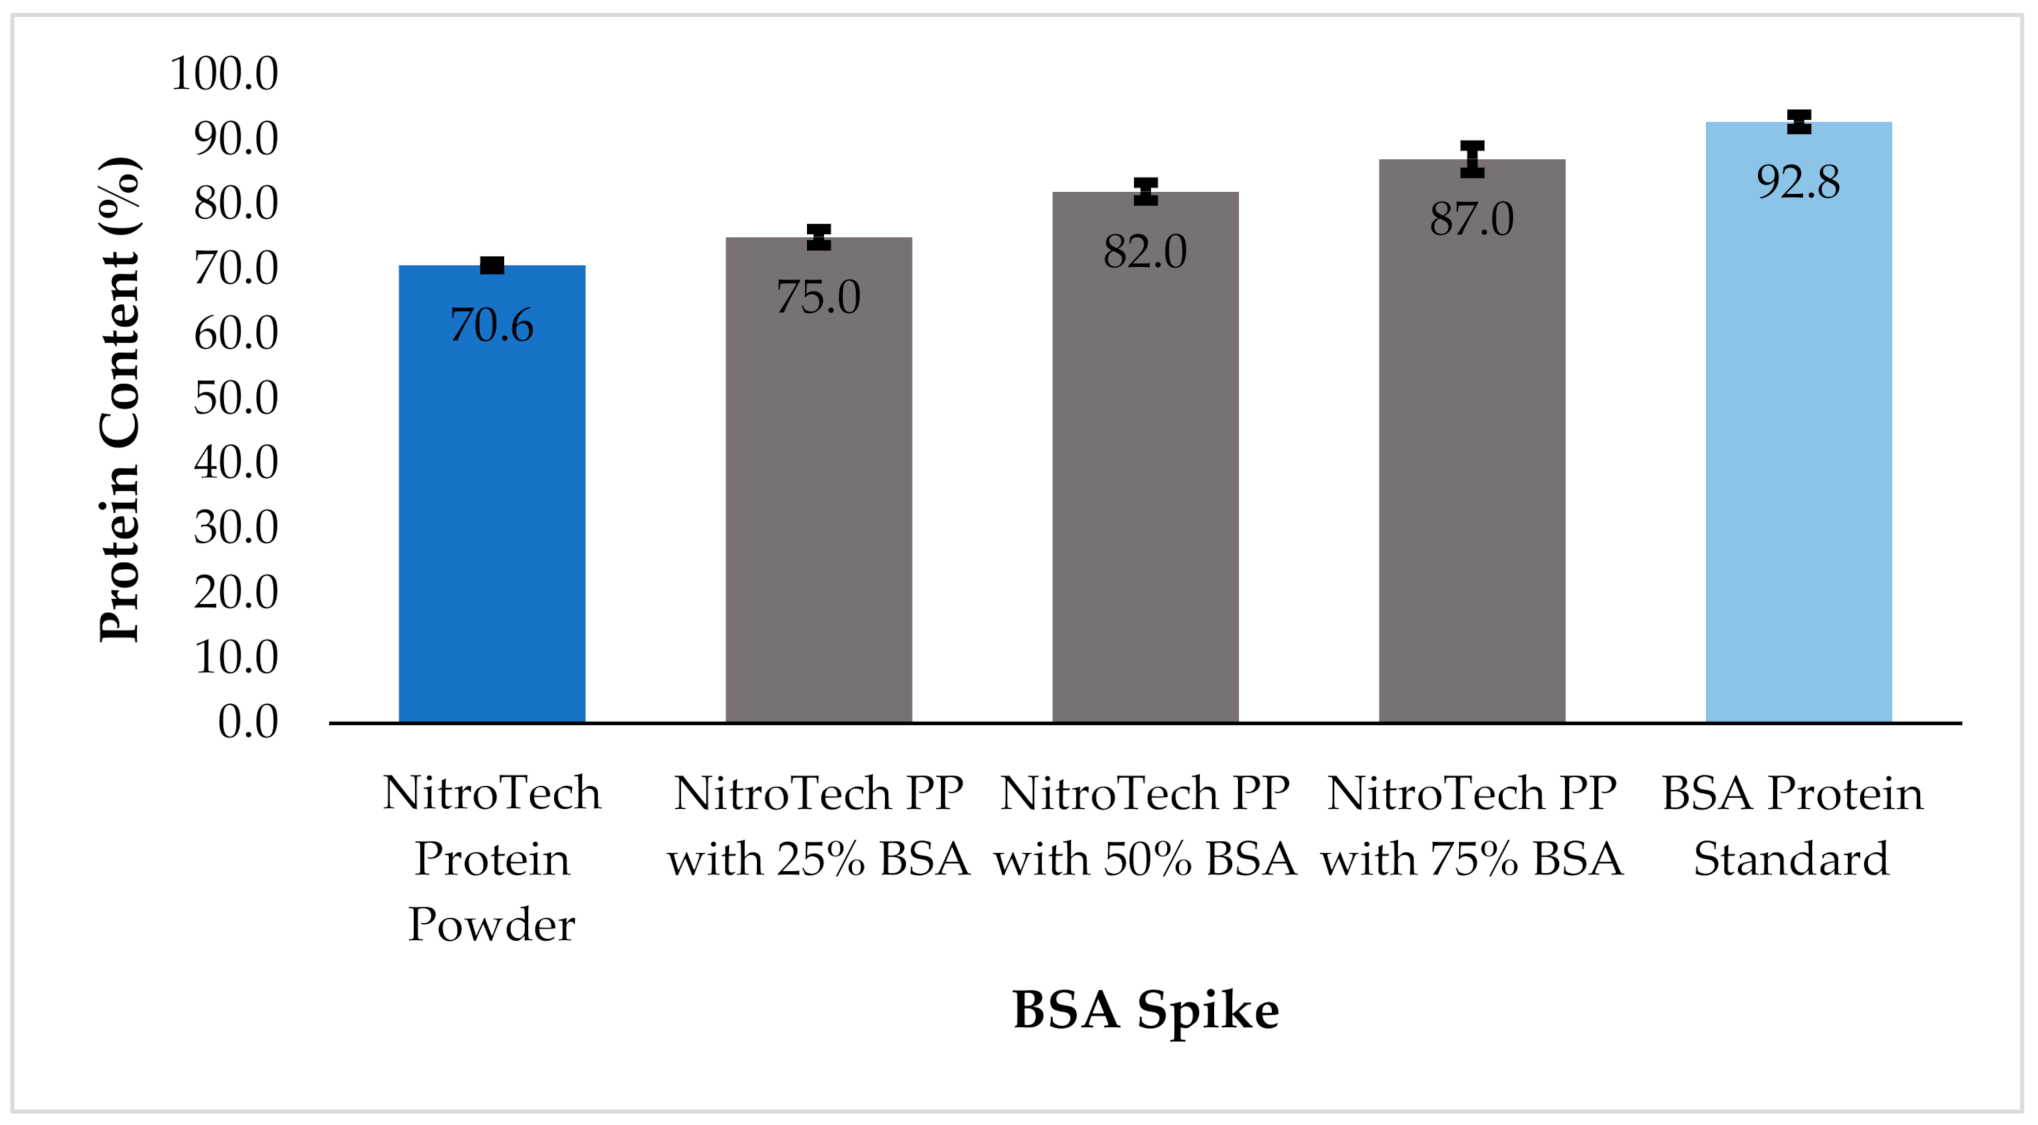
= NitroTech protein powder, = NitroTech:BSA(1:2), = NitroTech:BSA(1:4), = NitroTech:BSA(1:6), = NitroTech:BSA(1:8), = NitroTech:BSA(1:10), = BSA.
= BSA.
= NitroTech protein powder, = NitroTech:BSA(1:2), = NitroTech:BSA(1:4), = NitroTech:BSA(1:6), = NitroTech:BSA(1:8), = NitroTech:BSA(1:10), = BSA.
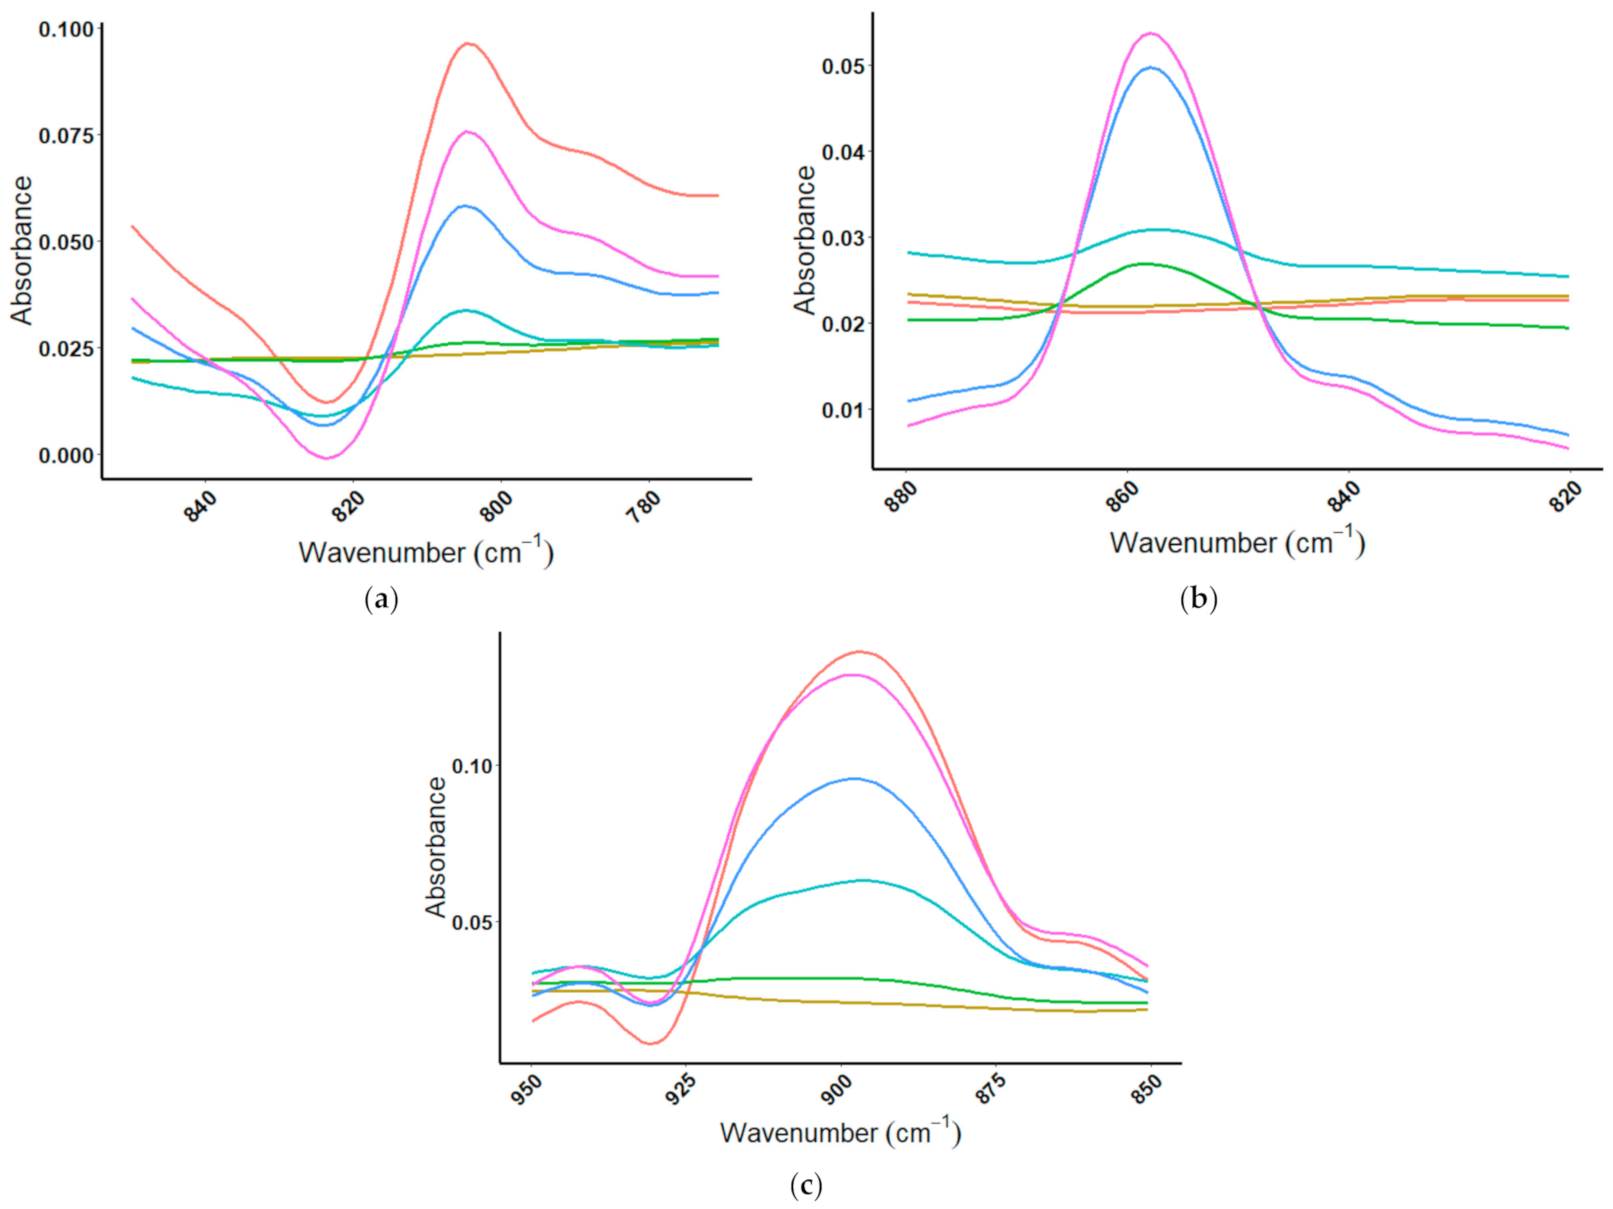
 = ISO100,
  = ISO100:GA (10:1),
  = ISO100:GA (4:1),
  = ISO100:GA (1:1),
  = ISO100:GA (1:3),
  = GA); (b) doping with the amino acid lysine over the range from 880–820 cm−1 (
 = ISO100,
  = ISO100:Lysine (10:1),
  = ISO100/Lysine (4:1),
  = ISO100:Lysine (1:1),
  = ISO100:Lysine (1:3),
  = Lysine); and (c) doping with the amino acid glycine over the range from 950–850 cm−1 (
 = ISO100,
  = ISO100:Glycine (10:1),
  = ISO100:Glycine (4:1),
  = ISO100/Glycine (1:1),
  = ISO100/Glycine (1:3),
  = Glycine).
= ISO100, = ISO100:GA (10:1), = ISO100:GA (4:1), = ISO100:GA (1:1), = ISO100:GA (1:3), = GA); (b) doping with the amino acid lysine over the range from 880–820 cm−1 ( = ISO100, = ISO100:Lysine (10:1), = ISO100/Lysine (4:1), = ISO100:Lysine (1:1), = ISO100:Lysine (1:3), = Lysine); and (c) doping with the amino acid glycine over the range from 950–850 cm−1 ( = ISO100, = ISO100:Glycine (10:1), = ISO100:Glycine (4:1), = ISO100/Glycine (1:1), = ISO100/Glycine (1:3), = Glycine).
= Glycine).
= ISO100, = ISO100:GA (10:1), = ISO100:GA (4:1), = ISO100:GA (1:1), = ISO100:GA (1:3), = GA); (b) doping with the amino acid lysine over the range from 880–820 cm−1 ( = ISO100, = ISO100:Lysine (10:1), = ISO100/Lysine (4:1), = ISO100:Lysine (1:1), = ISO100:Lysine (1:3), = Lysine); and (c) doping with the amino acid glycine over the range from 950–850 cm−1 ( = ISO100, = ISO100:Glycine (10:1), = ISO100:Glycine (4:1), = ISO100/Glycine (1:1), = ISO100/Glycine (1:3), = Glycine).

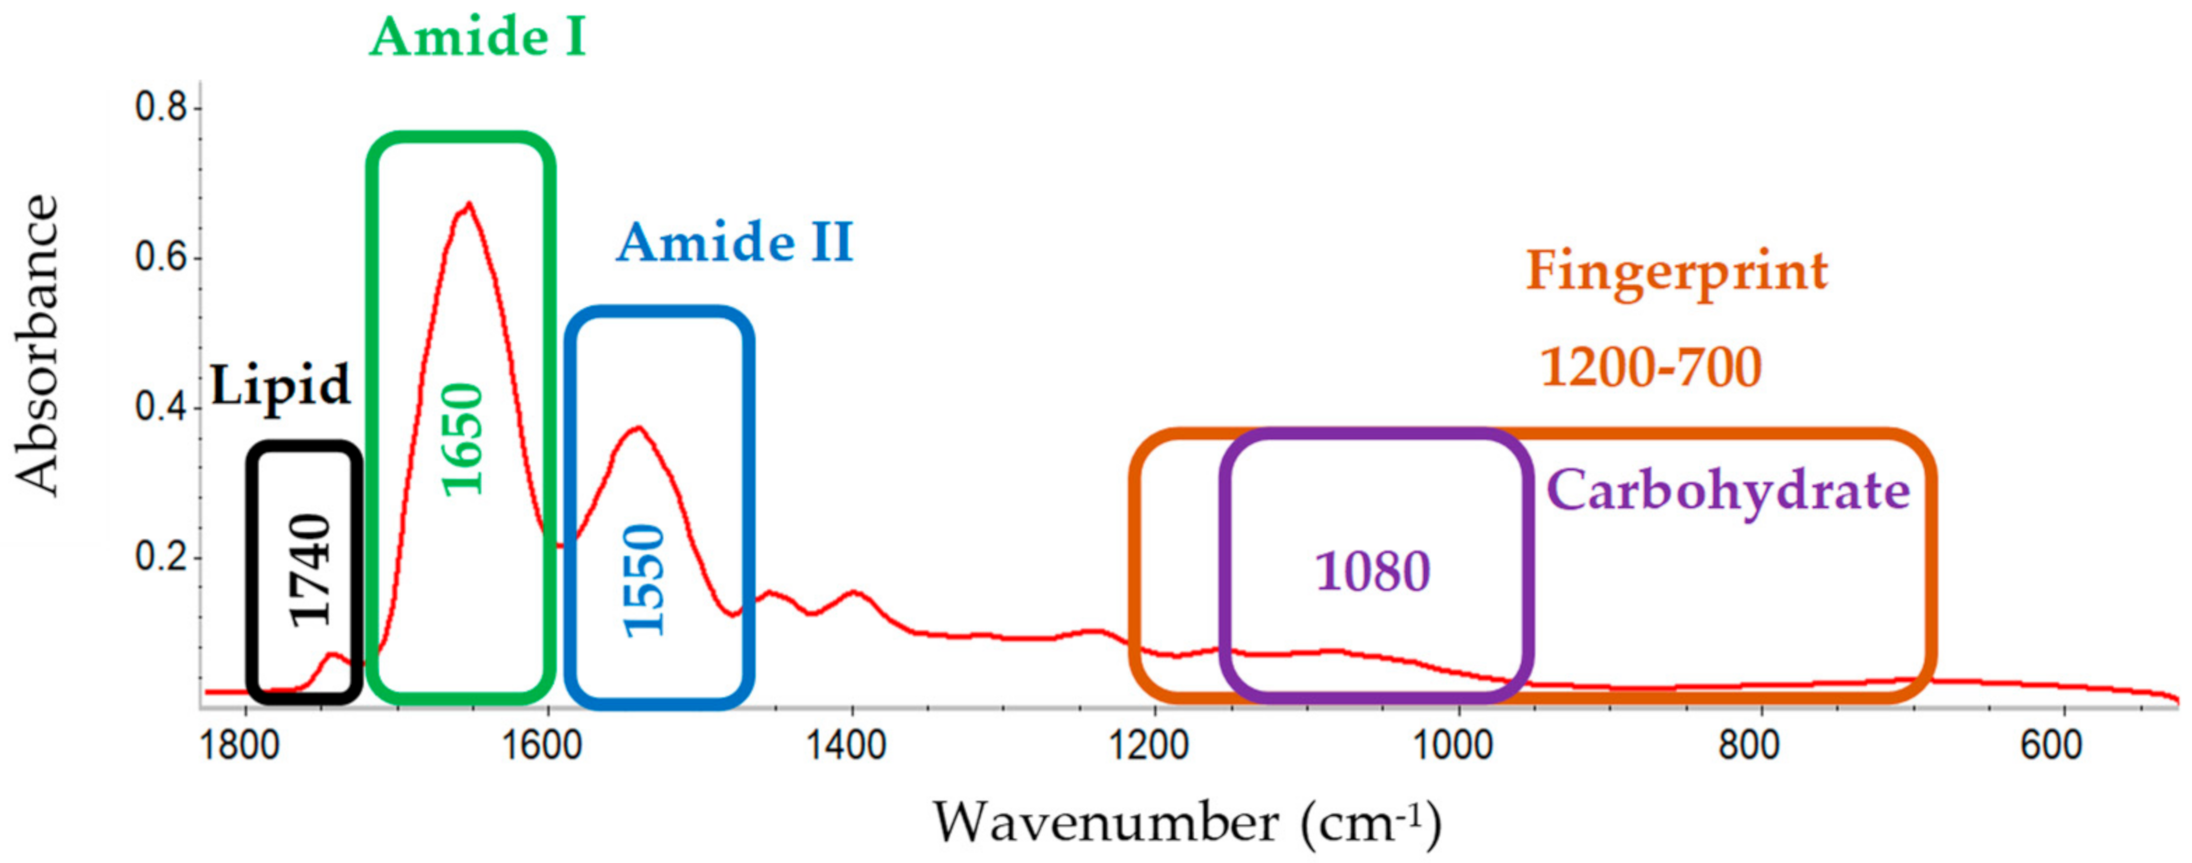
| Protein Standard | Amide I (cm−1) | Amide II (cm−1) | Lipid (cm−1) | Carbohydrate (cm−1) |
|---|---|---|---|---|
| β-lactoglobulin | 1635 ± 1 | 1537 ± 2 | N/A | N/A |
| α-lactalbumin | 1657 ± 5 | 1541 ± 2 | N/A | N/A |
| BSA | 1651 ± 1 | 1528 ± 4 | N/A | N/A |
| IgG | 1642 ± 4 | 1540 ± 1 | N/A | 1075 ± 1 (w) * |
| Casein | 1627 ± 1 | 1516 ± 0 | N/A | 1074 ± 0 (w) * |
| Egg Albumin | 1652 ± 0 | 1539 ± 0 | N/A | 1079 ± 0 (w) * |
| Brown Rice | 1653 ± 0 | 1539 ± 0 | N/A | 1080 ± 0 (w) * |
| Pea | 1653 ± 0 | 1541 ± 1 | 1743 ± 0 (w) | 1082 ± 0 (m) * |
| Protein Powder | Amide I (cm−1) | Amide II (cm−1) | Lipid (cm−1) | Carbohydrate (cm−1) |
|---|---|---|---|---|
| ISO100 | 1646 ± 0 | 1539 ± 0 | N/A | 1079 ± 0 |
| JYM | 1652 ± 0 | 1539 ± 0 | 1745 ± 1 (m) * | 1080 ± 0 |
| NitroTech | 1652 ± 0 | 1540 ± 0 | 1743 ± 0 (w) * | 1079 ± 0 |
| Signature | 1645 ± 0 | 1539 ± 0 | 1742 ± 0 (w) * | 1078 ± 0 |
| Vega | 1652 ± 0 | 1539 ± 0 | 1741 ± 0 (w) * | 1079 ± 1 |
| Protein | Amide I (cm−1) | Amide II (cm−1) |
|---|---|---|
| Brown Rice | 1653 ± 0 | 1539 ± 0 |
| Pea | 1653 ± 0 | 1541 ± 1 |
| Vega protein powder | 1652 ± 0 | 1539 ± 0 |
| Protein | Amide I (cm−1) | Amide II (cm−1) |
|---|---|---|
| β-lactoglobulin | 1635 ± 1 | 1537 ± 2 |
| α-lactalbumin | 1657 ± 5 | 1541 ± 2 |
| BSA | 1651 ± 1 | 1528 ± 4 |
| IgG | 1642 ± 4 | 1540 ± 1 |
| ISO100 protein powder | 1646 ± 0 | 1539 ± 0 |
| Spike Ratio | Amide I (cm−1) | Amide II (cm−1) | Lipid (cm−1) | Carbohydrate (cm−1) |
|---|---|---|---|---|
| NitroTech PP | 1652 ± 0 | 1540 ± 0 | 1743 ± 0 | 1079 ± 0 |
| NitroTech/BSA(1:2) | 1652 ± 0 | 1539 ± 0 | 1742 ± 0 | 1080 ± 1 |
| NitroTech/BSA(1:4) | 1652 ± 1 | 1537 ± 3 | 1743 ± 1 | 1081 ± 2 |
| NitroTech/BSA(1:6) | 1651 ± 1 | 1532 ± 1 | 1743 ± 1 | 1082 ± 0 |
| NitroTech/BSA(1:8) | 1650 ± 3 | 1531 ± 4 | 1743 ± 4 | 1082 ± 2 |
| NitroTech/BSA(1:10) | 1651 ± 1 | 1532 ± 1 | 1743 ± 0 | N/A * |
| BSA Protein | 1651 ± 1 | 1528 ± 4 | N/A * | N/A * |
Publisher’s Note: MDPI stays neutral with regard to jurisdictional claims in published maps and institutional affiliations. |
© 2021 by the authors. Licensee MDPI, Basel, Switzerland. This article is an open access article distributed under the terms and conditions of the Creative Commons Attribution (CC BY) license (https://creativecommons.org/licenses/by/4.0/).
Share and Cite
Saxton, R.; McDougal, O.M. Whey Protein Powder Analysis by Mid-Infrared Spectroscopy. Foods 2021, 10, 1033. https://doi.org/10.3390/foods10051033
Saxton R, McDougal OM. Whey Protein Powder Analysis by Mid-Infrared Spectroscopy. Foods. 2021; 10(5):1033. https://doi.org/10.3390/foods10051033
Chicago/Turabian StyleSaxton, Rose, and Owen M. McDougal. 2021. "Whey Protein Powder Analysis by Mid-Infrared Spectroscopy" Foods 10, no. 5: 1033. https://doi.org/10.3390/foods10051033
APA StyleSaxton, R., & McDougal, O. M. (2021). Whey Protein Powder Analysis by Mid-Infrared Spectroscopy. Foods, 10(5), 1033. https://doi.org/10.3390/foods10051033