
Characterisation of Fat Crystal Polymorphism in Cocoa Butter by Time-Domain NMR and DSC Deconvolution


 , and
, and
Abstract
1. Introduction
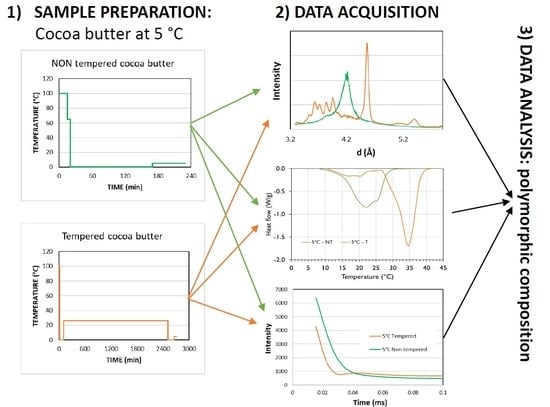
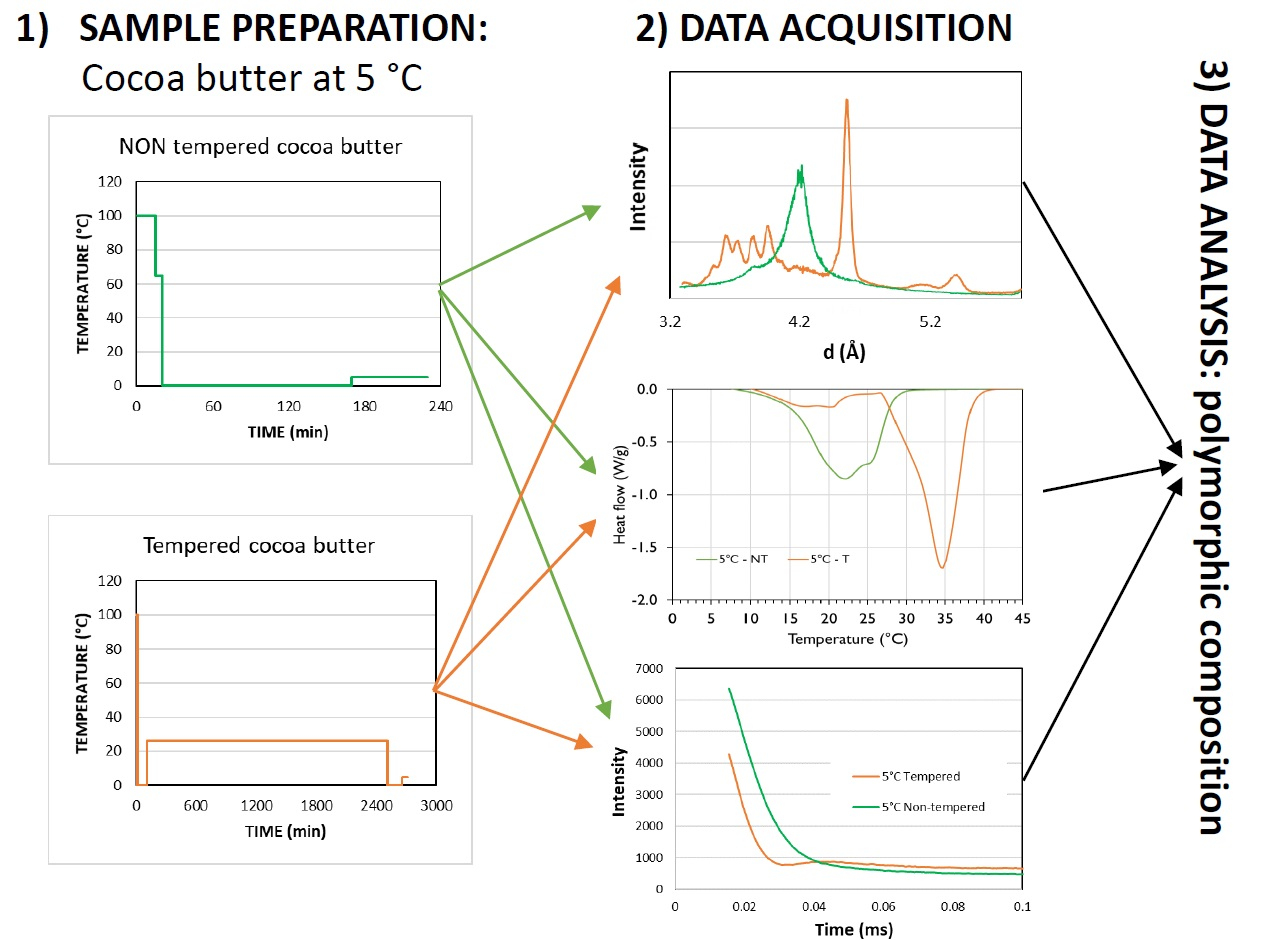
2. Materials and Methods
2.1. Materials and Temperature Profile
2.2. XRD
2.3. DSC
2.3.1. Device and Temperature Profile Set-Up
2.3.2. DSC Deconvolution
2.4. NMR
2.4.1. Bi-Gaussian Model
2.4.2. Adam-Berret Model
2.4.3. Extended Abragamian (EA) Model
2.4.4. Trezza Model
2.5. Statistics
3. Results
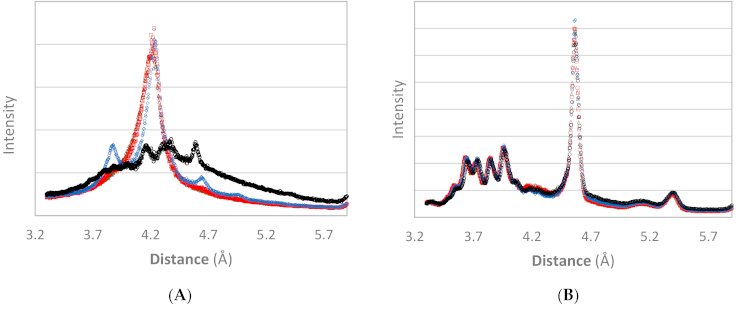
3.1. XRD
3.2. DSC
3.2.1. Qualitative Analysis
3.2.2. Quantitative Analysis
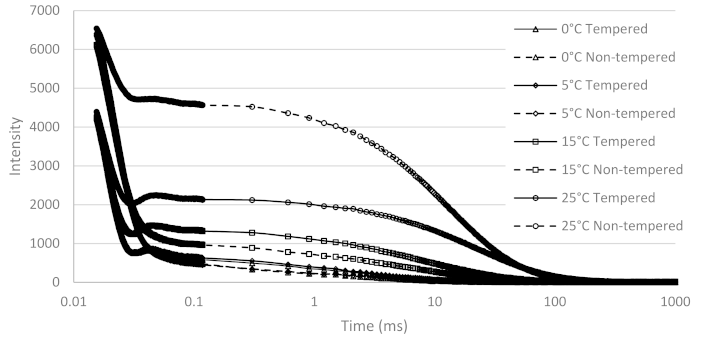
3.3. NMR
3.3.1. Qualitative Analysis
3.3.2. Quantitative Analysis
4. Discussion
5. Conclusions
Author Contributions
Funding
Data Availability Statement
Conflicts of Interest
Appendix A

| T (°C) | Tempered | A (µs−1) | ||||
|---|---|---|---|---|---|---|
| 0 | Yes | 5420 ± 7 | 11.35 ± 0.02 | 0.154 ± 0.001 | 968 ± 7 | 189 ± 4 |
| No | 6717 ± 26 | 11.67 ± 0.02 | 0.002 ± 0.001 | 1011 ± 15 | 127 ± 3 | |
| 5 | Yes | 5287 ± 17 | 11.63 ± 0.10 | 0.158 ± 0.001 | 984 ± 4 | 222 ± 5 |
| No | 6686 ± 41 | 11.59 ± 0.01 | 0.003 ± 0.001 | 912 ± 3 | 138 ± 2 | |
| 15 | Yes | 4357 ± 7 | 13.68 ± 0.09 | 0.179 ± 0.001 | 1508 ± 12 | 779 ± 28 |
| No | 5982 ± 55 | 10.93 ± 0.07 | 0.005 ± 0.001 | 1334 ± 31 | 290 ± 5 | |
| 25 | Yes | 3385 ± 24 | 14.82 ± 0.10 | 0.185 ± 0.001 | 2268 ± 20 | 1757 ± 16 |
| No | 2677 ± 192 | 11.26 ± 0.51 | 0.136 ± 0.011 | 4791 ± 244 | 2159 ± 145 |
| T (°C) | Tempered | R² (−) | T2,Liquid* (µs) | |||
|---|---|---|---|---|---|---|
| 0 | Yes | 0.9961 ± 0.0003 | 5933 ± 10 | 7.63 ± 0.00 | 772 ± 3 | 131 ± 1 |
| No | 0.9987 ± 0.0000 | 6934 ± 32 | 11.92 ± 0.02 | 722 ± 6 | 107 ± 2 | |
| 5 | Yes | 0.9955 ± 0.0001 | 5861 ± 20 | 7.51 ± 0.02 | 808 ± 2 | 144 ± 2 |
| No | 0.9986 ± 0.0001 | 6885 ± 39 | 11.81 ± 0.01 | 661 ± 1 | 116 ± 1 | |
| 15 | Yes | 0.9817 ± 0.0005 | 5381 ± 8 | 6.78 ± 0.01 | 1431 ± 9 | 260 ± 7 |
| No | 0.9971 ± 0.0000 | 6147 ± 57 | 11.18 ± 0.07 | 1118 ± 31 | 183 ± 1 | |
| 25 | Yes | 0.9662 ± 0.0018 | 4392 ± 23 | 6.55 ± 0.02 | 2226 ± 17 | 357 ± 5 |
| No | 0.9963 ± 0.0005 | 2850 ± 208 | 8.19 ± 0.251 | 4703 ± 247 | 428 ± 9 |
| T (°C) | Tempered | R² (−) | T2,α* (µs) | T2,Liquid* (µs) | |||
|---|---|---|---|---|---|---|---|
| 0 | Yes | 0.9986 ± 0.0002 | 1379 ± 26 | 13.37 ± 0.14 | 772 ± 3 | 131 ± 1 | 4038 ± 34 |
| No | 0.9996 ± 0.0000 | 5939 ± 28 | 12.95 ± 0.02 | 722 ± 6 | 107 ± 1 | 1272 ± 21 | |
| 5 | Yes | 0.9985 ± 0.0001 | 1275 ± 19 | 13.25 ± 0.20 | 808 ± 2 | 144 ± 2 | 4007 ± 17 |
| No | 0.9997 ± 0.0000 | 5802 ± 56 | 12.93 ± 0.02 | 661 ± 1 | 116 ± 1 | 1372 ± 27 | |
| 15 | Yes | 0.9981 ± 0.0001 | 1732 ± 68 | 8.42 ± 0.06 | 1431 ± 9 | 260 ± 7 | 2747 ± 59 |
| No | 0.9995 ± 0.0000 | 4583 ± 81 | 13.02 ± 0.04 | 1118 ± 31 | 183 ± 1 | 1898 ± 18 | |
| 25 | Yes | 0.9971 ± 0.0003 | 741 ± 58 | 9.09 ± 0.12 | 2226 ± 17 | 357 ± 5 | 2756 ± 71 |
| No | 0.9970 ± 0.0011 | 1867 ± 676 | 9.72 ± 1.71 | 4703 ± 247 | 428 ± 9 | 865 ± 813 |
References
- Dewettinck, K.; Foubert, I.; Basiura, M.; Goderis, B. Phase behavior of cocoa butter in a two-step isothermal crystallization. Cryst. Growth Des. 2004, 4, 1295–1302. [Google Scholar] [CrossRef]
- Afoakwa, E.O. Chocolate Science and Technology, 1st ed.; Wiley-Blackwell: West-Sussex, UK, 2010. [Google Scholar]
- Kadivar, S.; De Clercq, N.; Danthine, S.; Dewettinck, K. Crystallization and polymorphic behavior of enzymatically produced sunflower oil based cocoa butter equivalents. Eur. J. Lipid Sci. Technol. 2016, 118, 1521–1538. [Google Scholar] [CrossRef]
- Windhab, E.J. Tempering. In Industrial Chocolate Manufacture and Use; Beckett, S.T., Fowler, M.S., Ziegler, G.R., Eds.; Wiley-Blackwell: West-Sussex, UK, 2017; pp. 314–355. [Google Scholar]
- Juriaanse, A.C.; Heertje, I. Microstructure of shortenings, margarine and butter—A review. Food Microstruct. 1988, 7, 181–188. [Google Scholar]
- Sato, K.; Ueno, S. Crystallization, transformation and microstructures of polymorphic fats in colloidal dispersion states. Curr. Opin. Colloid Interface Sci. 2011, 16, 384–390. [Google Scholar] [CrossRef]
- Detry, R.; Van Hoed, V.; Sterckx, J.; Deledicque, C.; Sato, K.; Blecker, C.; Danthine, S. Physicochemical properties of palm oil-based fuff pastry model margarines related to their baking performance in long-term storage. Eur. J. Lipid Sci. Technol. 2021, 123, 2000155. [Google Scholar] [CrossRef]
- Sato, K. Crystallization behaviour of fats and lipids—A review. Chem. Eng. Sci. 2001, 56, 2255–2265. [Google Scholar] [CrossRef]
- Walstra, P. Physical Chemistry of Foods; Marcel Dekker: New York, NY, USA, 2003. [Google Scholar]
- Himawan, C.; Starov, V.M.; Stapley, A.G.F. Thermodynamic and kinetic aspects of fat crystallization. Adv. Colloid Interface 2006, 122, 3–33. [Google Scholar] [CrossRef] [PubMed]
- Marangoni, A.G. Structure-Function Analysis of Edible Fats, 2nd ed.; AOCS Press: Urbana, IL, USA, 2018. [Google Scholar]
- Marangoni, A.; Narine, S. Physical Properties of Lipids; Marcel Dekker: New York, NY, USA, 2002. [Google Scholar]
- Campos, R. Experimental Methodology. In Structure and Properties of Fat Crystal Networks; Marangoni, A.G., Wesdorp, L.H., Eds.; CRC Press: Boca Raton, FL, USA, 2012; pp. 419–490. [Google Scholar]
- Bociek, S.M.; Ablett, S.; Norton, I.T. A 13C-NMR study of the crystal polymorphism and internal mobilities of the triglycerides, tripalmitin and tristearin. J. Am. Oil Chem. Soc. 1985, 62, 1261–1266. [Google Scholar] [CrossRef]
- Eads, T.M.; Blaurock, A.E.; Bryant, R.G.; Roy, D.J.; Croasmun, W.R. Molecular motion and transitions in solid tripalmitin measured by deuterium nuclear magnetic resonance. J. Am. Oil Chem. Soc. 1992, 69, 1057–1068. [Google Scholar] [CrossRef]
- Arishima, T.; Sugimoto, K.; Kiwata, R.; Mori, H.; Sato, K. 13C cross-polarization and magic-angle spinning nuclear magnetic resonance of polymorphic forms of three triacylglycerols. J. Am. Oil Chem. Soc. 1996, 73, 1231–1236. [Google Scholar] [CrossRef]
- van Duynhoven, J.; Dubourg, I.; Goudappel, G.-J.; Roijers, E. Determination of MG and TG phase composition by time-domain NMR. J. Am. Oil Chem. Soc. 2002, 79, 383–388. [Google Scholar] [CrossRef]
- Trezza, E.; Haiduc, A.M.; Goudappel, G.J.W.; van Duynhoven, J.P.M. Rapid phase-compositional assessment of lipid-based food products by time domain NMR. Magn. Reson. Chem. 2006, 44, 1023–1030. [Google Scholar] [CrossRef]
- Adam-Berret, M.; Rondeau-Mouro, C.; Riaublanc, A.; Mariette, F. Study of triacylglycerol polymorphs by nuclear magnetic resonance: Effects of temperature and chain length on relaxation parameters. Magn. Reson. Chem. 2008, 46, 550–557. [Google Scholar] [CrossRef]
- Adam-Berret, M.; Riaublanc, A.; Mariette, F. Effects of crystal growth and polymorphism of triacylglycerols on NMR relaxation parameters. 2. Study of a tricaprin-tristearin mixture. Cryst. Growth Des. 2009, 9, 4281–4288. [Google Scholar] [CrossRef]
- Adam-Berret, M.; Boulard, M.; Riaublanc, A.; Mariette, F. Evolution of fat crystal network microstructure followed by NMR. J. Agric. Food Chem. 2011, 59, 1767–1773. [Google Scholar] [CrossRef]
- Declerck, A.; Nelis, V.; Rimaux, T.; Dewettinck, K.; Van der Meeren, P. Influence of polymorphism on the solid fat content determined by FID deconvolution. Eur. J. Lipid Sci. Technol. 2018, 120, 1–11. [Google Scholar] [CrossRef]
- Huyghebaert, A.; Hendrickx, H. Polymorphism of cocoa butter, shown by differential scanning calorimetry. Lebensm. Wiss. Technol. 1971, 4, 59–63. [Google Scholar]
- Chapman, G.M.; Akehurst, E.E.; Wright, W.B. Cocoa butter and confectionery fats. Studies using programmed temperature X-ray diffraction and differential scanning calorimetry. J. Am. Oil Chem. Soc. 1971, 48, 824–830. [Google Scholar] [CrossRef]
- Marangoni, A.G.; McGauley, S.E. Relationship between crystallization behavior and structure in cocoa butter. Cryst. Growth Des. 2003, 3, 95–108. [Google Scholar] [CrossRef]
- Braipson-Danthine, S.; Gibon, V. Comparative analysis of triacylglycerol composition, melting properties and polymorphic behavior of palm oil and fractions. Eur. J. Lipid Sci. Technol. 2007, 109, 359–372. [Google Scholar] [CrossRef]
- Foubert, I.; Fredrick, E.; Vereecken, J.; Sichien, M.; Dewettinck, K. Stop-and-return DSC method to study fat crystallization. Thermochim. Acta 2008, 471, 7–13. [Google Scholar] [CrossRef]
- Moens, K.; De Clercq, N.; Verstringe, S.; Dewettinck, K. Revealing the influence of tempering on polymorphism and crystal arrangement in semicrystalline oil-in-water emulsions. Cryst. Growth Des. 2015, 15, 5693–5704. [Google Scholar] [CrossRef]
- Tananuwong, K.; Reid, D.S. DSC and NMR relaxation studies of starch-water interactions during gelatinization. Carbohydr. Polym. 2004, 58, 345–358. [Google Scholar] [CrossRef]
- Schäffer, B.; Schäffer, B.; Lőrinczy, D. Decomposition of DSC curves of dairy products with Gaussian functions. J. Therm. Anal. Calorim. 2005, 82, 531–535. [Google Scholar] [CrossRef]
- Litz, B.; Obert, G.; Szily, B. Examination of the correlation of butter spreadability and its fat conformation by DSC. J. Therm. Anal. Calorim. 2006, 84, 425–428. [Google Scholar] [CrossRef]
- Dergez, T.; Lorinczy, D.; Könczöl, F.; Farkas, N.; Belagyi, J. Differential scanning calorimetry study of glycerinated rabbit psoas muscle fibres in intermediate state of ATP hydrolysis. BMC Struct. Biol. 2007, 7, 41. [Google Scholar] [CrossRef] [PubMed]
- Chiavaro, E.; Rodriguez-Estrada, M.T.; Barnaba, C.; Vittadini, E.; Cerretani, L.; Bendini, A. Differential scanning calorimetry: A potential tool for discrimination of olive oil commercial categories. Anal. Chim. Acta 2008, 625, 215–226. [Google Scholar] [CrossRef]
- Bampi, M.; Sereno, A.M.; Schmidt, F.C.; Laurindo, J.B. Evaluation of different software tools for deconvolving differential scanning calorimetry thermograms of salted beef. Food Sci. Technol. 2016, 36, 694–700. [Google Scholar] [CrossRef]
- Fessas, D.; Signorelli, M.; Schiraldi, A. Polymorphous transitions in cocoa butter: A quantitative DSC study. J. Therm. Anal. Calorim. 2005, 82, 691–702. [Google Scholar] [CrossRef]
- Larsson, K. Lipids: Molecular Organization, Physical Functions and Technical Applications; Oily Press: Dundee, UK, 1994. [Google Scholar]
- Van Malssen, K.F.; Van Langevelde, A.J.; Peschar, R.; Schenk, H. Phase behaviour and extended phase scheme of static cocoa-butter investigated with real-time x-ray powder diffraction. J. Am. Oil Chem. Soc. 1999, 76, 669–676. [Google Scholar] [CrossRef]
- Wille, R.L.; Lutton, E.S. Polymorphism of cocoa butter. J. Am. Oil Chem. Soc. 1966, 43, 491–496. [Google Scholar] [CrossRef] [PubMed]
- Lovegren, N.; Gray, M.S.; Feuge, R. Polymorphic changes in mixtures of confectionery fats. J. Am. Oil Chem. Soc. 1976, 53, 83–88. [Google Scholar] [CrossRef]
- Lonchampt, P.; Hartel, R.W. Fat bloom in chocolate and compound coatings. Eur. J. Lipid Sci. Technol. 2004, 106, 241–274. [Google Scholar] [CrossRef]
- Dimick, P.; Davis, T. Solidification of cocoa butter. Manuf. Confect 1986, 66, 123–127. [Google Scholar]
- Grunin, L.; Oztop, M.H.; Guner, S.; Baltaci, S.F. Exploring the crystallinity of different powder sugars through solid echo and magic sandwich echo sequences. Magn. Reson. Chem. 2019, 57, 607–615. [Google Scholar] [CrossRef] [PubMed]
- AOCS. Method Cd 16b-93: Solid Fat Content (SFC) by Low-Resolution Nuclear Magnetic Resonance, Direct Method. In Official Methods and Recommended Practices of the American Oil Chemists’ Society, 4th ed.; American Oil Chemists’ Society: Champaign, IL, USA, 1989. [Google Scholar]
- Nelis, V.; Declerck, A.; De Neve, L.; Moens, K.; Dewettinck, K.; Van der Meeren, P. Fat crystallization and melting in W/O/W double emulsions: Comparison between bulk and emulsified state. Colloid Surf. A 2019, 566, 196–206. [Google Scholar] [CrossRef]
- Abragam, A. The Principles of Nuclear Magnetism; Clarendon Press: Oxford, UK, 1961. [Google Scholar]
- Derbyshire, W.; van den Bosch, M.; van Dusschoten, D.; MacNaughtan, W.; Farhat, I.A.; Hemminga, M.A.; Mitchell, J.R. Fitting of the beat pattern observed in NMR free-induction decay signals of concentrated carbohydrate–water solutions. J. Magn. Reson. 2004, 168, 278–283. [Google Scholar] [CrossRef] [PubMed]
- Le Botlan, D.; Helie-Fourel, I. Assessment of the intermediate phase in milk fat by low-resolution nuclear magnetic resonance. Anal. Chim. Acta 1995, 311, 217–223. [Google Scholar] [CrossRef]
- Le Botlan, D.J.; Ouguerram, L. Spin-spin relaxation time determination of intermediate states in heterogeneous products from free induction decay NMR signals. Anal. Chim. Acta 1997, 349, 339–347. [Google Scholar] [CrossRef]
- Duval, F.P.; van Duynhoven, J.P.M.; Bot, A. Practical implications of the phase-compositional assessment of lipid-based food products by time-domain NMR. J. Am. Oil Chem. Soc. 2006, 83, 905–912. [Google Scholar] [CrossRef]
- Adenier, H.; Ollivon, M.; Perron, R.; Chaveron, H. Le blanchiment gras. I Observations et commentaires. Choc. Confis. Fr. 1975, 315, 7–23. [Google Scholar]
- Solis-Fuentes, J.A.; Hernandez-Medel, M.R.; Duran-de-Bazua, M.C. Determination of the predominant polymorphic form of mango (Mangifera indica) almond fat by differential scanning calorimetry and X-ray diffraction. Eur. J. Lipid Sci. Technol. 2005, 107, 395–401. [Google Scholar] [CrossRef]
- Gultekin, D.H.; Gore, J.C. Temperature dependence of nuclear magnetization and relaxation. J. Magn. Reson. 2005, 172, 133–141. [Google Scholar] [CrossRef] [PubMed]
- Kaufmann, N.; Kirkensgaard, J.J.K.; Andersen, U.; Wiking, L. Shear and rapeseed oil addition affect the crystal polymorphic behavior of milk fat. J. Am. Oil Chem. Soc. 2013, 90, 871–880. [Google Scholar] [CrossRef]


| Tempered | Non-Tempered | ||
|---|---|---|---|
| T (°C) | Time (min) | T (°C) | Time (min) |
| 100 | 15 | 100 | 15 |
| 65 | 5 | 65 | 5 |
| 0 | 90 | 0 | 90 |
| 26 | 2400 | - | - |
| 0 | 90 | - | - |
| 5 | 60 | 5 | 60 |
| 15 | 60 | 15 | 60 |
| 25 | 60 | 25 | 60 |
| Polymorph | Melting Temperature (°C) |
|---|---|
| sub-α | 13.0–18.0 |
| α | 17.1–24.0 |
| β2’ | 22.4–28.0 |
| β1’ | 21–33.0 |
| β2 | 30.0–34.5 |
| β1 | 33.5–36.3 |
| Parameter | Range of Investigated Values | Spacing | Number of Points |
|---|---|---|---|
| 2 ms–1.2 s | logarithmic | = 100 | |
| 50 µs–2 ms | logarithmic | = 100 | |
| 17 µs–45 µs | logarithmic | = 100 | |
| 11 µs–13 µs | linear | = 20 | |
| 0.145 µs−1–0.190 µs−1 | linear | = 40 |
| T (°C) | Polymorph | Tm,offset (°C) | ΔHm,total (J/g) |
|---|---|---|---|
| 0 | α | 28.1 ± 0.2 | 89.2 ± 0.9 |
| 5 | α + (β2’) | 28.8 ± 0.3 | 96.1 ± 2.3 |
| 15 | (α) + β2’ | 30.9 ± 0.3 | 101.8 ± 0.6 |
| 25 | β1’+ β2 | 36.4 ± 0.1 | 54.7 ± 2.6 |
| T (°C) | Polymorph | Tm,offset (°C) | ΔHm,total (J/g) |
|---|---|---|---|
| 0 | β2 | 38.4 ± 0.6 | 140.3 ± 1.7 |
| 5 | β2 | 39.1 ± 0.4 | 147.6 ± 1.2 |
| 15 | β2 | 39.1 ± 0.3 | 134.1 ± 5.3 |
| 25 | β2 | 39.9 ± 0.7 | 129.5 ± 0.9 |
| 0 °C | 5 °C | 15 °C | 25 °C | |||||||||
|---|---|---|---|---|---|---|---|---|---|---|---|---|
| Tm (°C) | ΔHm,poly (J/g) | RC (%) | Tm (°C) | ΔHm,poly (J/g) | RC (%) | Tm (°C) | ΔHm,poly (J/g) | RC (%) | Tm (°C) | ΔHm,poly (J/g) | RC (%) | |
| sub-α | 13.6 | 9.3 | 6.8 | 15.3 | 10.9 | 7.5 | ||||||
| α | 22.1 | 3.3 | 2.4 | 20.2 | 12.5 | 8.6 | 19.8 | 4.8 | 3.6 | |||
| β’ | 24.6 | 1.9 | 1.4 | 23.5 | 11.1 | 8.4 | 28.0 | 8.9 | 7.1 | |||
| β | 32.0 | 78.2 | 57.5 | 30.5 | 34.0 | 23.3 | 30.2 | 31.3 | 23.6 | 30.5 | 22.9 | 18.3 |
| β | 34.4 | 43.5 | 31.9 | 34.8 | 88.5 | 60.7 | 34.2 | 85.2 | 64.4 | 34.7 | 93.4 | 74.6 |
| SUM | 136.1 | 100 | 146.0 | 100 | 132.4 | 100 | 125.3 | 100 | ||||
| 0 °C | 5 °C | 15 °C | 25 °C | |||||||||
|---|---|---|---|---|---|---|---|---|---|---|---|---|
| Tm (°C) | ΔHm,poly (J/g) | RC (%) | Tm (°C) | ΔHm,poly (J/g) | RC (%) | Tm (°C) | ΔHm,poly (J/g) | RC (%) | Tm (°C) | ΔHm,poly (J/g) | RC (%) | |
| α | 17.4 | 34.2 | 39.0 | 16.6 | 12.5 | 13.1 | 19.7 | 8.5 | 8.3 | |||
| α | 21.5 | 45.1 | 51.5 | 22.0 | 75.1 | 78.4 | 23.6 | 51.1 | 49.5 | |||
| β’ | 24.8 | 8.3 | 9.4 | 25.9 | 8.2 | 8.5 | 27.0 | 43.7 | 42.3 | 27.5 | 8.6 | 15.7 |
| β’ | 29.6 | 20.8 | 38.0 | |||||||||
| β | 32.7 | 25.3 | 46.2 | |||||||||
| SUM | 87.6 | 100 | 95.8 | 100 | 103.4 | 100 | 54.7 | 100 | ||||
| T (°C) | Tempered | Main Polymorph | M2 (µs2) | Extended Abragamian | Trezza Model | |||
|---|---|---|---|---|---|---|---|---|
| RC-α (%) | RC-β(’) (%) | RC-α (%) | RC-β(’) (%) | |||||
| 0 | Yes | β2 | 7.63 | 0.0157 | 22.3 ± 0.4 | 65.2 ± 0.5 | 6.3 ± 1.1 | 82.1 ± 1.2 |
| No | α | 11.92 | 0.0073 | 74.9 ± 0.3 | 16.0 ± 0.2 | 70.6 ± 2.2 | 22.3 ± 2.4 | |
| 5 | Yes | β2 | 7.51 | 0.0157 | 20.9 ± 0.3 | 65.8 ± 0.3 | 4.8 ± 0.8 | 82.9 ± 1.0 |
| No | α + (β2’) | 11.81 | 0.0074 | 74.1 ± 0.4 | 17.5 ± 0.4 | 68.9 ± 0.5 | 24.4 ± 0.5 | |
| 15 | Yes | β2 | 6.78 | 0.0160 | 29.3 ± 1.2 | 46.5 ± 1.0 | 0.0 ± 0.0 | 75.4 ± 0.3 |
| No | (α) + β2’ | 11.18 | 0.0084 | 60.3 ± 0.8 | 25.0 ± 0.4 | 54.3 ± 0.7 | 32.9 ± 0.4 | |
| 25 | Yes | β2 | 6.55 | 0.0160 | 12.9 ± 1.0 | 48.2 ± 1.3 | 0.0 ± 0.0 | 60.6 ± 1.3 |
| No | β2 + β1’ | 8.19 | 0.0142 | 25.1 ± 8.9 | 11.7 ± 11.1 | 2.9 ± 3.5 | 32.7 ± 6.7 | |
Publisher’s Note: MDPI stays neutral with regard to jurisdictional claims in published maps and institutional affiliations. |
© 2021 by the authors. Licensee MDPI, Basel, Switzerland. This article is an open access article distributed under the terms and conditions of the Creative Commons Attribution (CC BY) license (http://creativecommons.org/licenses/by/4.0/).
Share and Cite
Declerck, A.; Nelis, V.; Danthine, S.; Dewettinck, K.; Van der Meeren, P. Characterisation of Fat Crystal Polymorphism in Cocoa Butter by Time-Domain NMR and DSC Deconvolution. Foods 2021, 10, 520. https://doi.org/10.3390/foods10030520
Declerck A, Nelis V, Danthine S, Dewettinck K, Van der Meeren P. Characterisation of Fat Crystal Polymorphism in Cocoa Butter by Time-Domain NMR and DSC Deconvolution. Foods. 2021; 10(3):520. https://doi.org/10.3390/foods10030520
Chicago/Turabian StyleDeclerck, Arnout, Veronique Nelis, Sabine Danthine, Koen Dewettinck, and Paul Van der Meeren. 2021. "Characterisation of Fat Crystal Polymorphism in Cocoa Butter by Time-Domain NMR and DSC Deconvolution" Foods 10, no. 3: 520. https://doi.org/10.3390/foods10030520
APA StyleDeclerck, A., Nelis, V., Danthine, S., Dewettinck, K., & Van der Meeren, P. (2021). Characterisation of Fat Crystal Polymorphism in Cocoa Butter by Time-Domain NMR and DSC Deconvolution. Foods, 10(3), 520. https://doi.org/10.3390/foods10030520