Article

Curation and Publication of Simulation Data in DesignSafe, a Natural Hazards Engineering Open Platform and Repository

1
Texas Advanced Computing Center, University of Texas at Austin, Austin, TX 78758, USA
2
Department of Civil and Environmental Engineering, University of Washington, Seattle, WA 98195, USA
3
Aerospace Engineering and Engineering Mechanics, University of Texas at Austin, Austin, TX 78712, USA
*
Author to whom correspondence should be addressed.
Publications 2019, 7(3), 51; https://doi.org/10.3390/publications7030051
Submission received: 14 March 2019 / Revised: 31 May 2019 / Accepted: 27 June 2019 / Published: 9 July 2019
(This article belongs to the Special Issue Selected Papers from Open Repositories 2018)

Abstract

:
Most open repositories present a similar interface and workflow to publish data resultant from different types of research methods. Publishing simulation datasets is challenging due to the iterative nature of simulations that generate large numbers and sizes of files, and their need for detailed documentation. DesignSafe is a web-based open platform for natural hazards engineering research where users can conduct simulations in high performance computing resources, curate, and publish their data. Working closely with experts, we completed a data design project for curation and representation of simulation datasets. The design involved the creation of a data and metadata model that captures the main processes, data, and documentation used in natural hazards simulation research. The model became the foundation to design an interactive curation pipeline integrated with the rest of the platform functions. In the curation interface, users are guided to move, select, categorize, describe, and register relations between files corresponding to the simulation model, the inputs and the outputs categories. Curation steps can be undertaken at any time during active research. To engage users, the web interactions were designed to facilitate managing large numbers of files. The resultant data landing pages show the structure and metadata of a simulation process both as a tree, and a browsing interface for understandability and ease of access. To evaluate the design, we mapped real simulation data to interactive mockups and sought out experts’ feed-back. Upon implementing a first release of the pipeline, we evaluated the data publications and made necessary enhancements.

1. Introduction

The goal of computational simulation research is to imitate a physical phenomenon to learn how it behaves under specific conditions. For this, a mathematical model of the phenomenon is designed in the form of code. Testing a simulation involves running the model iteratively, each time using different input configurations that can result in numerous and large-sized output files. Those may be graphed or transformed into visualizations for interpretation. One of the main challenges of curating and publishing understandable and reusable simulation datasets is to represent the research process just summarized.
This paper describes the design, evaluation and enhancement of an interactive curation pipeline and corresponding publication representation for simulation datasets. The effort was undertaken for DesignSafe (DS), a web platform that offers end-to-end data management and computational services to enable lifecycle natural hazards engineering research [1]. Researchers in the space generate vast and complex datasets derived from the investigative methods they use, which include: experiments, field reconnaissance, simulations, hybrid simulations, and social science studies. Building on more than a decade of work curating and publishing natural hazards engineering datasets [2], DS expanded capabilities, adding open science high performance computing (HPC) infrastructure to enable computational research and to improve scalability. The availability of such infrastructure allows implementing data curation as a lifecycle process, through interconnected workspaces and interactive functions that carry data from the research planning phase through computation and into publication [3]. In the platform, data curation activities are operationalized as selecting, organizing, describing, preserving, sharing, and checking for data and metadata completeness. Those can be done from the simulation project planning, in tandem with conducting simulations, and in preparation for publication. To achieve integration of data curation, we designed and implemented data and metadata models that correspond to the steps and processes of the research methods used in the natural hazards engineering space [4]. In this paper, we focus on simulation data. We define this as data design including methods and technical elements to implement and evaluate curation interactivities and a data publication representation.
Administratively, DS is a virtual organization formed by multi-disciplinary teams with different and related functions. The group involved in the simulation data design was formed by research and development technical staff, and by members of the simulation requirements team. Technical staff includes software engineers, curators, interface designers and user experience experts, charged with designing, developing and testing the platform’s functionalities. The simulation requirements team is formed by domain scientists in a natural hazard type (e.g., geotechnical, wind, structural, and storm surge) whose role is to identify needs, establish policies, and provide guidance regarding simulations.
Our goal in the data design was to reflect how simulation researchers conceptualize their investigative process so that curation in the platform felt intuitive, intertwined with active research processes, and that the publication represented the work accomplished. Aided by the simulation requirements team experts, the data design was completed using diverse research and development methods including modeling research narratives, and iterative interface development and testing. In the design, we embedded lifecycle curation best practices such as: enabling paths between active, curated, and public data; recording data provenance; the possibility to add general and domain specific metadata; assuring long-term data permanence; and implementing different data navigation strategies to facilitate access. A main concern was designing for big data, so that managing large numbers of files is not a burden. Integrating curation and simulation services was also key and required balancing curation and publishing workflows with computational functionalities through the platform’s underlying data management technology. Flexibility and consistency in data representation were also important. While simulation researchers use diverse types of software and their datasets result in unique structures, across projects, curation functionalities and the general look and feel of the publications landing pages are the same. Beyond the technical challenges, achieving a seamless research flow within the platform required blending differences in professional practices and expertise. This needed a strategy to effectively involve the natural hazards experts in the data design. We captured and bridged the knowledge of experts and technical staff through a unique simulation data and metadata model and interactive mockups that were used to show and tell.
Designing for flexibility entails continuous evaluation. Upon the first release of the curation and publication interfaces we evaluated their fitness observing how users curated their projects, which data they selected to publish, and how they documented their work. We also attended their questions and concerns during curation virtual office hours. This feedback informed a round of design changes, which were mapped to real data cases and tested by users prior to their implementation.1 In this paper, we present the research and development methodology used to design a simulation data and metadata model that resulted as interactive interfaces for curation and publication. The following sections include: a review of related work; a description of the research and development methods used in the simulation data design; an account of how evaluations led to enhancements; and conclusions and discussion of future work. The enhancements are currently implemented and we point to simulation data publications.

2. Related Work

Many institutional data repositories, such as those based on Data Verse [5], have generic data and metadata models and policies that facilitate depositing datasets derived from different domains and generated by all types of research methods. Moreover, many domain specific repositories map to a generic metadata standard [6,7] as well as the Cyverse platform that combines data analysis and repository functions for plant genomics data [8]. While generic metadata schemas allow interoperability with other repositories and aggregators [9], they fall short on describing the complexity of simulation projects. Simulation data accessible in these repositories are represented as flat lists of files whose relations to the processes from which they derive and more specialized descriptions may be included in the file names, in the abstract, in a readme file, or in an adjacent publication. There are hybrid metadata models such as the Core Scientific Metadata Model [10], and the one developed for the Digital Rocks Portal [11] that accommodate experiments and simulations that use material samples as a departure. Such models allow representing complex data structures including multiple experiments and or simulations. A simpler hybrid data structure combining general information with project specific parameters was developed for the DataCenterHub, which hosts experimental and numerical simulation datasets [12]. Departing from a landing page with general information, metadata and the different data components are displayed in tables. In DS, we saw the need and the opportunity to develop a model specifically to represent all the components and complex structure of simulation data. The methods used to develop it were similar to those followed to design experimental and field research models and services in DS [13] and in other data cyberinfrastructure projects [11,14].
The majority of open repositories receive data at the end of a research project’s lifecycle. Thus, curation happens outside of the repository and further interactive engagement consists in uploading files and adding metadata to a form. Dallmeier-Tiessen and colleagues stress the importance of connecting research workflows to data publication both upwards and downwards, to improve documentation and long-term preservation prospects [15]. They review projects that connect research workflows to publication through loosely coupled modules, a model they recommend in the form of different, centralized services that can be called from diverse points in a research workflow to assure FAIR data publications. At the same time, Goble et al. cautioned about the current excess of curation web services and the difficulties of integrating them as useful and understandable workflows [16]. As an end-to-end data platform, DS presents a self-contained case with guided, interactive curation services to move, unzip, categorize, tag, check metadata and data completeness, and publish data through a simulation research workflow.
Within a platform in which data is managed both for conducting simulations and for publishing, each data design consideration is twofold. For example, in relation to how to organize data, active research and publication steps have different requirements. While conducting simulations, researchers organize their files as hierarchies, in many cases using naming conventions that are acted upon by the simulation software, and that structure gets adopted when they move into storage systems [17]. In turn, there is no consensus on how to organize simulation datasets for publication [18]. While hierarchical file arrangement is adequate for staging and computing simulations, it does little to support large data understandability and discovery. Moreover, there are different and sometimes conflicting notions, including issues of storage limitations, over which of the many files used as simulation inputs and those derived as outputs should be published [19,20,21,22]. In DesignSafe, we address these issues through a mix of policies and technical solutions. First, we identified which data and metadata components represent a complete data publication and considered the need to make available generous storage space. Simulation research modeling was the starting point to design functionalities that allow flexible data organization and description in the platform that combines the possibility to use the known folder system with categories and tags that point to the main structure of the dataset. Informed by the authors of [23], we created a browsing interface that allows navigation between different categories that point to the data provenance.

3. Research Methods and Development for Simulation Data Design

Our task was to design a data and metadata model as the foundation to build web-based interactive services for users to curate simulation data from the planning phase of their research and in tandem with conducting computational tasks in the DS platform. The resultant model had to facilitate a publication representation reflecting the unique structure of each curated simulation dataset. Note that this is a research and development (R&D) project. The stages and methods of the data design were: (1) gathering requirements through research narratives; (2) creating the data model; (3) mapping it to interactive interfaces to complete curation and publication activities; and (4) implementing those functions within high performance computing (HPC) infrastructure. We describe each stage in the following sections. Evaluation, which was iterative and a fundamental aspect of the R&D process, is described in Section 4.

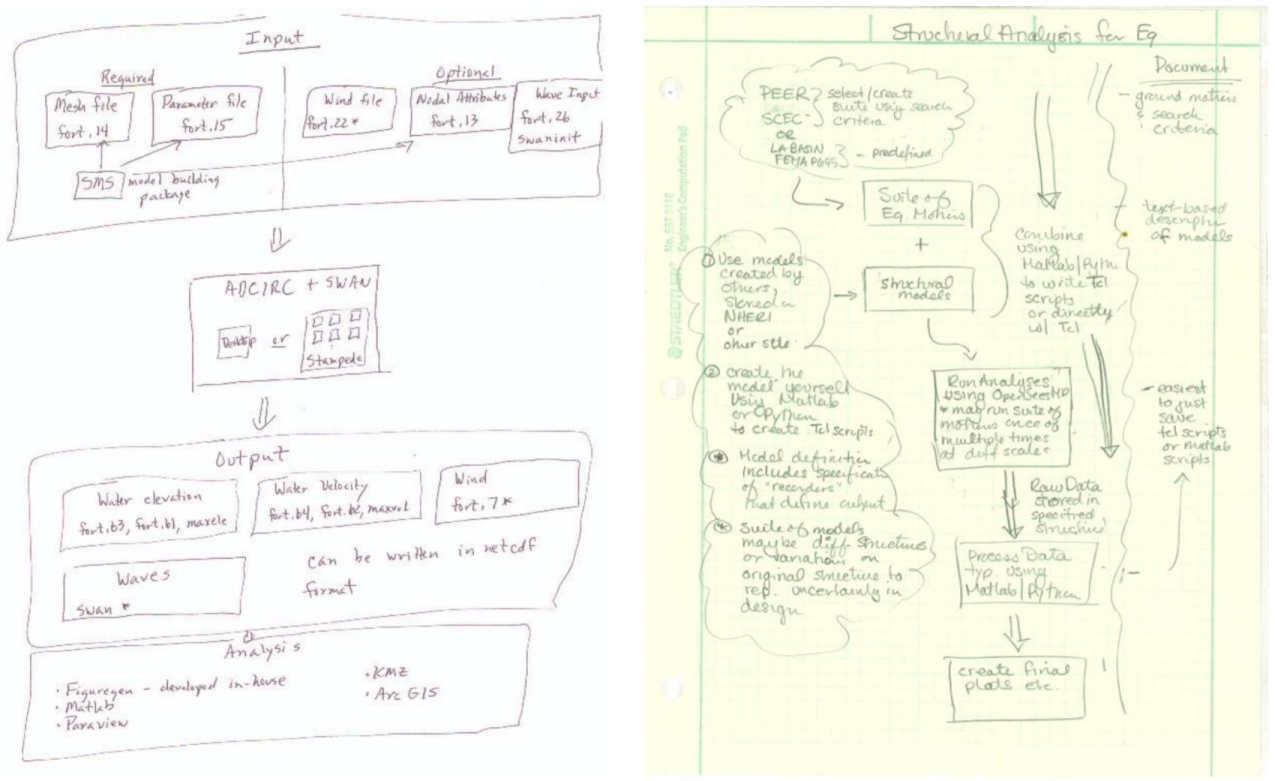
3.1. Simulation Research Narratives

As a first step, curators and developers needed to understand about simulation research, the tools involved, and which steps lead to results. We asked the simulation requirements experts to draw their research workflows, including steps, tools and data as the “narratives” that we would use to model simulation research in the natural hazards engineering space. Figure 1 shows two drawings corresponding to: a storm surge simulation to the left, and to a structural simulation to the right. Similar to these examples, each team member’s simulation workflow (we analyzed five) was different. Some could be completed in a desktop environment while others required HPC resources. Each used different software, and included terminology related to a specialty within natural hazards engineering (storm surge, wave, wind, structural, and geotechnical).
A data model underlies how data are organized and described in a system. It establishes how to group files, how to describe them, and their relationships. Faced with large numbers of files to organize and much to explain about the simulations, we designed a simulation data model to allow adding files to categories as big buckets [24]. To define relevant categories around which data and documentation could be grouped, we considered the commonalities in processes and terms found across the different simulation workflows contributed by the experts. The final categories represent processes in a simulation research lifecycle and the category label becomes provenance metadata about the files added to it, allowing consistent data organization across diverse simulation projects. The categories, their correspondence to research data and curation lifecycle stages [25,26], and their definitions are in Table 1.

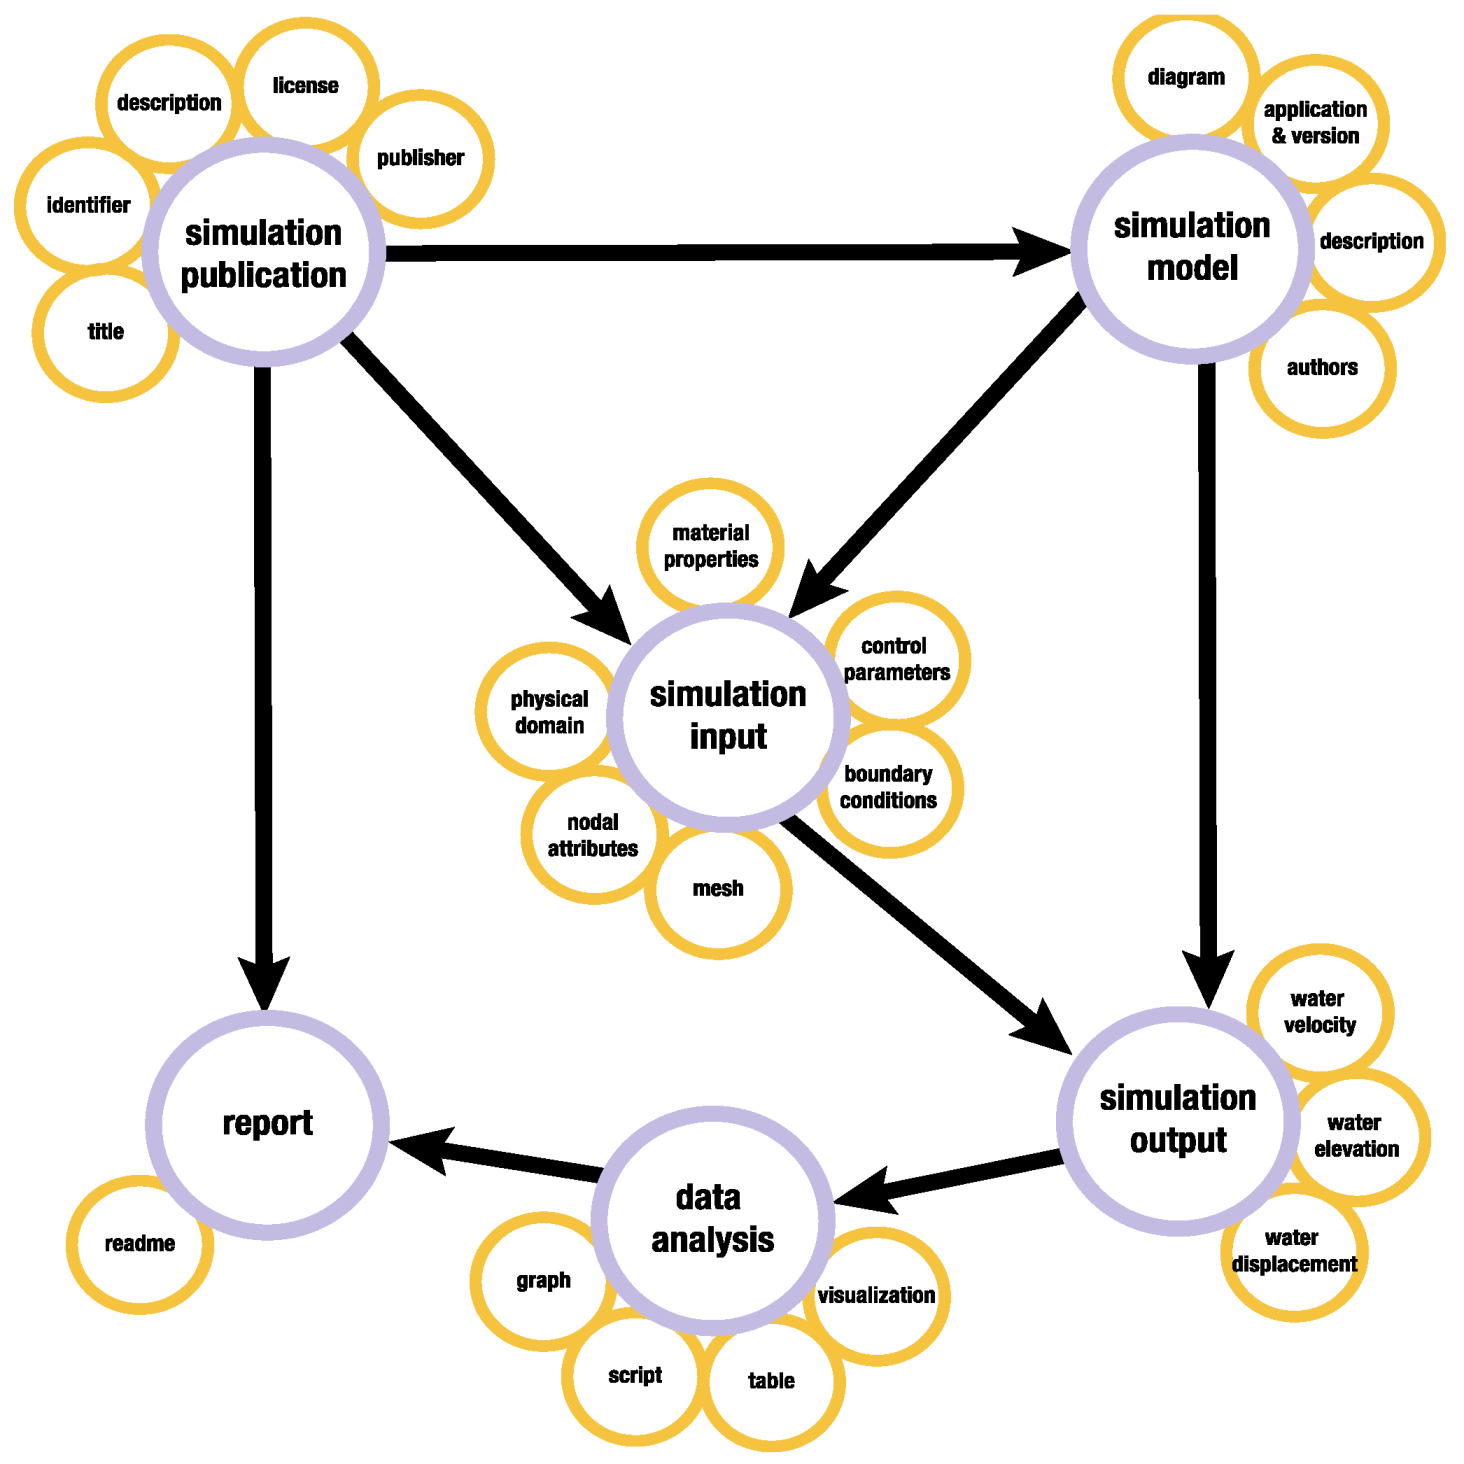
3.2. Modeling Simulation Workflows to Data Organization and Metadata

The model categories are generic enough to allow organizing simulation data from diverse scientific domains. To make them specific to natural hazards engineering, we appended associated descriptive terms identified by the experts to each one. In the interactive curation interface, these terms are implemented as metadata in web forms or as file tags. They are used to describe software and code, natural hazard type, inputs, outputs and other specific characteristics. Figure 2 shows the simulation data model with its categories and the relations between them, as well as examples of specific terms suggested by the storm-surge expert. Some relations between categories (simplified in this graph for purposes of illustration) are repeatable so that uses can represent simulations with different configurations (e.g., multiple inputs and one output, multiple models and corresponding inputs and outputs, etc.).
The model has policies that derive from what the experts told us about their workflows, as well as from curatorial best practices. For example, after learning that a simulation project may entail more than one simulation run with different parameters, we implemented the simulation model category as repeatable. The work in [27] is an example of a publication consisting of two simulations with two different models, corresponding inputs, outputs, and reports. Another policy relates to what constitutes a complete simulation data publication and how those are reinforced during the publication process. After much discussion, the simulation requirements team and the curators agreed that a complete publication should have data and or metadata for the simulation model, data and metadata for input and output categories, and that the analysis category would not be required. At first, the report category was recommended but not required. However, after reviewing the first publications, we decided to require a report so that the simulation method is clear to users. Reports, which often are written as help me files, are a common practice amongst the simulation community. In addition, a related published paper can be added using the Related Work metadata element in the simulation publication category (see Figure 10). The way in which policies are reinforced during the publication process is that the publication cannot be completed if required files or metadata have not been added. The interface directs users to make corrections.

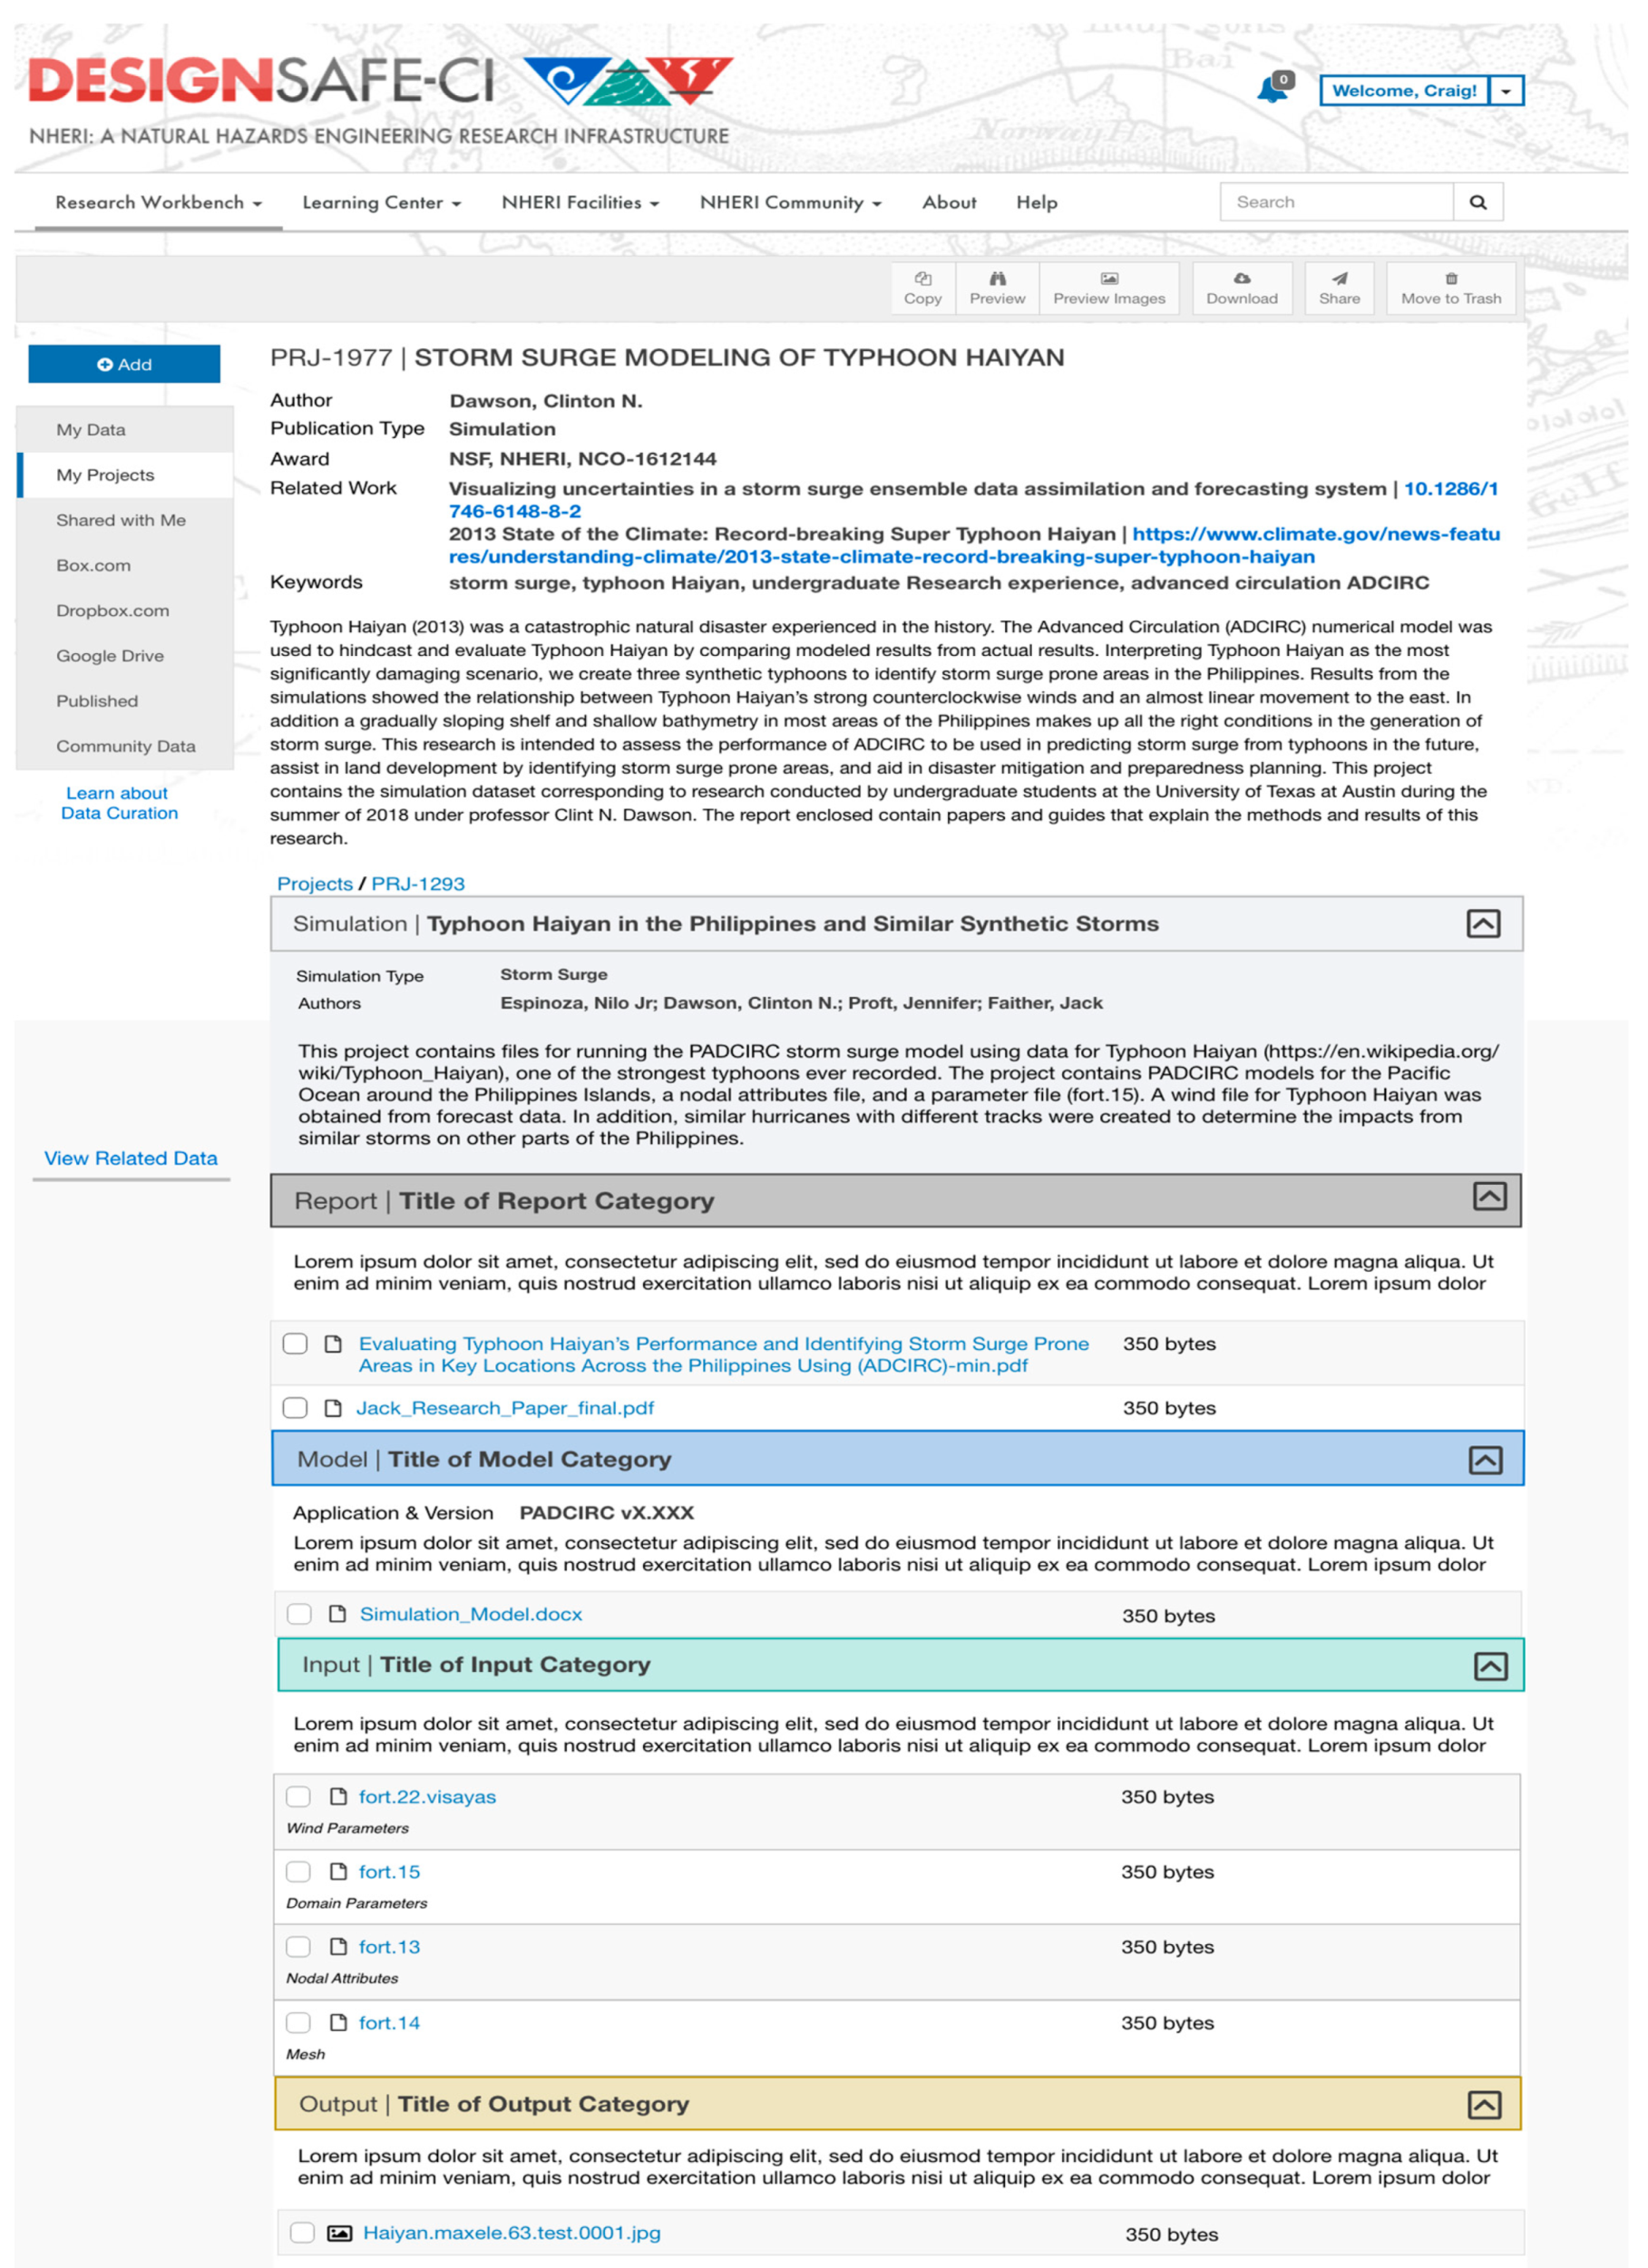
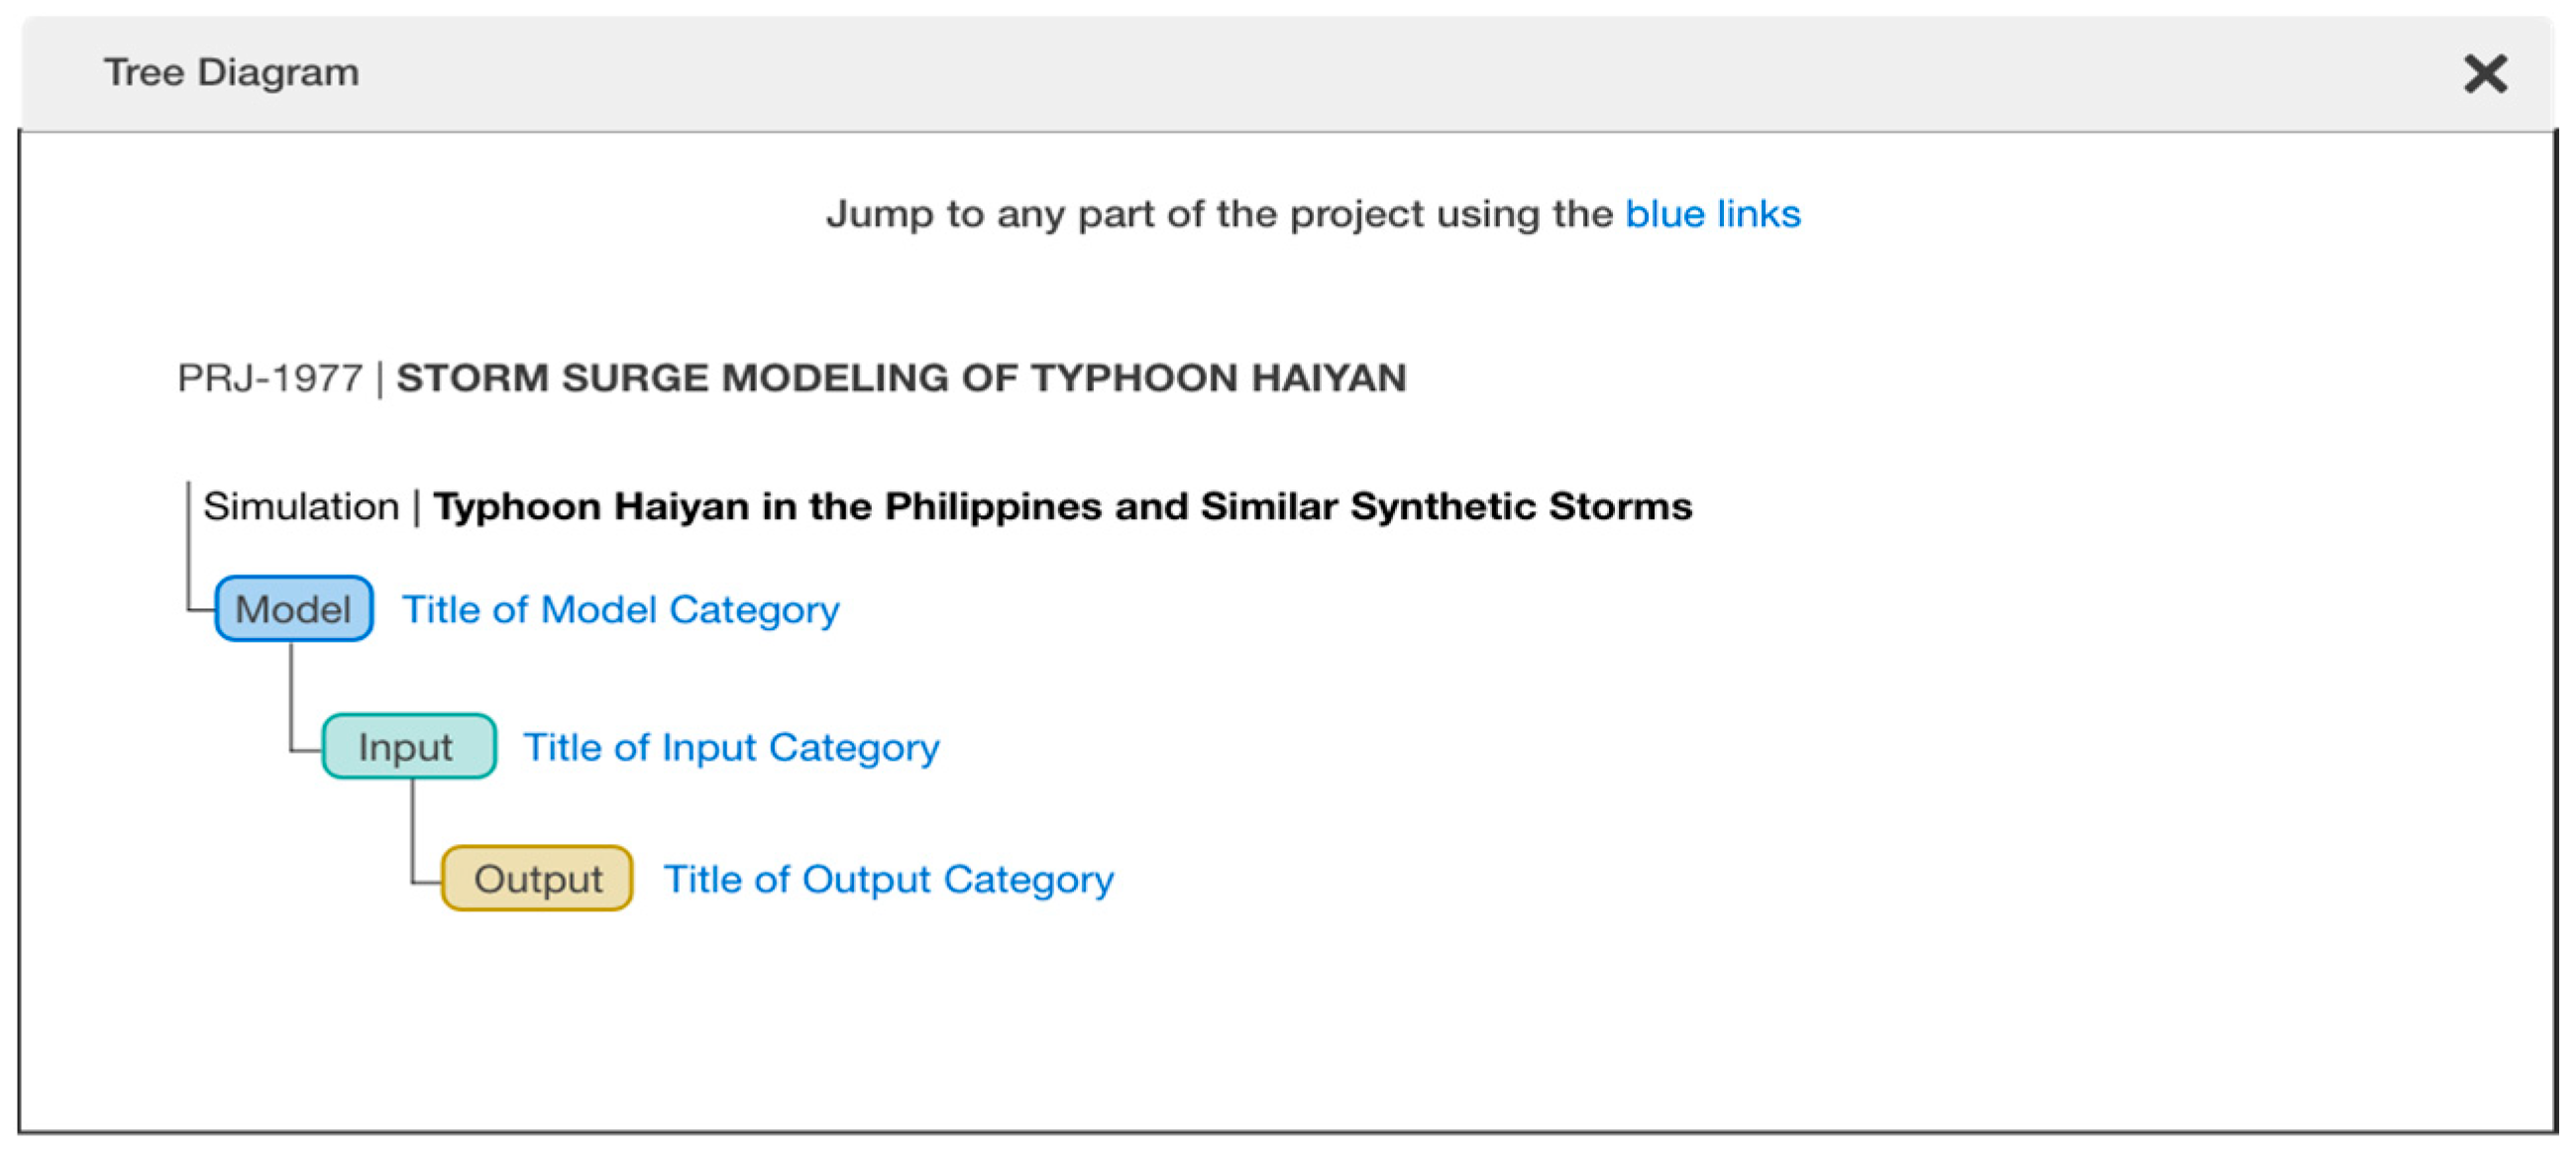
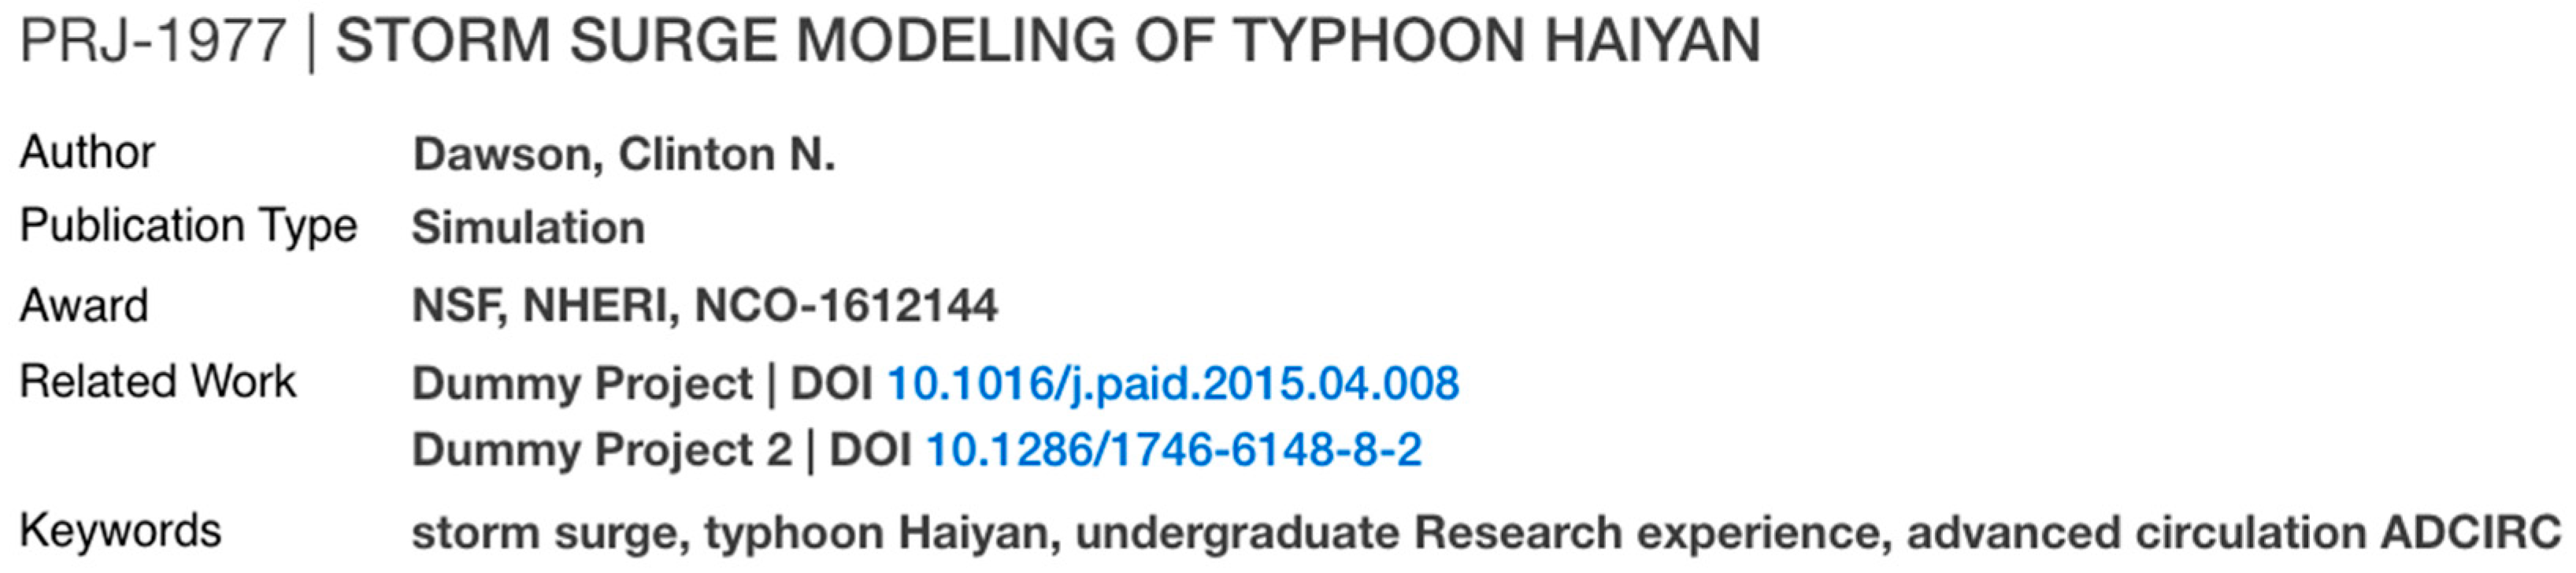
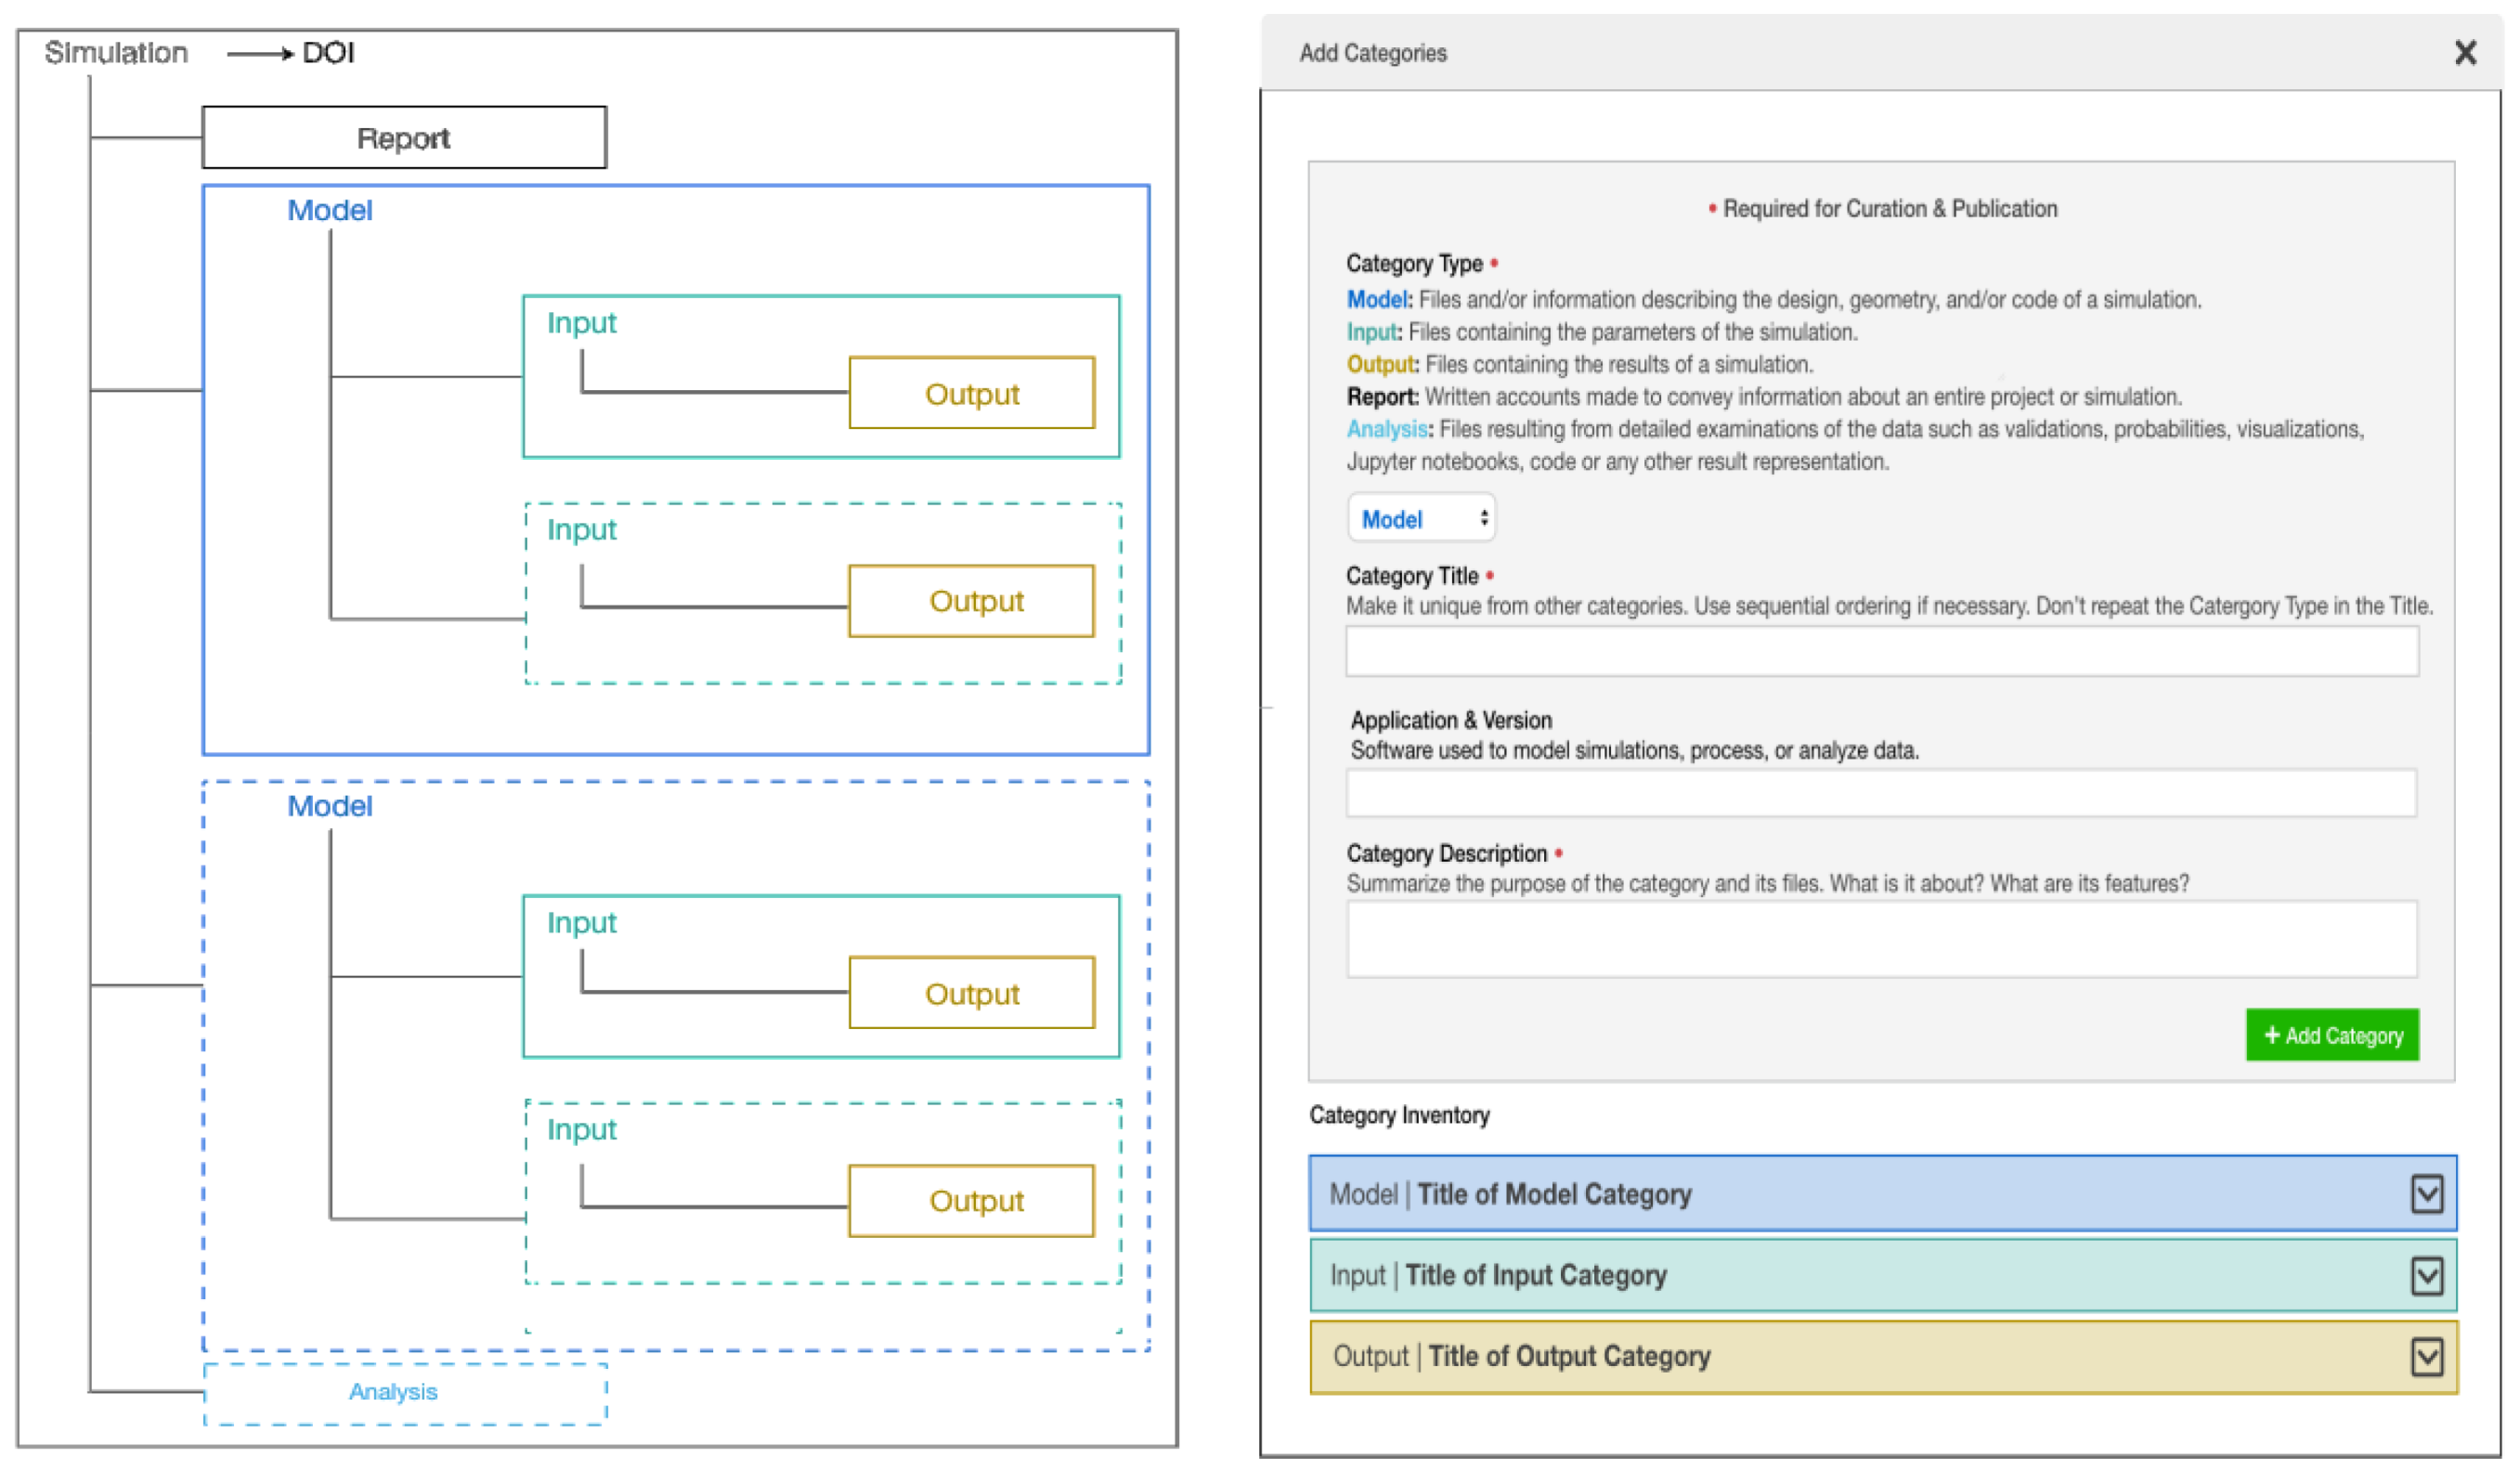
3.3. Mapping the Model to Interactive Interfaces

The data and metadata model is the basis for designing the interface mockups, and later for building the interactive curation interface. In our work, mockups have diverse design and evaluation functions. Through mockups, we contextualize the categories in relation to curation steps. The steps that we designed are: create project, add simulations, add categories, and relate data (see Figure 3). During the interface design, we created the flow of how users follow the steps, juggled the location of categories and metadata terms, and designed how data and metadata is represented in the publication landing page. To validate the fitness of the data design, we mapped real simulation data cases to the different steps in the mockups. Through them, we showed the experts what the model looks like implemented as a GUI, how it works, and how it fits their data. Once the mockups were reviewed, we built the first iteration of the curation and publication interface. We monitored user adoption through their data publications, the users’ questions recorded in help tickets, and during virtual office hours in which we helped users through video chat. Based on all the feedback, which is summarized in Section 4, we designed enhancements and modified the mockups accordingly. Working with USEX consultants [28], the enhanced interface scenarios where tested with users to determine which new ideas were understood successfully, and which needed to be rethought. The enhanced functions went through three usability testing iterations before determining the final version to be implemented.2 The illustrations in the following sections correspond to the enhancements made after the first interface was released.

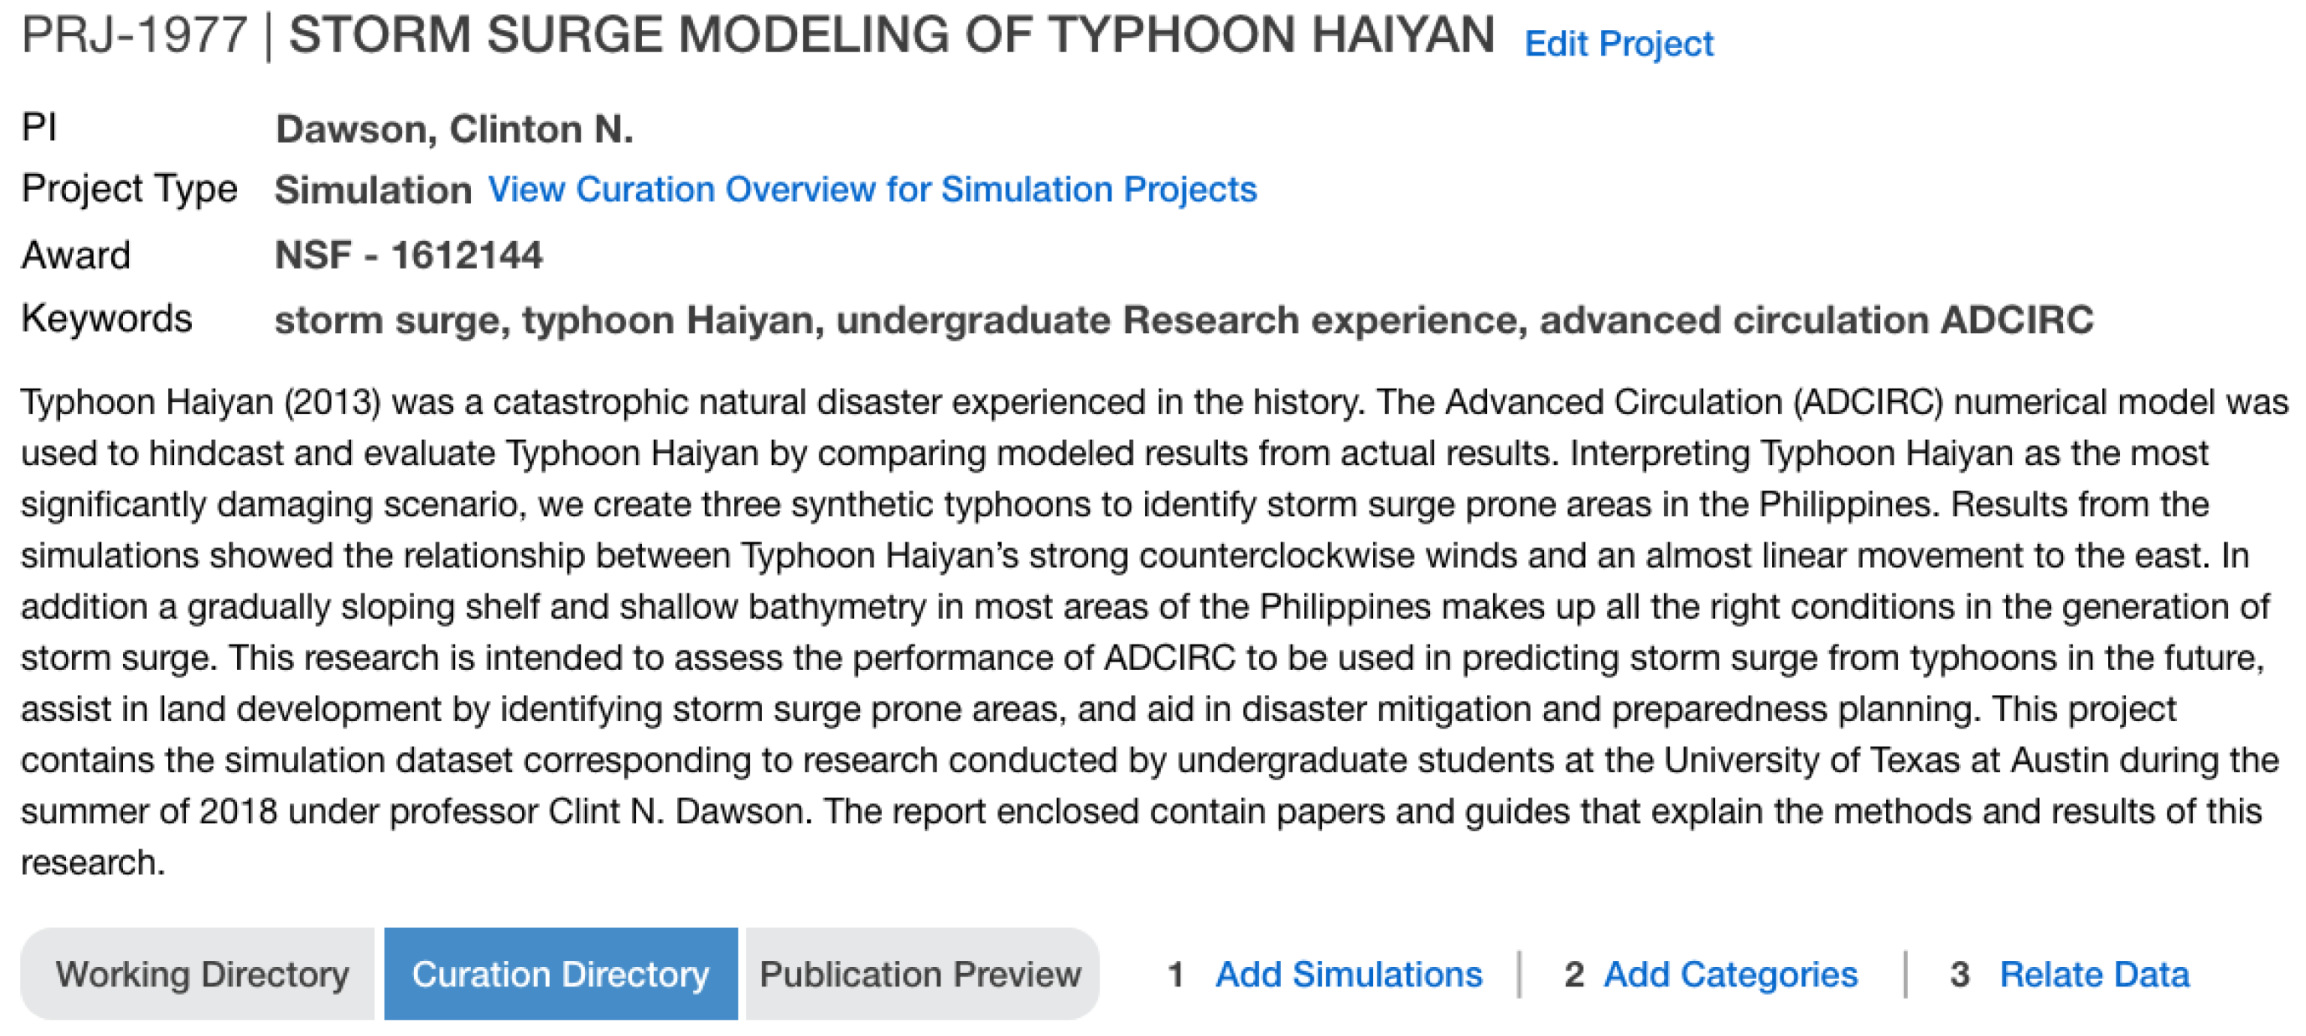
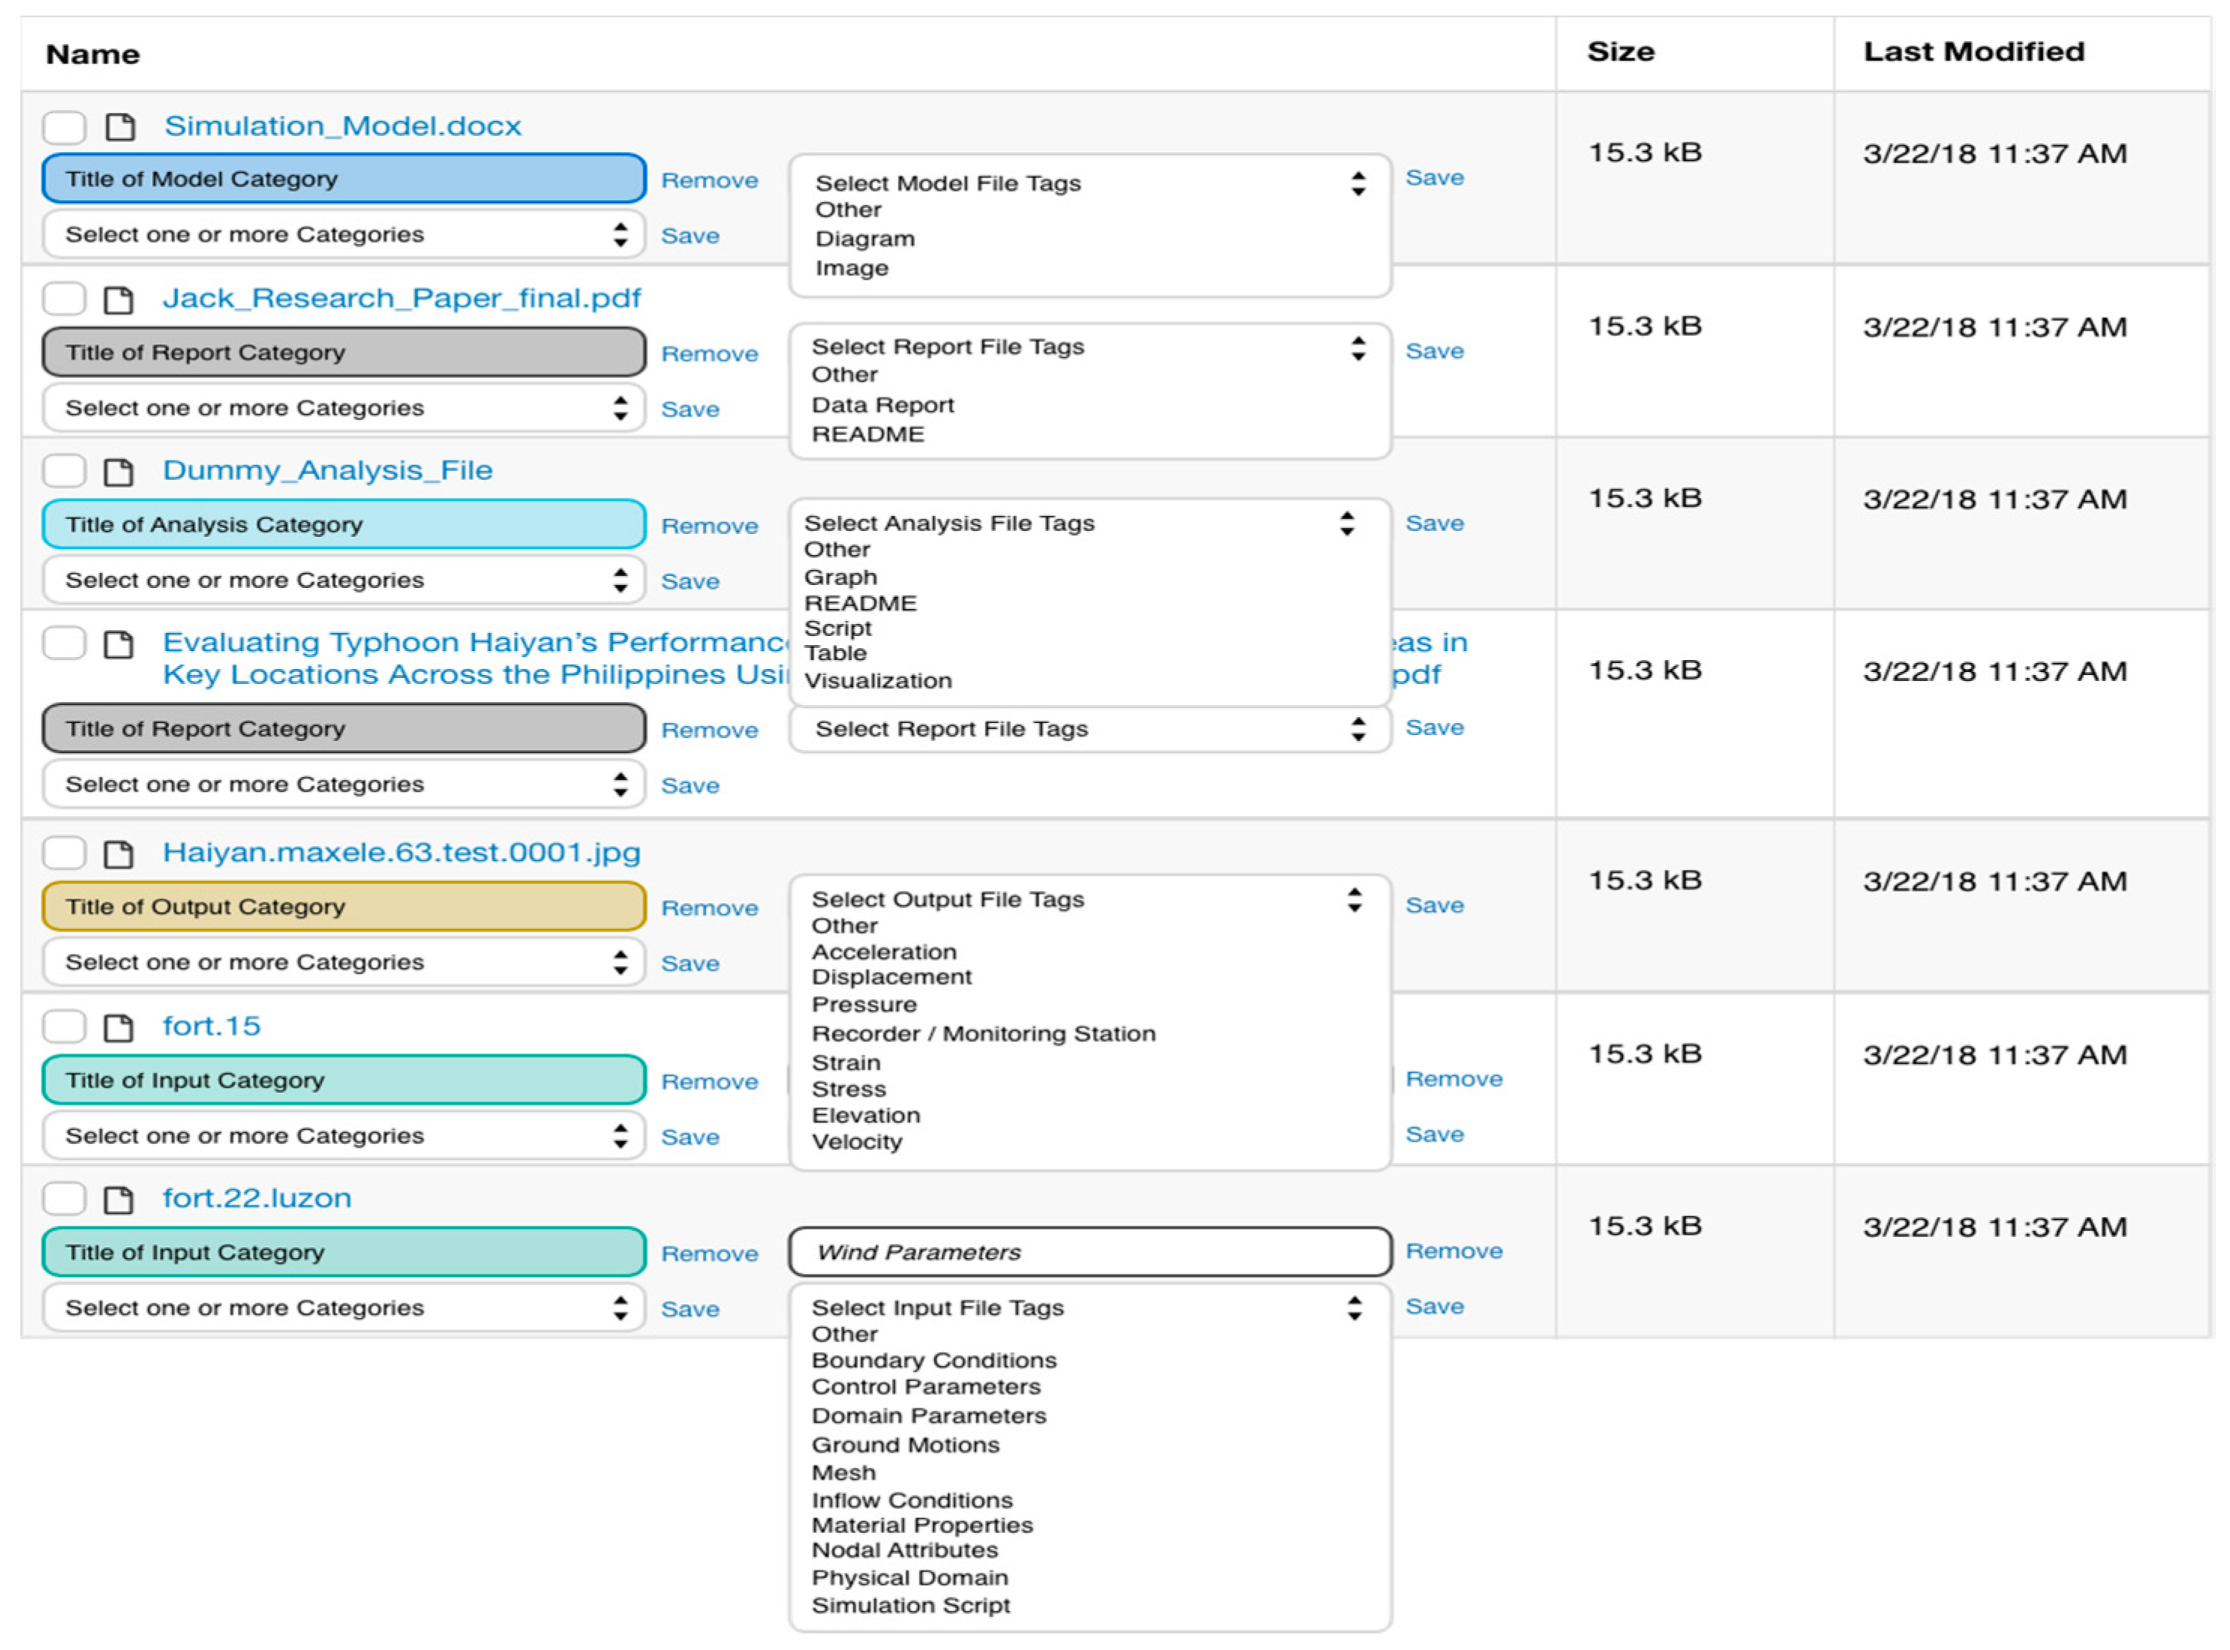
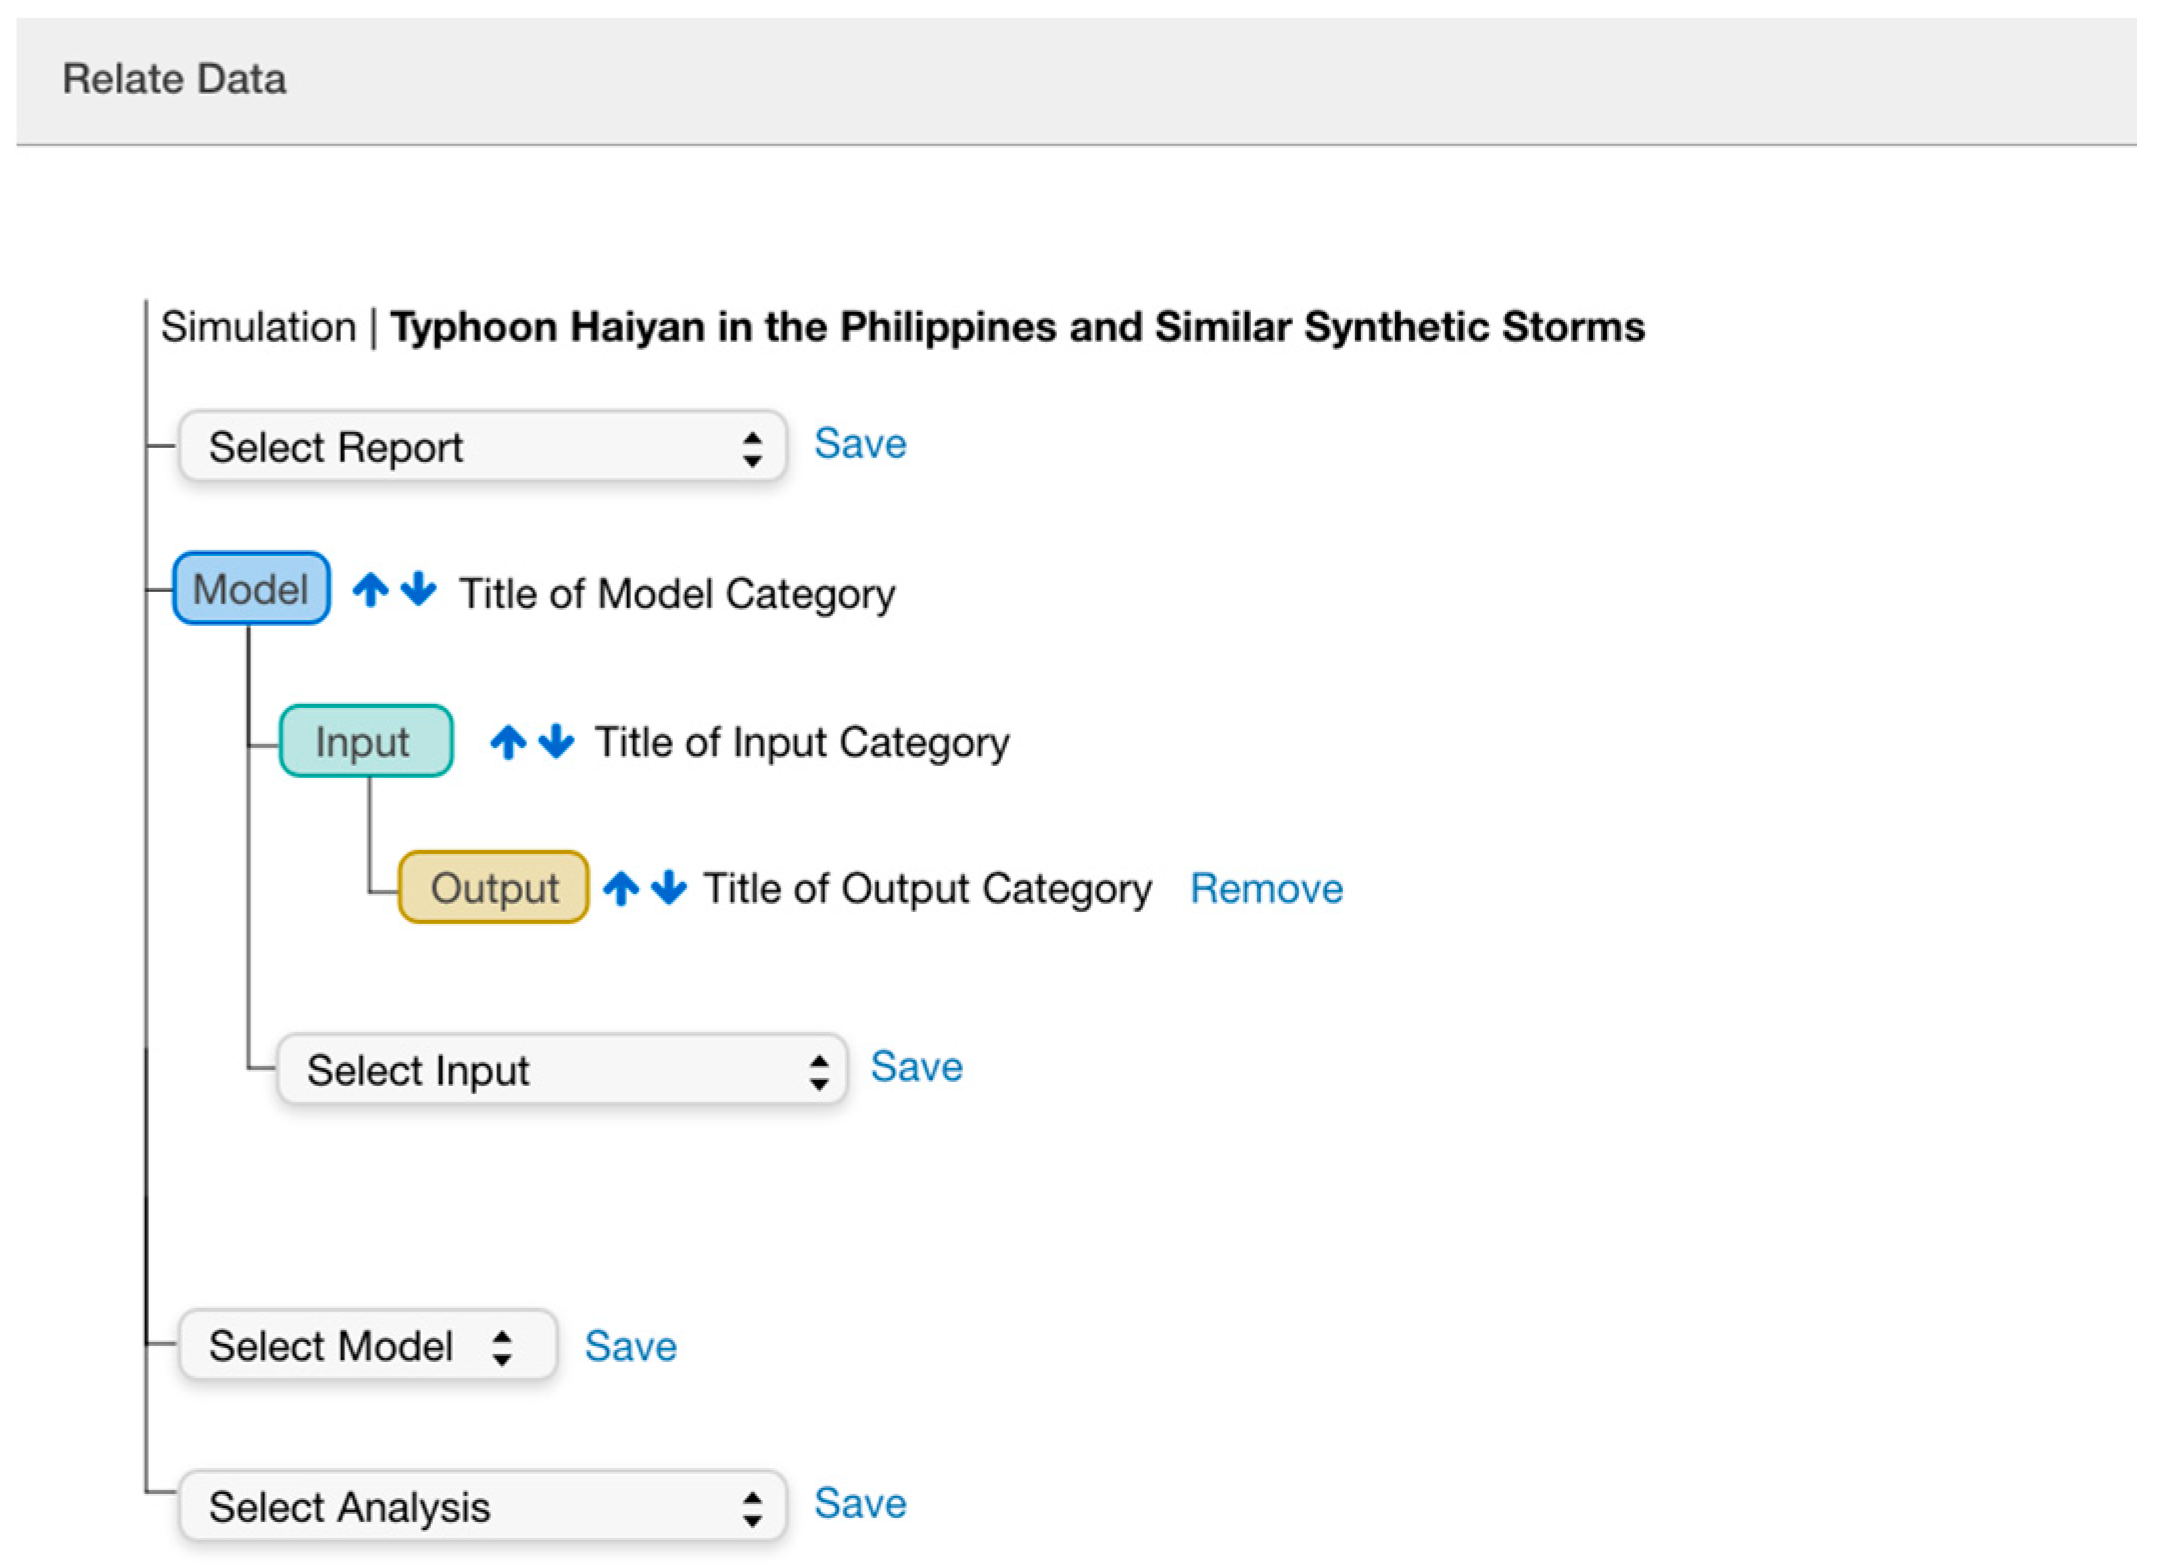
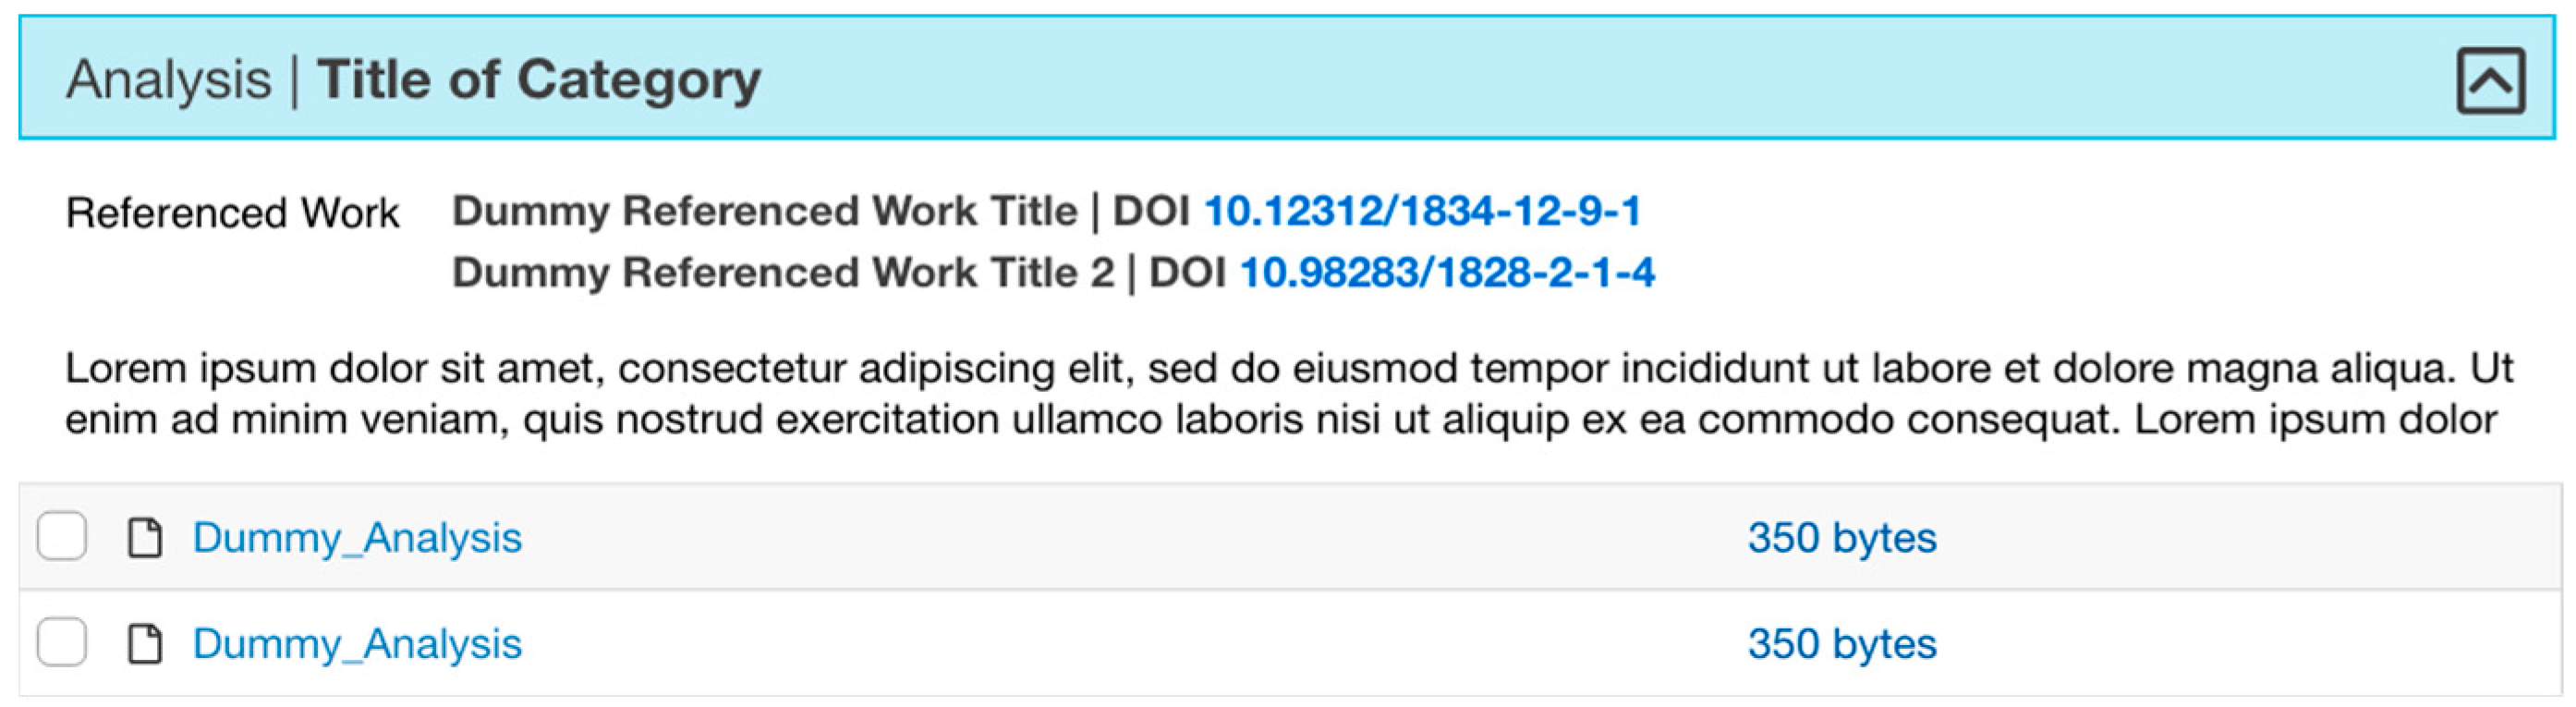
3.3.1. Interfaces for Interactive Lifecycle Curation

As detailed in [1], DS has different workspaces. We revisit them to provide context to how curation is accomplished in relation to other lifecycle research tasks including conducting the simulations and analyzing the results. In My Data users work individually; in My Project they share, curate, and publish data, and in the Workspace they use apps installed in HPC resources to conduct simulations and data analysis. Across the workspaces data can be uploaded, moved, copied, and downloaded to enable data transitions between active research, curation, and publication stages. The following is an example of how this happens. In the Workspace, users can run numerous simulation applications by filling out a web form and submitting the job to an HPC system. The Input directory and Job output archive location are passed through this form by selecting the path to and from the data source in My Data or My Projects. If the output archive location is selected to be within My Project space, upon the completion of the job, a directory with the name of the user who submitted the job will be created to inform other collaborators of the simulation completion. A copy of the input variables will be archived in that directory along with the simulation outputs. A research team should be able to select, categorize and describe their data in My Projects as soon as a job is finalized or at a later point. For an experienced user, completing the curation and publication process may take as short as 15 min using the simulation interface available.
Curation and publication activities happen in My Project where users can add team members and create and edit general information about the project including authors, description, keywords, funding award, rights, and related works. Figure 3 shows its three distinct areas: Working Directory, Curation Directory (highlighted as the one in use), and Publication View. Working and Curation directories are different views of the same data. Working is for teams who need a shared space to move data to and from My Data or the Workspace, where data are computed. Curation has overlays and functionalities to select, categorize, tag, describe, and relate data. All of these activities can be completed at any point in the research lifecycle process. As data are being curated, the Publication View allows users to preview how they will be represented as a published project.
Large datasets offer myriad management challenges for users that have to organize and describe many files. We designed the interactivities to make file management efficient. We begin by guiding users through the curation process (see Figure 3). The first step, Adding Simulations, allows creating as many simulations as each project requires and describing them. In the second step, illustrated in Figure 4 and Figure 5, users create the categories for the simulation (Figure 4), and select the files or folders that go in each of them (Figure 5). They can also use tags to describe their selection. Onboarding help is included at each step, such as providing examples of how data can be organized, explaining what each category means, and tips on how to create titles and write descriptions. This on the spot guidance prevents users from leaving the curation interface in search of help.
Specially, the input and output categories may contain numerous files. Using shortcuts (three clicks) in the curation overlay, users can select multiple files at once and assign all of them to a category or to a tag, eliminating the extra work of checking and describing file by file. The drop-down menus to select tags and describe files are adjacent to each file, requiring less cursor movement through the interface. The presence of lists of tag terms selected by experts provide clues to other users as to which data files are useful for publication.
Once users create and add files to categories, the last step, Relate Data, allows them to associate inputs, outputs, analysis, and reports (see Figure 6). This step is key to how data will be represented as a publication. Simultaneously, users can check how the structure and description of their dataset is rendered in the Publication View. This allows going back and forth and making changes at different times in the process.

3.3.2. Representation of Large Datasets

Once curation is concluded, users can proceed to publish their data. The publication pipeline has functions to review and edit data and metadata, order authors, select a license, agree to publish and obtain a DOI. To distinguish between active research and publication, some information is presented differently in the publication landing page. While in My Project researchers are principal investigators or team members, in the landing page they are listed as authors in the order they decide. Information about licenses, grants, and links to related publications or projects is also included.
We introduce two ways for representing data publications: browsing and tree navigation (see Figure 7, Figure 8 and Figure 9). Simulation datasets can be very large to fit in one screen, causing the user to scroll too much. The browsing view presents the dataset with all the metadata and access to the files in a nested accordion view in which each segment/tab of the accordion is a category. The accordion view allows a general understanding of the project’s structure. Users can expand one tab at a time or view the entire dataset (Figure 7). Within each category, the nesting format shows the category descriptions, corresponding files, and the folder or file tags that illustrate and clarify their contents (Figure 8). A complementary tree view (in Figure 9) provides quick navigation capabilities. Clicking on a category title lands on the corresponding section of the simulation browsing view. Both views enable navigating the dataset in relation to the files’ provenance and in context with the complete structure of a project [11,23].
One of the requirements in the design was that researchers could continue working on their projects after publishing data, as they may need to add new simulations to the same project over time. In DS, users can continue using their My Project space and none of this affects what has been published, which remains static.

3.4. Lifecycle Curation within an HPC Infrastructure

Key front- and backend computing resources and software support lifecycle data curation. The site is developed in Django, and file management functions (ingest, transfers, deletions, etc.) as well as scheduling computational jobs are done through AGAVE [29]. AGAVE also manages the metadata, which can be exported in JSON format. Stampede 2 and Lonestar 5 are the HPC systems that support simulations [30,31]. Users may take advantage of the resources (e.g., selection of up to 12 nodes for a PADCIRC simulation) free of charge through the DesignSafe Workspace. However, there are cases where these resources are not sufficient for large simulations. In such cases, users can request an allocation on TACC’s HPC systems, whereby they will be able to login directly to the selected system to run their simulations. Active and published data are stored in Corral, a geographically replicated high performance storage resource [32]. Currently, DesignSafe has an allocation of 300 TB (5% of total Corral capacity), which allows supporting unlimited space for users through research activities including publishing large datasets. We mint DOIs through an automated pipeline to DataCite Fabrica [33], a service that is supported by UT Libraries.
For authenticity and integrity purposes, all published data in DS are moved to a Fedora 4 repository [34], which at this point functions as a dark archive. In the future, our goal is to move the metadata to the repository as well, and to expose the RDF and enable queries to recover data in relation to the model categories (e.g., recover all models, all input files for simulations conducted with a specific type of community code, etc.). We have done the preliminary work to map our data models to Dublin Core, PROV and to the resource container structure of Fedora [35]. Integration between Django and all services is done through Restful API calls.

4. Discussion: Evaluation of the Interactive Curation and Representation Interfaces

The data design process was iterative and done in collaboration with the simulation requirements team experts. We generated multiple opportunities to make changes to the interactive mockups based on their feedback and on the real data mapping cases. Evaluation became particularly informative once the first interface was implemented and a number of users had published datasets. We observed this first group of simulations focusing on how users categorized their data, the types of files they selected to publish, and how they described them. With all this information, we decided what aspects of the data and metadata model were suitable, and what to modify. Next, we present the outstanding issues that emerged during the observations, each illustrated by a simulation publication, and describe how we addressed them in the interface enhancements. The solutions are reflected in the figures that illustrate Section 3.3, and in new simulation publications.
The category simulation model was interpreted differently by users. While some added graphs, formulas, and map files [36] to the category (which mapped with what we intended for the category), a majority had a hard time figuring out which files to include. Users from the latter group resorted to describing the software that contains the model [37], included a final report with a detailed explanation about the project, and one of them categorized the same readme file as simulation model and as report [38]. A publication in which the user included a database belonging to a Federal Emergency Management Agency (FEMA) hydrography model confirmed that the user considered the input files as part of the simulation model [39,40]. Through further discussions with the experts, we concluded that the simulation model is both the concept of the simulation and the files required to run it. Currently, the simulation model category is still required as a space to clarify the specifics of the model used and how it was run, especially for projects with more than one model configuration/parameters. However, we removed the requirement to upload files, which can be added to the input category. We will continue monitoring usage as we consider further changes to the simulation model category, including merging with simulation input and facilitating a description of the model as an abstract at the simulation project level.
The requirement to publish both input and output files did not present issues to the users, and the experts agreed that a simulation publication is complete when it is clear what files are used to run it and its outputs. However, we noted that users may not publish every simulation run but those they want to highlight, and that relations between inputs and outputs are not necessarily one to one. In some simulations, each input file may have a corresponding output file, while in others there could be multiple input files and one output [41]. As referred in the literary review, we corroborated that a user conceived the publication as an extension of how he computed the data and organized the files following the same structure in which the simulation was run [38]. A more confusing aspect is that, depending on the software used to conduct the simulation, all input files may have the same file name, although their contents and roles are different [37]. Our data design is flexible to allow users to organize their files as they see fit. Categorization allows distinguishing inputs from outputs, and using file tags allow describing their contents, enhancing the understandability of the simulation results (see Figure 8 and Figure 9).
Simulations often reuse data as input files [37,39,41]. Many of these data are open, from agencies such as FEMA and NOAA [40,42]. To facilitate citing reused data in the landing pages, we implemented the Related Work metadata element, which allows inserting citations for reused data with respective DOIs, or with a URL when available (see Figure 10). Data reuse is related to data licensing. We offer different licenses for users to choose from and provide explanations about the impact of their licenses in their new publications in a Frequently Asked Questions section whose link is available throughout the curation and publication interfaces.
To simulation users, the concept of a static data publication is not as familiar as the process of publishing a paper. Frequently, users ask the curator if after publication they will be able to amend data or metadata, upload more documentation, or publish a new simulation under the same project. While we remind them about data permanence, and authenticity, we acknowledge the need for data publications to be managed over time for data versioning and corresponding metadata changes and we are currently working on functionalities that enable both.
Lastly, we noticed inconsistency in the clarity and depth of the projects’ descriptions. Depending on the level of expertise of the reader, one or more points can be unclear or too detailed. Discussing with the experts, they told us that they direct their data descriptions to other researchers or professionals which understand acronyms and terminology. To enable a broader public understanding of the research, we included at hand, simple suggestions about how to write each category description (see Figure 4) and further guidance in our tutorials to use a language that engages both professionals and a broader audience, including hints of how the data can be reused. For users requiring the detailed explanations, we decided to make the report or help-me file a required category. The goal is that data consumers achieve an overall understanding of the project through the publication representation that invites them to dig deeper into previewing the files and reading the report if the project fits their interest.
We came full circle after releasing the interface enhancements. The work in [43] is a simulation data publication with the improved curation interactivities. This is a very large project entailing seven bridge classes and 7000 realizations, each with an output of 10–12 files. The project’s goal was to achieve statistical highly parametrized bridge models that can be run in other scenarios (use of input data), and for using the results in ML applications (use of output data). This reuse scenario required publishing all the simulation components, including inputs, code, and the large number of outputs. In this case, the simulation model category was used to include model files that are common to all the simulation runs. The possibility of using both folder structure and categorization aided the organization and clarity of presentation of the dataset. Curation and publication were facilitated by the fact that all the processes, including planning documentation, computing, interactive curation and publication, were completed in the platform. The dataset representation in the landing page including the indentation and the tree view, provide an overview of the publication clearly showing the relations between the categories (model, inputs and outputs) for purposes of understanding the provenance of each realization results.

5. Conclusions and Discussions of Future Work

This work contributes to the fields of curation and open repositories by introducing a generalizable simulation data and metadata model, interactive curation services, and a navigable data representation that focuses on data structure and provenance. It also advances natural hazards engineering that did not have a data model and functionalities to organize data from simulations which is one of the main research methods used in the space. Without much precedent of simulation data curation services in open repositories, we modeled simulation research, designed curation interactions and interfaces based on the model, and evaluated the results through use cases and observations of data publications in DesignSafe. Most open repositories receive data at the end of the research lifecycle, and their interactive functions are limited to uploading files and filling metadata forms. Our curation service is integrated with data management and an HPC environment for which we balanced technology and professional culture. We completed a data design process that included opportunities for a multidisciplinary team to learn about simulation research workflows and about data curation. Demonstrating curation activities for purposes of obtaining feedback from simulation experts required interactive interface mock ups to visualize the steps involved in data curation. The data model and its interface implementation are flexible, allowing different simulation project configurations, while assuring a consistent representation across simulation data publications. We suggest that the basic model, with the option of building layers to describe specific characteristics, can be useful to simulations in many domains. In the publication representation, we emphasized making the structure of the dataset self-explainable and navigable. Versioning features and the possibility to amend certain metadata fields for error correction after publication have been prototyped and are in line for development.
In the self-publishing context of open repositories, clarity and completeness of published datasets are often irregular. We mentioned that there are conflicting notions about what constitutes a complete simulation publication, and much speculation about how large could those be. Our policy about what constitutes a complete simulation data publication is in line with a recent recommendation that it is the role of the experts to decide what to keep from a simulation project [44]. As a team, we decided that users should be able to publish projects that include documentation of the simulation model and clearly identify inputs and outputs. Through the first release of the interface, we observed how users interpreted the data and metadata model as they were using it to publish data. Accordingly, we made changes during the first year of production.
Providing a model and policies for organizing files, and consistent interfaces for navigation and browsing across simulation projects is a step forward. Our data model emphasizes broad categories to accommodate and structure projects with many realizations/runs and large numbers of files [43]. We also introduced facilities to make categorization and tagging less time consuming, but we already know that those are not enough as users do not want to manually tag thousands of files, even if they can do it in bulk. Thus, we note key research gaps such as the design of big data interfaces, and to make curation of large datasets semi-automated and more efficient. To better understand how to present big datasets to users, in collaboration with our USEX consultants, we will conduct studies focusing on understandability of our large simulation data representations, including aspects of accessibility and data reuse. We also see promises in the prospect of using ontologies based on the data model and machine learning to categorize files for curation purposes, and plan to formalize a research project and pursue funding for it. As simulation data publications increase, our plan is to continue evaluating the fitness of our design. We will continue tracking the amounts and types of simulation data that the researchers select to publish to inform publication policies and share this information with the engineering and curation communities.

Author Contributions

Conceptualization, M.E.; USEx Design, C.J.; Implementation, J.B.-C.; and Validation, P.A., M.S.-M. and C.N.D.

Funding

This research was funded by the National Science Foundation grant number 1520817.

Conflicts of Interest

The authors declare no conflict of interest. The funders had no role in the design of the study; in the collection, analyses, or interpretation of data; in the writing of the manuscript, and in the decision to publish the results.

References

  1. Rathje, E.M.; Dawson, C.; Padgett, J.E.; Pinelli, J.P.; Stanzione, D.; Adair, A.; Arduino, P.; Brandenberg, S.J.; Cockerill, T.; Dey, C.; et al. DesignSafe: A New Cyberinfrastructure for Natural Hazards Engineering. Nat. Hazards Rev. 2017. [Google Scholar] [CrossRef]
  2. Pejša, S.; Dyke, S.J.; Hacker, T.J. Building Infrastructure for Preservation and Publication of Earthquake Engineering Research Data. Int. J. Digit. Curation 2014, 9, 83–97. [Google Scholar] [CrossRef]
  3. Beagrie, N. Digital Curation for Science, Digital Libraries, and Individuals. Int. J. Digit. Curation 2008, 1, 3–16. [Google Scholar] [CrossRef]
  4. Esteva, M.; Brandenburg, S.; Eslami, M.; Adari, A.; Kulasekaran, S. Modelling Natural Hazards Engineering Data to Cyberinfrastructure. In Proceedings of the SciDataCon, Denver, CO, USA, 11–13 September 2016. [Google Scholar] [CrossRef]
  5. The Dataverse Project—Dataverse. Org. Available online: https://dataverse.org/home (accessed on 22 May 2019).
  6. GRIIDC|Home. Available online: https://data.gulfresearchinitiative.org/ (accessed on 22 May 2019).
  7. The Organization—Dryad. Available online: https://datadryad.org/pages/organization (accessed on 18 March 2019).
  8. Merchant, N.; Lyons, E.; Goff, S.; Vaughn, M.; Ware, D.; Micklos, D.; Antin, P. The iPlant Collaborative: Cyberinfrastructure for Enabling Data to Discovery for the Life Sciences. PLoS Biol. 2016, 14, 1002342. [Google Scholar] [CrossRef] [PubMed]
  9. DataONE. Available online: https://www.dataone.org/ (accessed on 22 May 2019).
  10. Matthews, B.; Sufi, S.; Flannery, D.; Lerusse, L.; Griffin, T.; Cleaves, M.; Kleese, K. Using a Core Scientific Metadata Model in Large-Scale Facilities. IJDC 2010, 5, 106–118. [Google Scholar] [CrossRef]
  11. Prodanovic, M.; Esteva, M.; Hanlon, M.; Nanda, G.; Agarwal, P. Digital Rocks Portal: A Repository for Porous Media Images. 2015. Available online: http://dx.doi.org/10.17612/P7CC7K (accessed on 20 March 2019).
  12. Datacenterhub—Datacenterhub. Available online: https://datacenterhub.org/aboutus (accessed on 22 May 2019).
  13. Maria, E.; Craig, J.; Josue, B.-C. Designing and Building Interactive Curation Pipelines for Natural Hazards in Engineering Data. Int. J. Digit. Curation 2018. [Google Scholar] [CrossRef]
  14. Esteva, M.; Walls, R.L.; Magill, A.B.; Xu, W.; Huang, R.; Carson, J.; Song, J. Identifier Services: Modeling and Implementing Distributed Data Management in Cyberinfrastructure. Data Inf. Manag. 2019, 1. [Google Scholar] [CrossRef]
  15. Dallmeier-Tiessen, S.; Khodiyar, V.; Murphy, F.; Nurnberger, A.; Raymond, L.; Whyte, A. Connecting Data Publication to the Research Workflow: A Preliminary Analysis. Int. J. Digit. Curation 2017, 12, 88–105. [Google Scholar] [CrossRef]
  16. Goble, C.; Stevens, R.; Hull, D.; Wolstencroft, K.; Lopez, R. Data Curation + Process Curation=data Integration + Science. Brief. Bioinform. 2008, 9, 506–517. [Google Scholar] [CrossRef] [PubMed]
  17. Gray, J.; Liu, D.T.; Nieto-Santisteban, M.; Szalay, A.; DeWitt, D.D.; Heber, G. Scientific Data Management in the Coming Decade. ACM Sigmod Rec. 2005, 34, 34–41. [Google Scholar] [CrossRef]
  18. Frey, J. Curation of Laboratory Experimental Data as Part of the Overall Data Lifecycle. Int. J. Digit. Curation 2008, 3. [Google Scholar] [CrossRef]
  19. Gray, J.; Szalay, A.S.; Thakar, A.R.; Stoughton, C.; Berg, J.V. Online Scientific Data Curation, Publication, and Archiving. In Proceedings SPIE 4846, Virtual Observatories; SPIE Digital Library: Bellingham, WA, USA, 16 December 2002. [Google Scholar]
  20. Wynholds, L.A.; Wallis, J.C.; Borgman, C.L.; Sands, A.; Traweek, S. Data, Data Use, and Scientific Inquiry: Two Case Studies of Data Practices. In Proceedings of the 12th ACM/IEEE-CS joint conference on Digital Libraries (JCDL ‘12), Washington, DC, USA, 10–14 June 2012; pp. 19–22. [Google Scholar] [CrossRef]
  21. Beckles, Z.; Debra Hiom, S.G.; Kirsty, M.; Kellie, S.; Damian, S. Disciplinary Data Publication Guides. Int. J. Digit. Curation 2018, 13. [Google Scholar] [CrossRef]
  22. NSF Arctic Data Center Data Submission Guidelines. Guidelines for Large Models. Available online: https://arcticdata.io/submit/ (accessed on 28 May 2019).
  23. Sandusky, R.J. Computational Provenance: DataONE and Implications for Cultural Heritage Institutions. In Proceedings of the 2016 IEEE International Conference on Big Data (Big Data), Washington, DC, USA, 5–8 December 2016; pp. 3266–3271. [Google Scholar] [CrossRef]
  24. Cisco, S. Big Buckets for Simplifying Records Retention Schedules. Inf. Manag. J. 2008, 42, S3. [Google Scholar]
  25. Data Life Cycle. DataONE. Available online: https://www.dataone.org/data-life-cycle (accessed on 24 May 2019).
  26. DCC Curation Lifecycle Model. Digital Curation Centre. Available online: http://www.dcc.ac.uk/resources/curation-lifecycle-model (accessed on 28 May 2019).
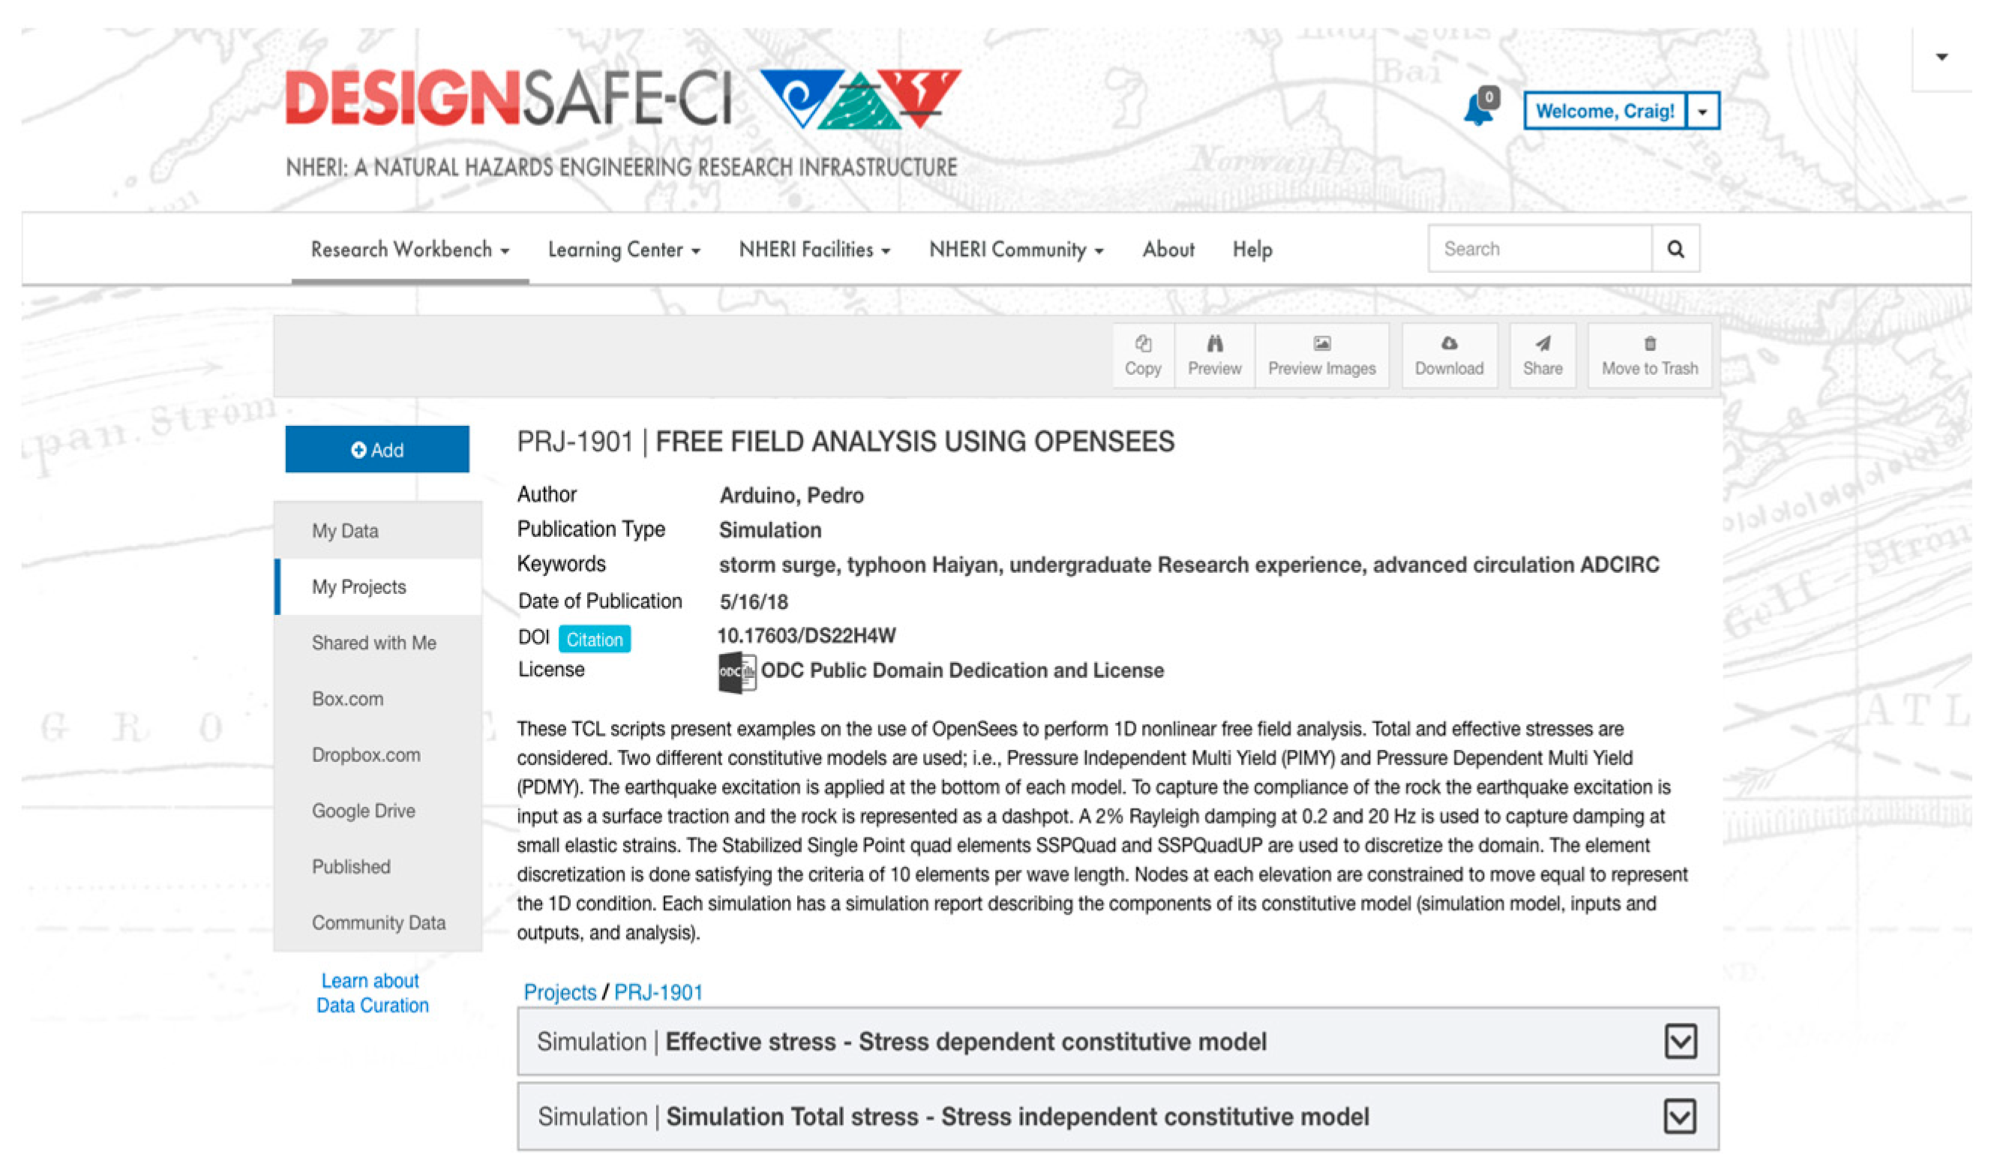
  27. Arduino, P.; Chen, L.; Ghofrani, A. Effective stress—Stress Dependent Constitutive Model. DesignSafe-CI 2018. [Google Scholar] [CrossRef]
  28. Four Kitchens. We Make Content Go! Available online: https://www.fourkitchens.com/ (accessed on 26 February 2019).
  29. Dooley, R.; Brandt, S.; Fonner, J. The Agave platform: An open, science-as-a service platform for digital science. In Proceedings of the Practice and Experience on Advanced Research Computing (PEARC ‘18), Pittsburgh, PA, USA, 22–26 July 2018. [Google Scholar] [CrossRef]
  30. Stampede2—Texas Advanced Computing Center. Available online: https://www.tacc.utexas.edu/systems/stampede2 (accessed on 28 May 2019).
  31. Lonestar 5—Texas Advanced Computing Center. Available online: https://www.tacc.utexas.edu/systems/lonestar (accessed on 28 May 2019).
  32. Corral—Texas Advanced Computing Center. Available online: https://www.tacc.utexas.edu/systems/corral (accessed on 3 September 2018).
  33. Welcome to DataCite. Available online: https://datacite.org/ (accessed on 28 May 2019).
  34. Fedora Repository. DuraSpaceWiki. Available online: https://wiki.duraspace.org/display/FF/Fedora+Repository+Home (accessed on 27 February 2019).
  35. Esteva, M.; Adair, A.; Jansen, C.; Coronel, J.B.; Kulasekaran, S. A Data Model for Lifecycle Management of Natural Hazards Engineering Data. In Proceedings of the International Conference on Dublin Core and Metadata Applications, Washington, DC, USA, 26–29 October 2017; pp. 73–74. [Google Scholar]
  36. Liu, Y. Sea Level Rise Projection at Sewells Point (6838610) in Norfolk. DesignSafe-CI 2018. [Google Scholar] [CrossRef]
  37. Dawson, C.N.; Fleming, J. Hurricane Maria ADCIRC Surge Guidance System Storm Surge Forecasts. DesignSafe-CI 2018. [Google Scholar] [CrossRef]
  38. Hsu, T.-J.; Kim, Y.; Puleo, J. Large Eddy Simulation of Dam-Break-Driven Swash on a Rough-Planar Beach. DesignSafe-CI 2018. [Google Scholar] [CrossRef]
  39. Fang, N. Identification of Urban Flood Impacts Caused by Land Subsidence and Sea Level Rise for the Houston-Galveston Region. DesignSafe-CI 2018. [Google Scholar] [CrossRef]
  40. FEMA Flood Map Service Center. Available online: https://msc.fema.gov/portal/advanceSearch (accessed on 11 March 2019).
  41. Dawson, C.N. Storm Surge Modeling of Typhoon Haiyan. DesignSafe-CI 2018. [Google Scholar] [CrossRef]
  42. US Department of Commerce, NOAA. Active Alerts. Available online: https://www.weather.gov/alerts (accessed on 11 March 2019).
  43. Kameshwar, S.; Vishnu, N.; Padgett, J. Earthquake Analyses for Portfolios of Seven Highway Bridge Classes in Response and Fragility Modeling of Aging Bridges Subjected to Earthquakes and Truck Loads. DesignSafe-CI 2019. [Google Scholar] [CrossRef]
  44. Ingram, C. Research Data: To Keep or Not to Keep? Research Data Management. 7 March 2019. Available online: https://researchdata.jiscinvolve.org/wp/2019/03/07/research-data-to-keep-or-not-to-keep/ (accessed on 22 March 2019).
1
For clarity, through this paper, we call the members of the simulation requirements team experts, and the researchers and public who use the platform users.
2
User studies were part of development activities and were not formalized as human subject studies with IRB authorization. We are procuring IRB evaluation for the next testing cycle to discuss and publish the study results.
Figure 1. Drawings of research workflows made by simulation experts: Clint Dawson (storm surge simulation) (left); and Laura Lowes (structural simulation) (right).
Publications 07 00051 g001
Figure 2. Data model for simulation data, with terms illustrating storm-surge.
Publications 07 00051 g002
Figure 3. My Project space where users create projects and work in teams. In the snapshot, the Curation Directory is highlighted, and the three steps entailed in curation appear to the right.
Publications 07 00051 g003
Figure 4. Overview of data organization instructions (left) and Add Categories steps (right) in the interactive curation interface. Note onboarding help such as the meaning of each category and tips to write titles and descriptions.
Publications 07 00051 g004
Figure 5. Curation overlay with colors, shortcuts, and menus to facilitate organizing and describing one to many files at a time. In this step, users can add files to categories and select or create terms to describe them.
Publications 07 00051 g005
Figure 6. Relate data interactive step. Users relate categories of their project can make changes to the order of their models and adjacent files.
Publications 07 00051 g006
Figure 7. Browsing view with accordion of a dataset with two simulations.
Publications 07 00051 g007
Figure 8. Browsing view of a complete simulation dataset.
Publications 07 00051 g008aPublications 07 00051 g008b
Figure 9. The tree diagram gets generated as the user relate data during the curation process. The tree becomes a navigation tool to files in the dataset’s landing page.
Publications 07 00051 g009
Figure 10. Related Work element in the landing page allows to associate external and local data sources, bibliographic citations, or projects. The element does not show if no related works are added to the project.
Publications 07 00051 g010
Table 1. Simulation Data Model Categories and Correspondence with Research and Curation Lifecycle.
CategoryCorresponding Research LifecycleDefinition
Simulation publicationData sharing and discovery, representation information, access, reuse.General metadata including creators, identifier, license, and description of the simulation research project.
Simulation modelPlan, project set up, research questions, conceptualize.Information and or files corresponding to the design, geometry and code of a simulation. A model may be embedded in software in which case we record its version and documentation.
Simulation inputRunning the simulation, data creation/collection/gathering. Files used to run a simulation model. Include configuration, parameters, and loads.
Simulation outputData processing, results.Data resulting from a simulation run.
AnalysisInterpretation, transform.Files resulting from examinations of the results. May include validations, probabilities, visualizations, code or other representations.
ReportDescription, dissemination, reuse.Written account made to convey information and instructions about the simulation

