Scientific Production and Productivity for Characterizing an Author’s Publication History: Simple and Nested Gini’s and Hirsch’s Indexes Combined


Abstract
1. Introduction
2. Methodology
- I will focus on full-length peer-reviewed articles (as opposed to notes, comments, or letters) to rely on a prior scrutiny of their originality by peer reviewers.
- I will focus on English, to emphasize international dissemination. Note that citations of an article by non-English articles are also included in this analysis.
- I will focus on net citations, after eliminating self-citations (citations of the author’s other papers) and reciprocal citations (citations of papers by all coauthors and colleagues), by deleting records in which the same author appears in both the citing publication and the cited article. Although this will exclude some legitimate self-citations, it also mitigates the problem of excessive citation of one’s own papers. I will also delete records in which the same affiliation appears in the citing publication and the cited article. Although this will exclude some legitimate citations of the work of colleagues that provide important context, it also mitigates the problem of excessive reciprocal citation. Here, I define reciprocal citations as situations in which coauthors cite each other’s work. This will mitigate “apostle” effects (i.e., inflating citations by relying on temporal linkages such as citations of a supervisor’s or manager’s papers) and network effects (i.e., boosting citations by relying on personal linkages). Note that coauthors refer to any kind of publication (e.g., citations of articles by coauthors in books, symposium proceedings, or research notes) and colleagues refer to all researchers affiliated at any time with the author whose PH is being studied (e.g., citations of articles by colleagues in the same PhD courses).
2.1. Definitions and Assumptions
- Production = the number of articles up to a given point in time, used as a total (stock) variable to estimate the researcher’s total scientific activity, where core production (as defined in Section 2.2) de-emphasizes the most frequently cited articles.
- Productivity = a marginal (flow) variable used to evaluate production per unit time or changes over time in scientific activity, where core productivity de-emphasizes the most popular articles.
- A multidisciplinary PH = the author submits their manuscripts to journals belonging to different disciplines; it will be measured by a Gini index applied to disciplines related to published manuscripts. The opposite would be a unidisciplinary PH.
- A multitopical PH = the author submits their manuscripts to many different journals belonging to the same discipline; it will be measured using a Gini index applied to journals related to the author’s published manuscripts. The opposite would be a unitopical PH.
- An intentional PH = the author deliberately submits their manuscripts in order to shape their PH; it is related to the choice of journal publication, it will be applied to disciplines (i.e., multi- or unidisciplinary) and journals (i.e., multi- or unitopical), and it will be measured by the Gini index.
- A successful PH = publications are cited many times by other papers within the same journal and within the same discipline (i.e., intratopical), by different journals within the same discipline (i.e., intertopical), or by different journals from different disciplines (i.e., interdisciplinary); it is related to the actions of other researchers (i.e., to cite or not to cite a given article), it will be applied to interdisciplinary and intertopical PHs, and it will be measured by H indexes.
- An orthodox PH = the author publishes in a single discipline and in many journals, and the vast majority of the citations are in few disciplines but in many different journals; it is intentional and successful, and it will be measured by combining H indexes and G indexes.
- A heterodox PH = the author publishes in a single discipline and in a few journals devoted to that discipline, so that the vast majority of citations are in few disciplines and few journals; it is intentional and successful, and it will be measured by combining H indexes and G indexes.
- An interdisciplinary PH = the author publishes in many disciplines and journals, and the vast majority of citations are in many different disciplines and journals; it is intentional and successful, and it will be measured by combining H indexes and G indexes.
- An intertopical PH = the author publishes in a single discipline and in many journals, and the vast majority of citations are in many journals within this discipline; it is intentional and successful, and it will be measured by combining H indexes and G indexes.
- Each journal represents a single topic within a discipline: that is, a journal cannot be attached to two different topics. See Section 5 for suggestions of future research to account for exceptions to this assumption.
- Each journal is linked to the most representative discipline: that is, a journal cannot be attached to two different disciplines. See Section 5 for suggestions of future research to account for exceptions to this assumption.
2.2. Scientific Production and Productivity
2.3. PH Characterization
3. Data
- Year
- Author
- Affiliation: institute/university, city, country
- Source: journal title
- Subjects: health, life, physical, social sciences, and multidisciplinary
- Disciplines: five in health sciences (medicine, veterinary, nursing, dentistry, and health professions), five in life sciences (pharmacology & toxicology, biological, neurology, agricultural, and immunology), nine in physical sciences (chemistry, physics & astronomy, and mathematics, Earth & planetary, energy, environmental, materials, engineering, and computing & information), and eight in social sciences (psychology, economics & econometrics & finance, arts & humanities, business & management & accounting, decision, politics, architecture, and sociology)
4. Application of the Indexes
5. Discussion
- Many proposals for modifying the original H index have been accounted for [85], including the elimination of self- and reciprocal citations, an increased weighting of highly cited articles, a focus on peer-reviewed scientific journals, the use of fractional citations to account for the number of authors (i.e., awarding authors a fraction of a point instead of a full point for multi-author articles), an increased sensitivity to variability of the overall citation profile, and a consideration of the life cycle of an article.
- Discrimination against interdisciplinary and heterodox PHs can be reduced by mitigating the bias created by conventional rankings, without relying on the application of advanced methodologies to complex datasets, as in the case of applying empirically based scaling factors to different disciplines [86], comparisons with the performance of other researchers in the same field [87], or comparison with the average number of citations per paper in a given discipline [25]
- Most of the main questions left open by the original description of the H index have been tackled [88], including the attribution of an article to a given discipline, since this is done by the author. This is done while retaining the practicality and simplicity that made the original H metric so appealing to a large audience.
- Indicators are distinguished according to the goals being pursued by amending well-established procedures such as years from publication rather than academic age (i.e., the duration of a researcher’s career at the time of the analysis [89]), and the indicators can be applied at different levels of aggregation (e.g., at department or university levels).
- Indicators are based on information that is available at an individual level, including citations that would be disregarded by the original H index [70], and the indicators can be easily computed.
- Rankings can also be obtained when the publication period is prior to the citation period under consideration (e.g., neglecting citations older than 22 years rather than articles published more than 22 years ago). Indeed, I chose the third PH in Section 4 as a reference example to show how this feature of the proposed model works.
- Results depend on the dataset used, and many alternatives could be applied [10]. However, the Scopus dataset for the last 22 years is both authoritative and comprehensive, and the same criticism could be raised for other datasets.
- The focus is on past (retrospective) real performance rather than on future expected (prospective) performance [90,91]. However, using impact factors to account for expected future performance would require a reliance on debatable information, such as the 2-year vs. 5-year impact factors described by Sangwal [57], from a dispersed and always in-progress dataset, as in the case of the temporal evolution of impact factors that is discussed by Finardi [92]. In addition, there are potentially opposite interpretations. For example, the presence of few citations in journals with a high impact factor could be a negative feature, because it would represent the lack of ability to exploit an important audience.
- Insights are not based on axiomatization, in which many alternatives could be suggested [93]. However, the formulas are easy to implement and straightforward to interpret.
- Characterization of the PHs depended on the simplifying assumption that a journal could not belong to two or more disciplines [25]. Although factor analysis could be used to univocally sort journals into single hypothetical disciplines in terms of estimated correlations, this is unrealistic in practice because researchers may be unable to perform this analysis without support from suitable software. However, accounting for multidisciplinary journals remains a challenge for future research
6. Conclusions
Supplementary Materials
Funding
Acknowledgments
Conflicts of Interest
Appendix A
Appendix A.1. Datasets

| Year | Disc | AN | Number of Citations | ||||
|---|---|---|---|---|---|---|---|
| Gross | Net | ||||||
| Total | Total | By Different Journals | By Different Disciplines | ||||
| Environmental & Resource Economics | 2016 | Eco | 1 | 0 | 0 | 0 | 0 |
| Applied Mathematical Modeling | 2016 | Mat | 1 | 0 | 0 | 0 | 0 |
| Applied Soft Computing Journal | 2016 | Com | 1 | 3 | 1 | 0 | 0 |
| Science of the Total Environment | 2016 | Env | 1 | 6 | 4 | 1 | 1 |
| Sustainability (Switzerland) | 2016 | Env | 1 | 1 | 1 | 0 | 0 |
| Sustainability (Switzerland) | 2016 | Env | 17 | 2 | 2 | 1 | 0 |
| Sustainability (Switzerland) | 2016 | Env | 21 | 0 | 0 | 0 | 0 |
| Journal of Happiness Studies | 2015 | Hum | 1 | 0 | 0 | 0 | 0 |
| Sustainability (Switzerland) | 2015 | Env | 16 | 4 | 4 | 2 | 1 |
| Sustainability Science | 2015 | Env | 1 | 1 | 0 | 0 | 0 |
| Coastal Engineering | 2014 | Eng | 8 | 27 | 16 | 8 | 4 |
| Journal of Hydrology | 2014 | Env | 2 | 0 | 0 | 0 | 0 |
| Environmental Modeling and Assessment | 2013 | Env | 1 | 0 | 0 | 0 | 0 |
| Environmental Modeling and Software | 2013 | Com | 2 | 11 | 11 | 6 | 6 |
| Natural Hazards | 2013 | Env | 1 | 2 | 2 | 2 | 2 |
| Environmental Management | 2011 | Env | 1 | 4 | 3 | 3 | 3 |
| Journal of Happiness Studies | 2011 | Hum | 1 | 3 | 2 | 2 | 2 |
| Water Resources Management | 2010 | Env | 1 | 15 | 15 | 13 | 11 |
| International Journal of Hospitality Management | 2009 | Man | 1 | 16 | 16 | 14 | 12 |
| Journal of Environmental Management | 2008 | Env | 1 | 8 | 7 | 6 | 6 |
| Papers in Regional Science | 2003 | Eco | 3 | 2 | 1 | 1 | 1 |
| Environment and Development Economics | 1998 | Eco | 1 | 1 | 1 | 1 | 1 |
| Journal of Environmental Economics and Management | 1998 | Eco | 1 | 15 | 15 | 14 | 2 |
| Economic Journal | 1995 | Eco | 1 | 1 | 1 | 1 | 1 |
| Total | 122 | 102 | 75 | 53 | |||
| All Authors (24 Articles) | Production per Author (18.6 Articles) | Productivity per Author per Year (18.6 Articles) | ||
|---|---|---|---|---|
| Hlatg = 8.42 | → | Hltg = 7.34 | ||
| Hcatg = 6.84 | → | Hctg = 5.75 | ||
| ↓ | ↓ | |||
| Hlatn = 7.62 | → | Hltn = 6.29, Hltn10 = 6.02 | → | Hlyn = 2.43, Hlyn10 = 2.56 |
| Hcatn = 6.67 | → | Hctn = 5.28, Hctn10 = 4.93 | → | Hcyn = 2.60, Hcyn10 = 2.57 |
| ↓ | ||||
| Hljn = 5.74 | ||||
| Hcjn = 4.97 | ||||
| ↓ | ||||
| Hldn = 4.71 | ||||
| Hcdn = 4.31 |
| Year | Disc | AN | Number of Citations | ||||
|---|---|---|---|---|---|---|---|
| Gross | Net | ||||||
| Total | Total | By Different Journals | By Different Disciplines | ||||
| Cambridge Journal of Economics | 2012 | Eco | 1 | 7 | 7 | 5 | 0 |
| Cambridge Journal of Economics | 2012 | Eco | 1 | 8 | 7 | 5 | 0 |
| Cambridge Journal of Economics | 2005 | Eco | 1 | 36 | 36 | 29 | 1 |
| Journal of Post-Keynesian Economics | 2001 | Eco | 1 | 6 | 6 | 4 | 0 |
| Cambridge Journal of Economics | 1994 | Eco | 1 | 1 | 1 | 1 | 0 |
| Structural Change and Economic Dynamics | 1990 | Eco | 1 | 2 | 2 | 1 | 0 |
| Cambridge Journal of Economics | 1989 | Eco | 1 | 19 | 19 | 8 | 2 |
| Cambridge Journal of Economics | 1989 | Eco | 1 | 0 | 0 | 0 | 0 |
| Cambridge Journal of Economics | 1988 | Eco | 1 | 38 | 35 | 33 | 5 |
| Cambridge Journal of Economics | 1988 | Eco | 1 | 12 | 11 | 7 | 3 |
| Cambridge Journal of Economics | 1986 | Eco | 1 | 0 | 0 | 0 | 0 |
| Cambridge Journal of Economics | 1983 | Eco | 1 | 9 | 9 | 6 | 1 |
| Review of Economic Studies | 1981 | Eco | 1 | 1 | 1 | 1 | 0 |
| Cambridge Journal of Economics | 1977 | Eco | 1 | 11 | 11 | 8 | 0 |
| Quarterly Journal of Economics | 1966 | Eco | 1 | 45 | 43 | 35 | 1 |
| Review of Economic Studies | 1964 | Eco | 1 | 0 | 0 | 0 | 0 |
| Oxford Economic Papers | 1960 | Eco | 1 | 7 | 7 | 5 | 0 |
| Total | 201 | 195 | 148 | 13 | |||
| Year | Disc | AN | Number of Citations | ||||
|---|---|---|---|---|---|---|---|
| Gross | Net | ||||||
| Total | Total | By Different Journals | By Different Disciplines | ||||
| Physical Review | 1953 | Phy | 1 | 7 | 7 | 7 | 2 |
| Science | 1951 | Phy | 1 | 4 | 4 | 4 | 1 |
| Science | 1949 | Phy | 8 | 1 | 1 | 1 | 0 |
| Reviews of Modern Physics | 1948 | Phy | 1 | 56 | 56 | 56 | 13 |
| Reviews of Modern Physics | 1946 | Phy | 2 | 85 | 85 | 84 | 12 |
| Reviews of Modern Physics | 1945 | Phy | 2 | 249 | 249 | 244 | 75 |
| Science | 1940 | Phy | 1 | 27 | 27 | 27 | 17 |
| Journal of the Franklin Institute | 1937 | Phy | 2 | 254 | 251 | 246 | 76 |
| Science | 1936 | Phy | 1 | 305 | 305 | 299 | 92 |
| Journal of the Franklin Institute | 1936 | Phy | 1 | 101 | 101 | 99 | 31 |
| Physical Review | 1936 | Phy | 2 | 29 | 29 | 28 | 9 |
| Physical Review | 1935 | Phy | 3 | 6806 | 6805 | 6663 | 2058 |
| Physical Review | 1935 | Phy | 2 | 319 | 318 | 311 | 96 |
| Physical Review | 1931 | Phy | 3 | 28 | 28 | 26 | 6 |
| Nature | 1923 | Phy | 1 | 10 | 10 | 10 | 3 |
| Nature | 1921 | Phy | 1 | 10 | 10 | 10 | 3 |
| Total | 8291 | 8286 | 8115 | 2495 | |||
| Year | Disc | AN | Number of Citations | ||||
|---|---|---|---|---|---|---|---|
| Gross | Net | ||||||
| Total | Total | By Different Journals | By Different Disciplines | ||||
| Agricultural Systems | 2017 | Agr | 10 | 1 | 0 | 1 | 0 |
| Soil and Tillage Research | 2017 | Agr | 10 | 1 | 0 | 0 | 0 |
| Geoderma | 2017 | Agr | 5 | 3 | 2 | 2 | 0 |
| European Journal of Agronomy | 2017 | Agr | 5 | 2 | 1 | 1 | 0 |
| Journal of Environmental Management | 2016 | Env | 6 | 5 | 3 | 3 | 1 |
| Field Crops Research | 2016 | Agr | 7 | 4 | 1 | 1 | 1 |
| European Journal of Agronomy | 2016 | Agr | 8 | 1 | 1 | 1 | 0 |
| European Journal of Agronomy | 2016 | Agr | 8 | 3 | 0 | 0 | 0 |
| Agronomy | 2016 | Agr | 7 | 9 | 3 | 2 | 1 |
| Industrial Crops and Products | 2015 | Agr | 4 | 3 | 3 | 2 | 0 |
| Ecological Indicators | 2015 | Env | 7 | 6 | 3 | 3 | 1 |
| Geoderma | 2013 | Agr | 5 | 23 | 21 | 19 | 0 |
| Soil Use and Management | 2013 | Agr | 5 | 4 | 0 | 0 | 0 |
| Geoderma | 2012 | Agr | 4 | 15 | 10 | 6 | 0 |
| Cold Regions Science and Technology | 2012 | Agr | 3 | 6 | 1 | 1 | 0 |
| Soil and Tillage Research | 2010 | Agr | 8 | 17 | 9 | 8 | 0 |
| Soil and Tillage Research | 2007 | Agr | 5 | 39 | 27 | 15 | 0 |
| Total | 142 | 85 | |||||
| Year | Disc | AN | Number of Citations | ||||
|---|---|---|---|---|---|---|---|
| Gross | Net | ||||||
| Total | Total | By Different Journals | By Different Disciplines | ||||
| Scientific Reports | 2017 | Med | 8 | 0 | 0 | 0 | 0 |
| Briefings in Bioinformatics | 2017 | Med | 3 | 2 | 2 | 2 | 0 |
| G3: Genes, Genomes, Genetics | 2017 | Med | 7 | 2 | 1 | 1 | 0 |
| PLoS ONE | 2017 | Med | 7 | 0 | 0 | 0 | 0 |
| Nucleic Acids Research | 2017 | Med | 4 | 4 | 2 | 2 | 0 |
| BMC Genomics | 2017 | Med | 2 | 2 | 2 | 2 | 0 |
| Bioinformatics | 2017 | Med | 3 | 2 | 2 | 2 | 0 |
| Journal of Clinical Microbiology | 2016 | Med | 9 | 0 | 0 | 0 | 0 |
| Frontiers in Molecular Biosciences | 2016 | Med | 6 | 1 | 0 | 0 | 0 |
| International Journal of Systematic and Evolutionary Microbiology | 2016 | Med | 8 | 2 | 2 | 2 | 0 |
| mSphere | 2016 | Med | 3 | 3 | 3 | 3 | 0 |
| mBio | 2016 | Med | 15 | 8 | 7 | 7 | 0 |
| Genome Announcements | 2016 | Med | 6 | 2 | 1 | 1 | 0 |
| Gene | 2015 | Med | 4 | 3 | 0 | 0 | 0 |
| Mobile DNA | 2015 | Med | 4 | 15 | 11 | 7 | 0 |
| Scientific Reports | 2015 | Med | 6 | 7 | 4 | 3 | 0 |
| Journal of Bacteriology | 2014 | Med | 4 | 8 | 6 | 6 | 0 |
| Genome Announcements | 2014 | Med | 9 | 4 | 3 | 3 | 0 |
| Gene | 2013 | Med | 7 | 11 | 9 | 9 | 0 |
| Journal of Bacteriology | 2012 | Med | 9 | 5 | 5 | 5 | 0 |
| PLoS ONE | 2012 | Med | 6 | 7 | 7 | 6 | 0 |
| Genomics, Proteomics and Bioinformatics | 2011 | Med | 4 | 0 | 0 | 0 | 0 |
| Total | 88 | 67 | |||||
Appendix A.2. A Test Using Randomly Selected PHs


References
- Wildgaard, L. A critical cluster analysis of 44 indicators of author-level performance. J. Inf. 2016, 10, 1055–1078. [Google Scholar] [CrossRef]
- Cainelli, G.; Maggioni, M.A.; Uberti, T.E.; De Felice, A. Co-authorship and productivity among Italian economists. Appl. Econ. Lett. 2012, 19, 1609–1613. [Google Scholar] [CrossRef]
- Cainelli, G.; Maggioni, M.A.; Uberti, T.E.; De Felice, A. The strength of strong ties: How co-authorship affect productivity of academic economists? Scientometrics 2015, 102, 673–699. [Google Scholar]
- Schubert, A. A Hirsch-type index of co-author partnership ability. Scientometrics 2012, 91, 303–308. [Google Scholar] [CrossRef]
- Fong, E.A.; Wilhite, A.W. Authorship and citation manipulation in academic research. PLoS ONE 2017, 12, e0187394. [Google Scholar] [CrossRef] [PubMed]
- De Stefano, D.; Zaccarin, S. Co-authorship networks and scientific performance: An empirical analysis using the generalised extreme value distribution. J. Appl. Stat. 2016, 43, 262–279. [Google Scholar] [CrossRef]
- Mccarty, C.; Jawitz, J.W. Attitudes about publishing and normal science advancement. J. Inf. 2013, 7, 850–858. [Google Scholar] [CrossRef]
- Gini, C. Variabilità e Mutabilità. J. R. Stat. Soc. 1913, 76, 326–327. (In English) [Google Scholar]
- Bornmann, L.; Marx, W. Methods for the generation of normalized citation impact scores in bibliometrics: Which method best reflects the judgements of experts? J. Inf. 2015, 9, 408–418. [Google Scholar] [CrossRef]
- Harzing, A.-W.; Alakangas, S. Google Scholar, Scopus and the Web of Science: A longitudinal and cross-disciplinary comparison. Scientometrics 2016, 106, 787–804. [Google Scholar] [CrossRef]
- Harzing, A.W.; Alakangas, S.; Adams, D. hIa: An individual annual H-index to accommodate disciplinary and career length difference. Scientometrics 2014, 99, 811–821. [Google Scholar] [CrossRef]
- Bouyssou, D.; Marchant, T. An axiomatic approach to bibliometric rankings and indices. J. Informetr. 2016, 8, 449–477. [Google Scholar] [CrossRef]
- Abramo, G.; D’Angelo, C.A.; Viel, F. Assessing the accuracy of the H- and G-indexes for measuring researchers’ productivity. J. Am. Soc. Inf. Sci. Technol. 2013, 64, 1224–1234. [Google Scholar] [CrossRef]
- Hirsch, J.E. An index to quantify an individual’s scientific research output. PNAS 2005, 102, 16569–16572. [Google Scholar] [CrossRef] [PubMed]
- Cowell, F.A. Measuring inequality. In LSE Handbooks in Economics Series; Prentice Hall: London, UK, 1995. [Google Scholar]
- De Stefano, D.; Fuccella, V.; Vitale, M.P.; Zaccarin, S. The use of different data sources in the analysis of co-authorship networks and scientific performance. Soc. Netw. 2013, 35, 370–381. [Google Scholar] [CrossRef]
- Petersen, A.M. Quantifying the impact of weak, strong, and super ties in scientific careers. Proc. Nalt. Acad. Sci. USA 2015, 112, E4671–E4680. [Google Scholar] [CrossRef] [PubMed]
- Wagner, C.S.; Roessner, J.D.; Bobb, K.; Klein, J.T.; Boyack, K.W.; Keyton, J.; Rafols, I.; Börner, K. Approaches to understanding and measuring interdisciplinary scientific research (IDR): A review of the literature. J. Inf. 2011, 5, 14–26. [Google Scholar] [CrossRef]
- MacLeod, M.; Nersessian, N.J. Interdisciplinary problem-solving: Emerging modes of integrative systems biology. Eur. J. Philos. Sci. 2016, 6, 401–418. [Google Scholar] [CrossRef]
- Abramo, G.; D’Angelo, C.A.; Zhang, L. A comparison of two approaches for measuring interdisciplinary research output: The disciplinary diversity of authors vs. the disciplinary diversity of the reference list. J. Inf. 2018, 12, 1182–1193. [Google Scholar] [CrossRef]
- Leydesdorff, L.; Wagner, C.S.; Bornmann, L. Betweenness and diversity in journal citation networks as measure of interdisciplinarity—A tribute to Eugene Garfield. Scientometrics 2018, 114, 567–592. [Google Scholar] [CrossRef]
- Leydesdorff, L. Diversity and interdisciplinarity: How can one distinguish and recombine disparity, variety, and balance? Scientometrics 2018, 116, 2113–2121. [Google Scholar] [CrossRef] [PubMed]
- Bornmann, L.; Haunschild, R. Citation score normalized by cited references (CSNCR): The introduction of a new citation impact indicator. J. Inf. 2016, 10, 875–887. [Google Scholar] [CrossRef]
- Bornmann, L.; Anegón, F.D.M.; Leydesdorff, L. The new Excellence Indicator in the World Report of the SCImago Institutions Rankings 2011. J. Inf. 2012, 6, 333–335. [Google Scholar] [CrossRef]
- Radicchi, F.; Castellano, C. Testing the fairness of citation indicators for comparison across scientific domains: The case of fractional citation counts. J. Inf. 2012, 6, 121–130. [Google Scholar] [CrossRef]
- Bouyssou, D.; Marchant, T. Ranking authors using fractional counting of citations: An axiomatic approach. J. Inf. 2016, 10, 183–199. [Google Scholar] [CrossRef]
- Abramo, G.; D’Angelo, C.A.; Rosati, F. The importance of accounting of the number of co-authors and their order when assessing research performance at the individual level in life sciences. J. Informetr. 2013, 7, 198–208. [Google Scholar] [CrossRef]
- Liu, X.Z.; Fang, H. Fairly sharing the credit of multi-authored papers and its application in the modification of H-index and G-index. Scientometrics 2012, 91, 37–49. [Google Scholar] [CrossRef]
- Liu, Y.; Yang, Y. Empirical study of L-Sequence: The basic h-index sequence for cumulative publications with consideration of the yearly citation performance. J. Inf. 2014, 8, 478–485. [Google Scholar] [CrossRef]
- Spruyt, E.H.J.; Engels, T.C.E.; Goos, P.; Dexters, N. Group size, H-index, and efficiency in publishing in top journals explain expert panel assessments of research group quality and productivity. Res. Eval. 2013, 22, 224–236. [Google Scholar]
- Schreiber, M.; Malesios, C.C.; Psarakis, S. Categorizing H-index variants. Res. Eval. 2011, 20, 397–409. [Google Scholar] [CrossRef]
- Wainer, J.; Vieira, P. Correlations between bibliometrics and peer evaluation for all disciplines: The evaluation of Brazilian scientists. Scientometrics 2013, 96, 395–410. [Google Scholar] [CrossRef]
- Yan, X.; Zhai, L.; Fan, W. C-index: A weighted network node centrality measure for collaboration competence. J. Inf. 2013, 7, 223–239. [Google Scholar] [CrossRef]
- Egghe, L. Theory and practice of the g-index. Scientometrics 2006, 69, 131–152. [Google Scholar] [CrossRef]
- Adachi, T.; Kongo, T. Further axiomatizations of Egghe’s G-index. J. Informetr. 2015, 9, 839–844. [Google Scholar] [CrossRef]
- Bartolucci A comparison between the G-index and the H-index based on concentration. J. Assoc. Inf. Sci. Technol. 2015, 66, 2708–2710. [CrossRef]
- Bertoli-Barsotti. Normalizing the G-index. Scientometrics 2016, 106, 645–655. [Google Scholar] [CrossRef]
- De Visscher, A. What does the G-index really measure? J. Am. Soc. Inf. Sci. Technol. 2011, 62, 2290–2293. [Google Scholar] [CrossRef]
- Prathap, G. Measures of impact, consistency, and the H- and G-indexes. J. Assoc. Inf. Sci. Technol. 2014, 65, 1076–1078. [Google Scholar] [CrossRef]
- Rousseau, R. Egghe’s G-index is not a proper concentration measure. J. Assoc. Inf. Sci. Technol. 2015, 66, 1518–1519. [Google Scholar] [CrossRef]
- Schreiber, M. Do we need the G-index? J. Assoc. Inf. Sci. Technol. 2013, 64, 2396–2399. [Google Scholar] [CrossRef]
- Schreiber, M. How to derive an advantage from the arbitrariness of the G-index. J. Inf. 2013, 7, 555–561. [Google Scholar] [CrossRef]
- Petersen, A.M.; Succi, S. The Z-index: A geometric representation of productivity and impact which accounts for information in the entire rank-citation profile. J. Inf. 2013, 7, 823–832. [Google Scholar] [CrossRef][Green Version]
- Gagolewski, M.; Mesiar, R. Aggregating different paper quality measures with a generalized H-index. J. Inf. 2012, 6, 566–579. [Google Scholar] [CrossRef]
- Bornmann, L.; Mutz, R.; Hug, S.E.; Daniel, H.D. A multi-level meta-analysis of studies reporting correlations between the H-index and 37 different H-index variants. J. Informetr. 2011, 5, 346–359. [Google Scholar] [CrossRef]
- Bertoli-Barsotti, L.; Lando, L. On a formula of the H-index. J. Informetr. 2015, 9, 762–776. [Google Scholar] [CrossRef]
- Senanayake, U.; Piraveenan, M.; Zomaya, A. The Pagerank-index: Going beyond Citation Counts in Quantifying Scientific Impact of Researchers. PLoS ONE 2015, 10, e0134794. [Google Scholar] [CrossRef] [PubMed]
- Yates, E.J.; Dixon, L.C. PageRank as a method to rank biomedical literature by importance. Source Code Boil. Med. 2015, 10, 2805. [Google Scholar] [CrossRef] [PubMed]
- Abbas, A.M. Bounds and Inequalities Relating H-index, G-index, E-index and Generalized Impact Factor: An Improvement over Existing Models. PLoS ONE 2012, 7, e33699. [Google Scholar] [CrossRef]
- Moskovkin, V.M.; Golikov, N.A.; Isaev, I.F.; Serkina, O.V. Construction if scoring rule within the framework of new generation of metric citations. Res. J. Appl. Sci. 2014, 9, 1167–1170. [Google Scholar]
- Wildgaard, L. A comparison of 17 author-level bibliometric indicators for researchers in Astronomy, Environmental Science, Philosophy and Public Health in Web of Science and Google Scholar. Scientometrics 2015, 104, 873–906. [Google Scholar] [CrossRef]
- Morichika, N.; Shibayama, S. Impact of inbreeding on scientific productivity: A case study of a Japanese university department. Res. Eval. 2015, 24, 146–157. [Google Scholar] [CrossRef]
- Abatemarco, A.; Dell’Anno, R. A bibliometric evaluation of the research outputs of Italian economists. Econ. Politica 2013, 30, 97–125. [Google Scholar]
- Hopkins, A.L.; Jawitz, J.W.; McCarty, C.; Goldman, A.; Basu, N.B. Disparities in publication patterns by gender, race and ethnicity based on a survey of a random sample of authors. Scientometrics 2013, 96, 515–534. [Google Scholar] [CrossRef]
- Sotudeh, H.; Khoshian, N. Gender, web presence and scientific productivity in nanoscience and nanotechnology. Scientometrics 2014, 99, 717–736. [Google Scholar] [CrossRef]
- Penner, O.; Pan, R.K.; Petersen, A.M.; Kaski, K.; Fortunato, S. On the Predictability of Future Impact in Science. Sci. Rep. 2013, 3, 3052. [Google Scholar] [CrossRef] [PubMed]
- Sangwal, K. Citation and impact factor distributions of scientific journals published in individual countries. J. Inf. 2013, 7, 487–504. [Google Scholar] [CrossRef]
- Abramo, G.; D’Angelo, C.A.; Viel, F. The suitability of h and g indexes for measuring the research performance of institutions. Scientometrics 2013, 97, 555–570. [Google Scholar] [CrossRef]
- Ko, Y.M.; Park, J.Y. An index for evaluating journals in a small domestic citation index database whose citation rate is generally very low: A test based on the Korea Citation Index (KCI) database. J. Inf. 2013, 7, 404–411. [Google Scholar] [CrossRef]
- Tsai, C.-F. Citation impact analysis of top ranked computer science journals and their rankings. J. Inf. 2014, 8, 318–328. [Google Scholar] [CrossRef]
- Prathap, G. The quality-quantity-quasity and energy-exergy-entropy exegesis of expected value calculation of citation performance. Scientometrics 2012, 91, 269–275. [Google Scholar] [CrossRef]
- Schreiber, M. How to improve the outcome of performance evaluations in terms of percentiles for citation frequencies of my papers. J. Inf. 2014, 8, 873–879. [Google Scholar] [CrossRef]
- Schreiber, M. Is the new citation-rank approach P100′ in bibliometrics really new? J. Inf. 2014, 8, 997–1004. [Google Scholar] [CrossRef][Green Version]
- Schreiber, M. Examples of counterintuitive behavior of the new citation-rank indicator P100 for bibliometric evaluations. J. Informetr. 2014, 8, 738–748. [Google Scholar] [CrossRef][Green Version]
- Blagus, R.; Leskošek, B.L.; Stare, J. Comparison of bibliometric measures for assessing relative importance of researchers. Scientometrics 2015, 105, 1743–1762. [Google Scholar] [CrossRef]
- Lando, T.; Bertoli-Barsotti, L. Measuring the citation impact of journals with generalized Lorenz curves. J. Inf. 2017, 11, 689–703. [Google Scholar] [CrossRef]
- Martínez, M.A.; Herrera, M.; López-Gijón, J.; Herrera-Viedma, E. H-classics: Characterising the concept of citation classics through H-index. Scientometrics 2014, 98, 1971–1983. [Google Scholar] [CrossRef]
- Glänzel, W. The role of core documents in bibliometric network analysis and their relation with h-type indices. Scientometrics 2012, 93, 113–123. [Google Scholar] [CrossRef]
- Thelwall, M.; Wilson, P. Regression for citation data: An evaluation of different methods. J. Inf. 2014, 8, 963–971. [Google Scholar] [CrossRef]
- Anania, G.; Caruso, A. Two simple new bibliometric indexes to better evaluate research in disciplines where publications typically receive less citations. Scientometrics 2013, 96, 617–631. [Google Scholar] [CrossRef]
- De Moya-Anegón, F.; López-Illescas, C.; Moed, H.F. How to interpret the position of private sector institutions in bibliometric rankings of research institutions. Scientometrics 2014, 98, 283–298. [Google Scholar] [CrossRef]
- Sutter, D. Different but Equal? On the Contribution of Dissident Economists. Am. J. Econ. Sociol. 2012, 71, 1143–1156. [Google Scholar] [CrossRef]
- Egghe, L. A rationale for the relation between the citer H-index and the classical H-index of a researcher. Scientometrics 2013, 94, 873–876. [Google Scholar] [CrossRef]
- Ryan, J.C. A validation of the individual annual h-index (hIa): Application of the hIa to a qualitatively and quantitatively different sample. Scientometrics 2016, 109, 577–590. [Google Scholar] [CrossRef]
- Yang, J.; Vannier, M.W.; Wang, F.; Deng, Y.; Ou, F.; Bennett, J.; Liu, Y.; Wang, G. A bibliometric analysis of academic publication and NIH funding. J. Inf. 2013, 7, 318–324. [Google Scholar] [CrossRef]
- Davidson, P.M.; Newton, P.J.; Ferguson, C.; Daly, J.; Elliott, D.; Homer, C.; Duffield, C.; Jackson, D. Rating and ranking the role of bibliometrics and webomentrics in nursing and midwifery. Sci. World J. 2014, 135812. [Google Scholar] [CrossRef]
- Castellani, T.; Pontecorvo, E.; Valente, A. Epistemic Consequences of Bibliometrics-based Evaluation: Insights from the Scientific Community. Soc. Epistem. 2016, 30, 1–22. [Google Scholar] [CrossRef]
- Rijcke, S.D.; Wouters, P.F.; Rushforth, A.D.; Franssen, T.P.; Hammarfelt, B. Evaluation practices and effects of indicator use—A literature review. Res. Eval. 2016, 25, 161–169. [Google Scholar] [CrossRef]
- Muller, R.; De Rijcke, S. Exploring the epistemic impacts of academic performance indicators in the life sciences. Res. Eval. 2017, 26, 157–168. [Google Scholar] [CrossRef]
- Flatt, J.W.; Blasimme, A.; Vayena, E. Improving the Measurement of Scientific Success by Reporting a Self-Citation Index. Publications 2017, 5, 20. [Google Scholar] [CrossRef]
- Herteliu, C.; Ausloos, M.; Ileanu, B.; Rotundo, G.; Andrei, T. Quantitative and qualitative analysis of editor behaviour through potentially coercive citations. Publications 2017, 5, 15. [Google Scholar] [CrossRef]
- Zagonari, F. Coping with the Inequity and Inefficiency of the H-index: A Cross-Disciplinary Analytical Model. Publ. Q. 2018. [Google Scholar] [CrossRef]
- Hammarfelt, B.; De Rijcke, S. Accountability in context: Effects of research evaluation systems on publication practices, disciplinary norms, and individual working routines in the Faculty of Arts at Uppsala University. Res. Eval. 2015, 24, 63–77. [Google Scholar] [CrossRef]
- Hammarfelt, B.; Haddow, G. Conflicting measures and values: How humanities scholars in Australia and Sweden use and react to bibliometric indicators. J. Assoc. Inf. Sci. Technol. 2018, 69, 924–935. [Google Scholar] [CrossRef]
- Dienes, K.R. Completing h. J. Informetr. 2015, 9, 385–397. [Google Scholar] [CrossRef]
- Ruocco, G.; Daraio, C. An empirical approach to compare the performance of heterogeneous academic fields. Scientometrics 2013, 97, 601–625. [Google Scholar] [CrossRef]
- Nair, M.S. M-score: A context-specific score to assess scientific productivity with OEVGSI grading. Curr. Sci. 2015, 109, 596–600. [Google Scholar]
- Gagolewski, M. Scientific impact assessment cannot be fair. J. Inf. 2013, 7, 792–802. [Google Scholar] [CrossRef]
- Egghe, L. On the correlation of the H-index for career length. Scientometrics 2013, 96, 563–571. [Google Scholar] [CrossRef]
- Carrasco, R.; Ruiz-Castillo, J. The evolution of scientific productivity of highly productive economists. Econ. Enq. 2014, 52, 1–16. [Google Scholar] [CrossRef]
- Chang, C.-L.; McAleer, M.; Oxley, L. What makes a great journal great in the sciences? Which came first, the chicken or the egg? Scientometrics 2011, 87, 17–40. [Google Scholar] [CrossRef]
- Finardi, U. Correlation between Journal Impact Factor and Citation Performance: An experimental study. J. Inf. 2013, 7, 357–370. [Google Scholar] [CrossRef]
- Kongo, T. An alternative axiomatization of the Hirsch Index. J. Inf. 2014, 8, 252–258. [Google Scholar] [CrossRef]
- Waltman, L.; Van Eck, N.J. The inconsistency of the H-index. J. Am. Soc. Inf. Sci. Technol. 2012, 63, 406–415. [Google Scholar] [CrossRef]


| Gj | Gini Index for Journals | |||
|---|---|---|---|---|
| Gd | Gini Index for Disciplines | |||
| Fitting | Citations | Period | ||
| Per author | Hltn10 | Linear | Total net | 10 years |
| Hctn10 | Cubic | Total net | ||
| Hlyn10 | Linear | Net per year | ||
| Hcyn10 | Cubic | Net per year | ||
| Hltn | Linear | Total net | Total career | |
| Hctn | Cubic | Total net | ||
| Hlyn | Linear | Net per year | ||
| Hcyn | Cubic | Net per year | ||
| Hltg | Linear | Total gross | ||
| Hctg | Cubic | Total gross | ||
| Hljn | Linear | Total net in different journals | ||
| Hcjn | Cubic | Total net in different journals | ||
| Hldn | Linear | Total net in different disciplines | ||
| Hcdn | Cubic | Total net in different disciplines | ||
| All authors | Hlatg | Linear | Total gross | |
| Hcatg | Cubic | Total gross | ||
| Hlatn | Linear | Total net | ||
| Hcatn | Cubic | Total net | ||
| Intentional | Unintentional | |||||||||
|---|---|---|---|---|---|---|---|---|---|---|
| PH definitions | Gd | Gj | Hd | Hj | Gd | Gj | Hd | Hj | ||
| Successful | Intradisciplinary | Intratopical | 0 | Small | Small | Small | ||||
| Intratopical heterodox | 0 | Small | Tiny | Small | ||||||
| Intertopical | 0 | Large | Small | Large | 0 | Small | Small | Large | ||
| Intertopical orthodox | 0 | Large | Tiny | Large | ||||||
| Interdisciplinary | Intertopical | Small | Large | Large | Large | 0 | Large | Large | Large | |
| Intertopical orthodox | Large | Large | Large | Large | ||||||
| Unsuccessful | Intradisciplinary | Intratopical | 0 | Small | Small | Tiny | ||||
| Intradisciplinary | Intertopical | 0 | Large | Small | Tiny | |||||
| Interdisciplinary | Intertopical | Small | Large | Tiny | Large | |||||
| H | The Last 10 Years (2007–2016) | H | Author’s Whole Career (1995–2016) |
|---|---|---|---|
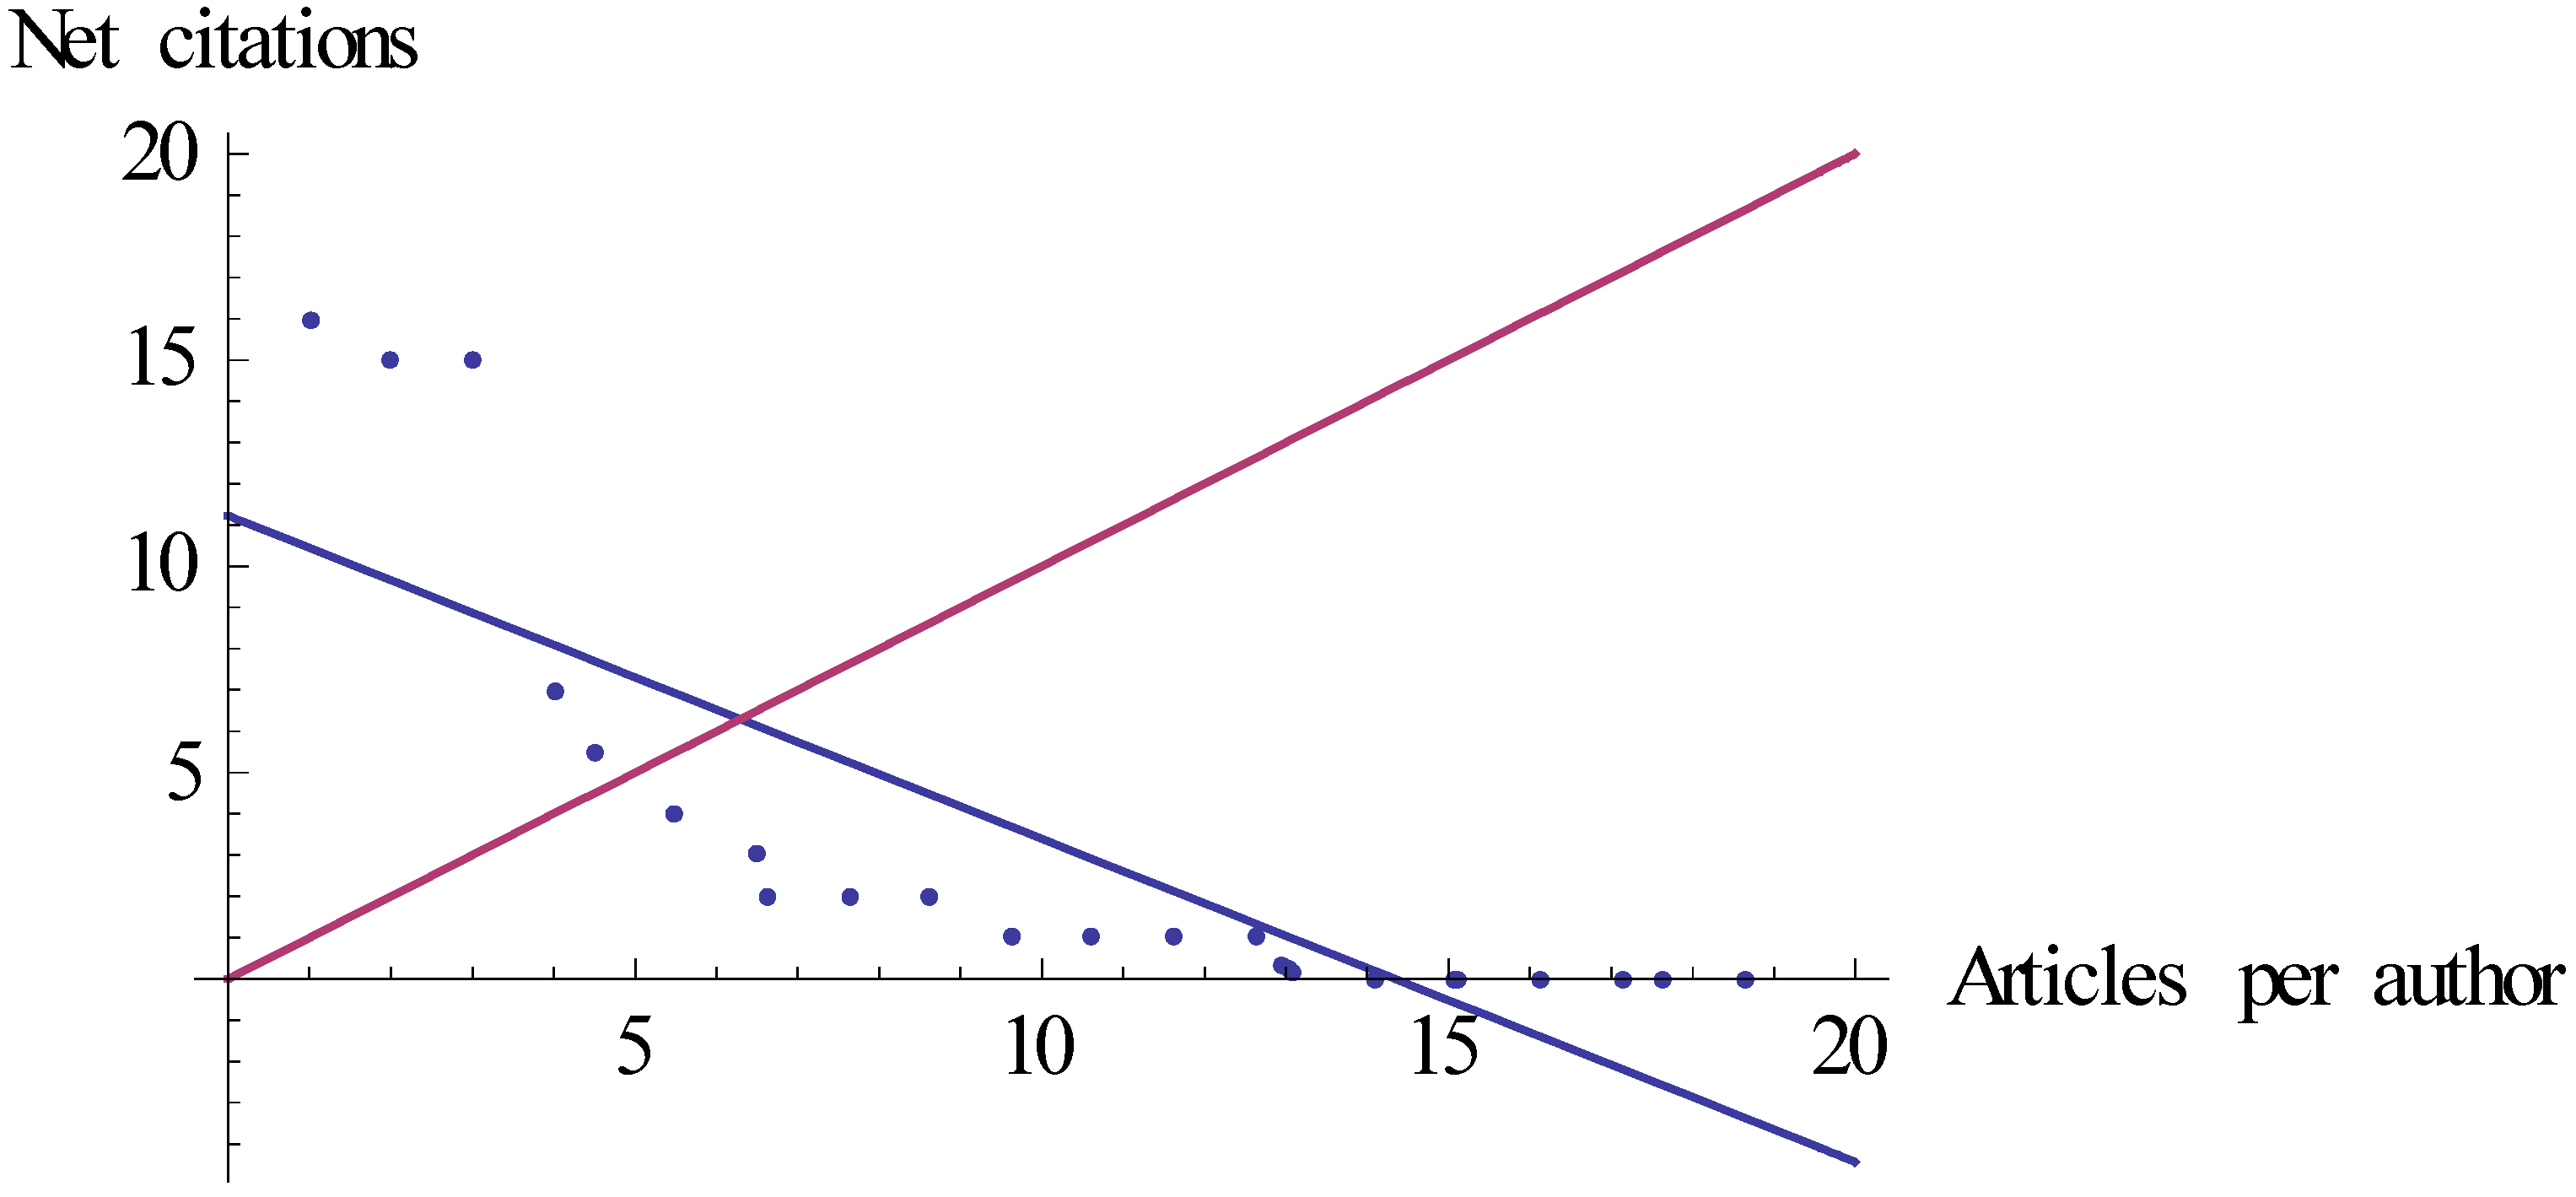
| Hltn10 | 6.02 | Hltn | 6.29 (Figure 1) |
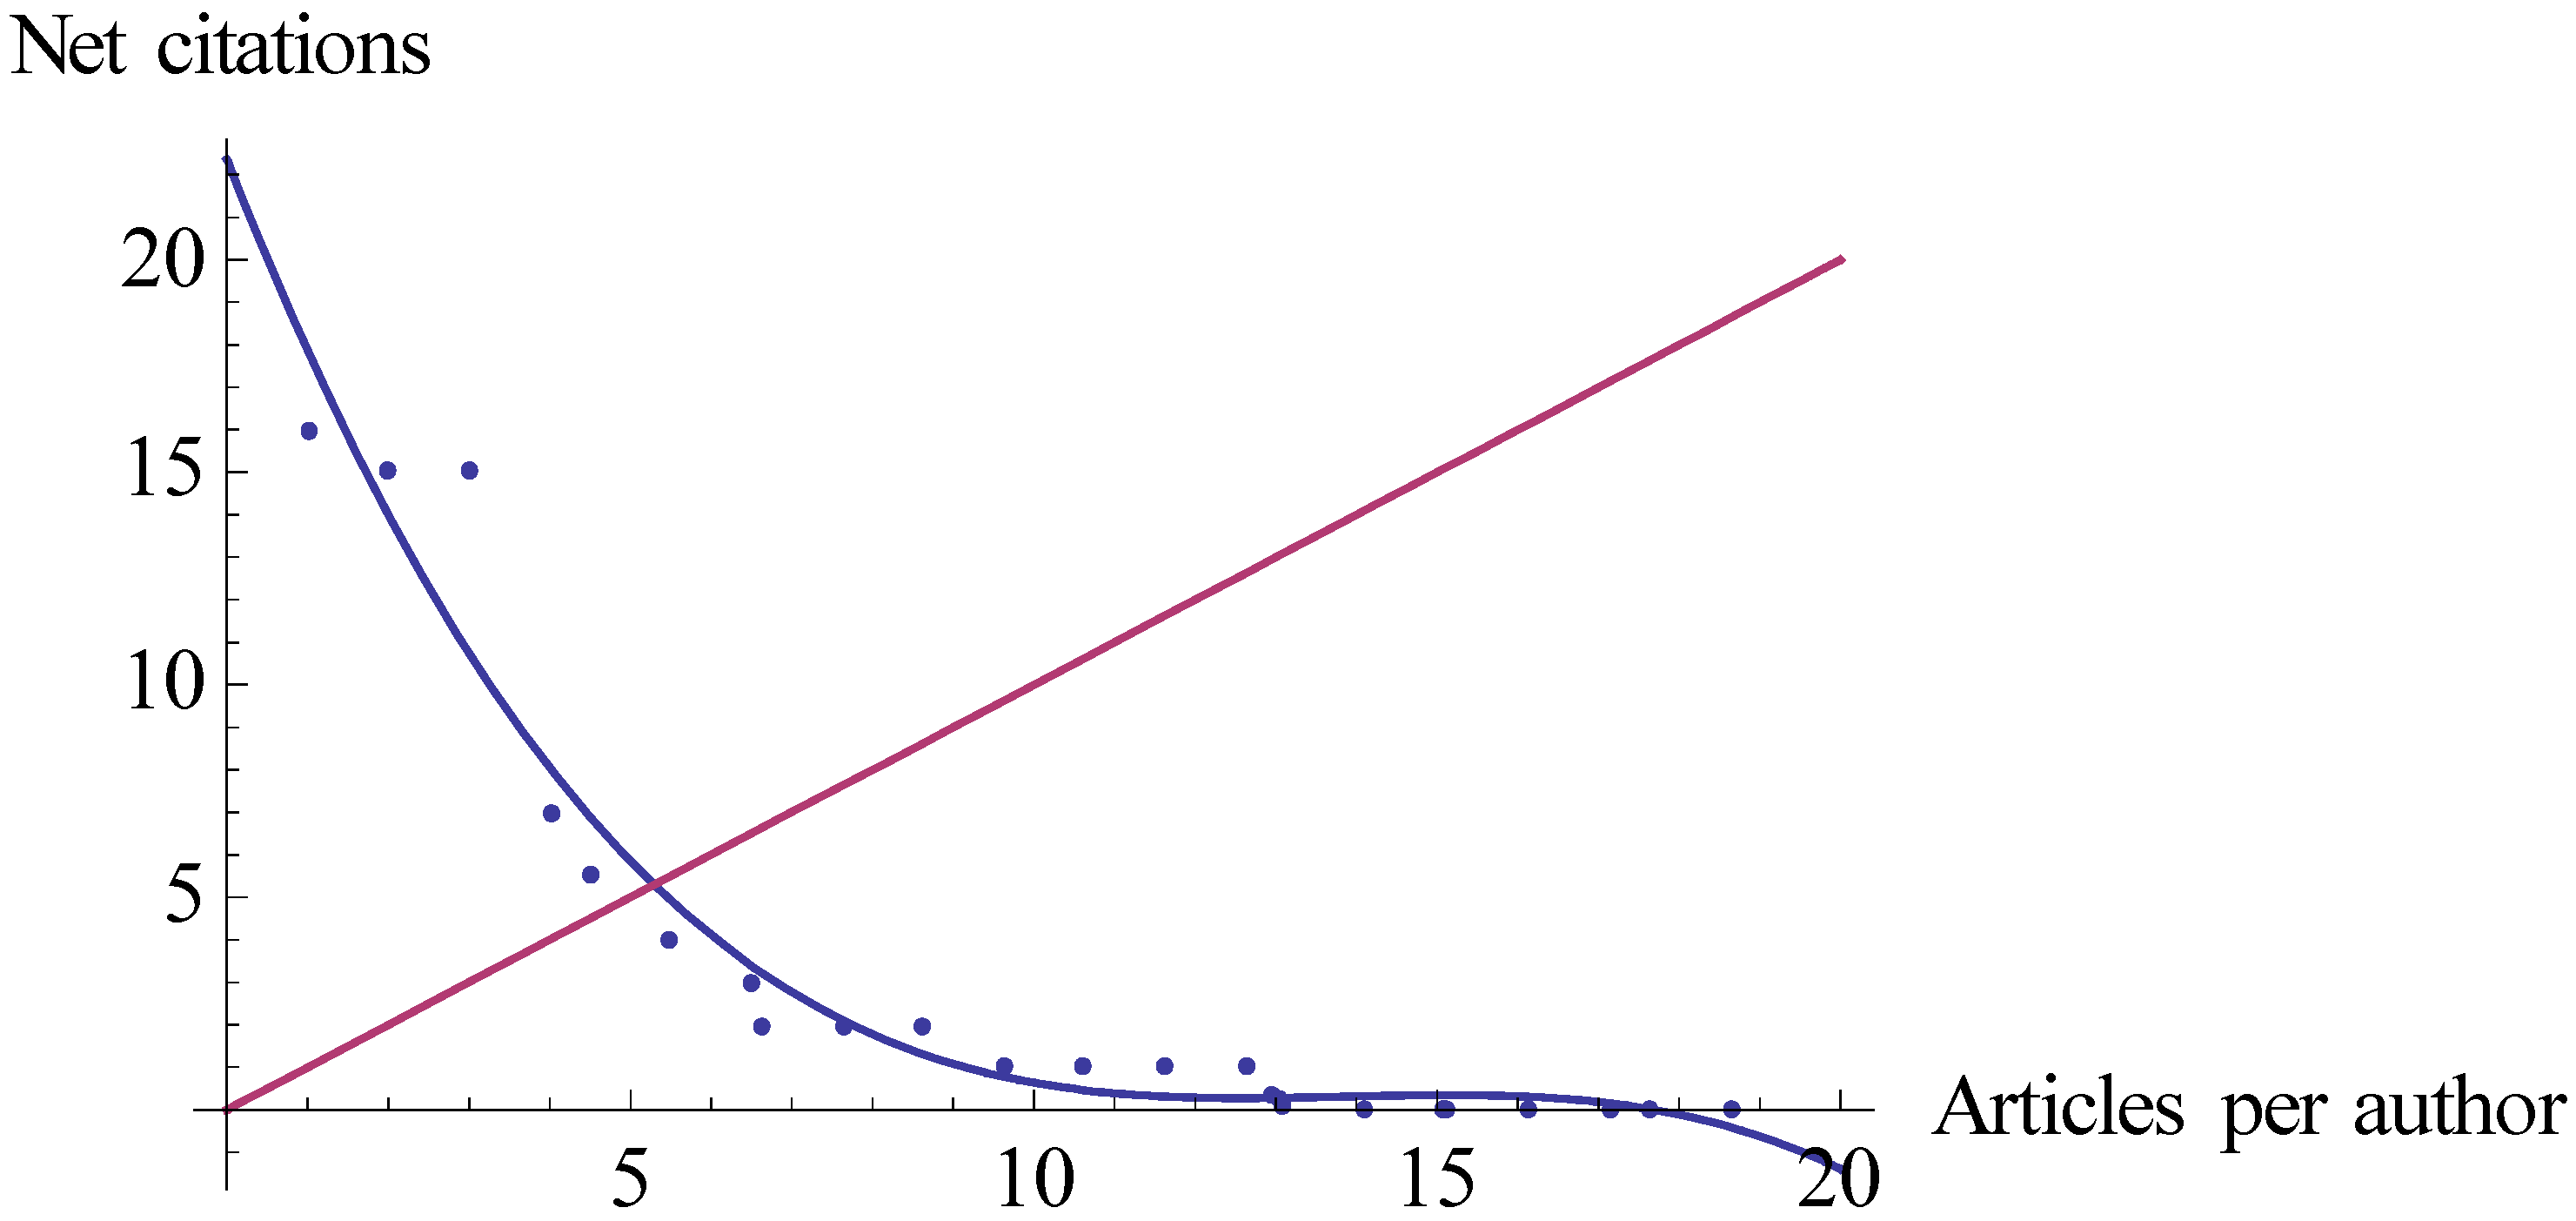
| Hctn10 | 4.93 | Hctn | 5.28 (Figure 2) |
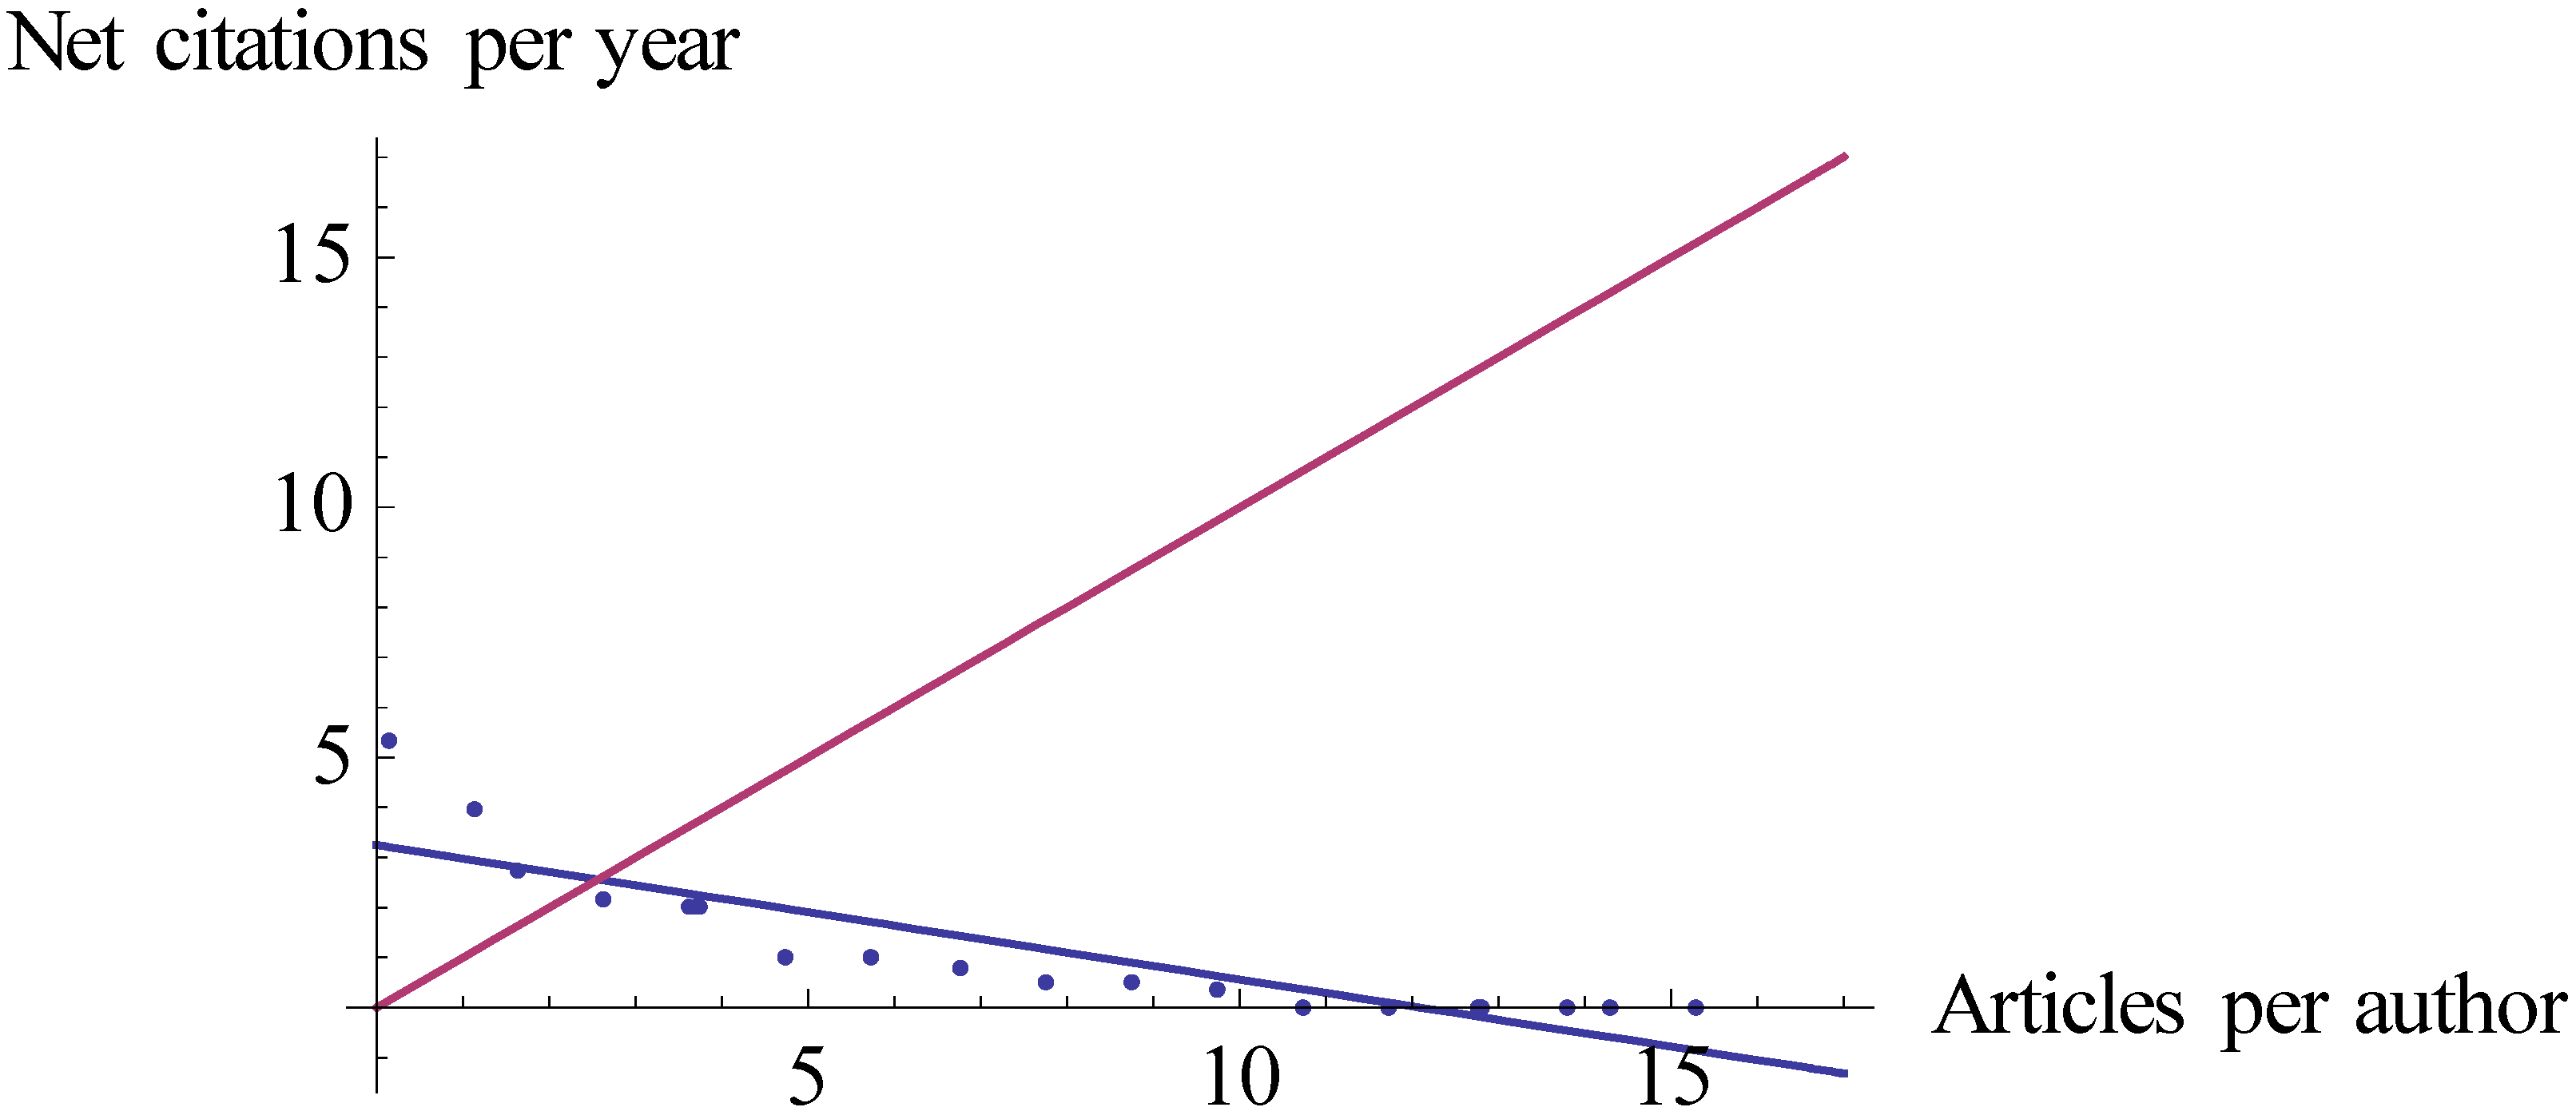
| Hlyn10 | 2.56 (Figure 3) | Hlyn | 2.43 |
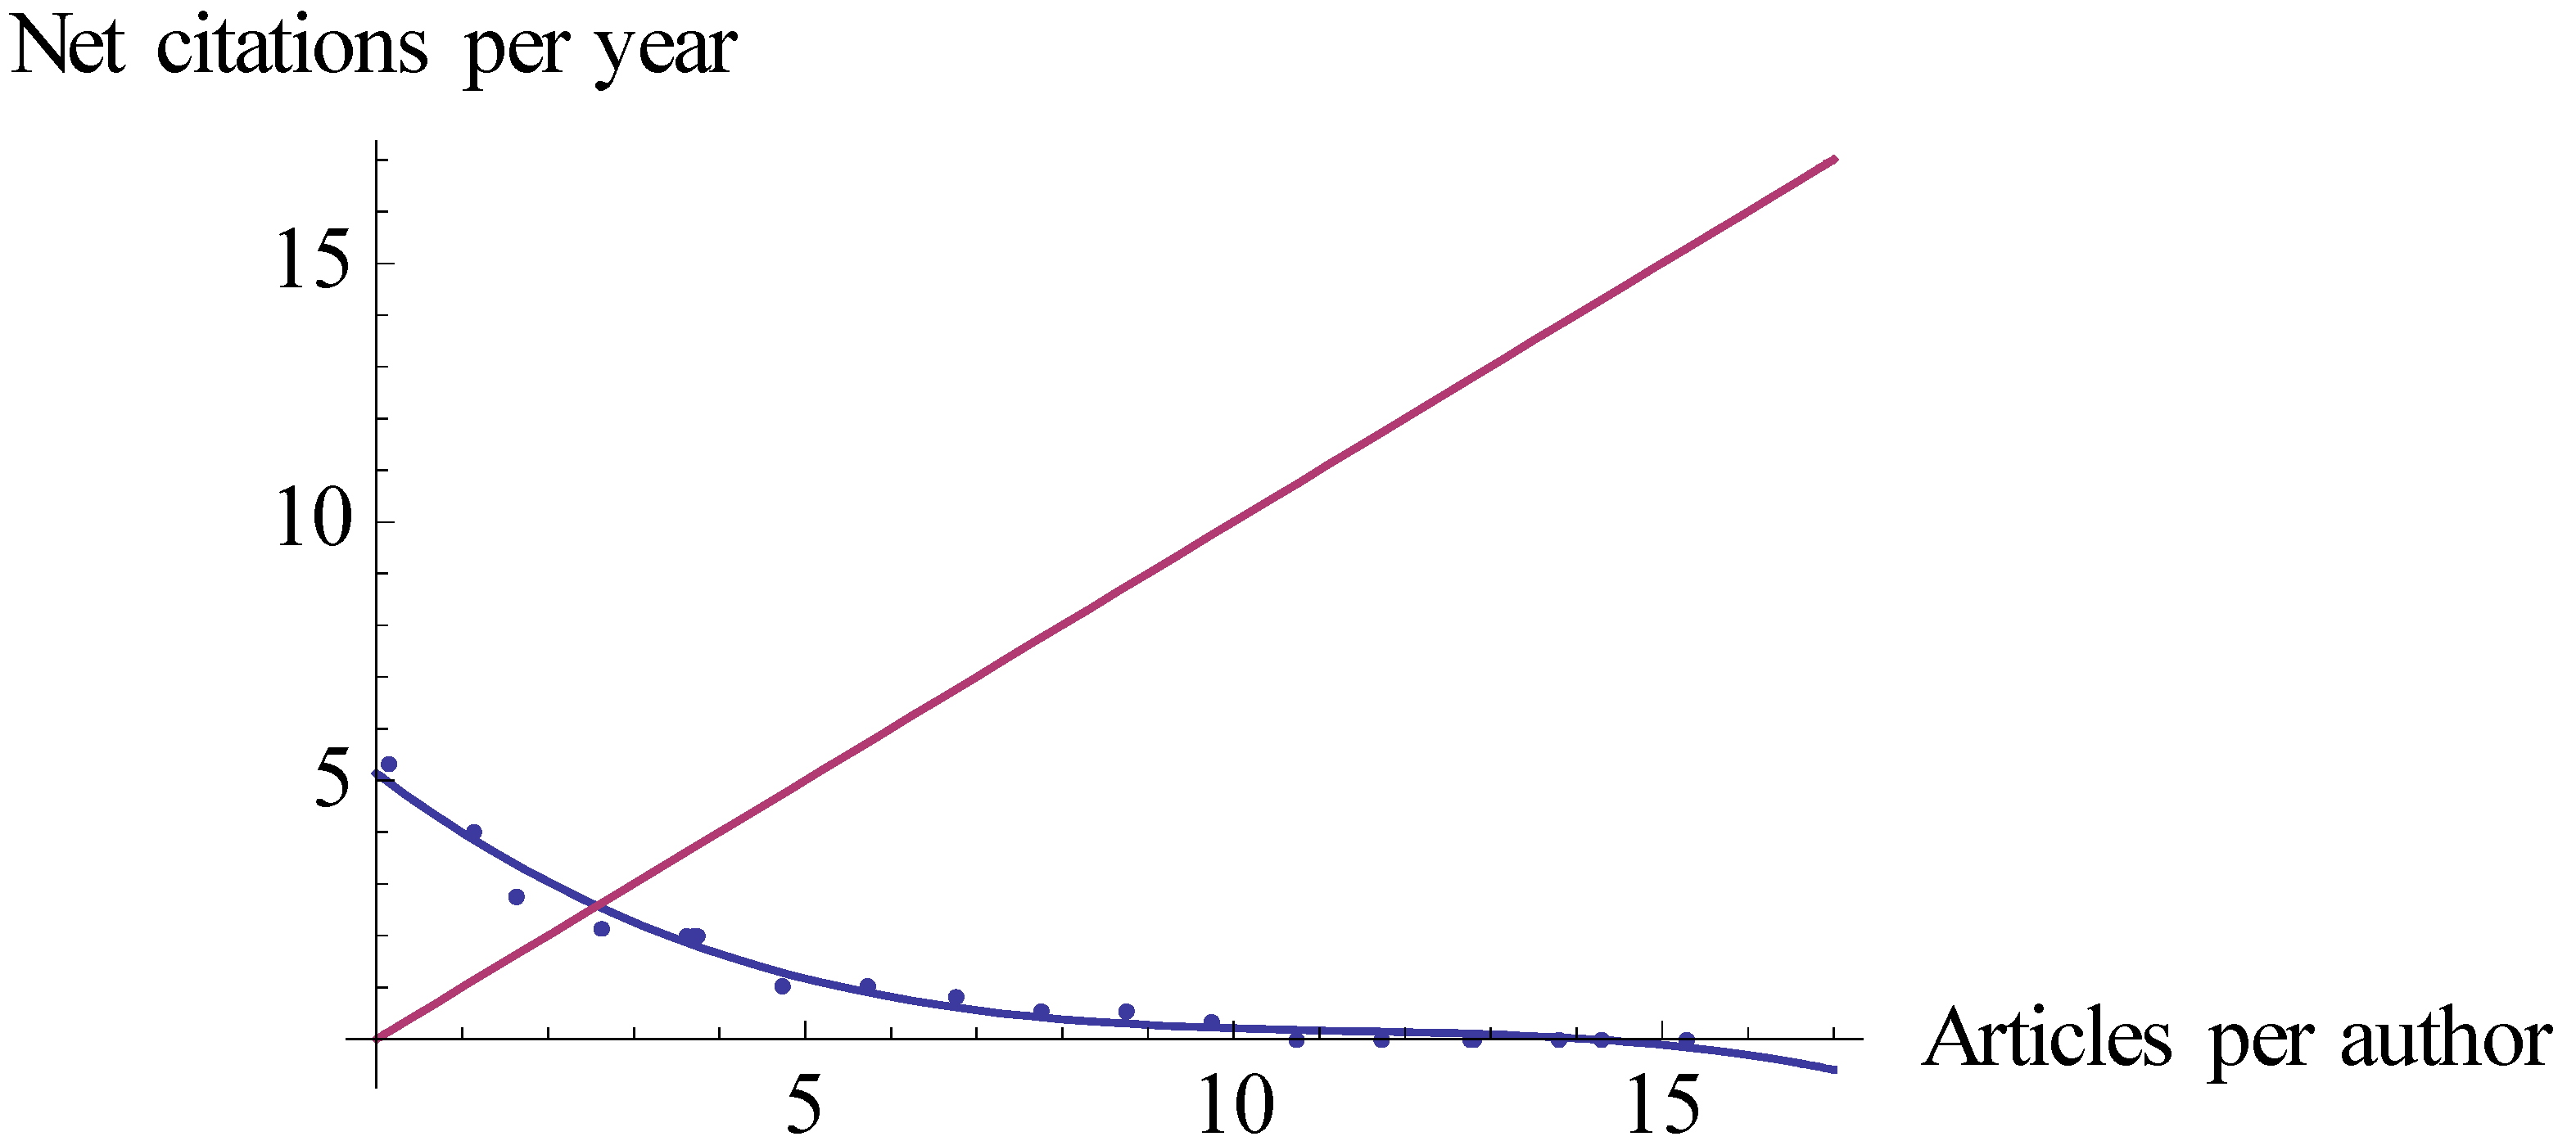
| Hcyn10 | 2.57 (Figure 4) | Hcyn | 2.60 |
| Single Author | Many Authors | |
|---|---|---|
| Single editor | Intrajournal personal relationship Opportunistic behavior by the editor and the author Many articles in the same journal (Tall but narrow red area) | Bargaining power of the editor Tactical behavior by the editor Many citations in the same journal (Large red area, but orthodox topics) |
| Many editors | Interdisciplinary reputation of the author Tactical behavior by editors Many articles in many journals (Tall but narrow yellow area) | |
| Single author | Personal relationship Opportunistic behavior by authors Many citations in many journals (Large black area) |
© 2019 by the author. Licensee MDPI, Basel, Switzerland. This article is an open access article distributed under the terms and conditions of the Creative Commons Attribution (CC BY) license (http://creativecommons.org/licenses/by/4.0/).
Share and Cite
Zagonari, F. Scientific Production and Productivity for Characterizing an Author’s Publication History: Simple and Nested Gini’s and Hirsch’s Indexes Combined. Publications 2019, 7, 32. https://doi.org/10.3390/publications7020032
Zagonari F. Scientific Production and Productivity for Characterizing an Author’s Publication History: Simple and Nested Gini’s and Hirsch’s Indexes Combined. Publications. 2019; 7(2):32. https://doi.org/10.3390/publications7020032
Chicago/Turabian StyleZagonari, Fabio. 2019. "Scientific Production and Productivity for Characterizing an Author’s Publication History: Simple and Nested Gini’s and Hirsch’s Indexes Combined" Publications 7, no. 2: 32. https://doi.org/10.3390/publications7020032
APA StyleZagonari, F. (2019). Scientific Production and Productivity for Characterizing an Author’s Publication History: Simple and Nested Gini’s and Hirsch’s Indexes Combined. Publications, 7(2), 32. https://doi.org/10.3390/publications7020032