Review

An Assessment of Scientific Productivity: Review in the Area of Agricultural and Biological Sciences in Ecuador Using Scientometrics and Lotka’s Law

1
Dirección de Investigaciones, Instituto Nacional de Investigaciones Agropecuarias (INIAP), Av. Eloy Alfaro N30-350 y Amazonas, Quito 170518, Ecuador
2
Grupo de Investigación en Alimentos y Agroindustria (GIA2), Ingeniería Agroindustrial, Universidad de Las Américas (UDLA), Redondel del Ciclista Vía a Nayón, Quito 170124, Ecuador
*
Author to whom correspondence should be addressed.
Publications 2025, 13(4), 59; https://doi.org/10.3390/publications13040059
Submission received: 2 October 2025 / Revised: 11 November 2025 / Accepted: 13 November 2025 / Published: 19 November 2025

Abstract

Scientific production is a key indicator of a country’s academic and institutional development. This review followed a quantitative and descriptive bibliometric design using Lotka’s Law, aimed at analysing Ecuador’s scientific production in the area of Agricultural and Biological Sciences from 2014 to 2024. The bibliographic data were obtained from the Scopus database, which offers comprehensive coverage of the peer-reviewed literature and standardised metadata. Data (2881 documents) revealed publication patterns, collaboration networks and impact indicators. Lotka’s Law was applied to evaluate and describe author productivity among researchers affiliated with Ecuadorian universities and the Instituto Nacional de Investigaciones Agropecuarias (INIAP). The model yielded an average n-parameter of 2.56, indicating a moderate concentration among a small group of researchers. There was a sustained growth in scientific publications, especially after 2018, with a high proportion published in Q1 and Q2 journals. The institutions with the most relevant affiliations included PUCE, UTM, USFQ, INIAP, ESPOL and UDLA, all maintaining consistent contributions to scientific output. The keyword co-occurrence analysis revealed a thematic focus on biodiversity, taxonomy and conservation. The limitations of this study were related to the fact that the analysis was based only on data retrieved from the Scopus database and that the use of Lotka’s Law assumes a theoretical distribution that does not fully account for contextual factors. Overall, Ecuador’s scientific system shows progress in terms of research productivity; however, it requires further development and the strengthening of institutional and human research capacities to generate more equitable scientific production in terms of the number of researchers.

1. Introduction

The final step in a research cycle is the publication of a scientific article in a specialised journal in order to share the research results with the scientific and academic community (Inglesi-Lotz & Pouris, 2011; Armijos Valdivieso et al., 2022). This constitutes scientific production. Research is a crucial instrument for professional improvement (Méndez-Vélez et al., 2022), and scientific research productivity has been related to countries’ intellectual wealth and economic development (Jaffe et al., 2020). Therefore, publications are necessary in order to enhance science, improve institutional quality and contribute to solving real problems (Álvarez & Blasco, 2014).
Scientific production is of essential importance when evaluating the contribution of a research institution; therefore, it is fundamental to analyse the reality of this topic to increase the current dissemination of knowledge (Méndez-Vélez et al., 2022). A constant problem that emerges in the scientific and academic world related to scientific practice is the productivity of its participants in the form of publications, both in terms of quantity and quality (Urbizagástegui, 2005). Cattell (1910) stated that it was not known whether the progress of science was due to the large number of common workers or to the genius of a few. Therefore, one could ask whether the contribution of prolific producers is of lower, equal, or higher quality than that of smaller producers (Urbizagástegui, 2005).
Scientometrics is a method that uses tools such as bibliometric analysis and statistical concepts to identify the interrelationships between different research articles, deciphering the knowledge evolution process within a particular research topic (Chen, 2006). It allows for investigating and recognising the development and dynamics of scientific tendencies between a variety of research opportunities by applying a quantitative analysis of the scientific data from scientific production (Belfiore et al., 2022; Cruz-Ramírez et al., 2014; Cardona-Román & Sánchez-Torres, 2017). Analysing the evolution of documented scientific knowledge is based on secondary sources about academic contributions, such as publications indexed in scientific journals (Sianes et al., 2022).
The weight of scientific production is measured by journal metrics such as the impact factor, SCImago Journal Rank (SJR) and CiteScore (García Peñalvo, 2022); however, they are not directly related to the researcher’s productivity. Therefore, other methods, e.g., Lotka’s Law, are used to analyse a researcher’s scientific productivity. In recent decades, research productivity has been a subject of interest for some scholars, who have focused on the analysis and distribution of the number of publications and the factors that directly or indirectly influence productivity (Armijos Valdivieso et al., 2022). Lotka (1926), who initiated the study of research outputs (publications), proposed the inverse square law concerning the unequal distribution of research productivity. Lotka’s Law is based on a discrete probability distribution to describe authors’ productivity (Urbizagástegui, 2006). This mathematical model describes the relationship between authors and their productivity within a field of science (Cáceres-Ruiz, 2019). Lotka (1926) observed that a large majority of authors had only one contribution, while those with more contributions represented a small proportion, showing an asymmetric distribution with a negative correlation (Martín Sobrino et al., 2008), a trend where the minority was responsible for generating the largest proportion of contributions (Restrepo & Urbizagástegui, 2012).
Lotka’s Law of scientific productivity is a bibliometric example of contrasting the number of authors against the number of contributions made by those authors (Kawamura et al., 2000). It has been used in several areas of science and tested against many datasets, but the fit has not always been good. For instance, Murphy (1973) and Martín Sobrino et al. (2008) analysed data about scientific production in humanities and in information science using Lotka’s Law and concluded that this model is reasonably applicable to those specialties. Other authors, such as Pulgarín and Gil-Leiva (2004) and Urbizagástegui (2006), also reported that Lotka’s Law adjusted well to studies about indexation and literature. However, Radhakrishnan and Kerdizan (1979), Kawamura et al. (2000) and Nagaiah et al. (2021) found that this model did not fit properly to the data about publications in informatics, dental science and education studies.
Unfortunately, this method has not been sufficiently tested in Latin American bibliometry (Urbizagástegui, 2005) and it is impossible to talk about Lotka’s Law without talking about bibliometrics as a discipline in search of consolidation, autonomy and legitimisation as a scientific field (Urbizagástegui, 2005). Therefore, it is expected that further research will be carried out to test Lotka’s Law in other areas of science and determine its fit, given the variable results from previous studies.
Ecuador’s research has captured the attention of the scientific community in recent years (Herrera-Franco et al., 2021). The nation’s scientific production has followed an evolutionary trend parallel to that of other Latin American countries (W. Viera-Arroyo et al., 2020). Yet Ecuador also stands out, ranking among the top in Latin America and the Caribbean for its scientific production (Moreira-Mieles et al., 2020). This tendency has increased during recent years; therefore, an extended and complex process of scientific production is ongoing (W. Viera-Arroyo et al., 2020; Herrera-Franco et al., 2021; Méndez-Vélez et al., 2022). In Ecuador, academic institutions and research institutes carry out research in Agriculture and Biological Sciences and, consequently, play an essential role in the generation of scientific information for different agricultural areas and crops. The objective of this study was to analyse scientific production in the field of Agricultural and Biological Sciences in Ecuador using scientometric analysis and Lotka’s Law during the period 2014–2024.

2. Materials and Methods

2.1. Study Design

This research followed a quantitative and descriptive bibliometric design aimed at analysing Ecuador’s scientific production in the field of Agricultural and Biological Sciences between 2014 and 2024. The approach is grounded in bibliometric analysis indicators and data visualisation, allowing the identification of productivity patterns, collaboration networks and research quality indicators such as citations and impact.

2.1.1. Data Source

The bibliographic data were obtained from the Scopus database, which offers comprehensive coverage of peer-reviewed literature and standardised metadata, widely recognised for its reliability in bibliometric analyses (Montoya et al., 2018). Scopus provides detailed information on publication year, author affiliations, source titles, subject areas and citation metrics variables that enable consistent comparison across institutions and time periods.

2.1.2. Data Collection and Screening

The data were sourced from the Scopus database using an advanced search with the field code “AFFILCOUNTRY(ECUADOR)”. Initially, all documents were selected by choosing the options “All” and “Show all documents”, which yielded a total of 60,451 records. A temporal filter was then applied, limiting the publication years to 2014–2024 and resulting in 50,913 records. To narrow the scope of the study, a subject area filter was applied, retaining only the area “Agricultural and Biological Sciences” as defined by Scopus. All other areas were excluded. This filtering process led to a final dataset of 2881 documents, which constituted the basis for further analysis and was exported in CSV format for scientometric analysis (Figure 1).

2.2. Bibliometric Analysis

This analysis was conducted using the Biblioshiny web application, integrated within the bibliometrix R package (version 4.3.0), which provides a user-friendly interface for executing reproducible and structured scientometric workflows without requiring advanced programming skills. This platform served as the core analytical tool for evaluating author productivity (ranking researchers by the number of articles published) and grouping outputs by institutional affiliation to highlight the institutions with the highest scientific contribution. Biblioshiny was also employed to identify the top ten journals publishing Ecuadorian research in Agricultural and Biological Sciences, along with their editorial and bibliometric attributes (e.g., SJR score, h-index and impact factor). In addition, international collaboration networks were analysed using co-authorship data retrieved from Scopus, distinguishing between Single Country Publications (SCPs), produced solely by Ecuadorian institutions and Multi Country Publications (MCPs), developed through partnerships with foreign institutions. The same tool supported the assessment of institutional participation from 2014 to 2024 by quantifying publication output per affiliation, including universities and public research centres. All resulting datasets were exported and refined in Microsoft Excel to generate figures, tables and density maps that revealed global research linkages and institutional research performance.
To identify key research topics and thematic structures, a keyword co-occurrence analysis was conducted using VOSviewer (version 1.6.20). The analysis focused exclusively on author keywords, as these reflect the thematic content directly defined by the authors of the publications. Prior to the analysis, a manual standardisation process was conducted through the creation of a thesaurus.txt file in plain text format. This file was used to unify terms by addressing variations such as spelling differences, synonyms, translations, plural/singular forms and typographical inconsistencies, ensuring consistency in the keyword network. The keyword “Ecuador” was deliberately excluded from the analysis using the thesaurus file, as it was present in a large number of records and did not contribute meaningfully to topic differentiation. The counting method used in VOSviewer was full counting, whereby each keyword is given equal weight regardless of the number of keywords per publication. A minimum threshold of 8 co-occurrences was set to filter out infrequent or marginal keywords that might not contribute meaningfully to the network structure.

2.3. Lotka’s Law

Lotka’s Law was applied in its generalised inverse power form to assess the scientific productivity distribution among Ecuadorian authors in the field of Agricultural and Biological Sciences. This bibliometric model assumes that a large proportion of authors publish only once, while a small number contribute a large number of publications. The model is expressed as: y = C/Xn, where “y” is the number of authors with “X” publications, “C” is a constant and “n” is the exponent that describes the slope of the productivity distribution.
Data were extracted from the Scopus database covering the period 2014–2024. Authors were grouped according to their total number of publications. To estimate the “n” parameter, a log–log transformation was applied and a linear regression was conducted on the pairs (log x, log y) following the method proposed by Pao (1986) and refined in later studies such as Portal (2005). The methodology followed these steps: (1) Aggregation of authors based on the number of publications; (2) Logarithmic transformation of both “X” and “y” variables; (3) Estimation of the slope “n” via ordinary least squares (OLS) regression on the log-transformed data; (4) Determination of the constant “K” as the number of authors with one publication; (5) Calculation of the k-constant, defined as the proportion of authors with only one publication; and (6) Goodness-of-fit assessment using the Kolmogorov–Smirnov (K-S) test at a 1% significance level, comparing the cumulative observed and expected distributions.
The resulting “n” value reflects the degree of inequality in author productivity: lower values indicate a more even distribution, while higher values suggest increased concentration. The k-constant provides insight into the maturity of the research field; higher values typically indicate a more transient authorship structure.

3. Results

3.1. Scientometric Analysis

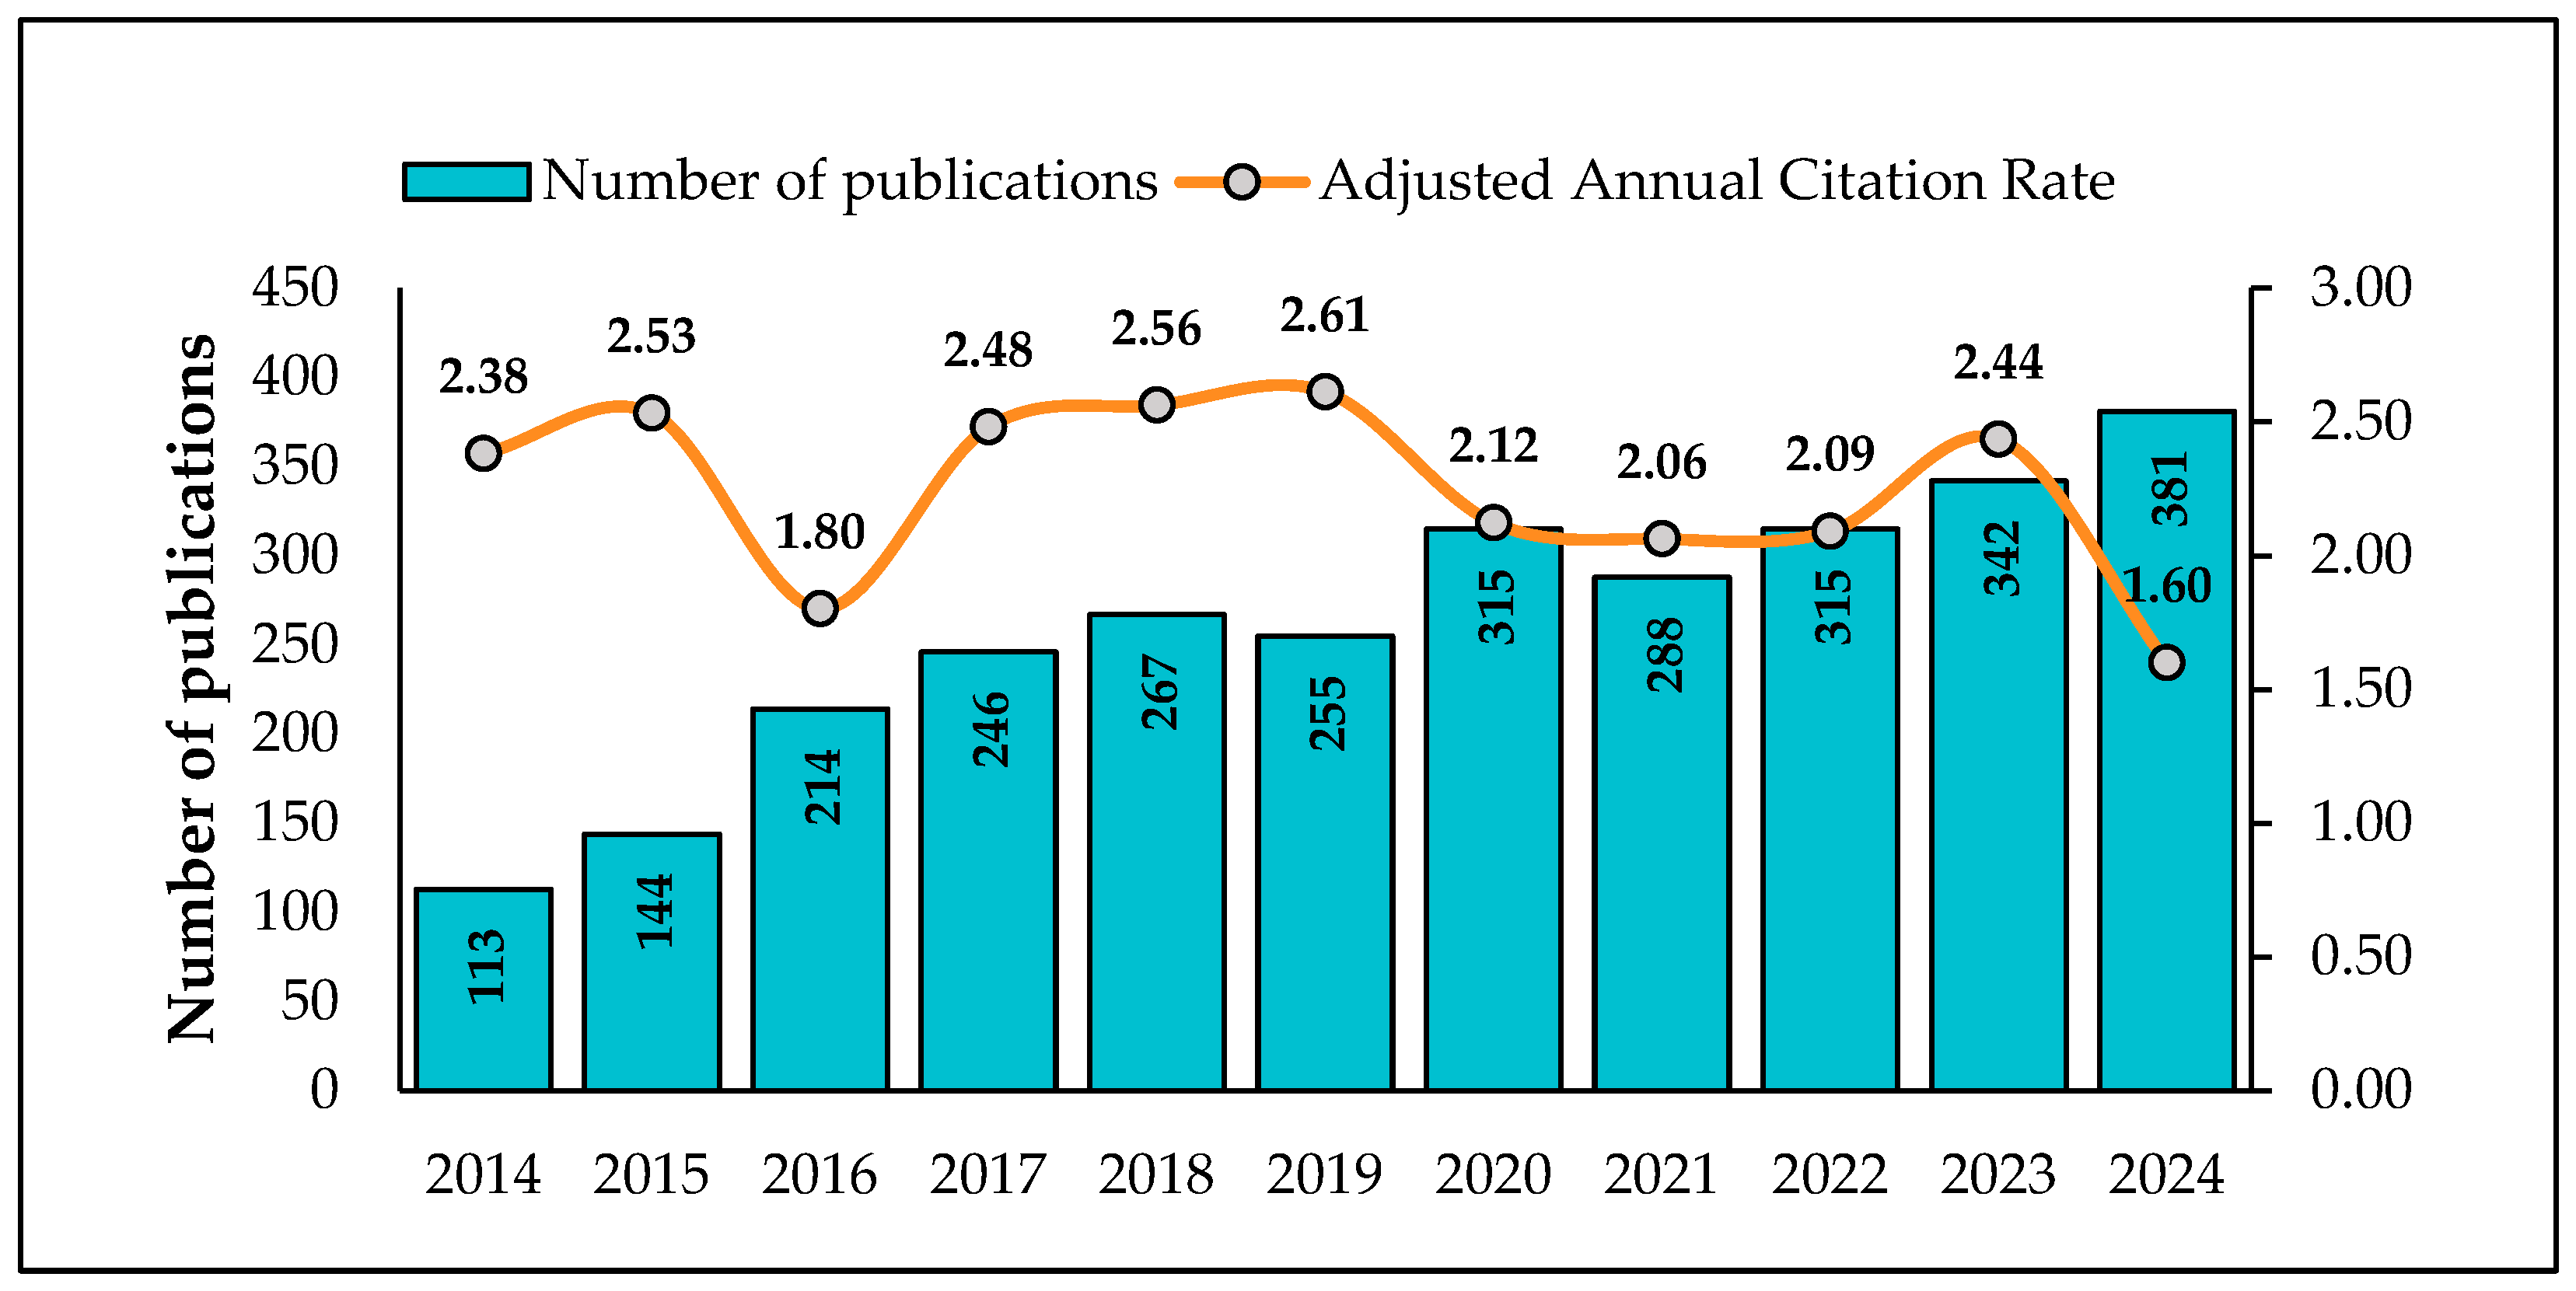
Figure 2 illustrates the temporal evolution of Ecuadorian scientific production in Agricultural and Biological Sciences over the period 2014–2024. A sustained increase in the number of publications was observed, rising from 113 in 2014 to 381 in 2024, demonstrating a progressive expansion in scientific productivity. In the early years (2014–2015), output was less than 150 documents, while from 2017 onward, it exceeded 200 publications annually, reaching its highest levels in 2023 and 2024. The annual citation-adjusted rate (ACAR) ranged from 1.6 to 2.6 during the analysed period. The highest values were recorded in 2018 (2.56) and 2019 (2.61), while the lowest corresponded to 2016 (1.80) and 2024 (1.60). Between 2020 and 2023, the ACAR remained relatively stable, with values close to 2.1. The time adjustment applied to the ACAR takes into account the fact that older articles have had more time to accumulate citations, allowing for a more equitable comparison of impact across different publication years. This approach provides a more accurate view of the relative impact of publications over the evaluated period.
Table 1 shows the ten scientific journals with the highest number of Ecuadorian publications in Agricultural and Biological Sciences for 2014–2024. In terms of output, Zootaxa and Phytotaxa lead with 100 articles each (3.47% of the total), whereas Bioagro ranks at the bottom with 34 publications (1.18%). Regarding citations, Zootaxa stands out as the most influential with 1368 citations, while Revista de la Facultad de Agronomía (Universidad de Zulia) has only 82 citations. For the h-index, the highest value corresponds to Frontiers in Plant Science (216), while the lowest is reported by Scientia Agropecuaria (12). Finally, in terms of the SJR 2024 (impact score), the maximum is found in Frontiers in Plant Science (1.163, Q1) and the minimum in the Revista de la Facultad de Agronomía (0.13, Q4).
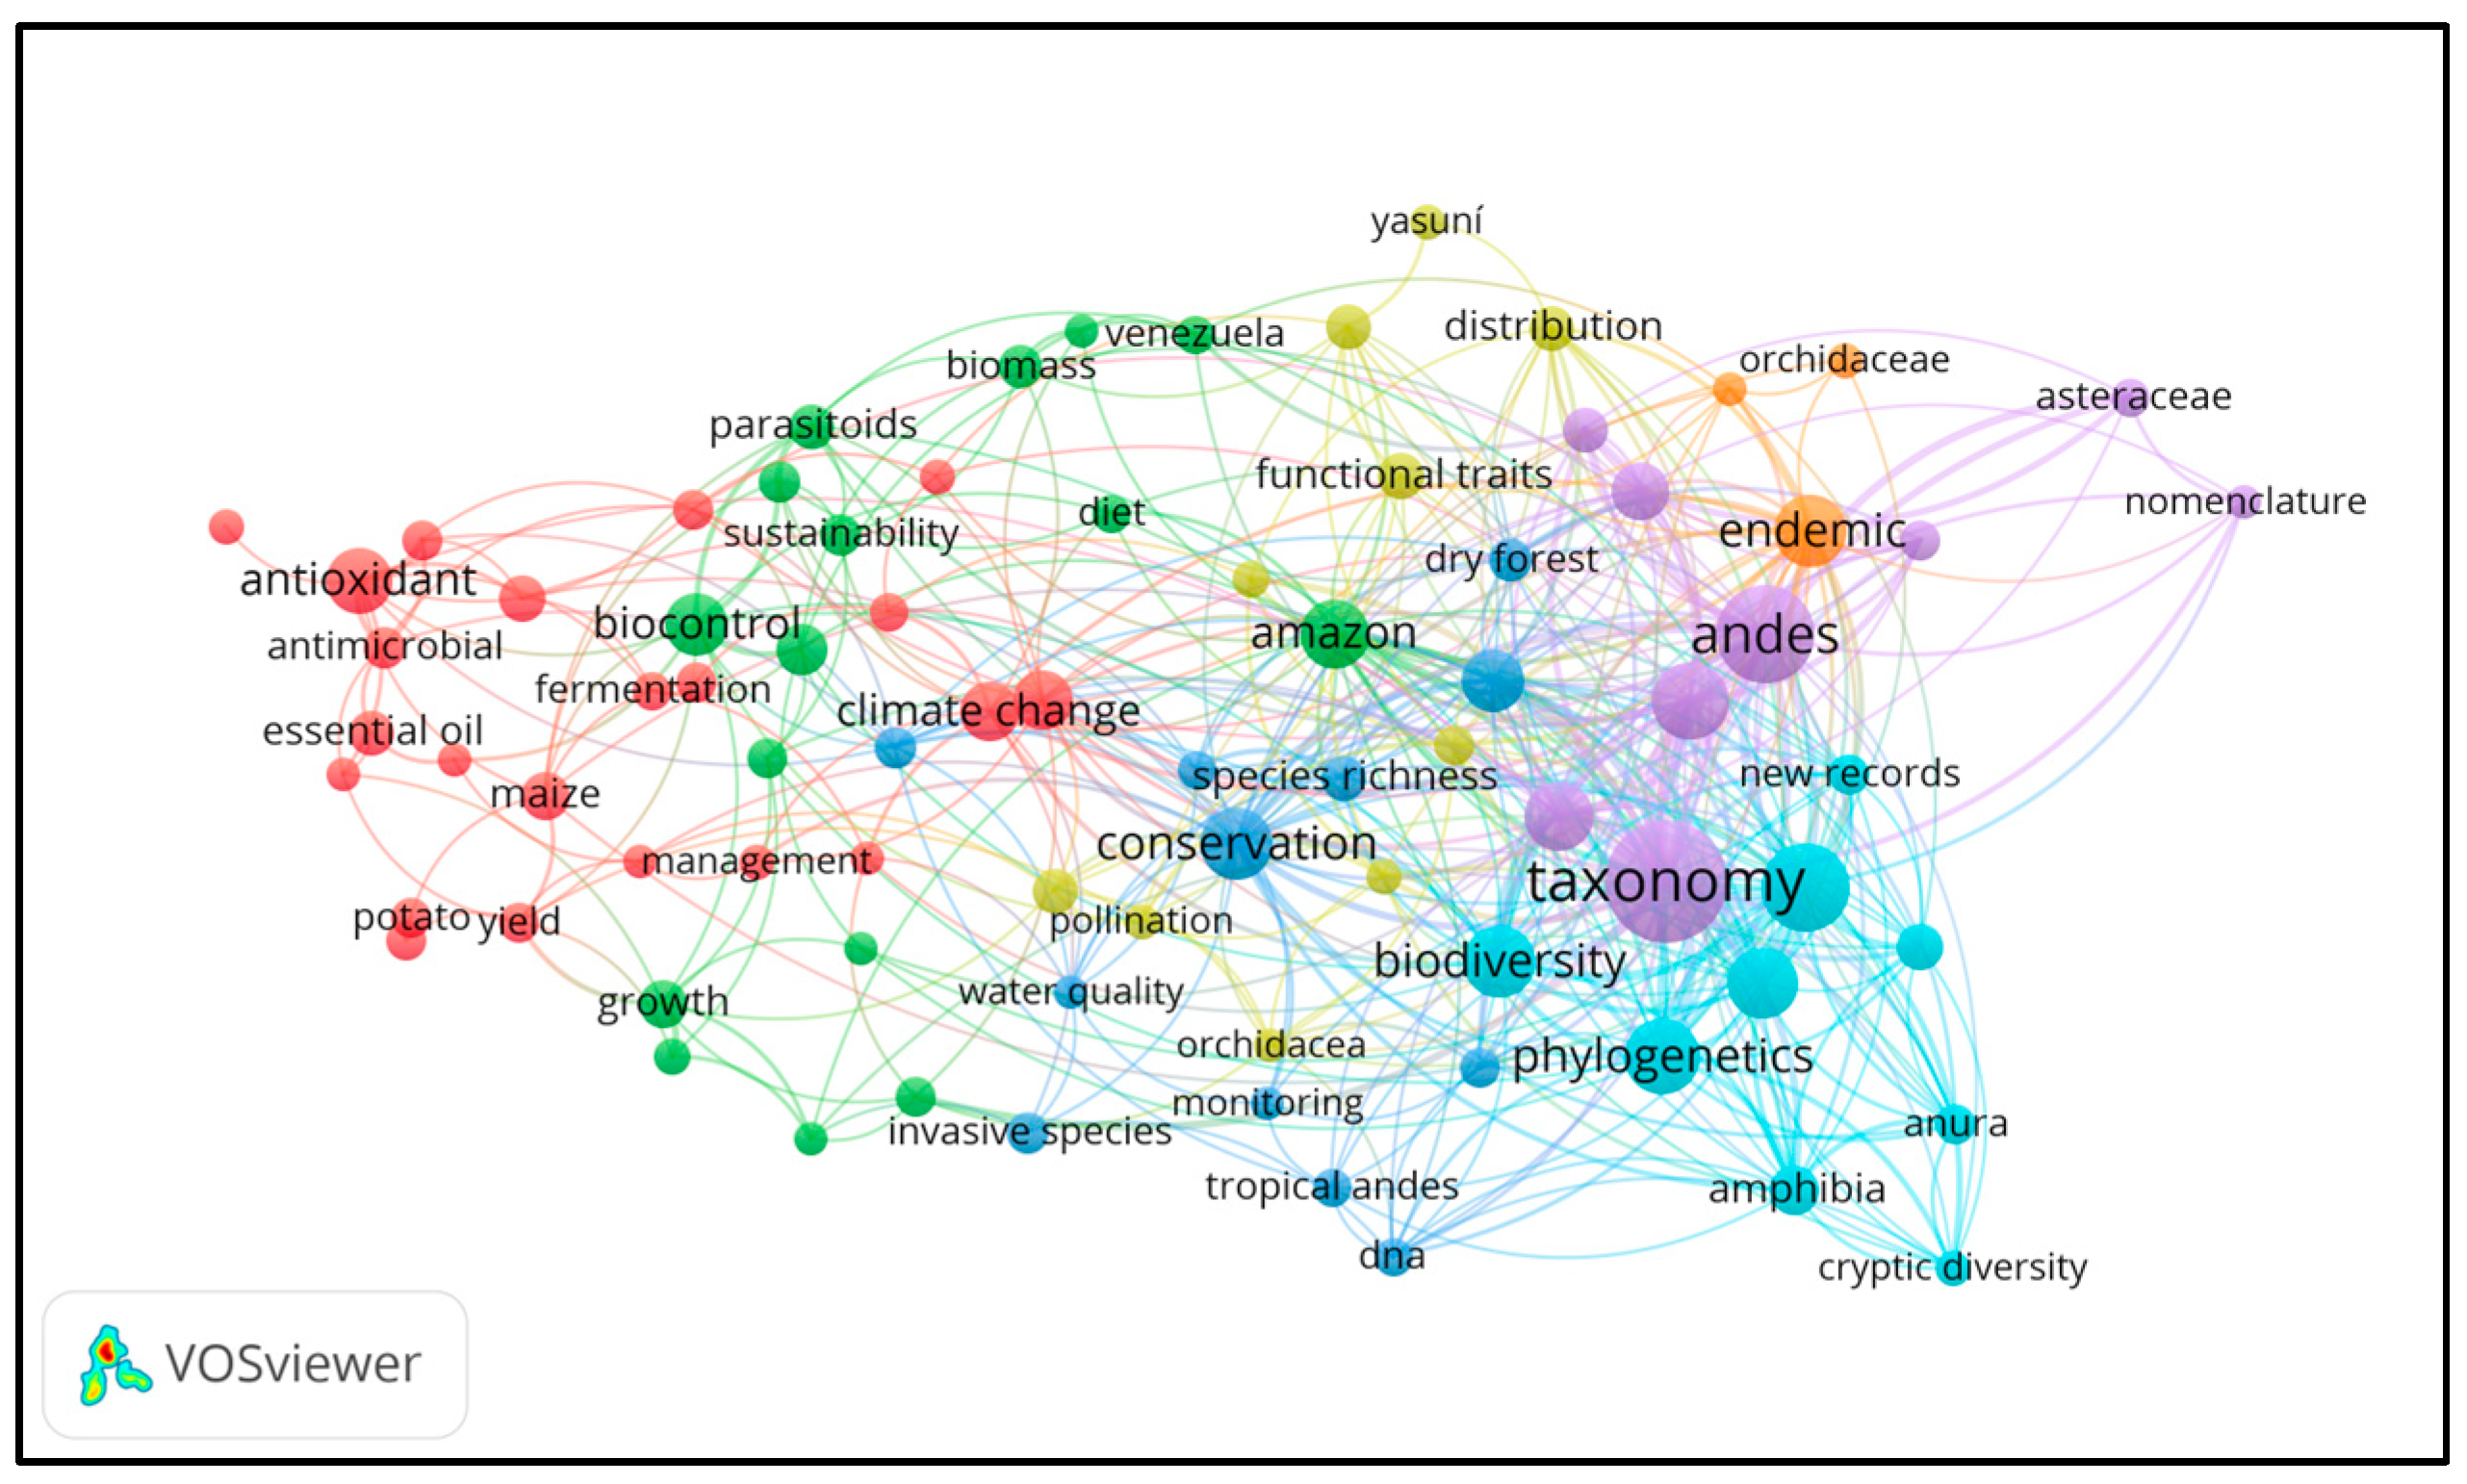
Figure 3 shows a co-occurrence network of keywords extracted from the Biological Sciences area. At least eight distinct thematic clusters are identified, representing independent but interconnected lines of research. The most prominent cluster rotates around the keyword “taxonomy”, which presents the highest centrality and frequency, reflecting its articulating role in the scientific production of the area. Other representative terms include “neotrop”, “Andes”, “diversity”, “endemism”, “Amazon” and “phylogenetics”. The density of links between clusters highlights the interdisciplinary nature of the research, particularly between taxonomy, conservation, biogeography and evolution. This visualisation reveals that the predominant approach is taxonomic, with a solid foundation in ecology and systematics, closely linked to the Amazonian and Andean context.
The top ten most productive authors in the field of Agricultural and Biological Sciences in Ecuador (2014–2024) displayed varied patterns of scientific contribution across institutions (Table 2). The Universidad de Guayaquil (UG) recorded the highest number of publications per author (54), while both the Escuela Superior Politécnica del Litoral (ESPOL) and the Universidad Técnica Estatal de Quevedo (UTEQ) had the lowest (31 each). The highest Field-Weighted Citation Impact (FWCI) was observed for an author affiliated with UG (2.92), whereas the lowest value was associated with the Universidad de las Américas (UDLA, 0.43). In terms of the h-index, an author from the Pontificia Universidad Católica del Ecuador (PUCE) achieved the highest value (33), contrasting with the lowest h-index (7) from an author affiliated with UDLA. Regarding first-author contributions, the leading percentage was from UTEQ (39%), while ESPOL reported no first-author participation among its top authors. For last-author roles, the Universidad Técnica Particular de Loja (UTPL) led with 64%, compared to only 6% for UTEQ. As for corresponding author roles, PUCE had the highest (56%), while UTPL registered the lowest (21%). In terms of international collaboration, PUCE stood out again with 95.5%, significantly surpassing the Instituto Nacional de Investigaciones Agropecuarias (INIAP), which recorded 32.4%. When analysing the proportion of documents within the top citation percentiles, PUCE led with 48.8%, whereas UDLA had just 3.8%. Finally, considering publications in top 25% journals, the leading author from PUCE had 51.2% of their output in these outlets, in contrast to only 4.4% for UTEQ.
Xavier Cornejo (UG) leads with 54 publications, showing a balanced authorship profile, including 16% as a single author, which is indicative of both individual initiative and collaborative involvement. Luis Baquero (UDLA) and César Lodeiros (Universidad Técnica de Manabí (UTM)) have also contributed significantly, with strong representation as last authors (39% and 45%, respectively), suggesting prominence in multi-author studies. Meanwhile, Santiago Ron (PUCE) and Juan Reyes (UTEQ) display contrasting styles: the former participates primarily as a co-author (56%) with no solo-authored work, while the latter leads as a first author in 39% of his papers. Felipe Garcés (UTPL) and Álvaro Pérez (PUCE) stand out for their roles as last and co-authors, respectively, reflecting mature academic positioning within research teams. William Viera-Arroyo (INIAP) also shows a consistent contribution, with 32 publications and a balanced authorship profile: 29% as a first author and 40% as a co-author, indicating active involvement in both leading and collaborative roles.
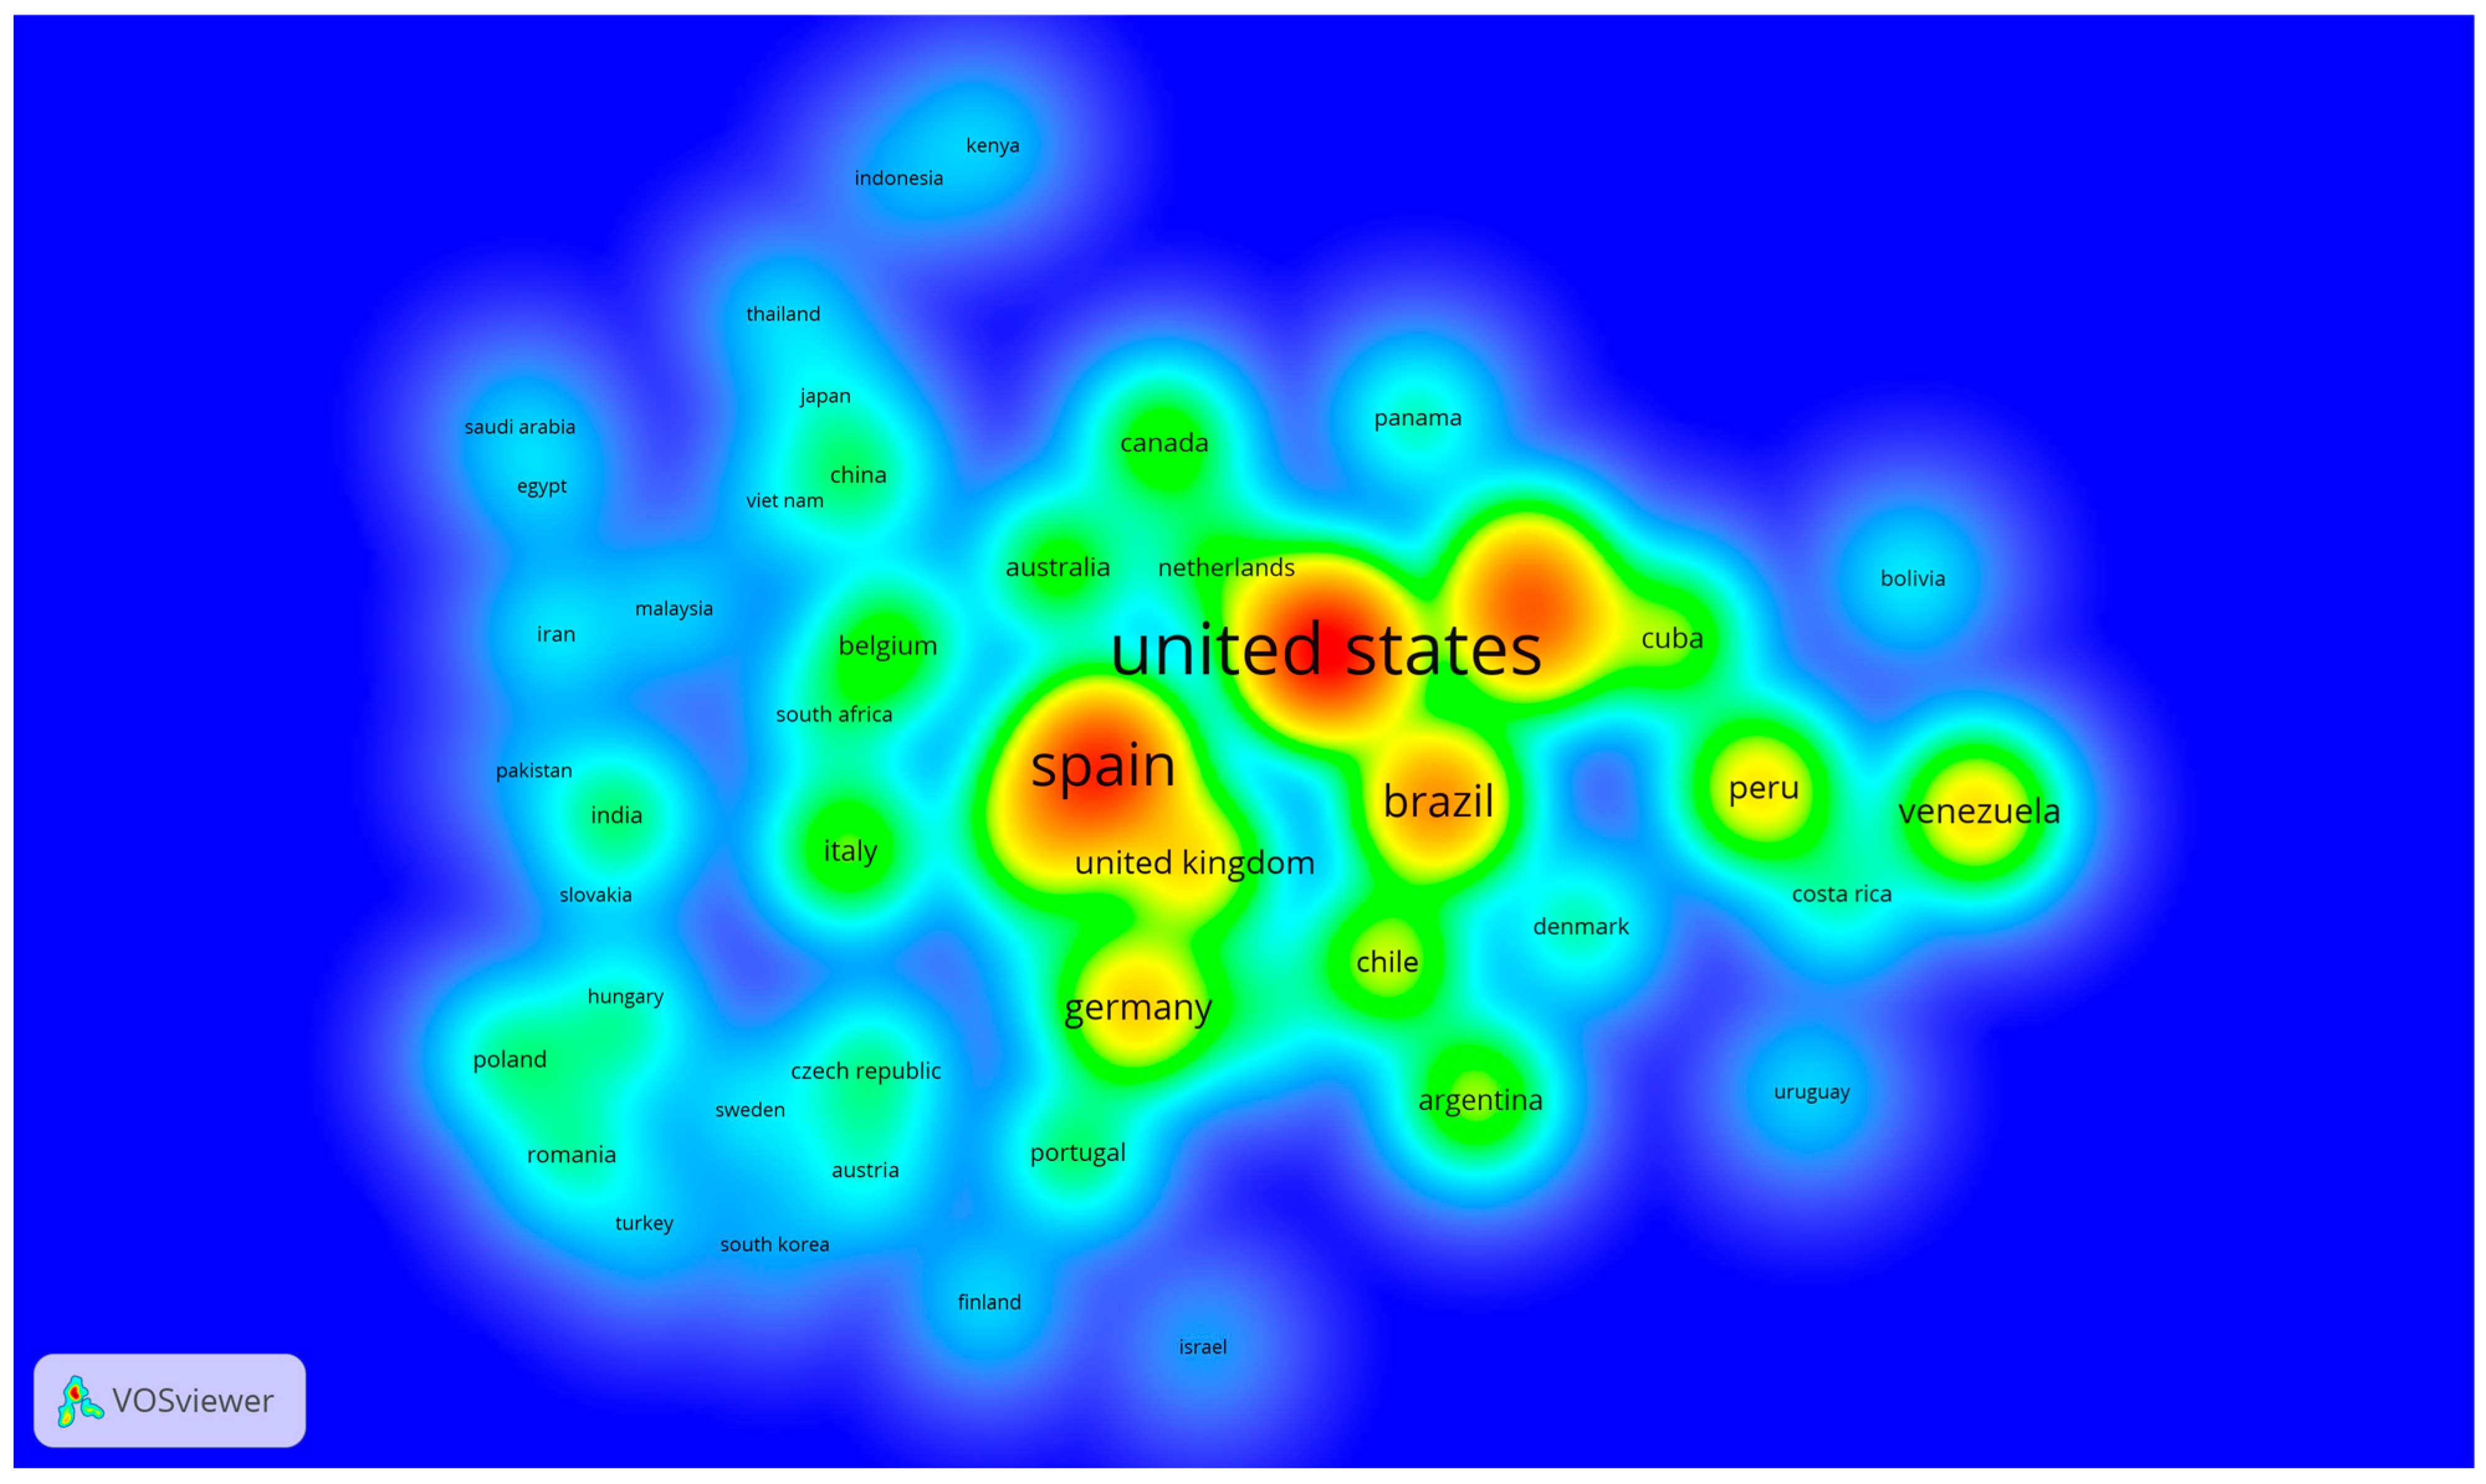
Figure 4 and Figure 5 show the international dimension of Ecuador’s scientific production in Agricultural and Biological Sciences between 2014 and 2024. Figure 4 presents a density map of collaborative networks. The countries with the highest co-authorship intensity with Ecuador are the United States, Spain, Mexico, Brazil, Germany, Chile and the United Kingdom. Countries such as Colombia, the Netherlands and Peru appear with moderate intensity, while Costa Rica, Bolivia, Venezuela and Uruguay are located in peripheral zones. Figure 5 shows that the United States is the main partner country, with the highest number of joint publications with Ecuador: 215 single-country publications (SCP) and 9 multi-country publications (MCP). Spain follows as the second most relevant collaborator, with 191 SCP and 14 MCP, representing the highest number of MCP among the partner countries. At the opposite end, the lowest publication counts are observed in Venezuela (33 SCP; 3 MCP), the United Kingdom (37 SCP; 1 MCP) and France (34 SCP; 1 MCP). Notably, Germany appears among the leading collaborators in terms of SCP (69) but registers no MCP during the period.

Most Relevant Affiliations

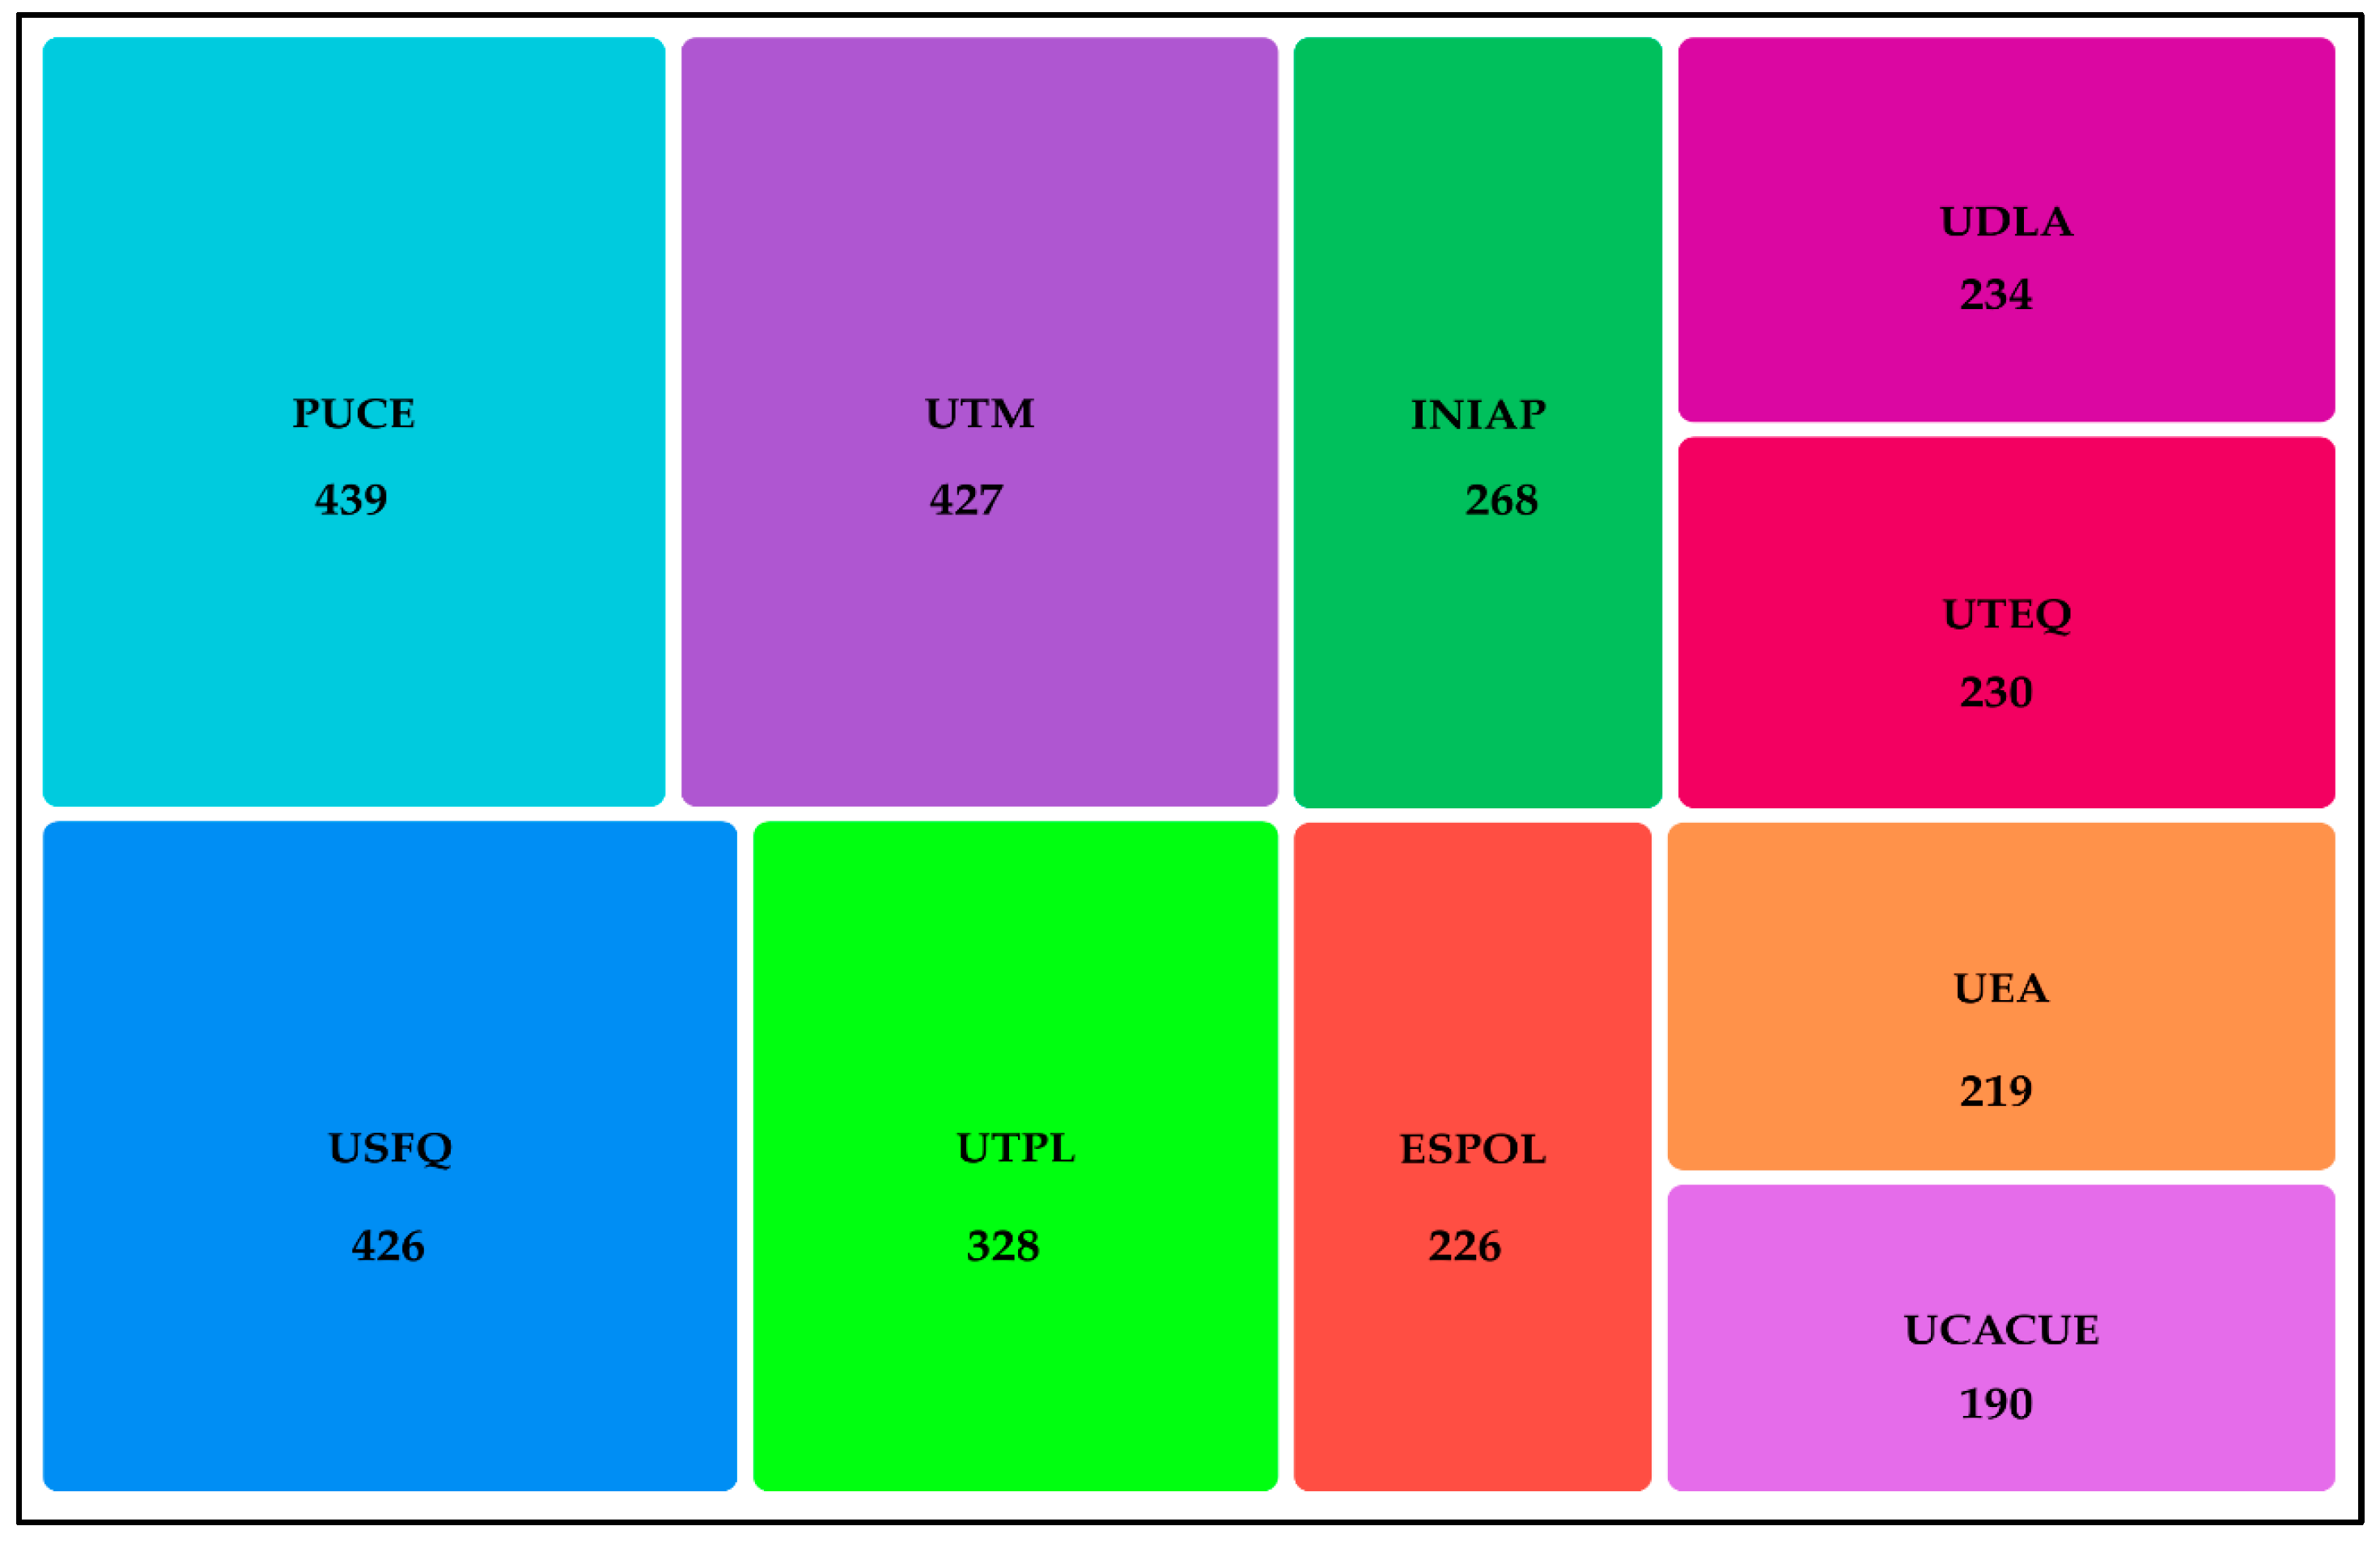
The analysis of the most relevant affiliations in Ecuador’s scientific publications within Agricultural and Biological Sciences during the study period revealed that PUCE leads with a total of 439 documents, positioning itself as the institution with the highest contribution during the study period. Close behind are UTM with 427 documents and the Universidad San Francisco de Quito (USFQ) with 426, both showing remarkable productivity in the field. Mid-ranking institutions include UTPL, INIAP, ESPOL and UDLA: they contributed 328, 268, 226 and 234 documents, respectively (Figure 6).

3.2. Lotka’s Law

The application of Lotka’s Law showed that the productivity distribution of authors in the field of Agricultural and Biological Sciences in Ecuador between 2014 and 2024 deviates from the theoretical expectations of the model (Figure 7, Table 3). The results indicate that the largest group of researchers (72.7%) published only one article during the analysed period, which is consistent with the characteristic pattern described by Lotka’s Law, where most authors contribute only one work and a small number of them have a higher output (Aytac et al., 2025).
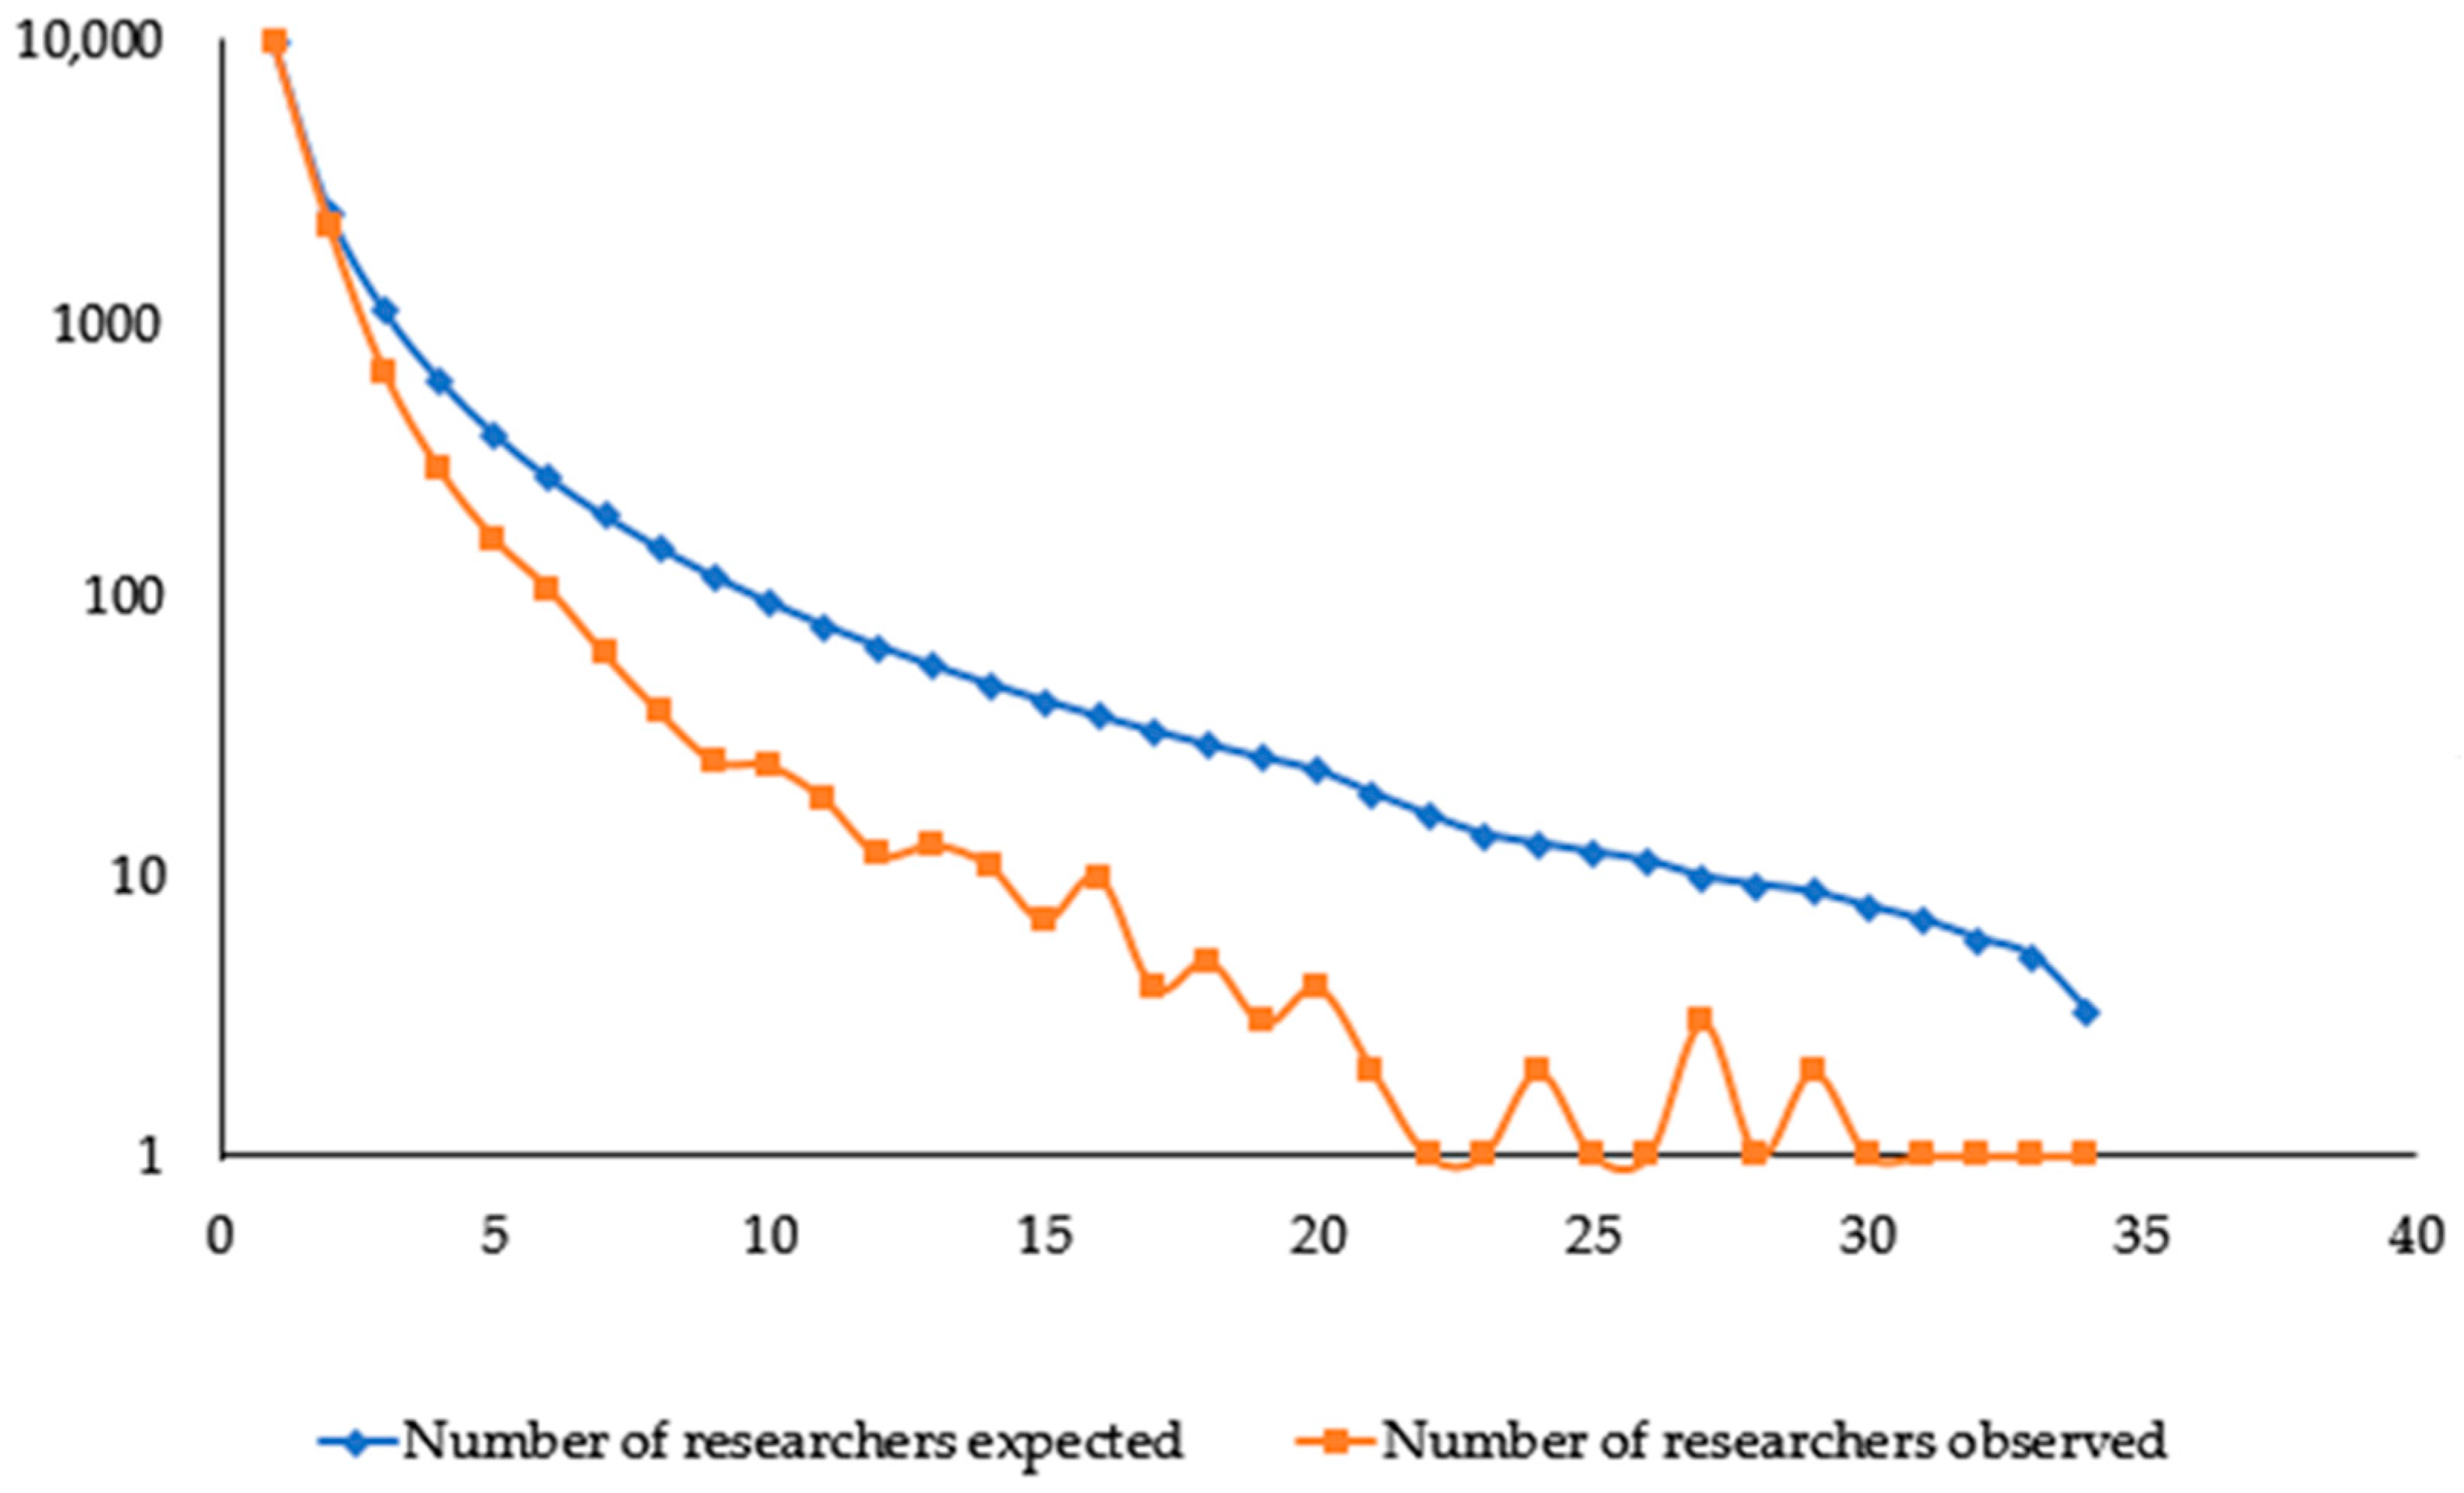
However, when comparing the observed and expected cumulative frequencies, a maximum absolute deviation of 0.113 was obtained, a value that exceeds the critical threshold of the Kolmogorov–Smirnov test (0.0142) with a significance level of α = 0.01 and a total sample size of N = 13,104, using the formula K/√N (K = 1.63). Consequently, the null hypothesis that the observed distribution follows Lotka’s theoretical model is rejected. Table 3 details the distribution of researchers according to the number of publications, the observed and expected cumulative frequency and the proportion of authors per category. A sharp drop in the proportion of authors is observed as the number of publications increases: researchers with two articles represent 16.1%, those with three publications 4.9%, while those with four or five articles do not exceed 2% of the total. Only 0.3% of authors published more than ten articles during the period, confirming a marked concentration of scientific output among a small group of highly productive researchers. Figure 7 graphically illustrates the difference between the observed and expected values according to Lotka’s mathematical model. The observed curve drops more sharply than the theoretical one, indicating a more unequal distribution of productivity among the authors. This divergence reflects that national scientific output in this area is primarily driven by a limited number of highly productive researchers, while the majority of authors make sporadic contributions.
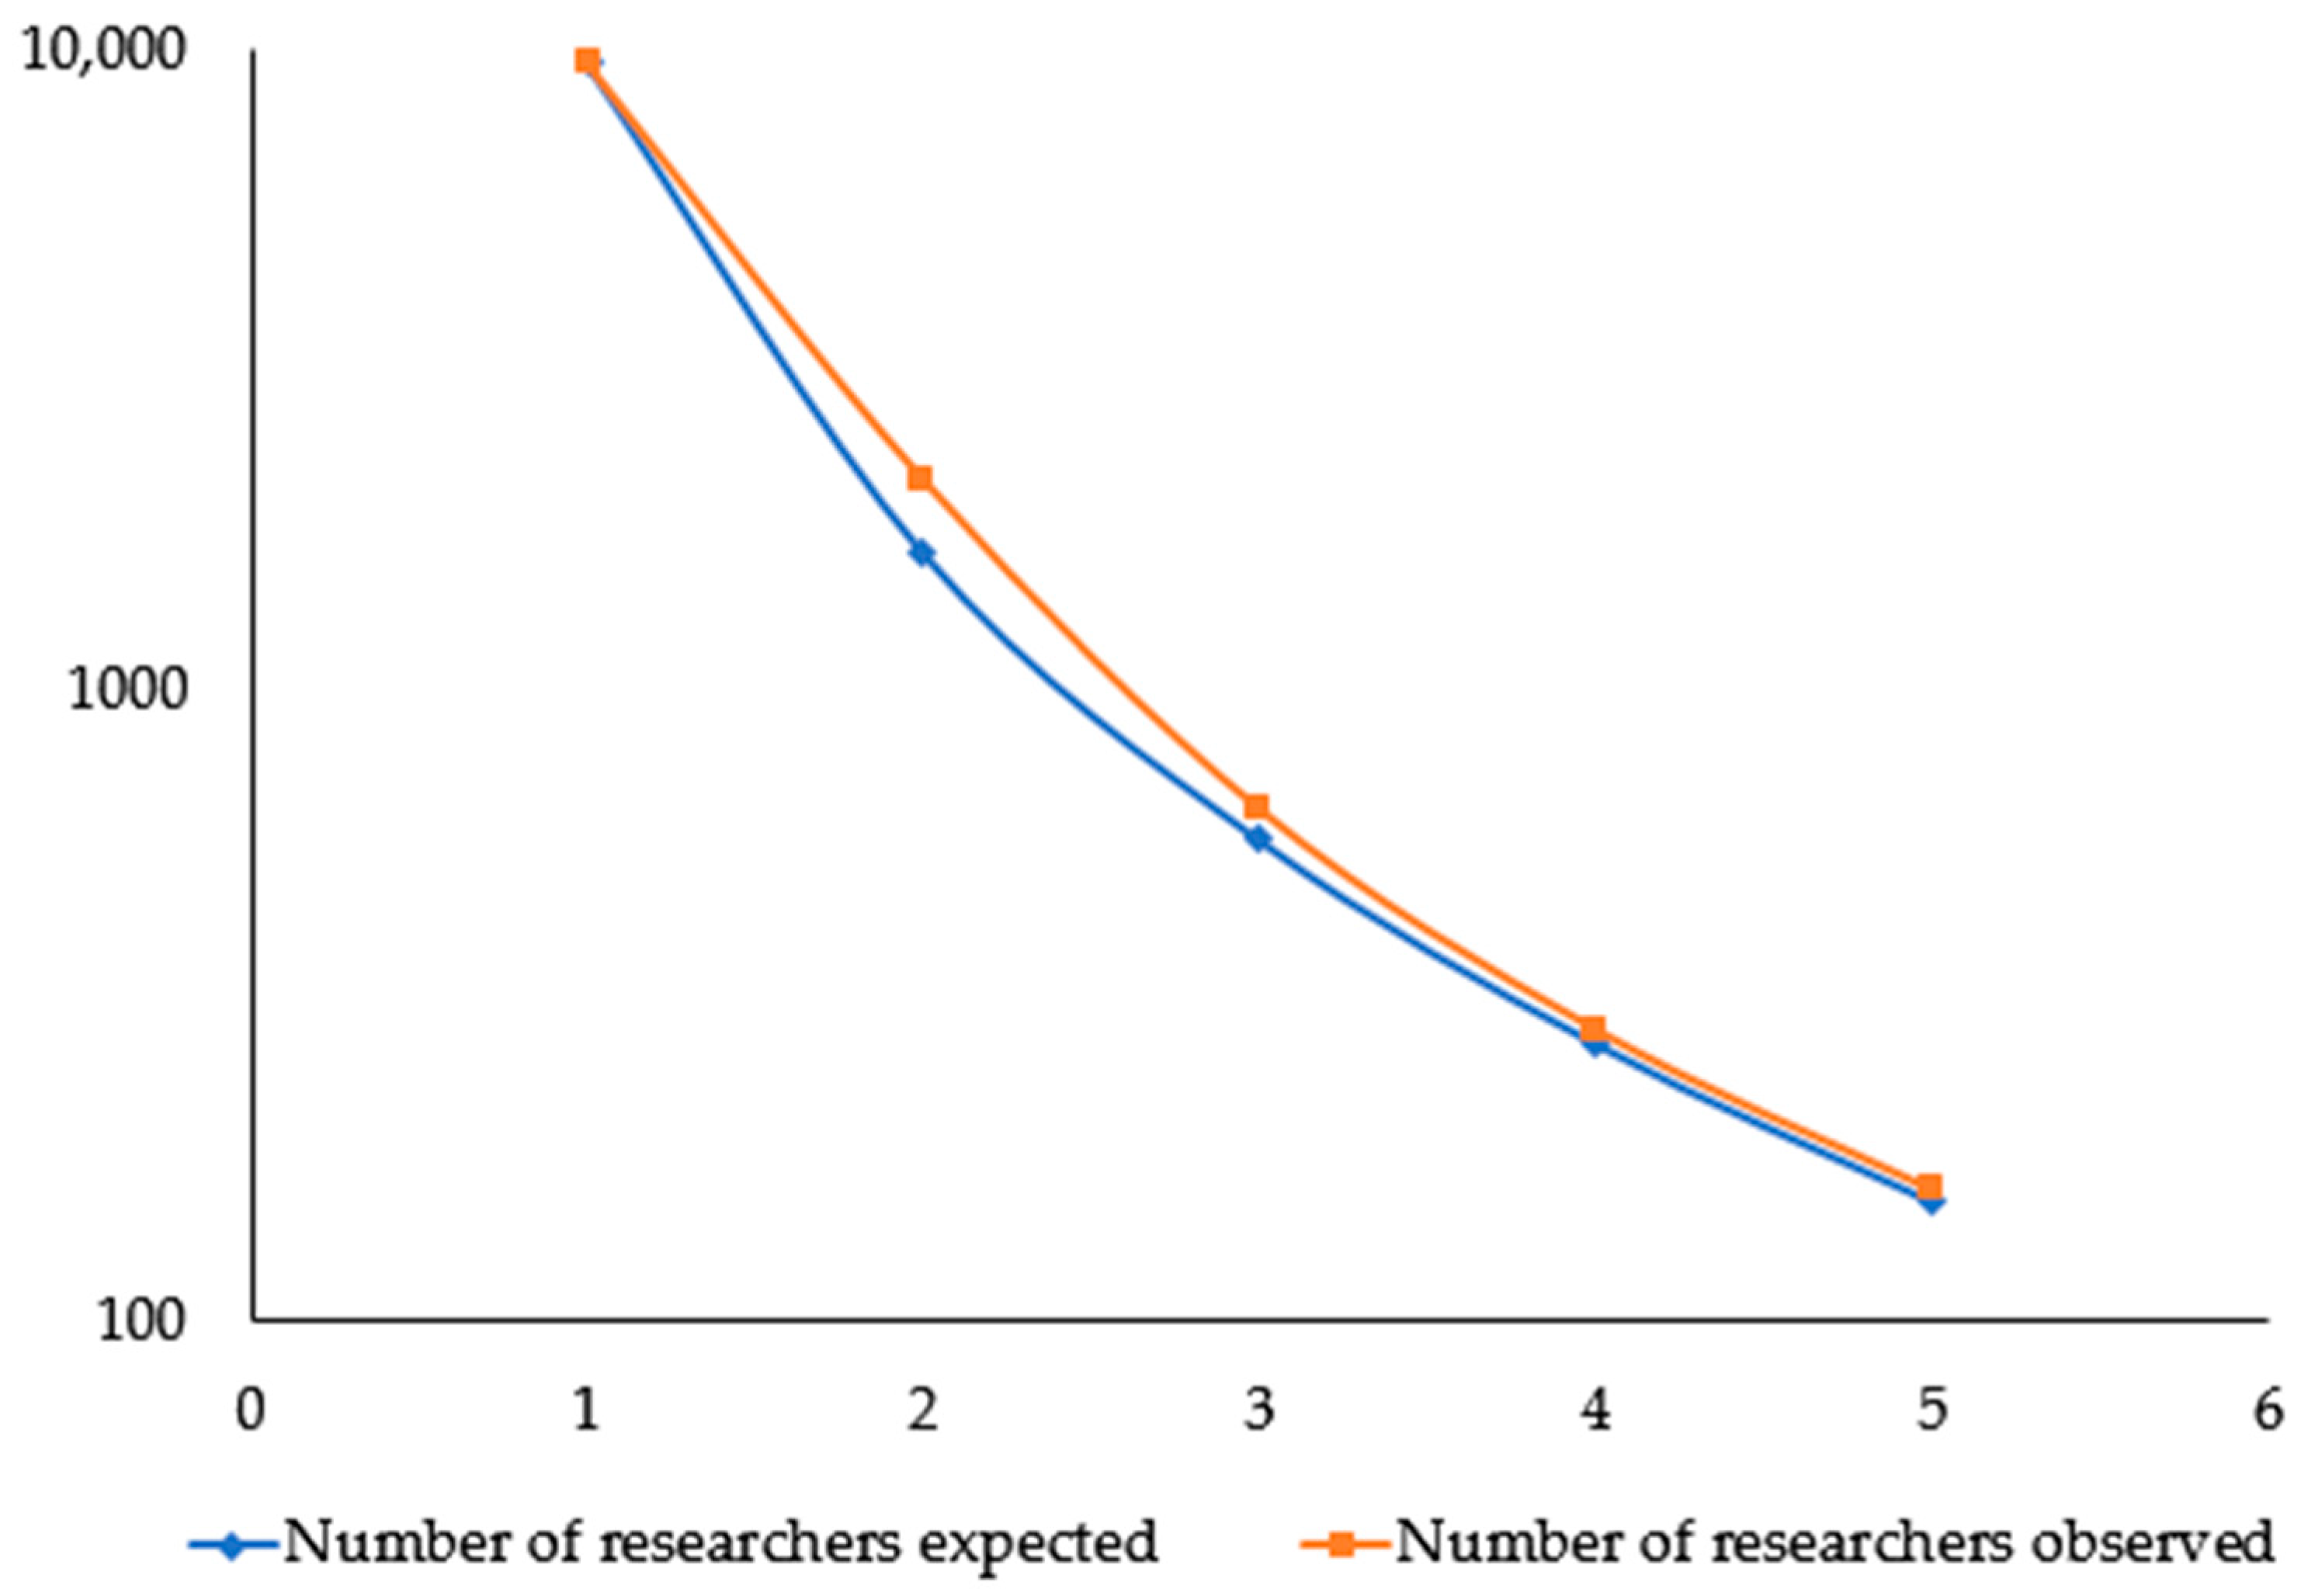
The distribution of both observed and expected researcher productivity according to the generalised form of Lotka’s Law is shown in Table 4 and Figure 8. To assess the fit between both distributions, the Kolmogorov–Smirnov test was applied, resulting in a maximum absolute deviation (Dmax) of 0.0364, while the critical value calculated at the 1% significance level was 0.0144. Since the critical value is lower than the observed deviation, the null hypothesis is rejected, indicating that the observed distribution does not follow the theoretical form proposed by Lotka’s Law. However, a closer visual match between the observed and expected values is evident, suggesting that the adjusted model provides a better but still imperfect representation of the empirical data.
The author-based research productivity analysis using Lotka’s Law revealed variations in the degree of maturity and author concentration among Ecuadorian institutions publishing scientific articles in Agricultural and Biological Sciences during the study period. The values of the n-parameter, which indicate the frequency distribution of publications per institution, ranged from 2.18 to 3.48, while the k-constant, representing the percentage of authors who published only one article, ranged from 67.08 to 88.42% (Table 5). Institutions with higher n-parameters also showed elevated k-values; for example, Universidad Central del Ecuador (UCE) (3.48 and 88.42%) and USFQ (3.10 and 85.69%). According to Lotka’s Law, a significant percentage of articles in a particular research field were written by authors who appear infrequently (Aytac et al., 2025). Conversely, the lower n-parameter values found for UTPL (2.55 and 67.23%) and UDLA (2.59 and 67.08%) are linked to more consolidated scientific communities, represented more maturely by a greater number of researchers (Narbaev & Amirbekova, 2021).

4. Discussion

4.1. Scientometric Analysis

This study offers a concrete empirical contribution to the analysis of Ecuadorian scientific production in the area of Agriculture and Biological Sciences. Unlike Herrera-Franco et al. (2023) and Avello-Martínez et al. (2024), whose work focused on describing thematic evolution, collaboration trends, and the overall growth of science in Ecuador; this study also analysed authorship concentration and its relationship to impact metrics.
Scientific production constitutes a significant resource and a constructed process that mobilises substantial changes in the production of knowledge and applications, where it matters who publishes and where (Barros Bastidas & Turpo Gebera, 2022). Based on the results obtained from this research, there has been an increase in scientific production in Ecuador over time, with publications found in indexed databases such as Scopus in high quartiles (Q1 and Q2), which lend reliability to the results and confirm scientific rigour in the research process. This is a positive aspect that has been reported in previous studies (W. Viera-Arroyo et al., 2020; Herrera-Franco et al., 2021; Méndez-Vélez et al., 2022; Moreira-Mieles et al., 2020; Rodríguez et al., 2022). In addition, this upward trend reflects the strengthening of Ecuadorian research policies such as the Organic Code of Social Economy of Knowledge and Innovation (Ingenios Code), funding mechanisms like the Research Fund for Agrobiodiversity, Seeds and Sustainable Agriculture (FIASA) and institutional participation in international collaboration networks. All these factors have allowed the promotion and development of research into Agricultural and Biological Sciences in Ecuador.
Increased productivity coexists with a high concentration of publications among a limited number of authors, highlighting structural asymmetries typical of developing scientific systems. This pattern suggests that, while research capacities are expanding, their institutional distribution remains uneven (Bornmann, 2024; Kyvik, 2010). According to Mascarello et al. (2024), North–South inequalities continue to manifest themselves in both knowledge production and scientific work, ranging from research infrastructure to academic career opportunities. Nevertheless, Latin America is at the forefront of scientific collaboration and regionalisation processes, a trend that reinforces previous evidence on how regionalisation and globalisation influence the configuration of research both globally and in specific regions (Selenica, 2025). Furthermore, it should be noted that gender gaps persist in the scientific community (W. F. Viera-Arroyo et al., 2022). Gender is a determining factor in explaining asymmetries in research productivity and visibility in addition to persistent gaps in access to networks, funding and academic opportunities (Perlin et al., 2017).
However, the annual citation rate suffered a decrease in recent years due to the age of any given paper (year of the publication) because this parameter seems a straightforward normalising factor, and consequently, a paper published in previous years has more time to accrue citations than one published more recently (W. Viera-Arroyo et al., 2020; Ioannidis et al., 2016).
This gap between quantity and quality can be explained by the dispersion of research areas, the diversity of journals in which research is published and the concentration of productivity in a small group of authors or institutions. According to Galina et al. (2023), factors that dictate the quantity and quality of scientific research include the availability of infrastructure and human resources, traditions related to research efforts and, most importantly, local government support for research.
The publication of new findings and approaches in peer-reviewed journals is fundamental to the advancement of science (Phillippi et al., 2017). In terms of the authors with the highest number of publications, our results showed different tendencies for the authorship profile. A high percentage was found for collaborative involvement with other researchers to produce publications because of co-authorship and last authorship in comparison to a lower percentage for individual initiative due to single authorship. Several authors have no solo-authored papers, which highlights a prevailing culture of team-based research in their institutions as well as collaborations with other organisations. Author grids (interprofessional collaborations also described as team science) can produce effective collaboration during research and publication (Phillippi et al., 2017).
Ecuador maintains substantial international collaborations, which contribute to the visibility of its publications worldwide and strengthen the country’s scientific presence in the global community (Avello-Martínez et al., 2024). The United States and Spain are Ecuador’s main partners in developing scientific production in Agricultural and Biological Science, especially for single-country authorship. This trend has also been reported in the same and other research areas by W. Viera-Arroyo et al. (2020), Herrera-Franco et al. (2021) and Herrera-Franco et al. (2023). However, in this study, some authors had low international collaboration (<50%) for publications (Table 3); this result suggests that these authors have written most of the scientific articles with Ecuadorian researchers, which is also positive in terms of developing local capacities for scientific production (publication of articles) in the country. This visual pattern is indicative of a multinodal collaboration model, where certain countries act as scientific exchange nodes that facilitate the circulation of knowledge and the co-production of results, in accordance with the findings of Mohammed et al. (2025). These authors observed a highly interconnected global network in the field of aquaculture, in which emerging economies (e.g., Egypt, India and Brazil) establish alliances with consolidated research centres, strengthening the thematic diversification and technological capacity of the participating countries. Similarly, international research collaboration in basic and applied science has been shown to be a key element for the exchange of knowledge, technologies and experiences and represents an essential driver for the effective translation of scientific advances to farmers, agribusinesses and innovation ecosystems (Kunert et al., 2020). According to these authors, these collaborations contribute to the development of updated research environments, the strengthening of local capacities and the consolidation of sustainable scientific networks in developing countries.
It is imperative to have effective metrics that allow comparisons between journals concerning performance and impact; nevertheless, appropriate metrics have to be applied in the right context, avoiding major outlier effects (Daugherty et al., 2022). Several indices are used to assess scientific journals, which can act as indicators of relevance, reputation and scientific interest in order to measure the journal’s performance. The Impact Factor (IF) and h-index are popular metrics generally used for this purpose; however, current prestige-measuring indicators such as the SJR have gained popularity for evaluating journals (Gupta et al., 2023). In terms of the top-ten journals that have published articles on Agricultural and Biological Sciences, it can be observed that 60% of the articles are in journals located in the Q1 and Q2 quartiles, which is very relevant from a scientific and citation perspective. The journals Agronomy and Frontiers in Plant Science have high IFs (around 4), reflecting greater prestige in the scientific community, and this could indicate that the research generated has importance within a scientific field, contributing to the generation of relevant knowledge in Agricultural and Biological Sciences. Additionally, 40% of the top-ten journals where the research has been published have an h-index of more than 100, indicating that each journal has published at least 100 articles that have been cited at least 100 times each. This is very positive for a scientific journal because it demonstrates a high level of impact, production volume, and influence in the disciplinary field and is a good indicator of the quality and relevance of the research it publishes, as evidenced by prestigious journals that achieve high scores. However, some authors have mentioned that this index has limitations, such as its inability to capture the quality of publications and the potential for manipulation. But it remains a useful tool for evaluating the performance of individual authors and comparing researchers and institutions (Mondal et al., 2023).
The complementary use of VOSviewer 1.6.20 and the Bibliometrix package in R 4.5.0 allowed for a precise characterisation of research trends and scientific collaboration relationships (Sharma et al., 2025). According to Mohammed et al. (2025), the combination of quantitative analysis and network visualisation favours the comprehensive interpretation of research dynamics by revealing the interdependence between actors, topics and geographic regions within a scientific field. They also highlight that international collaboration is a determining factor in thematic diversification and the consolidation of scientific capacities in developing contexts.
The keyword co-occurrence network (KCN) analysis is very useful in order to identify knowledge components, knowledge structure and research trends (Yuan et al., 2022). The KCN could expose thematic networks and cognitive tendencies, providing a substantial understanding of the research focuses and their evolution over time (Avello-Martínez et al., 2024). It is created by treating the keywords of the articles as individual nodes. Each co-occurrence of a pair of keywords is modelled as a link between their respective nodes and the pair of keywords is represented as the weight of the link connecting the pair, showing their relationship and relative importance (Yuan et al., 2022).
The KCN analysis allows for the identification of the most relevant topics and concepts within a research area, making it easier to rely on strategic keywords to define objectives, approaches and current trends, ensuring that the research is aligned with existing knowledge and emerging areas of interest. In this study, the main keyword core for publications was “taxonomy”, an outcome that is in concordance with what was reported by Herrera-Franco et al. (2023). This result could be related to the fact that Ecuador is a country with high biodiversity (Kleemann et al., 2022), and in recent years, research has been focused on reporting new species, phylogenetics and diversity in species related to wild relatives and domesticated and agricultural species.
In recent years, some scientometric and bibliometric indicators have been suggested in order to assess the scientific impact of universities, institutions, individuals and research teams. Individual researchers are now regularly evaluated on their capacity to generate scientific production (published articles) and their institutions are recognised (affiliation) and partially ranked based on those very same papers (Purnell, 2022). The single factor tying the paper to its author’s employer is the affiliation name given by the author when they submit the manuscript to a journal. The most relevant affiliation is an indicator that primarily reflects the concentration of publication volume in certain institutions, rather than a direct measure of quality or scientific impact. This study showed that PUCE, UTM, USFQ, UTPL, INIAP, ESPOL and UDLA achieved the highest results in this parameter. This pattern demonstrates how certain academic and research centres have managed to consolidate a significant presence in scientific production, which gives them greater national and international visibility.
The h-index evaluates the scientific impact of an individual (Bihari et al., 2023). In this study, most of the relevant authors showed a h-index of over 10 and some exceeded 20, which means that the researcher has good productivity and impact. This index seeks to balance both the quantity of articles published and the quality (the number of citations they have received). However, Bahmanabadi et al. (2023) mention that a higher average h-index does not necessarily mean a higher quality of the articles in some research areas, such as agricultural biotechnology.
The FWCI is a standardised citation indicator derived from data collected in the Scopus database and it shows the citations received in the year of publication plus the following three years. Therefore, it is an indicator of mean citation impact and compares the actual number of citations received by a document with the expected number of citations for documents of the same document type, publication year and subject area (Purkayastha et al., 2019). The authors with the highest number of publications in Agricultural and Biological Science showed an average FWCI value of 1.12, which indicates that the publication has been cited more than the average expected for similar entities, namely, 12% more citations than expected. However, the development and growth of the FWCI require some time, and it indicates differences and dispersion, reflecting the individual’s development potential.
Bahmanabadi et al. (2023) found that there is no direct relationship between the researchers’ h-index and their FWCI scores as a whole, or such a relationship is very weak; for this reason, the analysis of the researchers’ performance should take into consideration other indices, such as the g-index and m-index and methods like Lotka’s Law.

4.2. Lotka’s Law

The Lotka distribution of author productivity is greatly dependent on the selection of the research period; if many authors are covered only fractionally, the distribution slope will be steeper than when it covers the whole publication output of a group of authors (Wagner-Dobler & Berg, 1995). The slope (Figure 7) obtained in this study by applying this mathematical method suggests that the scientific production of several authors was partially considered during the analysis period. Wagner-Dobler and Berg (1995) mention that under a scientometric analysis, other factors such as age group should be considered for a general analysis of the scientists in a specific period of time.
Empirical results concerning the Lotka distribution at different times and in diverse disciplines suffer from a lack of assumptions about the causes of the differences in the curves (Wagner-Dobler & Berg, 1995). A basic assumption underlying this law is that the number of papers published by a scientist is a measure of their contribution to science (Kawamura et al., 2000). In this study, the curve of observed and expected researchers did not fit according to Lotka’s Law; however, adjusting the n-parameter made the fitting look better.
The results of the Kolmogorov–Smirnov test demonstrate that the maximum deviation value is greater than the critical value. According to a similar study conducted by Pratiwi et al. (2024), which analysed data from 2018 to 2022, the observed distribution of author productivity also failed to conform to the theoretical expectations of Lotka’s Law. Therefore, the null hypothesis H (0) is rejected, implying that the distribution of writers’ productivity in the subject matter does not follow Lotka’s Law. This means that few authors have high productivity. This result may be influenced by factors like institutional research policies, collaborative publishing trends, or the presence of highly productive research clusters in the country.
Lotka’s Law recommends an n-parameter value of 2 (Cáceres-Ruiz, 2019), which varies depending on the adjustment process. For example, authors have reported: 2.64 for Dental Sciences (Kawamura et al., 2000), 3.5 for Information Sciences (Voos, 1974), 2.74 for Social Sciences (Narbaev & Amirbekova, 2021) and 1.20 for Medical Sciences (Cáceres-Ruiz, 2019). Specifically for Agricultural and Biological Sciences, Narbaev and Amirbekova (2021) found 4520 authors and an n-parameter of 2.78 for a 30-year period; this result is a little higher than that obtained in our study (2.56), which was over a shorter period of time (10 years) but uncovered more authors (13,104). Therefore, other factors such as the area of study, number of authors and period of analysis should be considered to improve the mathematical model.
In this study, the average n-parameter across institutions was 2.80, suggesting a moderate concentration, with more sporadic authors in the scientific productivity. The Universidad Estatal Amazónica (UEA) and ESPOL had lower n-values, placing them in the 2.00–2.50 range, which, according to Lotka’s framework, would reflect an active field with recurring authors, namely, more authors with many publications. In contrast, UTPL, UDLA, UTEQ, UG, PUCE, UTM and INIAP exhibited intermediate n-parameter values (ranging from 2.82 to 2.95), indicating a moderate concentration of productivity with more sporadic authors. USFQ and UCE surpassed the 3.0 threshold, pointing to a high concentration and suggesting that most authors publish only once.
The k-constant represents the percentage of authors who published only one article (Narbaev & Amirbekova, 2021); in this study, 79% of authors fell into this category. This result corroborates the idea that most scientific productivity is carried out by only a few authors. Narbaev and Amirbekova (2021) also mentioned that there is a positive relationship between the n-parameter and the k-constant (the higher the n-parameter value, the higher the k-constant value), which implies that a given subject area is less mature and represented by a smaller number of researchers. This trend was also observed in this study, indicating that in Ecuador, the scientific production in the area of Agriculture and Biological Sciences is represented by a small number of authors belonging to different universities and research institutes.

4.3. Contributions of This Study

According to Robledo-Giraldo (2024), current scientometric research looks for analysing publication patterns, citation networks, and research trends, providing essential insights into the dynamics of scientific progress. Our research examines Ecuador’s scientific output in Agricultural and Biological Sciences (2014–2024) through three dimensions: (i) Analysis of publication patterns and productivity indicators, identifying temporal trends, institutional output, and author productivity in 2881 indexed documents retrieved from the Scopus database. This allowed us to quantify the growth of national scientific output, evaluate citation-based indicators (FWCI, h-index), identify the most relevant journals, and measure institutional contributions, offering an overview of how Ecuador’s research capacity has evolved over the last decade in the area of Agriculture and Biological Sciences. (ii) Exploration of national and international collaboration networks. It was mapped co-authorship patterns and research collaborations using Biblioshiny and VOSviewer; distinguishing between single-country and multinational publications. This approach revealed the structural configuration of Ecuador’s research system, highlighting key institutions and international partners that drive knowledge exchange and scientific visibility. (iii) Identification of thematic and disciplinary trends by a keyword co-occurrence analysis to identify the main research groups and thematic evolution, revealing a strong focus on biodiversity, taxonomy, and conservation. Furthermore, applying Lotka’s Law allowed us to model the distribution of author productivity and assess the maturity (n-parameter and k-constant) of the research area of Agricultural and Biological Sciences, observing that a few researchers concentrate the greatest scientific productivity.
Table 6 shows the main comparative scientometric indicators between the present study and four previous studies that analyse Ecuador’s scientific production and other geographic contexts. The studies exhibited a multidisciplinary focus, encompassing fields such as Agricultural and Biological Sciences, Engineering, Technology, Environmental Sciences, and Social Sciences. It can be observed that the average annual growth rate of scientific output varies considerably among the studies, ranging from 12.9% to 58.7%, reflecting differences in the analysed periods and the information sources. Regarding international collaboration, the most frequent partner countries are the United States, Spain, and Brazil, indicating stable cooperation networks that contribute to the visibility and exchange of Ecuadorian research. The most common keywords, such as Andes and taxonomy, reveal thematic consistencies across the studies. Finally, the most frequently represented journals Zootaxa, PLOS One, and Revista de Biología Tropical stand out as the main publication outlets used for the dissemination of the Ecuadorian scientific output.
The data show a sustained, albeit heterogeneous, increase in Ecuador’s scientific production in recent years, making Ecuador the sixth country in Latin America and the Caribbean with the highest number of articles indexed in Scopus (Moreira-Mieles et al., 2020). The observed differences can be explained mainly by methodological variations, such as database coverage, analysis periods, and the inclusion criteria used in generating similar documents. Despite these discrepancies, all studies agree in showing a positive trend in research activity at the national level (Alvarez-Munoz & Perez-Montoro, 2015; Herrera-Franco et al., 2021). Regarding international collaboration, the predominance of alliances with the United States, Spain, and Brazil indicates the persistence of traditional North–South cooperation patterns. According to Ordóñez-Matamoros et al. (2020), North–South collaborations tend to strengthen the scientific quality and international visibility of countries in the Global South. These networks not only contribute to the visibility of Ecuadorian research but also facilitate knowledge exchange, access to funding opportunities, and participation in global scientific agendas.

4.4. Limitations and Recommendations

This study provides valuable insights into the scientific productivity of Ecuador in Agricultural and Biological Sciences; however, some limitations must be considered. The analysis was based solely on data retrieved from the Scopus database, which has scientific prestige and global coverage but may exclude relevant contributions indexed in other platforms such as Web of Science, SciELO, or Latindex, in which several Ecuadorian researchers have published. Consequently, including additional databases in further studies would offer a more comprehensive perspective.
In addition, the use of Lotka’s Law assumes a theoretical distribution that does not fully account for contextual factors such as institutional research policies, funding disparities, or evolving patterns of collaboration. Although the adjusted model provided a better visual approximation, the rejection of the null hypothesis suggests that other mathematical models or hybrid approaches could enhance explanatory power.
The study period (2014–2024) may capture only a partial outcome of certain researchers’ trajectories, especially those with recent entry into academic publishing; therefore, extending studies may provide more robust evidence of scientific maturity and structural evolution.
Finally, this study focused on publication volume and authorship concentration; future research should incorporate additional dimensions like disciplinary relevance, gender representation and early-career researcher inclusion. These complementary perspectives will contribute to a more holistic and equitable understanding of national research systems.

5. Conclusions

The scientometric analysis of Ecuadorian scientific production in the area of Agricultural and Biological Sciences between 2014 and 2024 showed a sustained increase in national scientific productivity (particularly after 2018), characterised by a growing number of publications in high-impact journals (Q1 and Q2) and strong institutional participation. The results reflect the strengthening of public policies on science, technology and innovation, as well as institutional efforts to promote publication in indexed journals. In this context, universities and INIAP are positioned as key players, contributing considerably to the generation of technical and scientific knowledge in the country. Furthermore, a growing trend toward collaborative research was observed, reflected in high percentages of co-authorships and a diverse institutional distribution, suggesting increasing progress in the collaborative scientific capacities. Ecuador’s scientific system is also progressing in terms of visibility, collaboration and institutional strengthening, and INIAP plays a key role as a benchmark in applied research for the agricultural sector.
The Kolmogorov–Smirnov test revealed that the observed distribution of author productivity does not fully conform to the theoretical pattern proposed by Lotka, leading to the rejection of the null hypothesis. Despite this, the adjusted model showed a closer visual fit to the empirical data, suggesting that, while not statistically precise, it offers a useful reference for understanding the concentration of scientific production among a limited number of researchers.
At the national level, the n-parameter and k-constant values reveal a research system in the process of consolidation, with notable differences among institutions. Some universities and research institutions displayed a more equitable distribution of productivity, indicating a more mature and inclusive scientific community, whereas others show strong dependence on a small group of highly productive authors, reflecting limited diversification of research efforts. The overall result indicated that scientific production in the area of Agriculture and Biological Sciences is represented by a small number of authors and that most authors published only once.
These findings highlight the need to continue strengthening research capacities across the country by promoting policies that support the training of new researchers, foster inter-institutional collaboration and ensure equitable access to research resources. Moreover, it is essential to complement productivity volume with additional indicators such as quality, impact and international collaboration in order to enable a more comprehensive and strategic evaluation of Ecuador’s scientific productivity.

Author Contributions

Conceptualisation, W.V.-A., M.M. and L.V.; methodology, W.V.-A., L.V. and M.M.; investigation, W.V.-A., L.V. and M.M.; resources, W.V.-A. and C.C.; writing—original draft preparation, W.V.-A., L.V., M.M., D.L. and C.C.; writing—review and editing, W.V.-A., L.V., M.M., D.L., W.V.-C. and C.C.; supervision, W.V.-A.; funding acquisition, W.V.-C. All authors have read and agreed to the published version of the manuscript.

Funding

This research received no external funding.

Institutional Review Board Statement

Not applicable.

Informed Consent Statement

Not applicable.

Data Availability Statement

The original contributions presented in this study are included in the article. Further inquiries can be directed to the corresponding author.

Acknowledgments

The authors would like to thank the Instituto Nacional de Investigaciones Agropecuarias (INIAP) for supporting this study.

Conflicts of Interest

The authors declare no conflicts of interest.

Abbreviations

The following abbreviations are used in this manuscript:
DmaxMaximum Absolute Deviation
ESPOLEscuela Superior Politécnica del Litoral
FIASAFund for Agrobiodiversity, Seeds and Sustainable Agriculture
FWCIField-Weighted Citation Impact
IFImpact Factor
INIAPInstituto Nacional de Investigaciones Agropecuarias
KCNKeyword Co-occurrence Network
MCPMulti Country Publications
PRISMAPreferred Reporting Items for Systematic Reviews and Meta-Analyses
PUCEPontificia Universidad Católica del Ecuador
SCPSingle Country Publications
SJRSCImago Journal Rank
UCACUEUniversidad Católica de Cuenca
UDLAUniversidad de las Américas
UCEUniversidad Central del Ecuador
UEAUniversidad Estatal Amazónica
UGUniversidad de Guayaquil
USFQUniversidad San Francisco de Quito
UTEQUniversidad Técnica Estatal de Quevedo
UTMUniversidad Técnica de Manabí
UTPLUniversidad Técnica Particular de Loja

References

  1. Alvarez-Munoz, P., & Perez-Montoro, M. (2015). Analysis of production and scientific visibility of Ecuador in the Andean context (2000–2013). Profesional de la Informacion, 24(5), 577–586. [Google Scholar] [CrossRef]
  2. Armijos Valdivieso, P., Avolio Alecchi, B., & Arévalo-Avecillas, D. (2022). Factors that influence the individual research output of university professors: The case of Ecuador, Peru, and Colombia. Journal of Hispanic Higher Education, 21(4), 450–468. [Google Scholar] [CrossRef]
  3. Avello-Martínez, R., Gómez Rodríguez, V., Caicedo Quiroz, R., Tolozano-Benites, R., & Barzola Monteses, J. (2024). Analysis of scientific production published in the journals of the Ecuador collection in SciELO: Trends and challenges (2014–2022). Revista General de Información y Documentación, 35(1), 149–160. [Google Scholar] [CrossRef]
  4. Aytac, S., Tran, C., & Frye, N. (2025). Lotka’s law of scientific productivity across the research disciplines: A review. Science & Technology Libraries, 1–13. [Google Scholar] [CrossRef]
  5. Álvarez, L., & Blasco, J. (2014). Higher education evaluation and accreditation. and editorial production in Ecuador. Universitas, 12(12), 163–181. [Google Scholar] [CrossRef]
  6. Bahmanabadi, A., Tayebeh, S., & Amirhossieni, M. (2023). A comparative study of H-index and FWCI in evaluation of researcher’s scientific productions study case: Agricultural, research, education and extension organization. Scientometrics Research Journal, 9(2), 439–558. [Google Scholar] [CrossRef]
  7. Barros Bastidas, C., & Turpo Gebera, O. (2022). Formación en investigación y producción científica: Trayectorias y sentidos del profesorado de una universidad pública de Ecuador. Revista Universidad y Sociedad, 14(4), 699–707. [Google Scholar]
  8. Belfiore, A., Cuccurullo, C., & Aria, M. (2022). IoT in healthcare: A scientometric analysis. Technological Forecasting and Social Change, 184, e122001. [Google Scholar] [CrossRef]
  9. Bihari, A., Tripathi, S., & Deepak, A. (2023). A review on h-index and its alternative indices. Journal of Information Science, 49(3), 624–665. [Google Scholar] [CrossRef]
  10. Bornmann, L. (2024). Skewed distributions of scientists’ productivity: A research program for the empirical analysis. Scientometrics, 129(4), 2455–2468. [Google Scholar] [CrossRef]
  11. Cardona-Román, D., & Sánchez-Torres, J. (2017). Análisis cienciométrico de la producción científica acerca de la investigación sobre la evaluación de la implementación del e-learning en el periodo 2000–2015. Educación, 26(51), 7–34. [Google Scholar] [CrossRef]
  12. Cattell, J. (1910). A further statistical study of American men of science. Science, 32(828), 672–688. [Google Scholar] [CrossRef]
  13. Cáceres-Ruiz, M. (2019). Productividad científica de los investigadores categorizados del área de Ciencias Médicas y de la Salud: Aplicación del modelo matemático de Lotka. Memorias del Instituto de Investigaciones en Ciencias de la Salud, 17(2), 44–55. [Google Scholar] [CrossRef]
  14. Chen, C. (2006). CiteSpace II: Detecting and visualizing emerging trends and transient patterns in scientific literature. Journal of the American Society for Information Science and Technology, 57(3), 359–377. [Google Scholar] [CrossRef]
  15. Cruz-Ramírez, M., Escalona-Reyes, M., Cabrera-Garcia, S., & Martinez-Cepena, M. (2014). Análisis cienciométrico de las publicaciones educacionales cubanas en la WoS y Scopus (2003–2012). Revista Española de Documentación Científica, 37(3), e058. [Google Scholar] [CrossRef]
  16. Daugherty, A., Hegele, R., Lu, H., Mackman, N., Rader, D., & Weber, C. (2022). Web of science’s citation median metrics overcome the major constraints of the journal impact factor. Arteriosclerosis, Thrombosis, and Vascular Biology, 42(4), 367–371. [Google Scholar] [CrossRef]
  17. Flores, M., & Echeverría, C. (2025). Scientific Production in Central America (1996–2023): Bibliometric Analysis of Regional Trends, Collaboration, and Research Impact. Publications, 13(3), 44. [Google Scholar] [CrossRef]
  18. Galina, C. S., Martínez, J. F., & Murphy, B. D. (2023). Constraints on research in biological and agricultural science in developing countries: The example of Latin America. Publications, 11(2), 22. [Google Scholar] [CrossRef]
  19. García Peñalvo, F. (2022). The assessment of scientific production under debate. Education in the Knowledge Society, 23, e28139. [Google Scholar] [CrossRef]
  20. Gupta, S., Kumar, N., & Bhalla, S. (2023). Citation metrics and evaluation of journals and conferences. Journal of Information Science, 51(3), 570–588. [Google Scholar] [CrossRef]
  21. Herrera-Franco, G., Montalván-Burbano, N., Mora-Frank, C., & Bravo-Montero, L. (2021). Scientific research in ecuador: A bibliometric analysis. Publications, 9(4), 55. [Google Scholar] [CrossRef]
  22. Herrera-Franco, G., Sánchez-Arizo, V., Escandón-Panchana, P., Caicedo-Potosí, J., Jaya-Montalvo, M., & Zambrano-Mendoza, J. (2023). Analysis of scientific contributions to agricultural development and food security in Ecuador. International Journal of Design & Nature and Ecodynamics, 18(5), 1129–1139. [Google Scholar] [CrossRef]
  23. Inglesi-Lotz, R., & Pouris, A. (2011). Scientometric impact assessment of a research policy instrument: The case of rating researchers on scientific outputs in South Africa. Scientometrics, 88, 747–760. [Google Scholar] [CrossRef]
  24. Ioannidis, J., Boyack, K., & Wouters, P. (2016). Citation metrics: A primer on how (not) to normalize. PLOS Biology, 14(9), e1002542. [Google Scholar] [CrossRef] [PubMed]
  25. Jaffe, K., Ter Horst, E., Gunn, L., Zambrano, J. D., & Molina, G. (2020). A network analysis of research productivity by country, discipline, and wealth. PLoS ONE, 15(5), e0232458. [Google Scholar] [CrossRef]
  26. Kawamura, M., Thomas, C., Tsurumoto, A., Sasahara, H., & Kawaguchi, Y. (2000). Lotka’s law and productivity index of authors in a scientific journal. Journal of Oral Science, 42(2), 75–78. [Google Scholar] [CrossRef]
  27. Kleemann, J., Koo, H., Hensen, I., Mendieta-Leiva, G., Kahnt, B., Kurze, C., Inclan, D. J., Cuenca, P., Noh, J. K., Hoffmann, M. H., Factos, A., Lehnert, M., Lozano, P., & Fürst, C. (2022). Priorities of action and research for the protection of biodiversity and ecosystem services in continental Ecuador. Biological Conservation, 265, 109404. [Google Scholar] [CrossRef]
  28. Kunert, K. J., Botha, A.-M., Oberholster, P. J., Yocgo, R., Chimwamurombe, P., Vorster, J., & Foyer, C. H. (2020). Factors facilitating sustainable scientific partnerships between developed and developing countries. Outlook on Agriculture, 49(3), 204–214. [Google Scholar] [CrossRef]
  29. Kyvik, S. (2010). Productivity of University Faculty Staff. In P. Peterson, E. Baker, & B. McGaw (Eds.), International encyclopedia of education (3rd ed., pp. 455–460). Elsevier. [Google Scholar] [CrossRef]
  30. Lotka, A. J. (1926). The frequency distribution of scientific productivity. Journal of the Washington Academy of Sciences, 16(12), 317–323. [Google Scholar]
  31. Martín Sobrino, M. S., Pestana Caldes, A. I., & Pulgarín Guerrero, A. (2008). Lotka law applied to the scientific production of information science area. Brasilian Journal of Information Science, 2(1), 16–30. [Google Scholar] [CrossRef]
  32. Mascarello, J., Lehmann, R., & Giurca, A. (2024). Bioeconomy science collaboration between Brazil and Germany—On equal footing? Forest Policy and Economics, 161, 103181. [Google Scholar] [CrossRef]
  33. Méndez-Vélez, F., Ortega-Castro, G., Martínez-Suárez, P. C., & Ramírez-Coronel, A. A. (2022). Scientific production of Ecuadorian universities. Archivos Venezolanos de Farmacología y Terapéutica, 41(9), 623–630. [Google Scholar] [CrossRef]
  34. Mohammed, E. A. H., Kovács, B., & Pál, K. (2025). Recent knowledge in the application of saccharomyces cerevisiae in aquaculture: A bibliometric and narrative review. Antibiotics, 14(8), 736. [Google Scholar] [CrossRef] [PubMed]
  35. Mondal, H., Deepak, K. K., Gupta, M., & Kumar, R. (2023). The h-index: Understanding its predictors, significance and criticism. Journal of Family Medicine and Primary Care, 12(11), 2531–2537. [Google Scholar] [CrossRef]
  36. Montoya, F. G., Alcayde, A., Baños, R., & Manzano-Agugliaro, F. (2018). A fast method for identifying worldwide scientific collaborations using the Scopus database. Telematics and Informatics, 35(1), 168–185. [Google Scholar] [CrossRef]
  37. Moreira-Mieles, L., Morales-Intriago, J. C., Crespo-Gascón, S., & Guerrero-Casado, J. (2020). Caracterización de la producción científica de Ecuador en el periodo 2007–2017 en Scopus. Investigación Bibliotecnológica, 34(82), 141–157. [Google Scholar] [CrossRef]
  38. Murphy, L. J. (1973). Lotka’s law in the humanities? Journal of the American Society for Information Science, 24(6), 461–462. [Google Scholar] [CrossRef]
  39. Nagaiah, M., Thanuskodi, S., & Alagu, A. (2021). Application of Lotka’s Law to the research productivity in the field of open educational resources during 2011–2020. Library Philosophy and Practice. [Google Scholar]
  40. Narbaev, T., & Amirbekova, D. (2021). Research productivity in emerging economies: Empirical evidence from Kazakhstan. Publications, 9(4), 51. [Google Scholar] [CrossRef]
  41. Ordóñez-Matamoros, G., Vernot-López, M., Moreno-Mattar, O., & Orozco, L. A. (2020). Exploring the effects of North–South and South–South research collaboration in emerging economies, the Colombian case. Review of Policy Research, 37(2), 174–200. [Google Scholar] [CrossRef]
  42. Pao, M. L. (1986). An empirical examination of Lotka’s law. Journal of the American Society for Information Science, 37(1), 26–33. [Google Scholar] [CrossRef]
  43. Perlin, M. S., Santos, A. A. P., Imasato, T., Borenstein, D., & Da Silva, S. (2017). The Brazilian scientific output published in journals: A study based on a large CV database. Journal of Informetrics, 11(1), 18–31. [Google Scholar] [CrossRef]
  44. Phillippi, J. C., Likis, F. E., & Tilden, E. L. (2017). Authorship grids: Practical tools to facilitate collaboration and ethical publication. Research in Nursing & Health, 41(2), 195–208. [Google Scholar] [CrossRef]
  45. Portal, S. G. (2005). El modelo matemático de Lotka: Su aplicación a la producción científica latinoamericana en ciencias bibliotecológica y de la información. UNAM. [Google Scholar]
  46. Pratiwi, N. M., Ibrahim, C., Alkarimah, N. U., Arifah, Z. N., Jatmik, T. H., Mutiara, A., Azzahra, A. F., Putri, S. W., Kangko, D. D., Astarika, R., & Jopan, J. (2024). Author productivity analysis in Q1 of authors in journal library and information science Q1 journals using with Lotka’s Law. Berkala Ilmu Perpustakaan dan Informasi, 20(1), 163–176. [Google Scholar] [CrossRef]
  47. Pulgarín, A., & Gil-Leiva, I. (2004). Bibliometric analysis of the automatic indexing literature: 1956–2000. Information Processing & Management, 40(2), 365–377. [Google Scholar] [CrossRef]
  48. Purkayastha, A., Palmaro, E., Falk-Krzesinski, H. J., & Baas, J. (2019). Comparison of two article-level, field-independent citation metrics: Field-Weighted Citation Impact (FWCI) and Relative Citation Ratio (RCR). Journal of Informetrics, 13(2), 635–642. [Google Scholar] [CrossRef]
  49. Purnell, P. J. (2022). The prevalence and impact of university affiliation discrepancies between four bibliographic databases—Scopus, Web of Science, Dimensions, and Microsoft Academic. Quantitative Science Studies, 3(1), 99–121. [Google Scholar] [CrossRef]
  50. Radhakrishnan, T., & Kerdizan, R. (1979). Lotka’s law and computer science literature. Journal of the American Society for Information Science, 30(1), 51–54. [Google Scholar] [CrossRef]
  51. Restrepo, C., & Urbizagástegui, R. (2012). Las publicaciones sobre el péndulo: Un análisis comparativo. Investigación Bibliotecológica, 26(28), 153–173. [Google Scholar] [CrossRef]
  52. Robledo-Giraldo, S. (2024). The vital role of scientometrics in modern research. Clío América, 18(35), 1–3. [Google Scholar] [CrossRef]
  53. Rodríguez, V., Flores-Sanchez, M., Zambrano, C. H., Rincón, L., Paz, J. L., & Torres, F. J. (2022). Analysis of Ecuador’s SCOPUS scientific production during the 2001–2020 period by means of standardized citation indicators. Heliyon, 8(4), e09329. [Google Scholar] [CrossRef]
  54. Selenica, E. (2025). The scientific system in the Global South in an emerging multipolar world. Globalisation, Societies and Education, 23(2), 393–409. [Google Scholar] [CrossRef]
  55. Sharma, U., Sharma, S., Sankhyan, N., Sharma, S., & Sharma, S. (2025). A global review of agroforestry research and policy directions: Addressing ecological and socioeconomic challenges through systematic review and bibliometric analysis. Forest Policy and Economics, 181, 103639. [Google Scholar] [CrossRef]
  56. Sianes, A., Vega-Muñoz, A., Tirado-Valencia, P., & Ariza-Montes, A. (2022). Impact of the sustainable development goals on the academic research agenda. A scientometric analysis. PLoS ONE, 17(3), e0265409. [Google Scholar] [CrossRef] [PubMed]
  57. Urbizagástegui, R. (2005). The scientific productivity of authors: An application model of Lotka’s law by the generalized in-verse power method. Información, Cultura y Sociedad, 12, 51–73. [Google Scholar]
  58. Urbizagástegui, R. (2006). A Productividade dos autores na literatura de enfermagen: Un modelo de aplicação da lei de Lotka. Informaçao & Sociedade, 16(1), 63–78. [Google Scholar]
  59. Viera-Arroyo, W., Sánchez-Arizo, V., Merino-Toro, J., & Domínguez-Andrade, J. (2020). Scientific production of Ecuador in the agricultural field: Case of the National Institute of Agricultural Research, period 2014–2019. Revista Española de Documentación Científica, 43(4), e280. [Google Scholar] [CrossRef]
  60. Viera-Arroyo, W. F., Merino-Toro, J. L., Sánchez-Arizo, V. H., Sánchez-Larco, J. F., & López-Domínguez, D. A. (2022). Women and their role in research: Case of the National Institute of Agricultural Research, period of 2014–2020. Orinoquia, 26(2), 5. [Google Scholar] [CrossRef]
  61. Voos, H. (1974). Lotka and information science. Journal of the American Society for Information Science, 25(4), 270–272. [Google Scholar] [CrossRef]
  62. Wagner-Dobler, W., & Berg, J. (1995). The dependence of Lotka’s law on the selection of time periods in the development of scientific areas and authors. Journal of Documentation, 5(1), 28–43. [Google Scholar] [CrossRef]
  63. Yuan, C., Li, G., Kamarthi, S., Jin, X., & Moghaddam, M. (2022). Trends in intelligent manufacturing research: A keyword co-occurrence network-based review. Journal of Intelligent Manufacturing, 33, 425–439. [Google Scholar] [CrossRef]
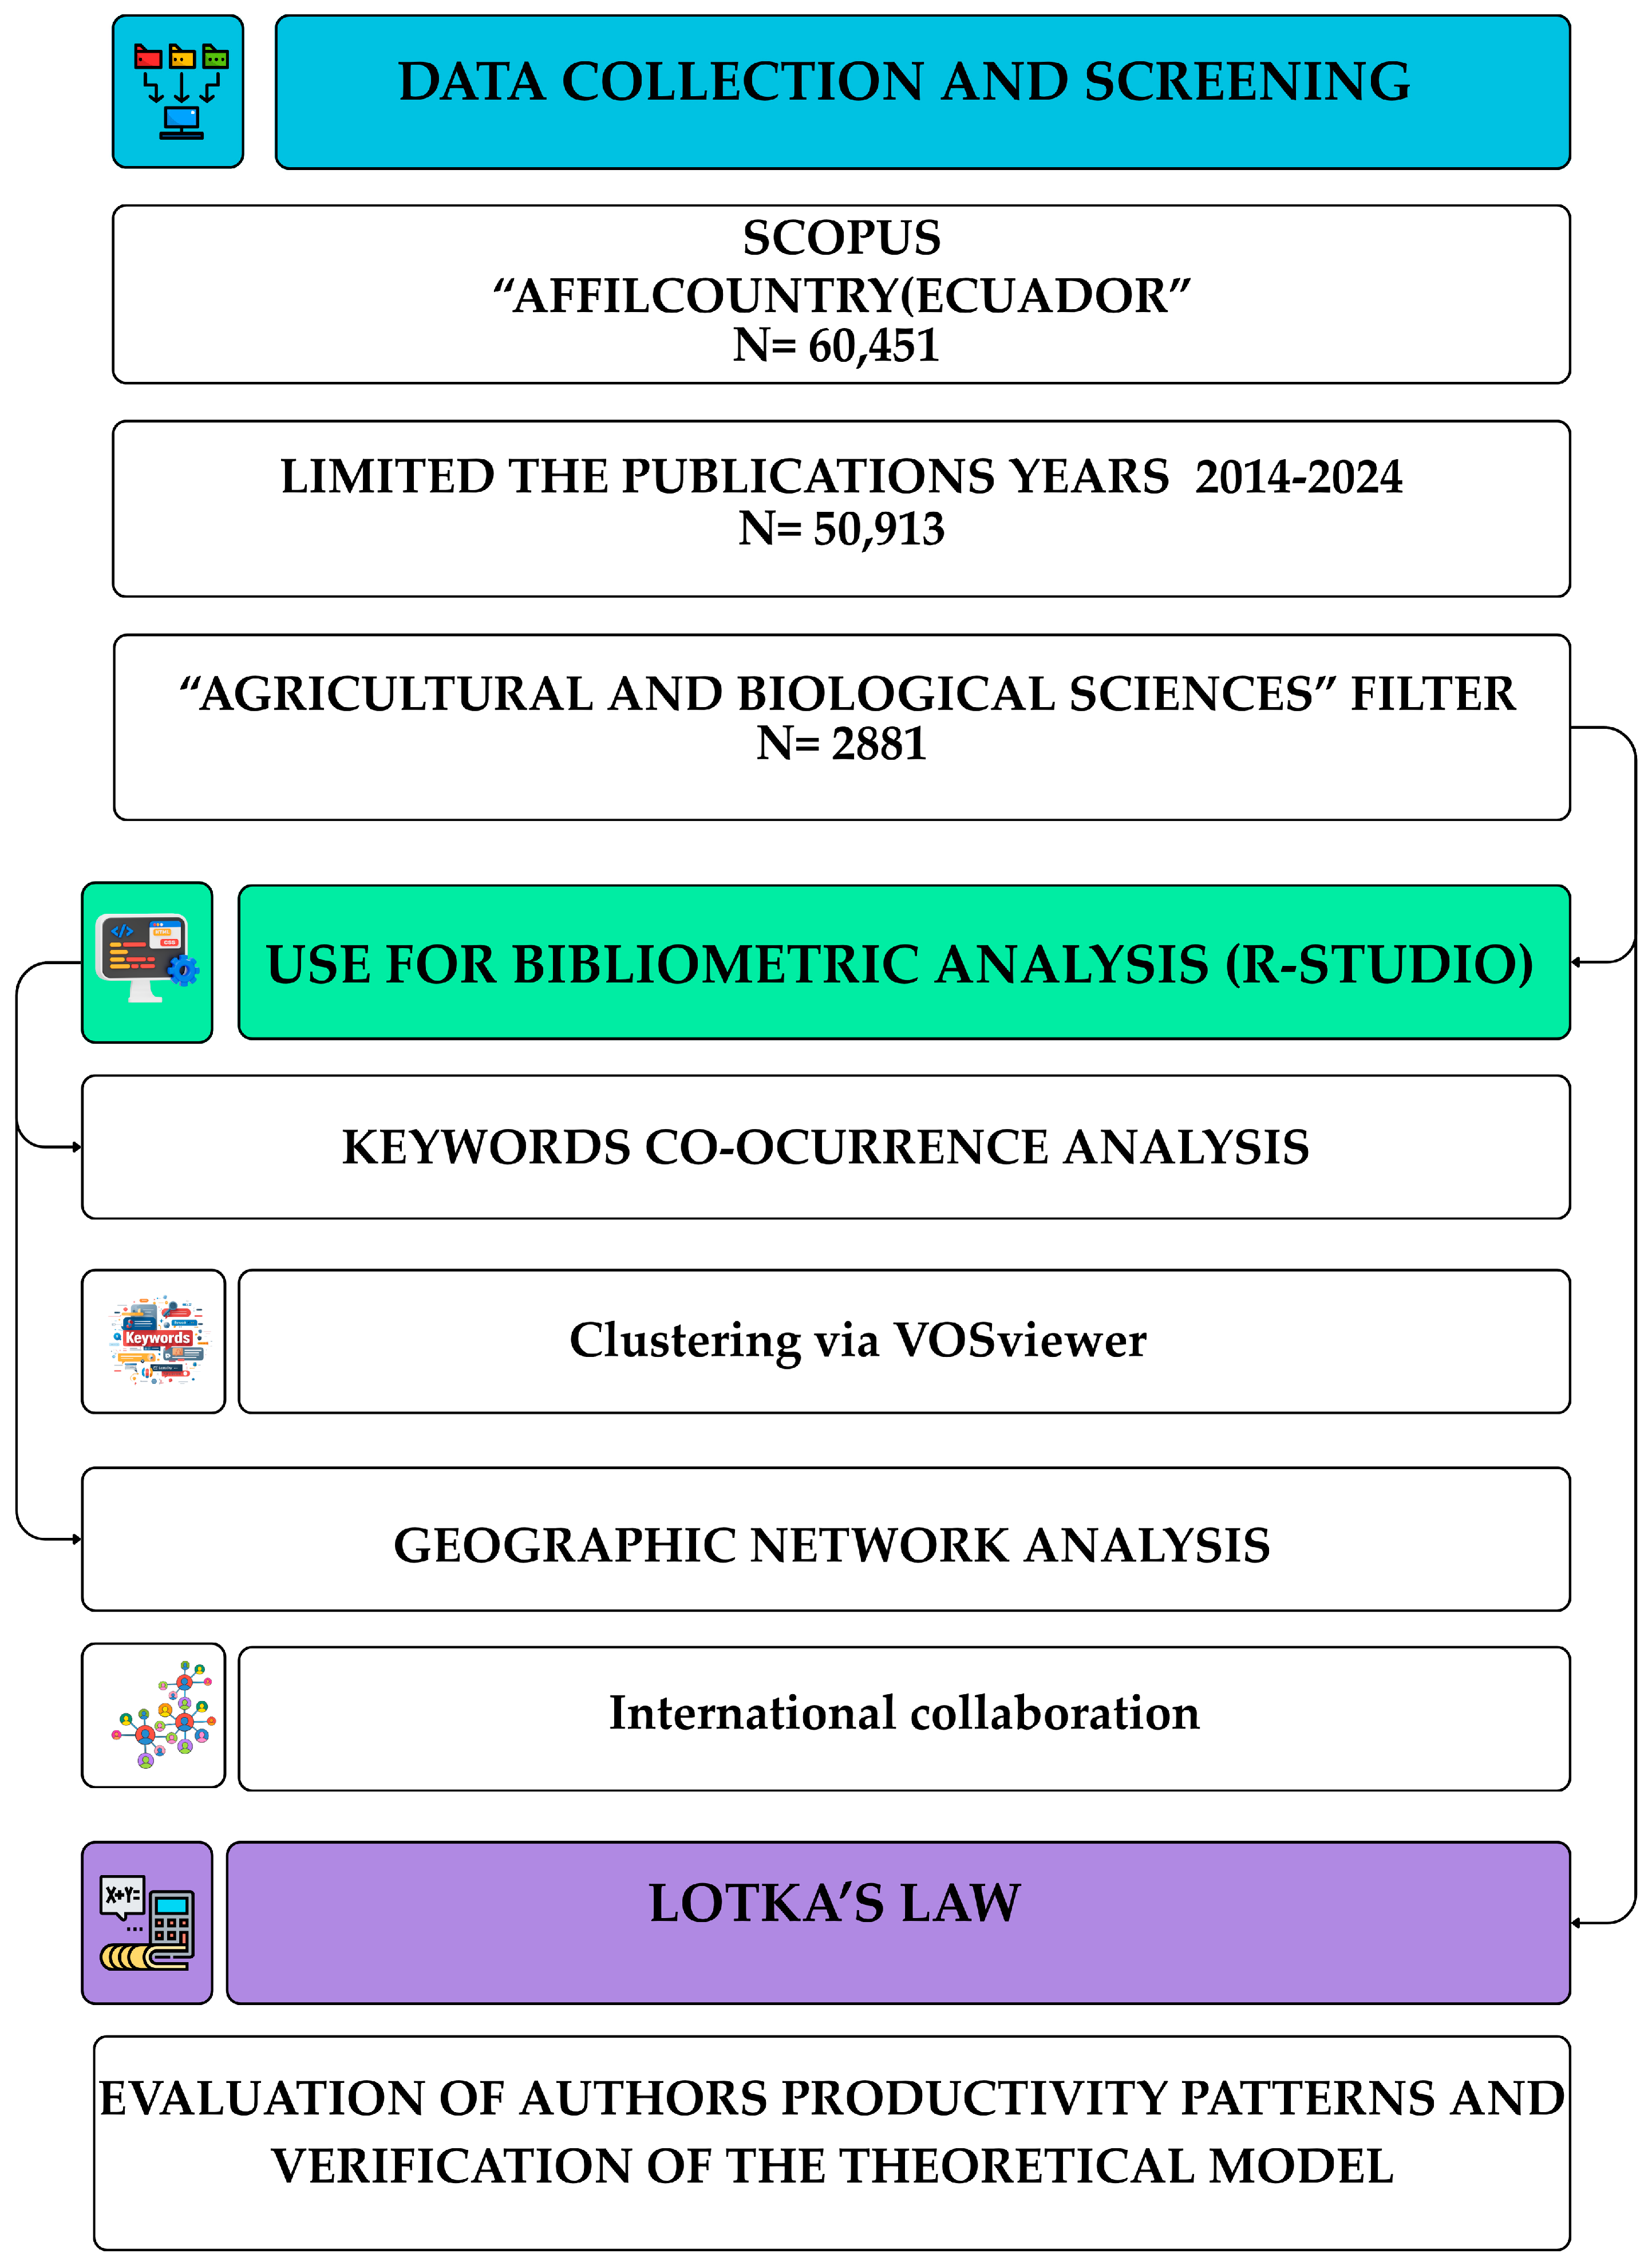
Figure 1. Workflow of data screening and bibliometric analysis of Ecuadorian publications (2014–2024) based on the Scopus database.
Publications 13 00059 g001
Figure 2. Research publication trend of Ecuador in Agricultural and Biological Science during 2014–2024 based on the Scopus database.
Publications 13 00059 g002
Figure 3. Research publication trend of Ecuador in Agricultural and Biological Science from 2014 to 2024 based on the Scopus database.
Publications 13 00059 g003
Figure 4. Density map of international collaborations with Ecuador in Agricultural and Biological Sciences (2014–2024) based on the Scopus database.
Publications 13 00059 g004
Figure 5. Number of publications and type of collaboration (2014–2024) for countries with which Ecuador has the greatest collaboration, based on the Scopus database. SCP: single-country publications and MCP: multi-country publications.
Publications 13 00059 g005
Figure 6. Most relevant affiliations that have published articles on Agricultural and Biological Sciences (2014–2024) in Ecuador, based on the Scopus database.
Publications 13 00059 g006
Figure 7. Distribution of the observed and expected number of researchers according to Lotka’s Mathematical Model.
Publications 13 00059 g007
Figure 8. Distribution of the productivity of observed and expected researchers according to the generalised form of Lotka’s Law in the sample (logarithmic scale).
Publications 13 00059 g008
Table 1. Top ten scientific journals with the highest number of Ecuadorian publications in Agricultural and Biological Sciences (2014–2024) based on the Scopus database.
JournalEditorialNumber
of Articles
Percentage of TotalCountryImpact FactorSJR 2024h-IndexCitations
ZootaxaMagnolia Press1003.47%New Zealand0.940.480 (Q2)1101368
AgronomyMultidisciplinary Digital Publishing Institute (MDPI)602.08%Switzerland3.930.744 (Q1)114740
PhytotaxaMagnolia Press1003.47%New Zealand0.960.337 (Q3)54514
Revista de Biología TropicalUniversidad de Costa Rica431.49%Costa Rica0.630.278 (Q2)50357
Revista de la Facultad de AgronomíaUniversidad de Zulia792.74%Venezuela0.250.13 (Q4)1082
Frontiers in Plant ScienceFrontiers Media S.A.411.42%Switzerland4.851.163 (Q1)216667
Scientia AgropecuariaUniversidad Nacional de Trujillo391.35%Peru1.320.273 (Q3)12128
ForestsMultidisciplinary Digital Publishing Institute (MDPI)381.32%Switzerland2.790.600 (Q1)84375
Table 2. Authors with the highest number of publications in Agricultural and Biological Sciences (2014–2024) grouped by institutional affiliation and based on the Scopus database.
Name of InstitutionAuthor with the Most
Citations
Articles by Authorh IndexFirst
Author
Last
Author
Co-AuthorSingle
Author
International Collaboration (%)Articles in Top
Citation Percentiles
Articles in Top 25% JournalsField-Weighted Citation Impact
Universidad de GuayaquilXavier Cornejo541235%16%33%16%75,4%9.8%8.3%2.92
Universidad de las AméricasLuis Baquero43724%39%33%4%63.5%3.8%5.8%0.43
Pontificia Universidad Católica del Ecuador Santiago Ron40337%37%56%0%86.6%48.8%41.5%1.78
Universidad Técnica Particular de LojaFelipe Garcés371115%64%21%0%54.5%18.2%30.2%0.59
Universidad Técnica de ManabíCésar Lodeiros352424%45%29%2%89.2%13.8%28.1%0.48
Pontificia Universidad Católica del Ecuador Álvaro Pérez331118%34%48%0%95.5%11.4%14.6%0.66
Pontificia Universidad Católica del Ecuador Omar Torres332527%31%39%3%83.1%32.4%51.2%1.87
Instituto Nacional de Investigaciones AgropecuariasWilliam Viera-Arroyo321129%31%40%0%32.4%14.7%19.4%0.67
Escuela Superior Politécnica del Litoral Stanislaus Sonnenholzner31150%50%50%0%65.0%25.0%50.0%0.84
Universidad Técnica Estatal de QuevedoJuan Reyes311139%6%55%0%89.1%14.1%4.4%0.66
Average37.616.124%34%39%3%80.21%18.56%22.61%1.12
Table 3. Distribution of researchers in Agricultural and Biological Sciences (2014–2024) by number of publications and statistical verification of Lotka’s Law.
Number of Publications (x)Number of Researchers Observed (y)Cumulative Number of
Researchers
Observed
Relative
Cumulative Number of Researchers Observed s(x)
Number of Researchers Expected C/XCumulative Number of Researchers ExpectedRelative
Cumulative Number of Researchers Expected f(x)
f(x) − s(x)|f(x) − s(x)|
1953295320.7274953295320.6206−0.10680.107
2211311,6450.8887238311,9150.7758−0.11290.113
364112,2860.9376105912,9740.8447−0.09280.093
428912,5750.959659613,5700.8835−0.07610.076
516212,7370.972038113,9510.9084−0.06360.064
610712,8440.980226514,2160.9256−0.05460.055
76312,9070.985019514,4100.9383−0.04670.047
83912,9460.987914914,5590.9480−0.04000.040
92612,9720.989911814,6770.9556−0.03430.034
102512,9970.99189514,7720.9618−0.03000.030
111913,0160.99337914,8510.9670−0.02630.026
121213,0280.99426614,9170.9713−0.02290.023
131313,0410.99525614,9740.9749−0.02030.020
141113,0520.99604915,0220.9781−0.01790.018
15713,0590.99664215,0650.9809−0.01570.016
161013,0690.99733715,1020.9833−0.01400.014
17413,0730.99763315,1350.9854−0.01220.012
18513,0780.99802915,1640.9874−0.01070.011
19313,0810.99822615,1910.9891−0.00920.009
20413,0850.99862415,2150.9906−0.00790.008
22213,0870.99872015,2340.9919−0.00680.007
24113,0880.99881715,2510.9930−0.00580.006
26113,0890.99891415,2650.9939−0.00500.005
27213,0910.99901315,2780.9948−0.00430.004
28113,0920.99911215,2900.9955−0.00350.004
29113,0930.99921115,3020.9963−0.00290.003
31313,0960.99941015,3110.9969−0.00250.002
32113,0970.9995915,3210.9975−0.00190.002
33213,0990.9996915,3300.9981−0.00150.002
35113,1000.9997815,3370.9986−0.00110.001
37113,1010.9998715,3440.9991−0.00070.001
40113,1020.9998615,3500.9995−0.00040.000
43113,1030.9999515,3550.9998−0.00010.000
54113,1041.0000315,3591.00000.00000.000
Table 4. Distribution of researchers by number of publications and statistical verification of the generalised form of Lotka’s Law in the sample.
Observed DistributionExpected Distribution According to Lotka’s LawGoodness-of-Fit Test
According to K-S
Number of Publications (x)Number of Researchers Observed (y)Cumulative Number of Researchers ObservedRelative Cumulative Number of Researchers Observed s(x)Number of Researchers Expected C/XCumulative Number of Researchers ExpectedRelative Cumulative Number of Researchers Expected f(x)f(x) − s(x)|f(x) − s(x)|
1953295320.748953295320.7850.03640.0364
2211311,6450.914161511,1470.9180.00350.0035
364112,2860.96557111,7180.9650.00020.0002
428912,5750.98727311,9920.9870.00000.0000
516212,7371.00015412,1461.0000.00000.0000
Table 5. Values of n-parameter and k-constant for the productivity analysis in Agricultural and Biological Sciences using Lotka’s Law.
InstitutionValue of the
n-Parameter
Value of the k-Constant (Percentage of Authors Publishing Only 1 Article)
Range for the n-parameter
(2.00–2.50)
2.3174.72
UEA2.1876.38
ESPOL2.4473.07
Range for the n-parameter
(2.51–3.00)
2.7976.33
UTPL2.5567.23
UDLA2.5967.08
UTEQ2.8275.22
UG2.8284.33
PUCE2.8983.34
UTM2.9278.19
INIAP2.9578.93
Range for the n-parameter
(3.01–3.50)
3.2987.06
USFQ3.1085.69
UCE3.4888.42
Average of all institutions2.8079.37
Table 6. Comparison with other studies related to the scientific production in Ecuador and Central America.
IndicatorThis StudyHerrera-Franco et al. (2021)Avello-Martínez et al. (2024)Herrera-Franco et al. (2023)Flores & Echeverría (2025)
Country/RegionEcuadorEcuadorEcuadorEcuadorCentral America
DatabaseScopusScopus and Web of ScienceScieloScopus Scopus
AreaAgricultural and Biological SciencesAgricultureMultiple areasMultiple areasMultiple areas
Scientific production (Average annual growth rate)12.92%45.77%58.74%18.59%23.0%
Top 5 countries of international collaborationUnited States, Spain, Mexico, Brazil, GermanyUnited States, Spain, France, Brazil, BelgiumBrazil, Colombia, Chile, Peru, CubaSpain, United States, Brazil, Colombia, United KingdomUnited States, Germany, United Kingdom, Switzerland, South Korea
Top 5 keywordsTaxonomy, Neotropics, Andes, Diversity, EndemismAndes, Taxonomy, Antioxidant, Amazon, Genetic diversityAndes, Taxonomy, South America, Galápagos, Conservation
Top journalsZootaxa, Agronomy, Phytotaxa, Revista de Biología Tropical, Frontiers in Plant ScienceGranja—Revista de Ciencias de la Vida, Food Chemistry, PLOS One, Food Science and Technology, PlantsRisti—Revista Ibérica de Sistemas e Tecnologias de Informação, Espacios, Physical Review Letters, PLOS One, Physical ReviewRevista de Biología Tropical, PLOS One, Zootaxa, Scientific Reports, American Journal of Tropical Medicine and Hygiene
Disclaimer/Publisher’s Note: The statements, opinions and data contained in all publications are solely those of the individual author(s) and contributor(s) and not of MDPI and/or the editor(s). MDPI and/or the editor(s) disclaim responsibility for any injury to people or property resulting from any ideas, methods, instructions or products referred to in the content.