Abstract
This manuscript introduces the Scientific Peer Review Index (SPR-index), a novel metric designed to enhance the H-index by incorporating verified peer review records from the Web of Science database. The SPR-index aims to provide a more comprehensive assessment of researchers by considering not only their publication record but also their contributions to the peer review system—an essential yet often overlooked aspect of academic work. Given the increasing difficulty in finding qualified reviewers, this metric aims to recognize and incentivize peer review efforts. The SPR-index is calculated as the product of a researcher’s H-index, normalized by their number of publications, and the total number of verified peer reviews, offering a more nuanced measure of their academic impact. Additionally, we propose factoring in review length to acknowledge researchers who provide in-depth evaluations that exceed the average word count. However, its successful implementation depends on improvements in Clarivate’s peer review data collection, particularly in enhancing the accuracy and completeness of verified review records. Researchers must also ensure their reviews are visible in the Web of Science by selecting appropriate visibility settings. The further refinement and validation of this metric are needed to support its widespread adoption in the academic community.
1. Introduction
The H-index, introduced by Jorge E. Hirsch in 2005, is a widely used metric for quantifying a researcher’s productivity and impact. Defined as the number of publications (h) that have received at least h citations, it has become a standard tool for evaluating scholarly output due to its simplicity and effectiveness (Glänzel, 2006; Hirsch, 2005). However, while the H-index provides a useful measure of citation impact, it fails to capture other critical aspects of academic contributions. One of the most significant omissions is peer review activity, an essential yet often overlooked component of scholarly engagement.
Assessing the significance of scientific research and individual performance is crucial for funding agencies, promotion committees, and policymakers. Bibliometric indicators such as the impact factor (IF) and the H-index are widely used tools for evaluating research performance (Bornmann & Daniel, 2009). Despite their utility, these indicators often oversimplify the complexities of research assessment. Adler et al. (2009) argued that the H-index and similar metrics reduce a complex citation record to a single number, potentially overlooking other meaningful scholarly activities. Nevertheless, the H-index remains a widely adopted comparative measure among major publishers and research institutions.
Various enhancements and alternatives to the H-index have been proposed to address its limitations. The G-index, introduced by Egghe (2006), improves citation impact measurement by assigning greater weight to highly cited publications, providing a more comprehensive assessment of a researcher’s influence. However, it remains solely citation-based, potentially favoring established researchers over early-career academics. Similarly, network-based adaptations of the H-index, such as the lobby index, h-degree, and c-index, have been developed to assess academic influence in specific contexts (Ding et al., 2020; Yan et al., 2012; Schubert & Glänzel, 2007). The Uh-index further expands research evaluation by incorporating usage data (Qiao et al., 2025). Despite these adaptations, none adequately account for peer review—a fundamental pillar of academic integrity.
Peer review contributions, while crucial to maintaining the integrity of the scientific process, remain largely absent from existing bibliometric measures (Nguyen & Tuamsuk, 2024). The increasing prevalence of open access journals, many of which charge publication fees, further complicates the peer review ecosystem. Researchers are often reluctant to review for such journals, increasing the burden on those who continue to engage in peer review (Tennant et al., 2016). Despite these challenges, dedicated reviewers play a vital role in sustaining the peer review process, underscoring the need for metrics that recognize and reward their contributions (El-Guebaly et al., 2023).
To address this gap, we propose the SPR-index, an extension of the H-index that incorporates a researcher’s engagement in peer review. The SPR-index considers both the number of publications and the number of verified peer reviews, providing a more comprehensive evaluation of a researcher’s impact within the scientific community (Tennant, 2018). Verified peer reviews can be sourced from platforms that track peer review activity, such as Web of Science (Teixeira da Silva & Nazarovets, 2022). For instance, if a researcher has published 100 articles and reviewed 110, their preliminary peer review metric would be 1.1, as detailed further.
Beyond quantifying peer review contributions, the SPR-index introduces review length as a potential factor in its calculation. Review length may reflect the depth of engagement and effort a researcher invests in evaluating manuscripts (Chigbu et al., 2023). We propose rewarding researchers whose reviews exceed the average word count in their field, recognizing their commitment to providing detailed and constructive feedback. The SPR-index aims to assess researchers based on both their reviewing activity and the extent of their reviews relative to the global average.
Field-normalized citation impact indicators are essential for cross-disciplinary comparisons, and this study underscores the necessity of fractional counting over full counting for proper normalization, particularly in bibliometric analyses at national and institutional levels (Waltman & van Eck, 2015). Since its introduction, the H-index has been adapted to various contexts, including network-based analyses (Zhao et al., 2011). This versatility has inspired the development of derivative metrics, yet none have successfully integrated peer review contributions into research evaluation.
In this article, we introduce the SPR-index, a novel metric that incorporates peer review activity into scholarly assessment, providing a more comprehensive evaluation of researchers’ contributions to the scientific community. By recognizing peer review efforts and incentivizing greater participation in the review process, the SPR-index represents a step toward a more balanced and integrative approach to research evaluation. However, its successful implementation depends on improvements in Clarivate’s peer review data collection, particularly in ensuring the accuracy and completeness of verified review records. The further refinement and validation of this metric are necessary for its widespread adoption in the academic community.
2. Materials and Methods
2.1. Data Acquisition and Validation
The researcher data used in this study were obtained from the 2024 Clarivate Highly Cited Researchers™ list, which includes 6886 researchers across various disciplines. Compiled by Clarivate™, this list highlights scientists and social scientists with exceptional influence in their fields. The full list is publicly available at https://clarivate.com/highly-cited-researchers/ (accessed on 2 February 2025). For our analyses, we selected the first 690 researchers from this dataset, ensuring statistical representativeness (see Section 2.6 for details). We then calculated the SPR index (as detailed below) for the researchers. Notably, the SPR index could only be determined for 517 researchers, as their profiles were confirmed on the Clarivate™ platform, ensuring full data availability. To illustrate different aspects of the SPR-index, we constructed the following tables: (i) Table 1 presents the 40 top researchers with the highest H-index, allowing a direct comparison between the H-index and SPR-index among the most cited individuals; (ii) Table 2 lists the 20 researchers with the highest SPR-index, none of whom appear in Table 1, demonstrating that peer review contributions are often made by individuals who are not necessarily the most cited; (iii) Table 3 refines the SPR-index calculation by incorporating a correction factor based on review length (detailed below), highlighting the impact of extensive peer review contributions; and (iv) Table 4 includes 40 mid-career researchers (H-index = 15–25), enabling a comparison between highly cited and mid-career researchers in terms of peer review engagement. Data on mid-career researchers were sourced from Perneger (2023), which analyzed authorship and citation patterns among highly cited biomedical scientists.

Table 1.
The H-index and corrSPR-index of the top 40 researchers with the highest H-index.

Table 2.
A comparison of the corrSPR-index and H-index for the top 20 researchers with the highest SPR-index.

Table 3.
A comparison of the adjSPR-index, corrSPR-index, and H-index for the top 20 researchers with the highest corrSPR-index, incorporating review length as a secondary correction factor in the SPR-index calculation (data collected on 11 February 2025).

Table 4.
The corrSPR-index of 40 researchers with a mid-range H-index (15–25).
2.2. Peer Review Metric
The peer review metric is defined as the ratio of the total number of peer reviews conducted to the number of publications. Although the number of peer review invitations received (C) would more accurately reflect a researcher’s willingness to engage in the peer review process, this information is not publicly available. Therefore, we use the number of publications (P) as a proxy for visibility within the academic community as it correlates with the likelihood of being invited to review:
Peer Review Metric = N° of Reviews Conducted (R)/N° of Publications (P)
This ratio provides an insight into the relative balance between a researcher’s contributions as an author and as a peer reviewer. However, to simplify interpretation, we redefine the SPR-index in the next section as a direct function of R, thereby avoiding reliance on this intermediate metric.
2.3. SPR-Index Calculation
To combine scientific impact and peer review engagement into a single composite metric, we define the SPR-index as the product of a researcher’s normalized H-index and the number of reviews conducted:
SPR-index = (H-index/P) × R
This formulation eliminates the need to estimate the number of peer review invitations (C) while still capturing the balance between research output and peer review activity. Normalizing the H-index by the number of publications (H/P) accounts for the size of a researcher’s publication record, ensuring the metric reflects impact relative to output. When multiplied by R, the result highlights both high-impact research and meaningful engagement in the peer review system.
2.4. Correction Factor and Definition of the corrSPR-Index
To address potential imbalances in the original SPR-index—particularly between researchers with low publication counts but high peer review activity, and those with higher publication outputs and moderate review activity—we propose an adjusted version of the metric, referred to as the corrSPR-index (corrected Scientific Peer Review Index).
This revised formulation introduces a logarithmic scaling factor based on the number of publications, intended to moderate the potential overvaluation of reviewers with very few authored papers. The rationale is that publication output tends to increase nonlinearly over the course of a research career; thus, a logarithmic transformation provides a more proportional adjustment when comparing individuals at different stages.
The corrected metric is defined as follows:
where the following applies:
corrSPR-index = (H/P) × R × log(P)
H is the researcher’s H-index;
P is the total number of publications authored;
R is the total number of peer reviews conducted;
log(P) is the logarithm of the number of publications.
This adjusted version retains the original goal of integrating scientific impact (via the H-index) with peer review engagement while reducing excessive sensitivity to low publication counts.
2.5. The Inclusion of Review Length as a Second Correction Factor
To further enhance the corrSPR-index, we propose incorporating review length as an additional correction factor. This adjustment aims to acknowledge the depth and effort involved in a researcher’s peer review activity under the assumption that longer reviews often reflect more detailed feedback and greater engagement.
We introduce the Review Length Factor, calculated as the ratio between a researcher’s average review length and the global average review length. Specifically, the following applies:
Lr is the researcher’s average review length (in words);
La is the global average review length, calculated from the full dataset.
The Review Length Factor is defined as follows:
Review Length Factor = Lr/La
This value is then added to the corrSPR-index, resulting in the final adjusted metric:
adjSPR-index = corrSPR-index + Review Length Factor
This refinement ensures that the adjSPR-index captures not only the volume of peer review contributions but also acts as a proxy for their level of detail and critical analysis. Importantly, by treating this correction as an additive rather than a multiplicative factor, the model avoids excessive weighting while still valuing meaningful engagement in the peer review process.
2.6. Statistical Analysis
To ensure statistical validity, we determined the minimum required sample size for a finite population using standard sample size estimation methods (Cochran, 1977). Assuming a total population of 6886 highly cited researchers (based on 2024 Clarivate data), a 95% confidence level (Z = 1.96), an assumed population proportion of 0.5 (maximizing variability), and a 5% margin of error (0.05), the calculated minimum sample size was 364 researchers. Our dataset, comprising 690 researchers (approximately 10% of the total population), exceeds this threshold, ensuring statistical representativeness at a 95% confidence level.
The relationship between the corrSPR-index and the traditional H-index was evaluated using both parametric and non-parametric statistical methods. Initially, the distribution of both variables was assessed through descriptive statistics, histograms, and Q-Q plots. Formal tests for normality included the Shapiro–Wilk, Jarques–Bera and Lilliefors tests, applied to both the H-index and the corrSPR-index. Subsequently, multiple statistical approaches were applied: (i) Pearson’s correlation coefficient (r): to assess the strength and direction of the linear relationship between the indices under the assumption of normality; (ii) Spearman’s rank correlation coefficient (ρ): to assess potential nonlinear relationships and ensure robustness against deviations from normality; and (iii) Linear regression analysis: modeling the corrSPR-index as a predictor variable and the H-index as the outcome variable to evaluate the predictive power of the corrSPR-index. Model residuals were also evaluated to ensure compliance with linear regression assumptions (normality, homoscedasticity, and linearity), using visual inspection via histograms and Q-Q plots, as well as the Shapiro–Wilk test.
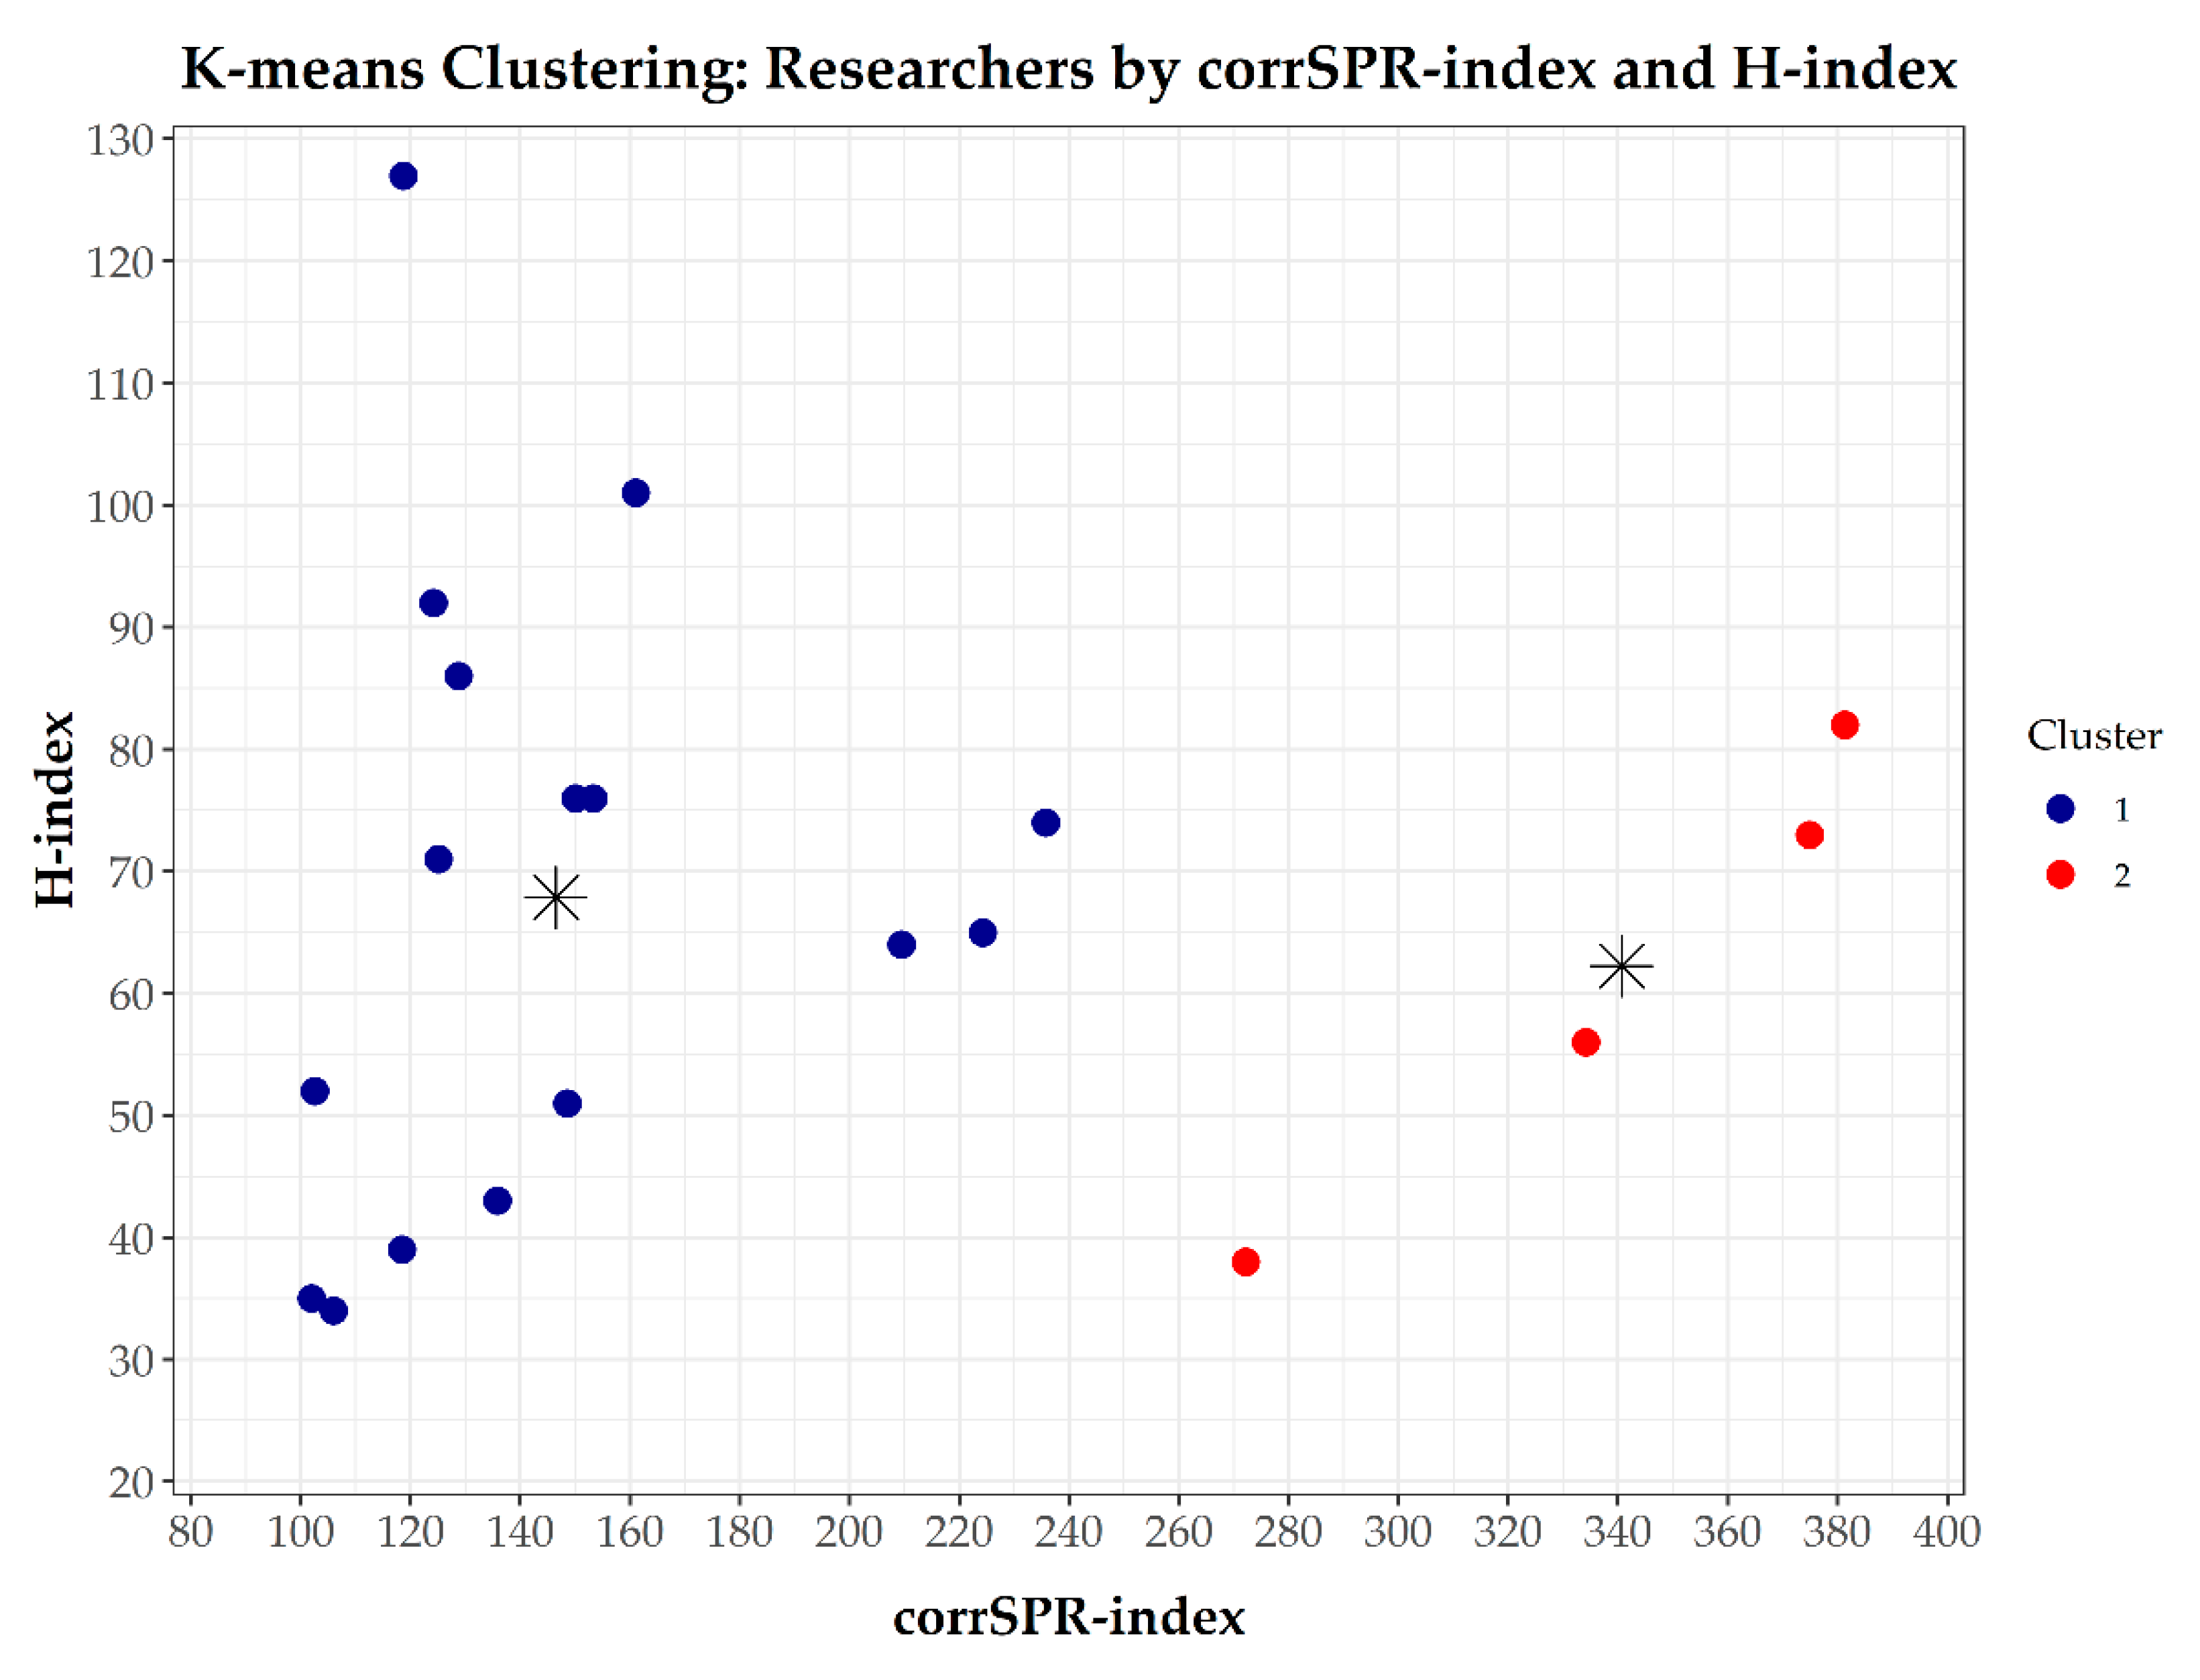
To identify potential researcher profiles, a K-means clustering algorithm was employed to classify researchers based on their corrSPR-index and H-index values. The optimal number of clusters was empirically determined to be two. Cluster centroids were computed to characterize distinct researcher profiles, and silhouette coefficient analysis was used to assess clustering quality, revealing different academic contribution patterns beyond traditional citation metrics.
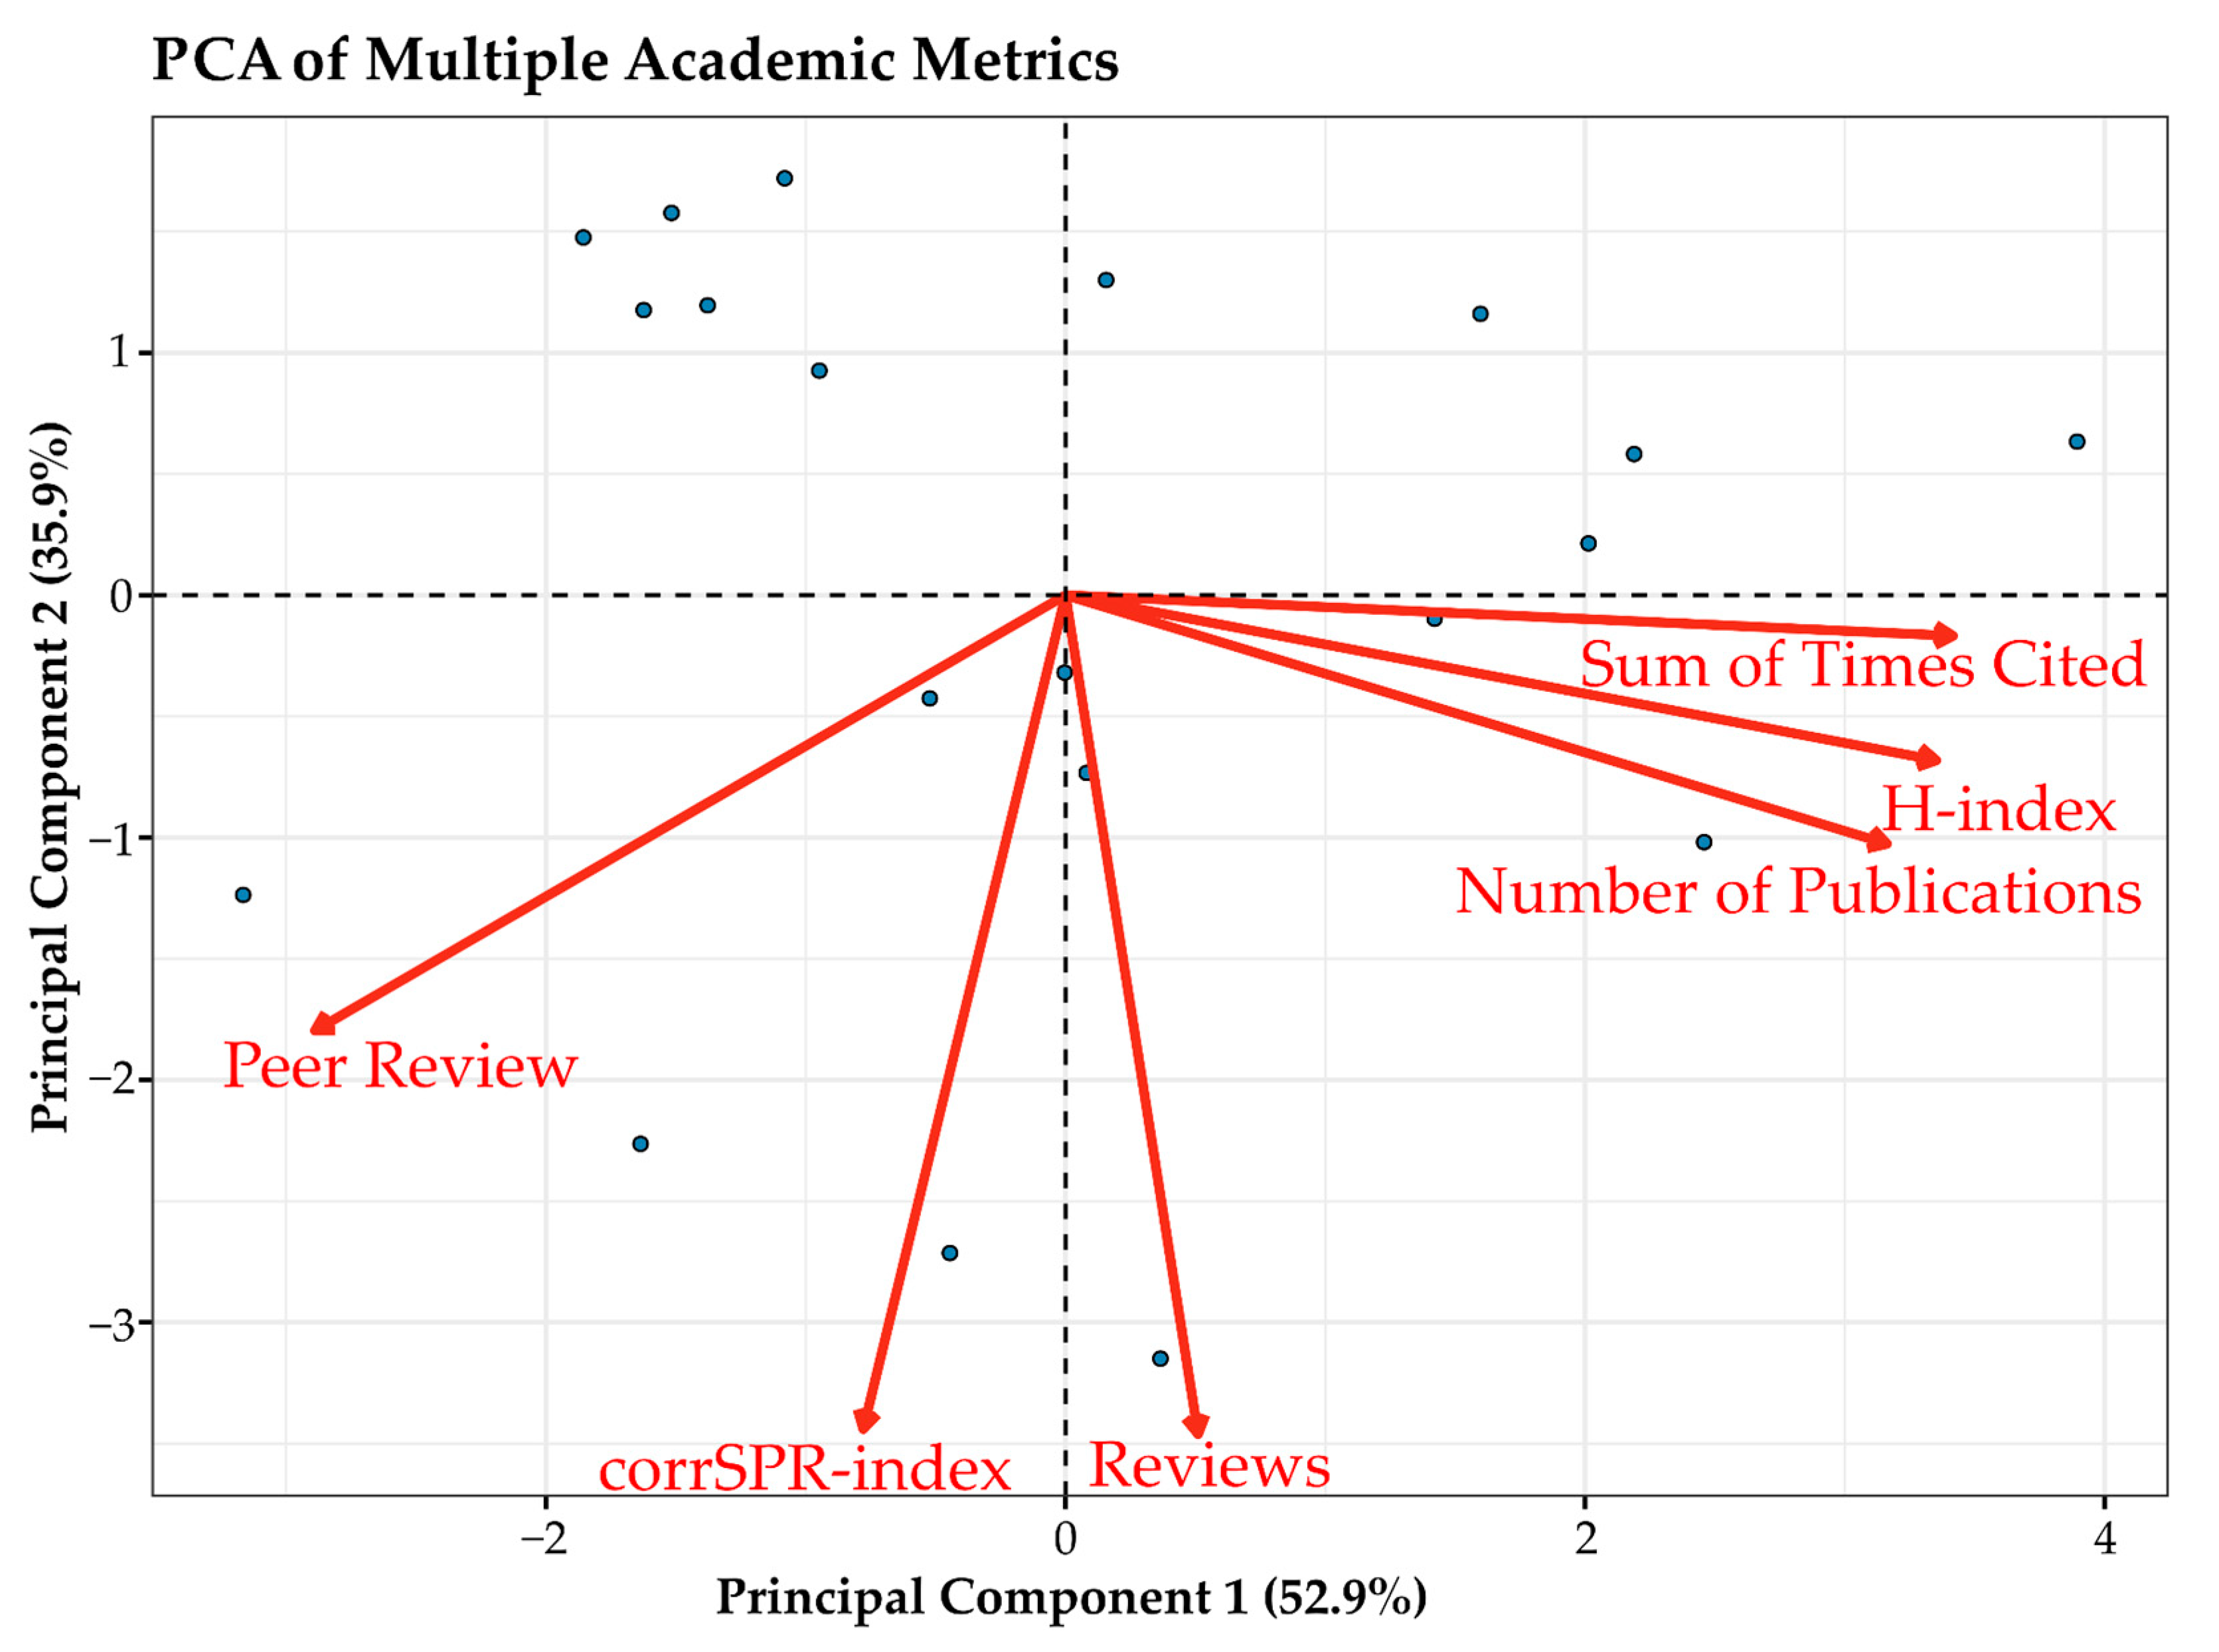
To further investigate the multidimensional relationships among bibliometric and peer review indicators, a principal component analysis (PCA) was performed using six standardized variables: the H-index, corrSPR-index, number of publications, total citations, number of peer reviews, and composite peer review metric. This approach enabled the visualization of researcher distribution and variable loadings in a reduced dimensional space.
All statistical analyses and visualizations were performed using R (version 4.4.2; R Core Team, 2024). Correlation and regression analyses were conducted with the stats package. Normality tests included the Shapiro–Wilk test (shapiro.test from the stats package), the Jarque–Bera test (from the tseries package), and the Lilliefors test (from the nortest package). Hierarchical clustering was performed using the cluster package, and data visualization was generated with ggplot2 (Wickham, 2016).
3. Results
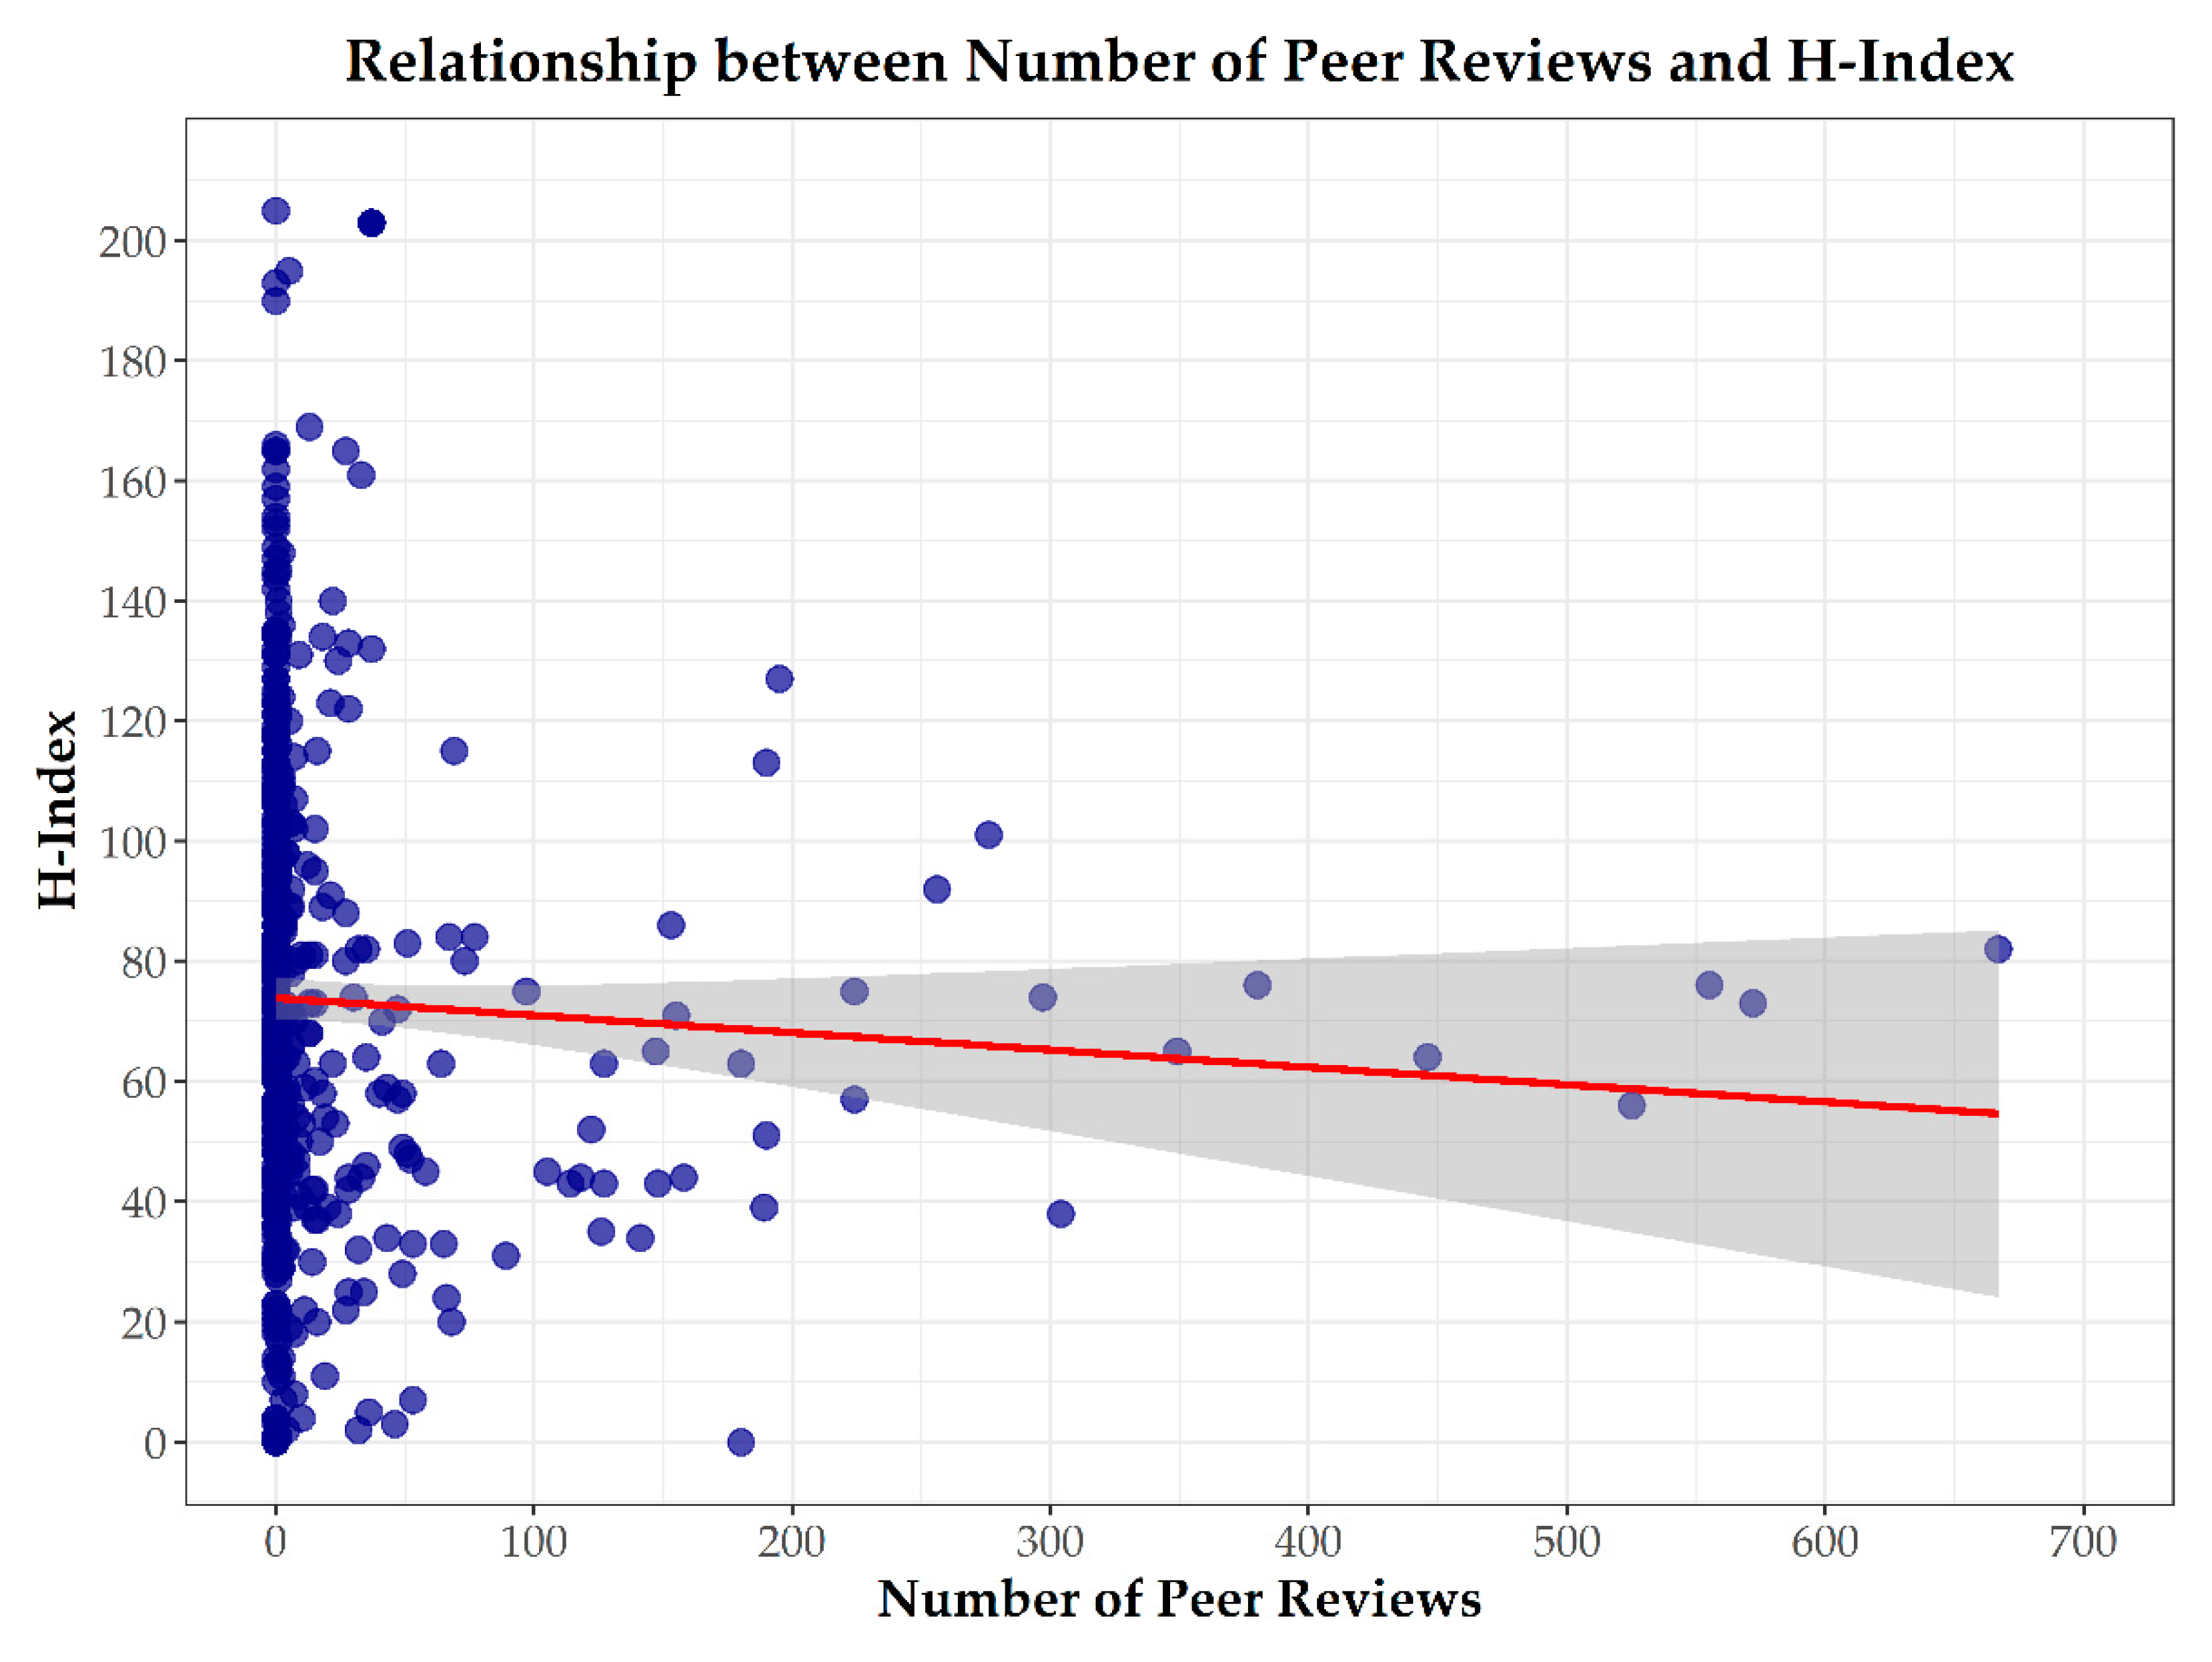
Using data from Table S1, we compiled Table 1, which presents the top 40 researchers with the highest H-index among the 690 individuals whose data were collected from Web of Science. While these researchers exhibit substantial academic impact, as reflected by their citation counts, most participate in relatively few peer reviews. This pattern suggests that a high H-index does not necessarily correspond to active engagement in the peer review process. Furthermore, the data revealed a nonlinear relationship between researchers’ H-index and their peer review activity (Figure 1).
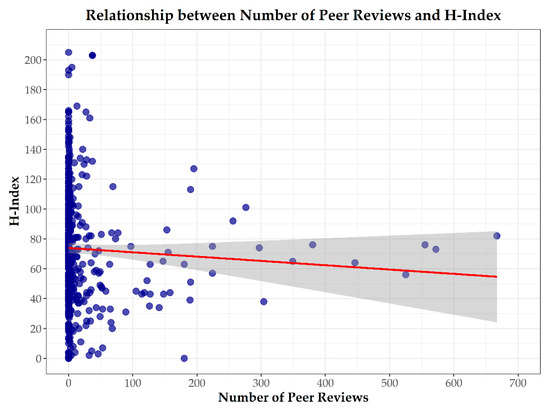
Figure 1.
The relationship between the H-index and number of peer reviews. The scatter plot illustrates the relationship between researchers’ H-index and the number of peer reviews they have conducted. Each point represents an individual researcher (n = 517, researchers with available peer review profiles; see Table S1 for details). The solid line represents the linear regression trend, and the shaded area corresponds to the 95% confidence interval. The plot reveals that researchers with higher H-index values tend to conduct fewer peer reviews.
The trend line, displayed with a 95% confidence interval, showed considerable variability and no clear directional pattern. This finding underscores the limitations of traditional bibliometric indicators in capturing researcher’s engagement in peer review and highlights the need to re-examine existing metrics to more accurately recognize and incentivize this essential scholarly contribution.
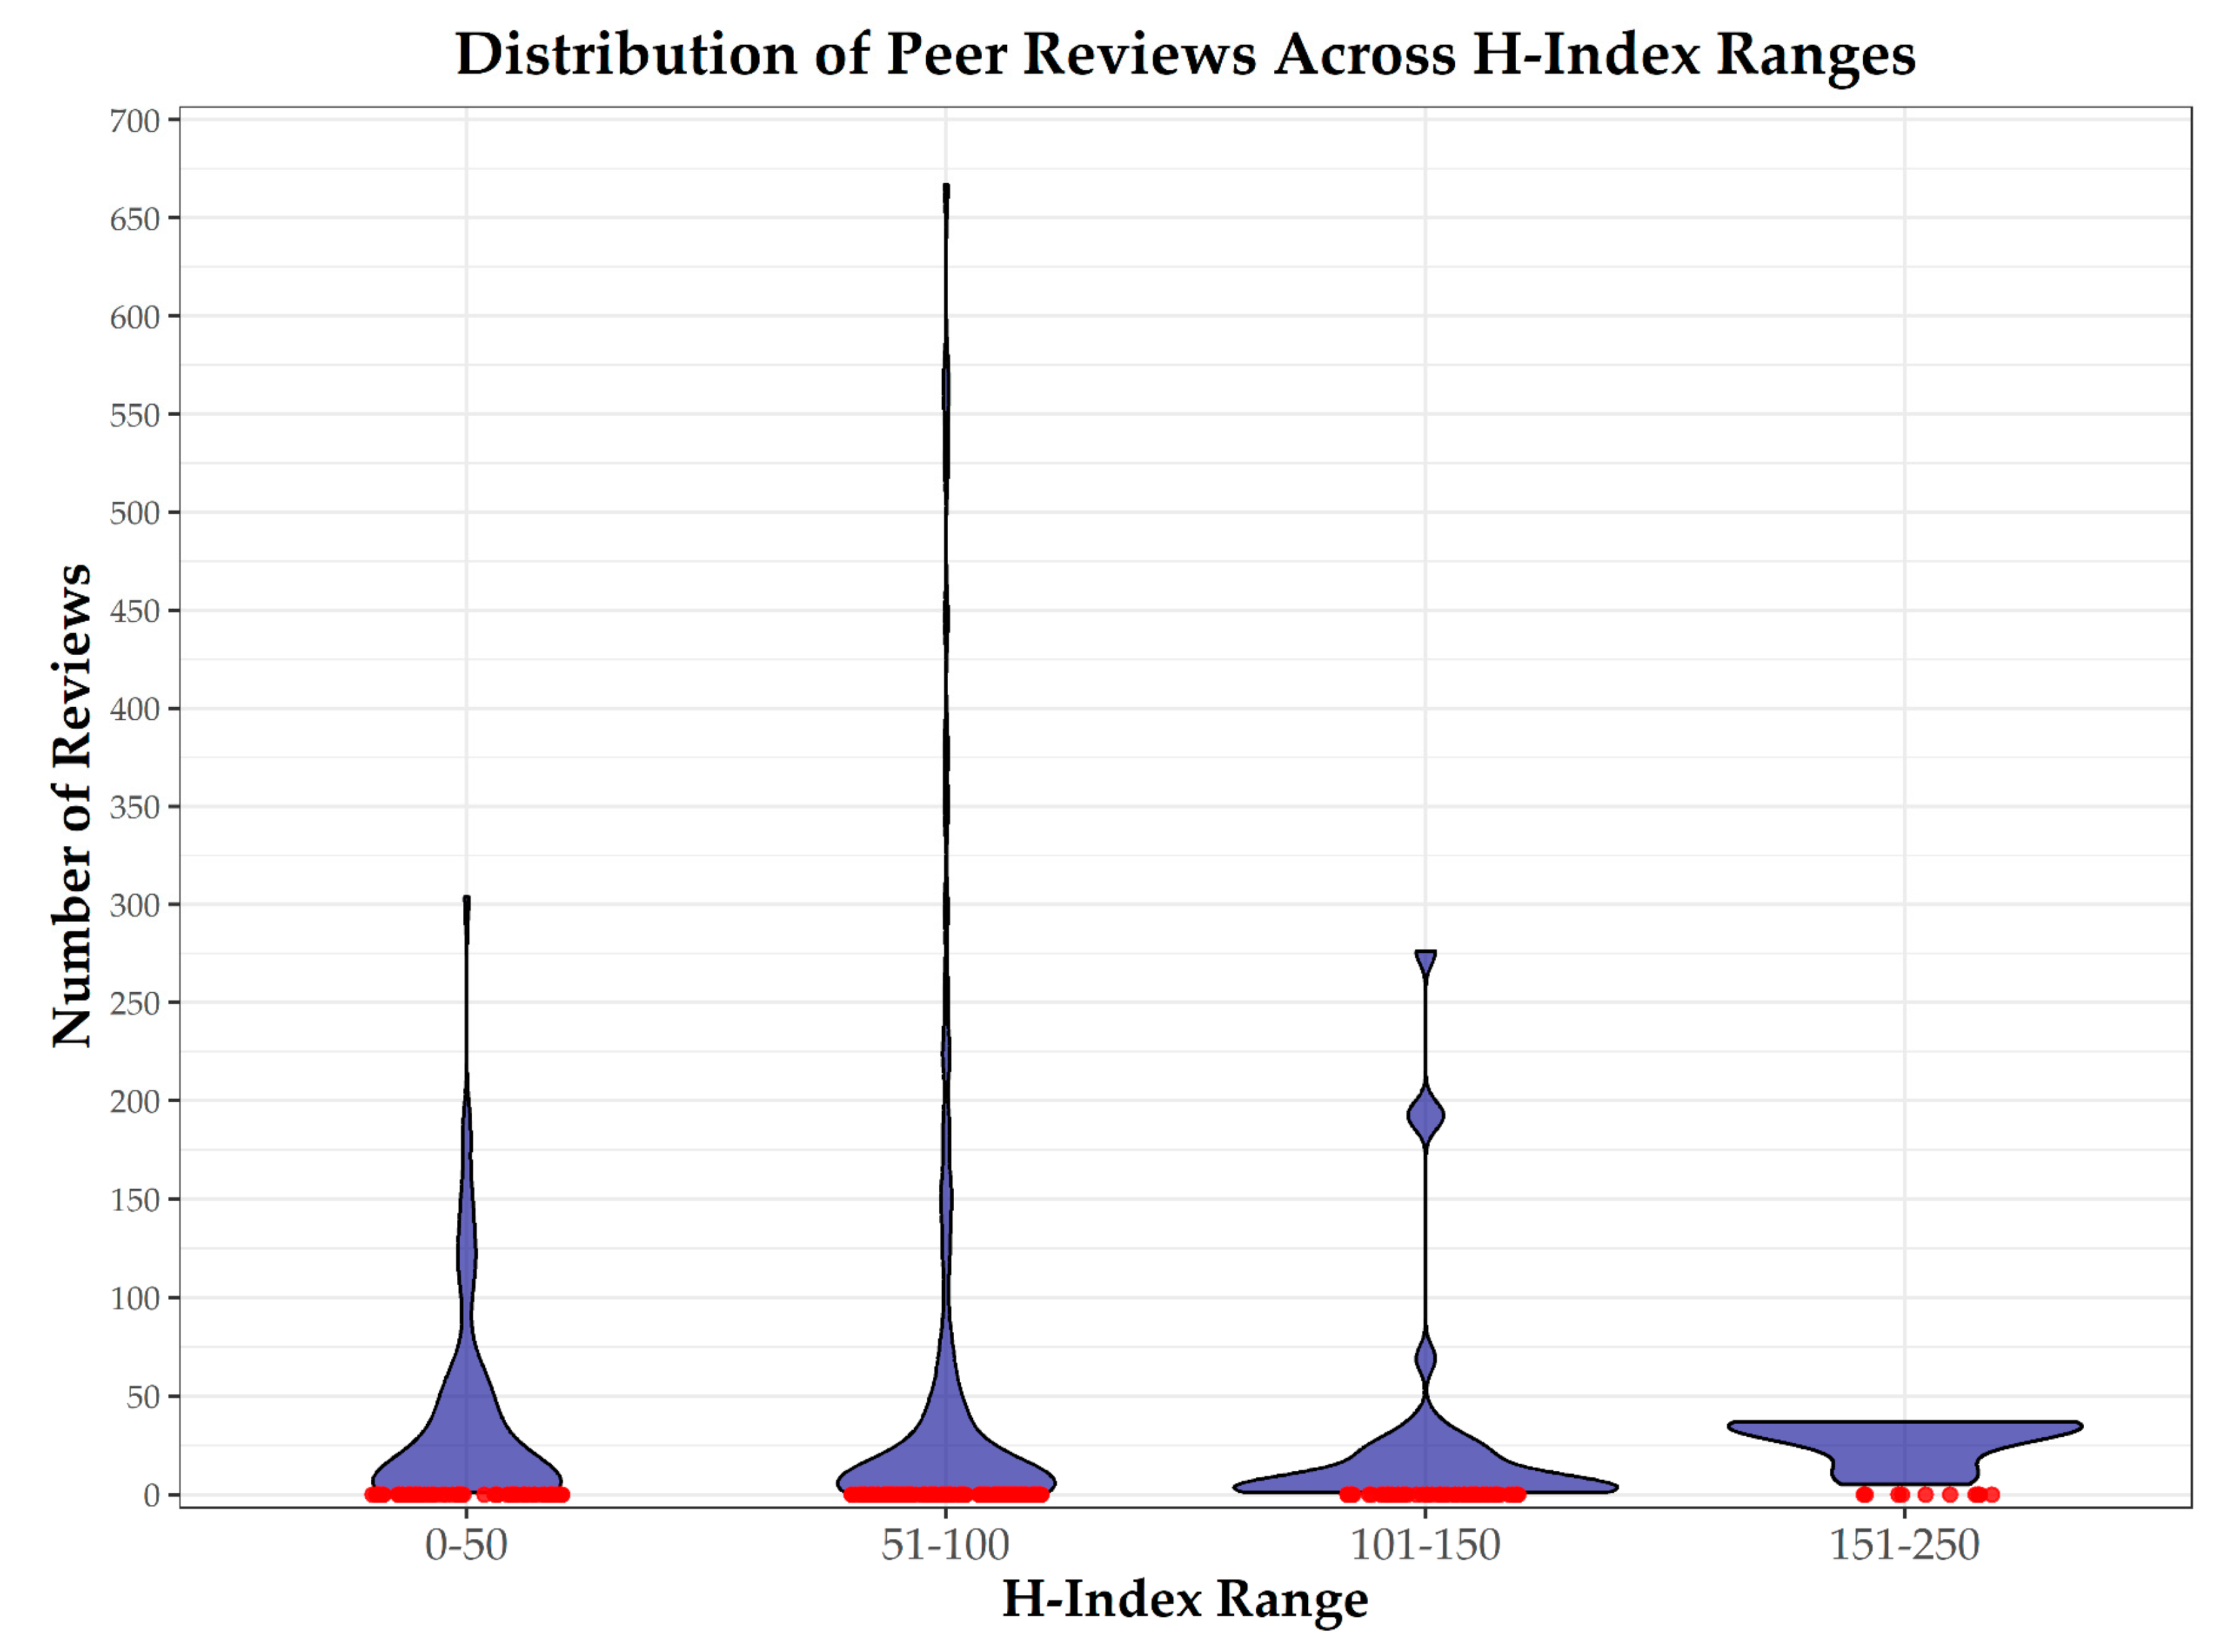
The distribution of peer reviews across different H-index groups reveals substantial variability in peer review activity among researchers. In particular, researchers within the H-index range of 151–250 display notable inconsistency in their peer review contributions, with some demonstrating substantial activity while others contribute minimally or not at all (Figure 2). Notably, several researchers at the upper end of this range (H-index > 175) exhibit limited engagement despite their higher academic standing (Table S1). Compared to the researchers listed in Table 1, those with the highest H-index values (e.g., 190–205; see Table S1) tend to show disproportionately lower peer review activity, suggesting a potential inverse relationship between a very high H-index and peer review engagement.
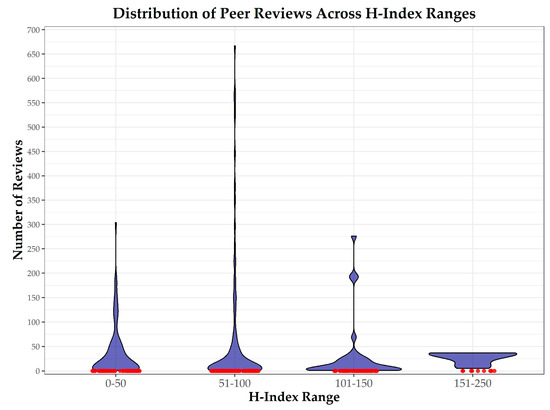
Figure 2.
The distribution of peer reviews by the H-index group. The violin plot displays the number of peer reviews conducted across researcher groups categorized by their H-index, with zero-review cases represented as red points. The data are based on Table S1 (n = 517 researchers), illustrating the variability in peer review activity, particularly among researchers with the highest H-index scores. Group sizes: 0–50 (n = 150), 51–100 (n = 255), 101–150 (n = 93), and 151–250 (n = 19).
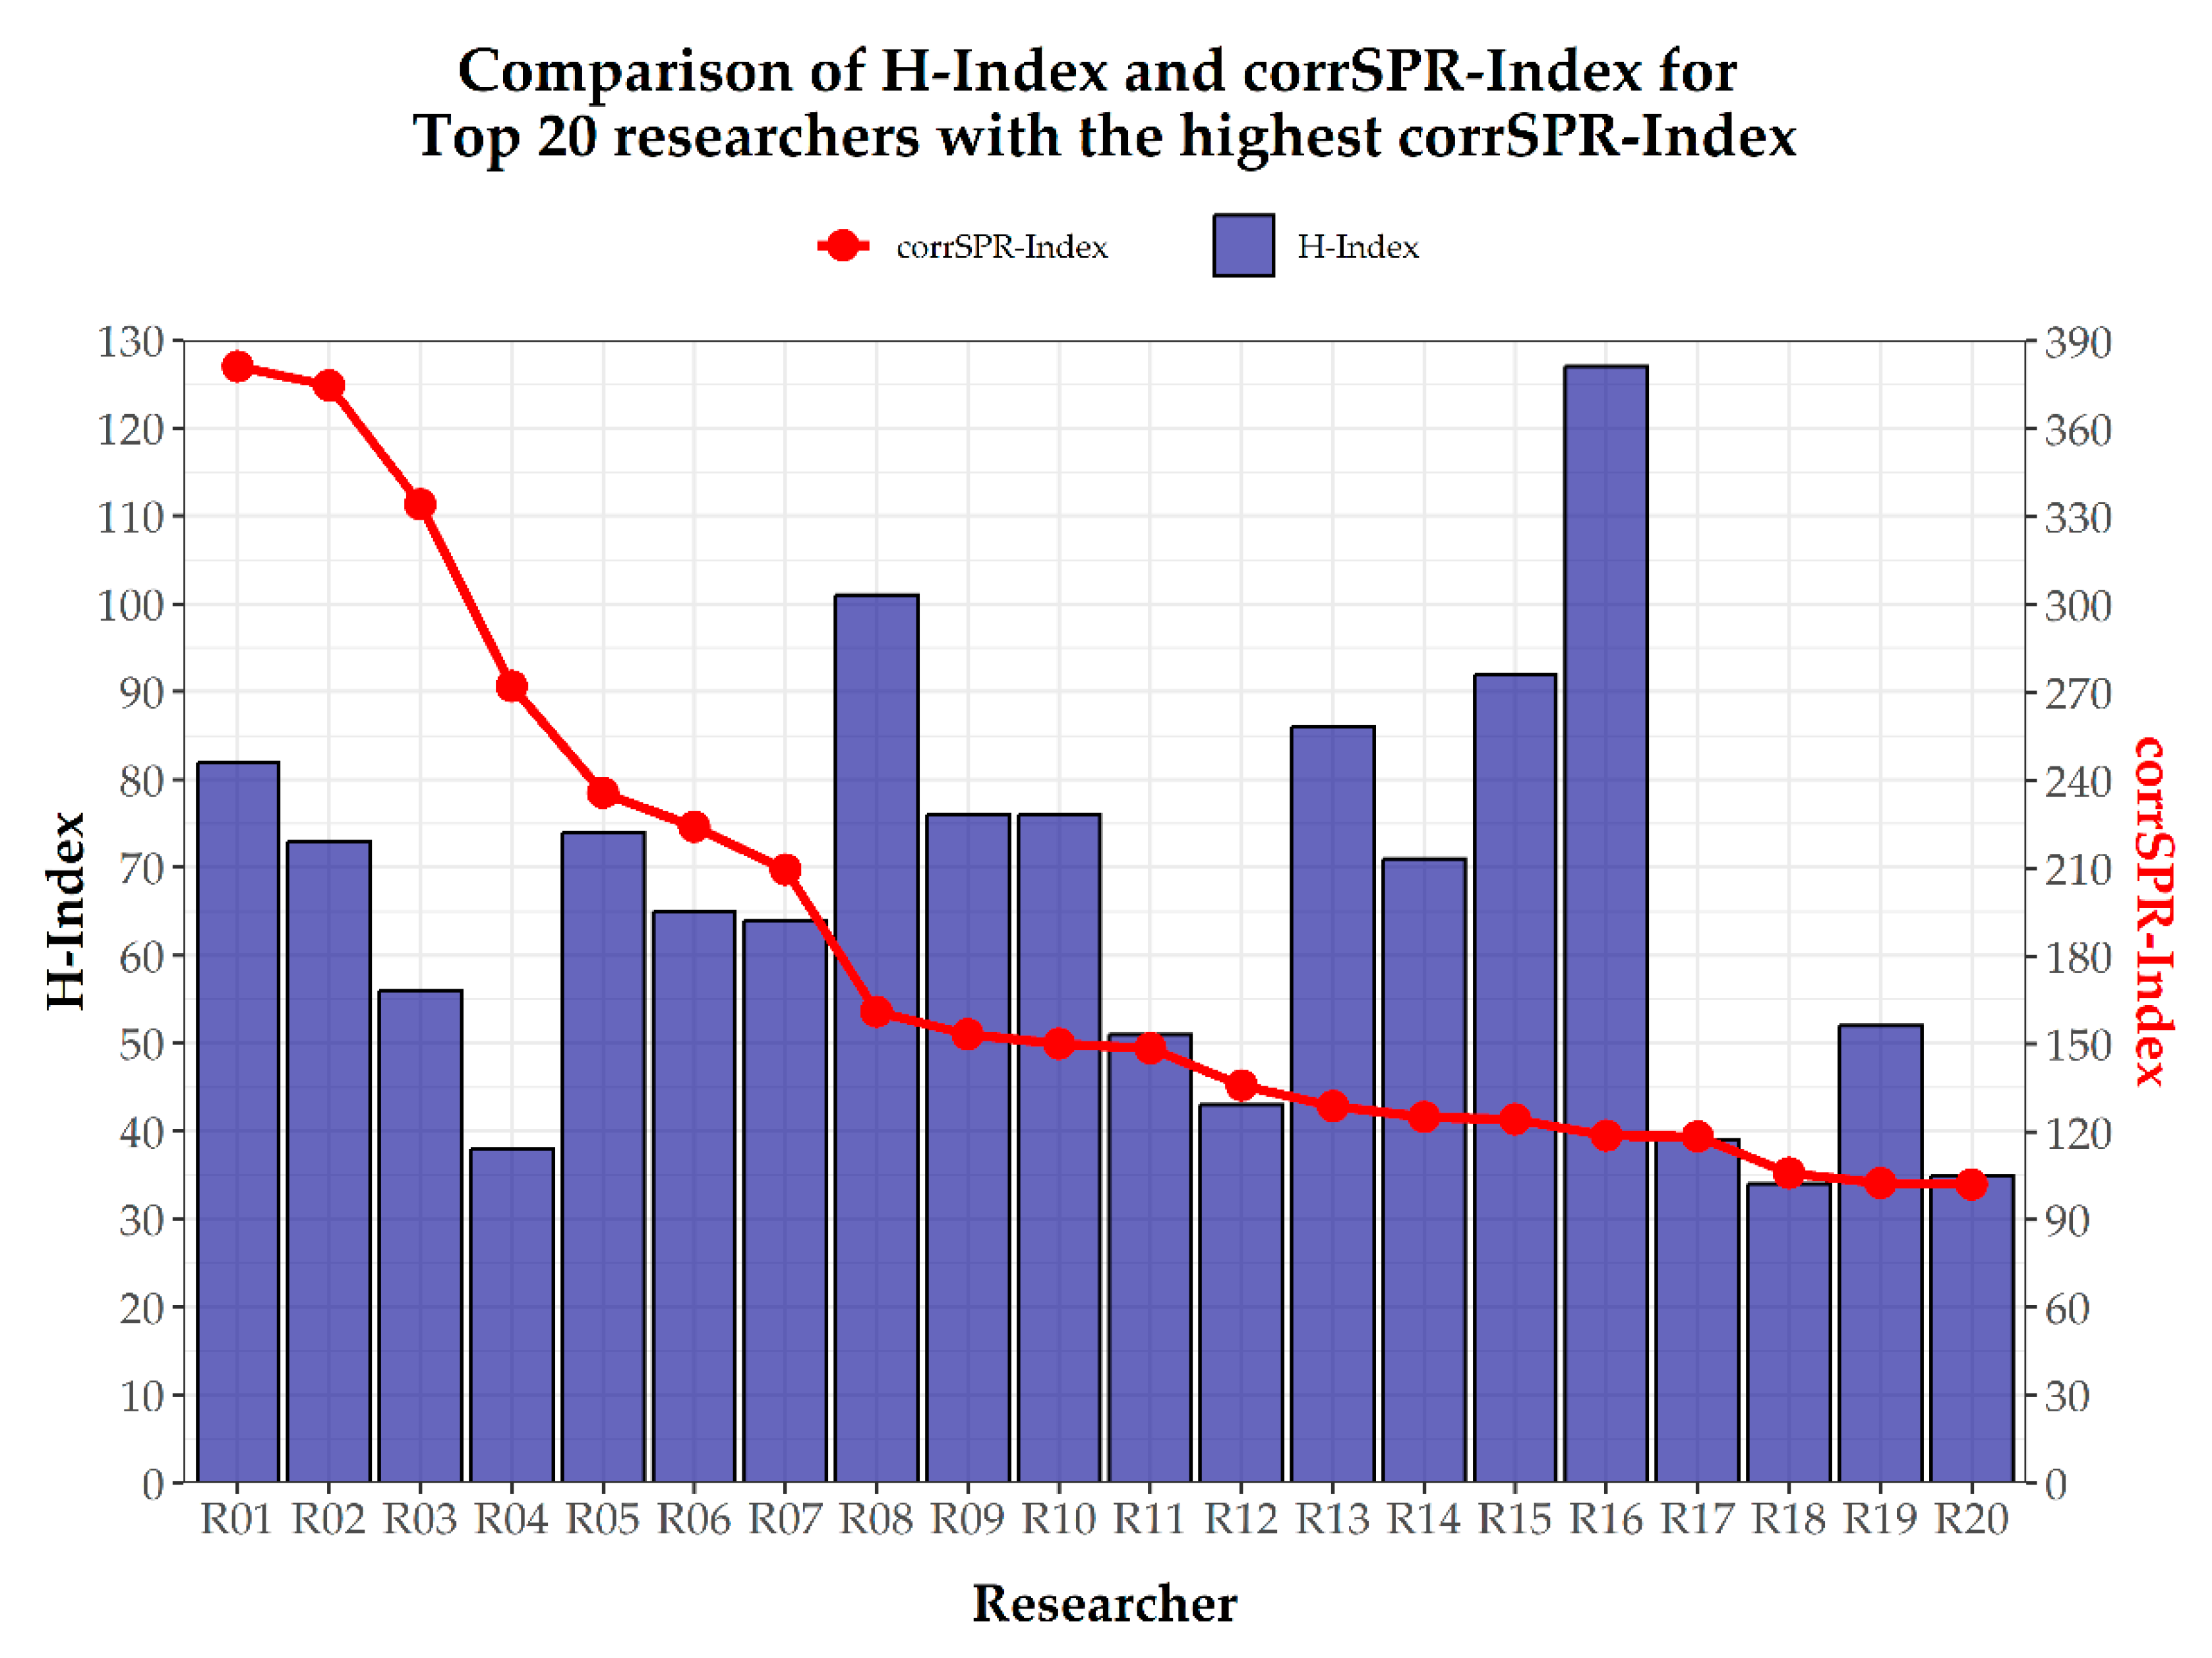
In contrast, Table 2 presents the top 20 researchers ranked by their corrSPR-index, which prioritizes the number of peer reviews conducted rather than solely reflecting citation impact, as measured by the H-index. Notably, none of the researchers from Table 1 appear in Table 2, indicating that the most frequently cited researchers do not necessarily contribute the most to peer review activities. Additionally, the corrSPR-index generally produces higher values than the H-index, emphasizing its effectiveness in recognizing researchers’ peer review contributions—an essential yet often underappreciated aspect of academic engagement (Figure 3). To provide a complementary perspective, we also present the data sorted by the H-index (Figure S1). This approach enables a direct comparison between conventional citation-based impact and peer review engagement, revealing notable discrepancies between the two metrics and reinforcing the distinctiveness of the corrSPR-index.
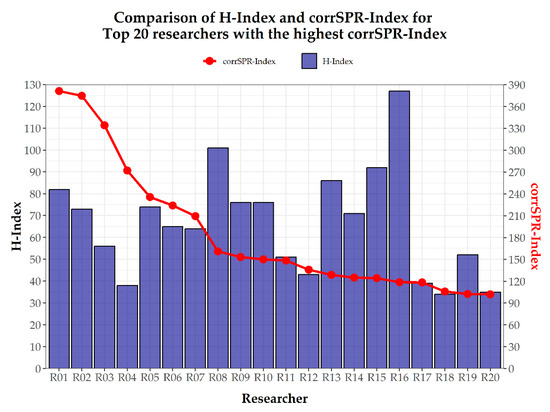
Figure 3.
A comparison of the H-index and corrSPR-index for the top 20 researchers. The figure compares the H-index (blue bars) and the corrSPR-index (red line and points) for a group of top researchers. The H-index reflects citation-based impact, while the corrSPR-index incorporates peer review contributions.
Prior to applying parametric methods, the distribution of the corrSPR-index and H-index was evaluated. The H-index exhibit no significant deviation from normality according to the Shapiro–Wilk test (W = 0.950, p = 0.367), the Jarque–Bera test (χ2 = 1.14, p = 0.566), and the Lilliefors test (D = 0.101, p = 0.853). In contrast, the corrSPR-index showed signs of non-normality based on the Shapiro–Wilk test (W = 0.813, p = 0.001) and the Lilliefors test (D = 0.256, p = 0.001), although the Jarque–Bera test did not reject the null hypothesis (χ2 = 4.23, p = 0.120), suggesting a mild departure from a normal distribution. These results were supported by a visual inspection of histograms and Q–Q plots (Figures S2 and S3), which indicated symmetry and normality for the H-index and moderate asymmetry and heavy tails for the corrSPR-index.
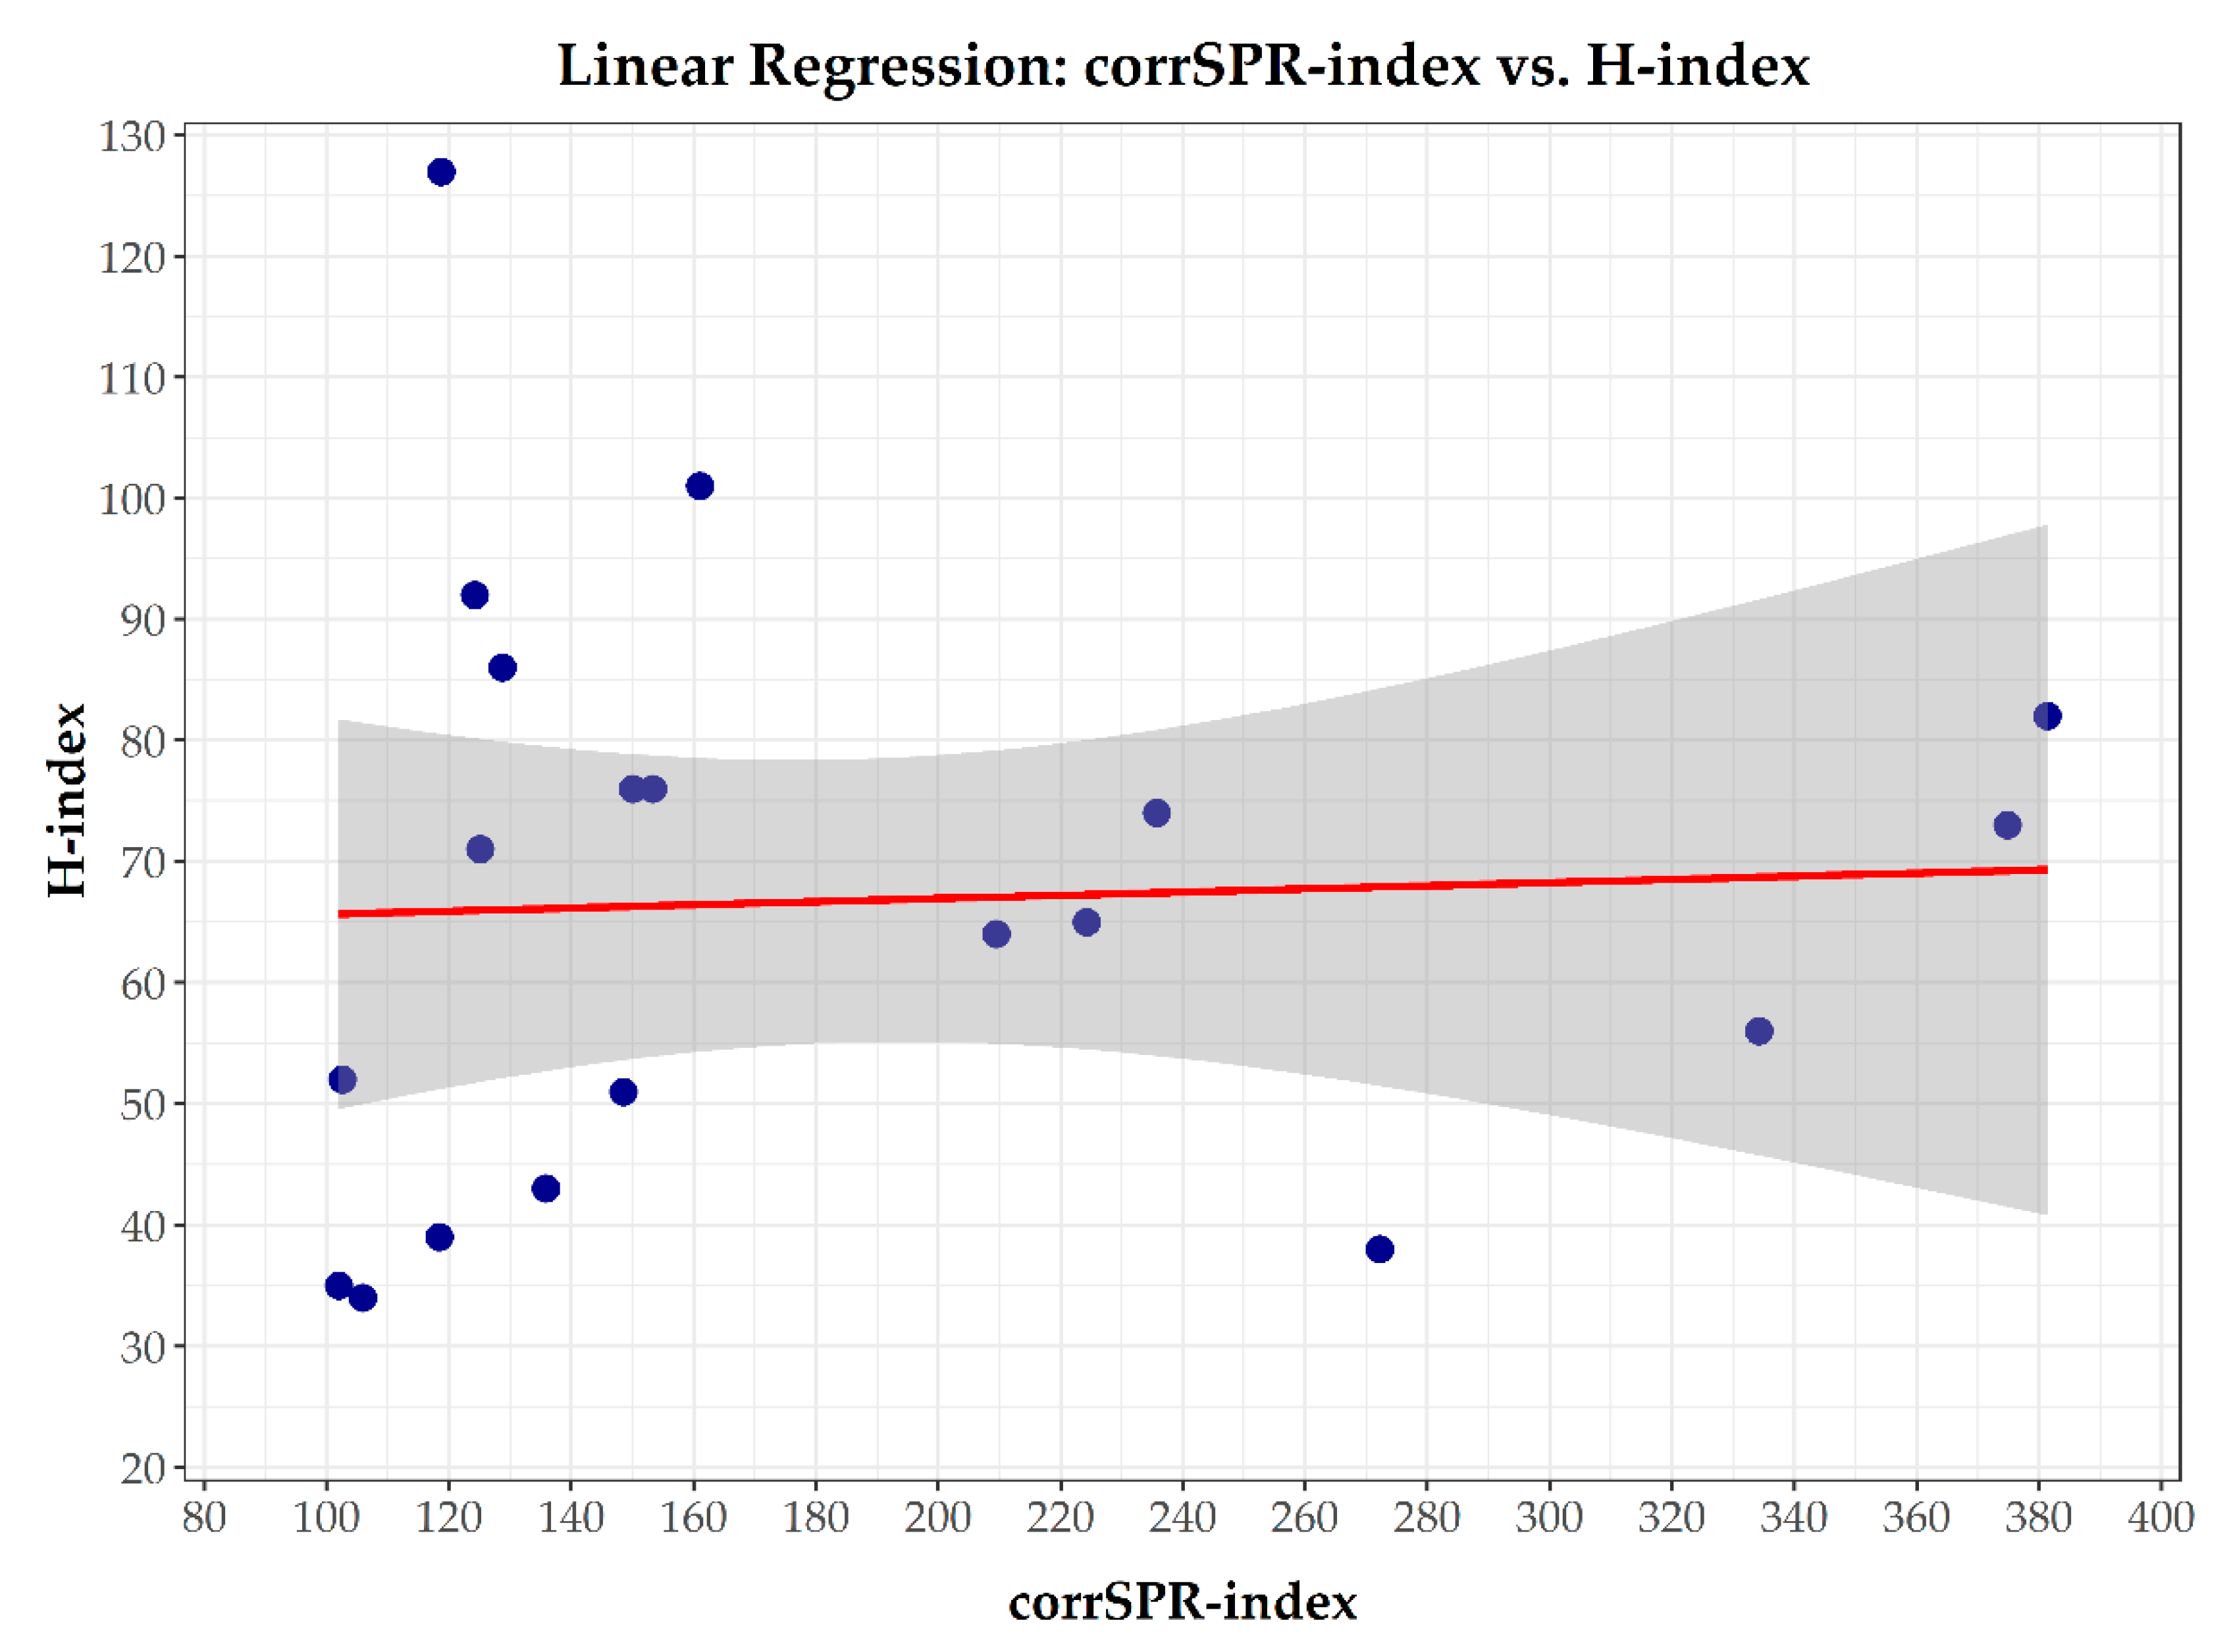
Based on these diagnostics, both parametric and non-parametric correlation methods were applied. Statistical analysis revealed no significant relationship between the corrSPR-index and the traditional H-index. Pearson’s correlation coefficient indicated a weak, non-significant association (r = 0.049, p = 0.838), while Spearman’s rank correlation coefficient suggested a slightly stronger but still non-significant association (ρ = 0.246, p = 0.296). These results suggest the relationship between the two indices is weak and neither clearly linear nor nonlinear. Linear regression analysis further supported these findings, showing very low explanatory power (R2 = 0.0024, p = 0.838; Figure 4). The resulting regression equation, H-index = 64.32 + 0.0131 × corrSPR-index, indicates that changes in the corrSPR-index do not significantly predict variations in the H-index.
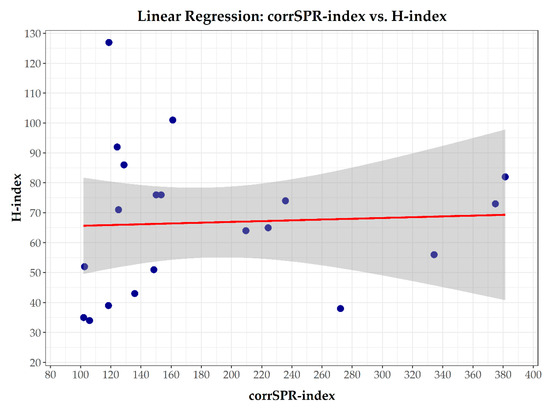
Figure 4.
A linear regression model assessing the relationship between the corrSPR-index and the H-index. Each dot represents an individual researcher. The red line represents the fitted regression line, while the shaded area denotes the 95% confidence interval.
The residuals from the linear regression model were tested for normality using the Shapiro–Wilk test (W = 0.9445, p = 0.291), which did not indicate significant deviation from a normal distribution. This result was supported by a visual inspection of the Q–Q plot and histogram of residuals (Figure S4), both of which showed no substantial deviations from normality. Together, these findings confirm that the distribution of residuals satisfies the normality assumption required for the application of linear regression.
K-means clustering analysis identified two distinct researcher profiles, with centroids located at (corrSPR-index = 146.96, H-index = 67.88) and (corrSPR-index = 340.65, H-index = 62.25), respectively (Figure 5). The silhouette coefficient of 0.647 indicates a well-defined clustering structure. These findings suggest two distinct researcher profiles: one group characterized by a high corrSPR-index but moderate H-index values and another group with an intermediate corrSPR-index and slightly higher H-index. This differentiation reinforces the idea that the corrSPR-index captures dimensions of academic contribution not reflected by traditional citation-based metrics like the H-index.
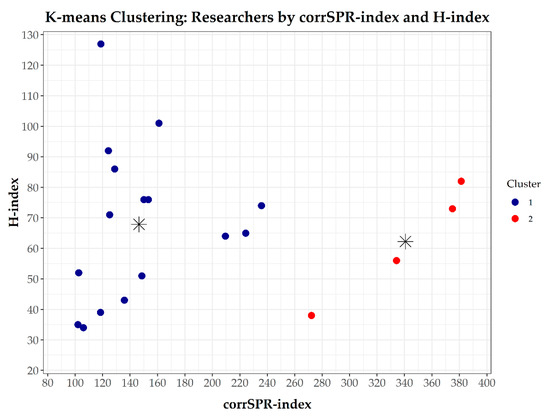
Figure 5.
A K-means clustering of researchers based on corrSPR-index and H-index. The scatter plot visualizes the results of the K-means clustering analysis, classifying researchers into two distinct groups based on their corrSPR-index and H-index values. Each point represents an individual researcher, color-coded according to cluster membership. The centroids of each cluster are indicated by an * symbol.
The principal component analysis revealed that the first two principal components accounted for a substantial proportion of the total variance—52.9% for the first component and 35.9% for the second, summing to 88.8% overall (Figure 6). This indicates that the majority of variation among the six metrics can be effectively captured within a two-dimensional space.
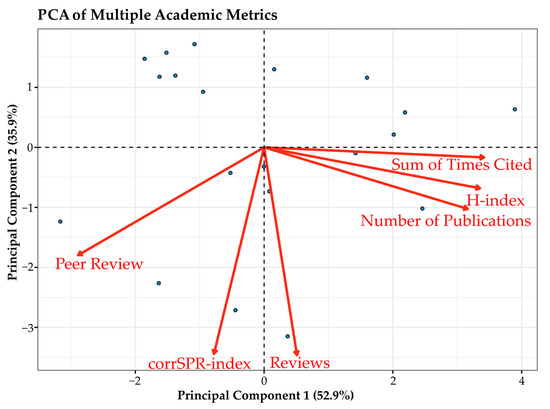
Figure 6.
A principal component analysis (PCA) biplot showing the distribution of researchers (points) and the loadings of six standardized variables (arrows): the H-index, corrSPR-index, number of publications, total citations, number of peer reviews, and composite peer review metric. Each dot represents an individual researcher. The arrows indicate the direction and magnitude of each variable’s contribution to the principal components.
The resulting biplot (Figure 6) showed a clear separation between variables associated with traditional bibliometric impact (the H-index, number of publications, and total citations) and those related to peer review activity (the corrSPR-index, number of reviews, and peer review metric). The loading vectors of the peer review variables were predominantly aligned with principal component 2, whereas publication- and citation-based metrics contributed more strongly to principal component 1. This divergence suggests that peer review engagement represents a distinct dimension of scholarly activity, not adequately captured by conventional citation-based metrics.
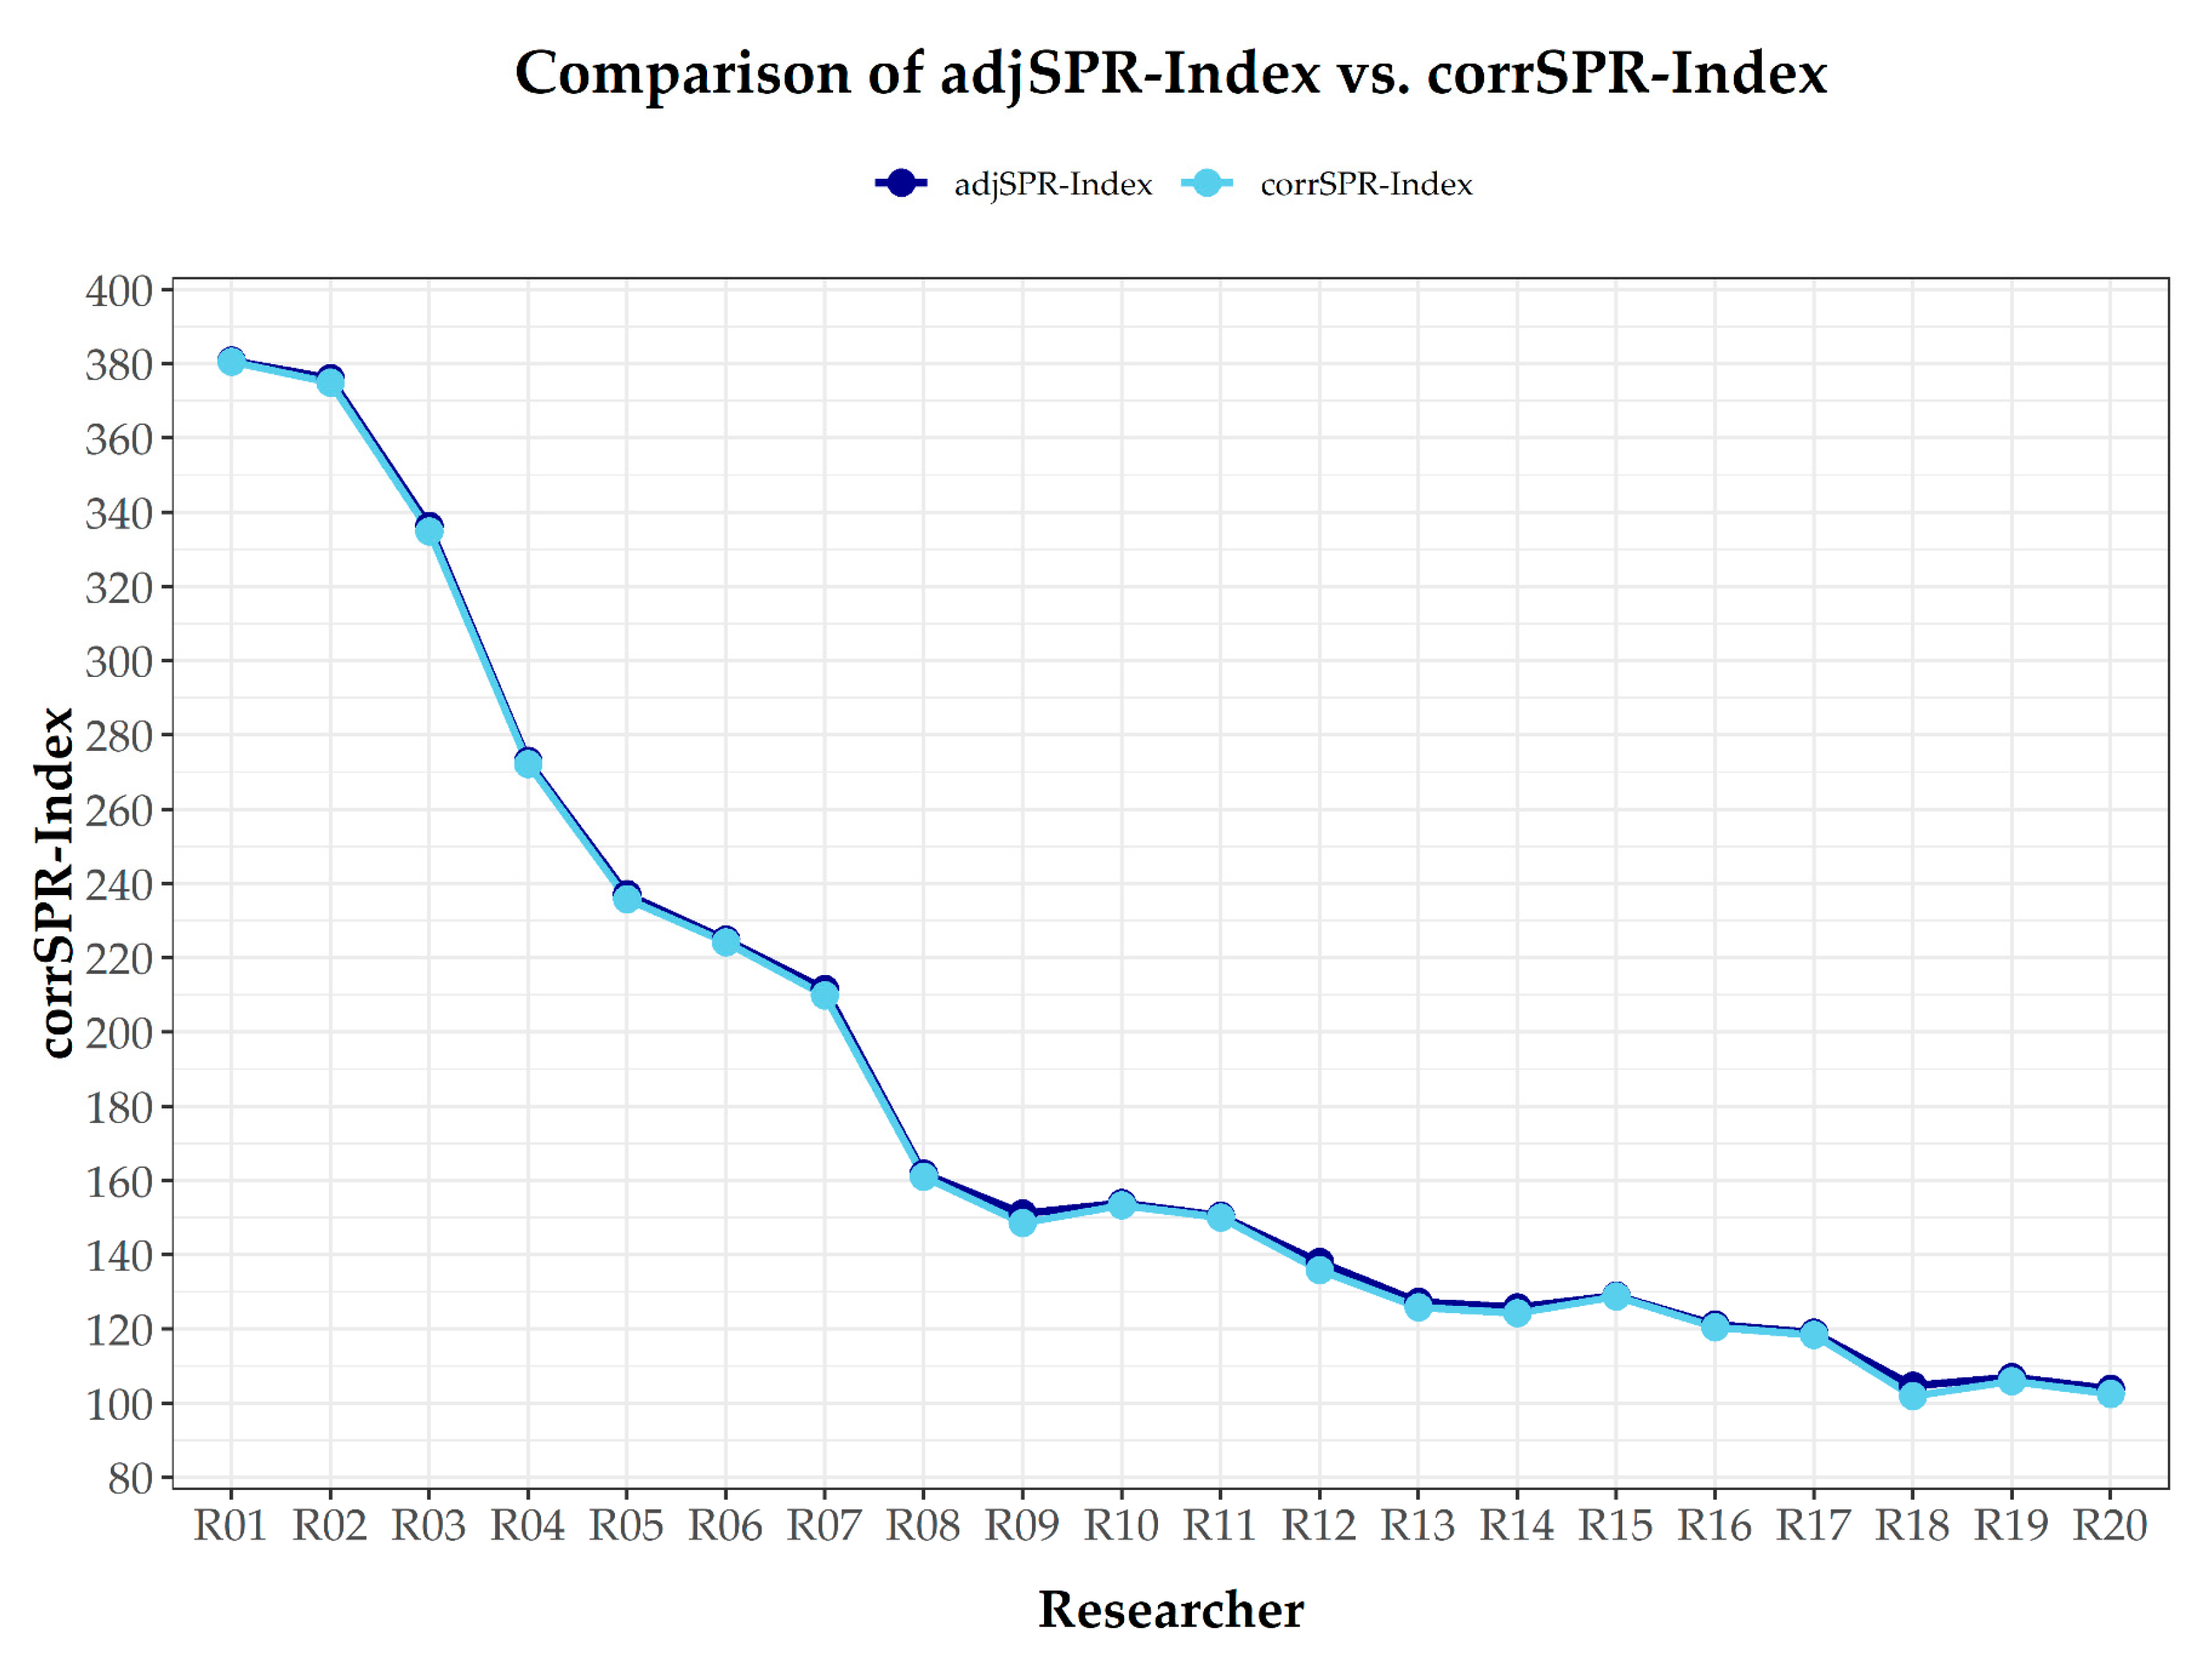
In Table 3, a second correction factor was introduced to further refine the corrSPR-index by incorporating the average length of peer reviews conducted by each researcher. This correction factor was calculated by comparing individual review word counts to the overall average derived from 9,566,437 reviews (Web of Science data). Reviewers who consistently produced shorter-than-average reviews received a slight penalty, whereas those who authored more detailed reviews either maintained or slightly improved their rankings. Despite this adjustment, the overall ranking remained largely unchanged compared to Table 2, suggesting that the corrSPR-index remains a stable and robust metric (Figure 7). This refinement also encourages researchers to provide more comprehensive and in-depth evaluations, ensuring that peer review contributions are not only frequent but also meaningful—enhancing the quality and rigor of academic discourse.
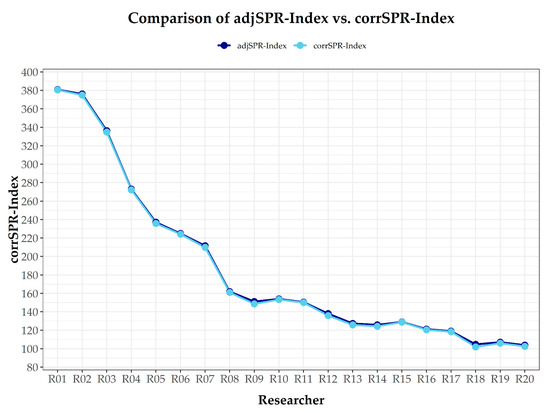
Figure 7.
A comparison of the adjSPR-index vs. the corrSPR-index. This figure compares the adjSPR-index (dark blue) and the corrSPR-index (sky blue) across different researchers. The adjSPR-index incorporates a correction factor accounting for the length of peer reviews, while the corrSPR-index reflects the unadjusted metric.
Table S2 presents a list of 19 researchers who, despite having an H-index of zero or at most eight, were classified as highly cited researchers. This discrepancy highlights a critical flaw in Clarivate’s data compilation and validation processes, suggesting a failure to accurately assess research impact. Equally concerning is the presence of highly cited researchers lacking a Web of Science profile (marked as ‘Claim Profile’ in Table S3), totaling 173 researchers (25.82%) out of the 670 surveyed in this study. These inconsistencies underscore potential limitations in Clarivate’s current methodology.
Additionally, we compared the corrSPR-index of 40 researchers with a mid-range H-index (15–25) (Table 4) to that of the top 40 most-cited researchers from the 690 surveyed (Table 1) to explore potential differences in research impact. Constructing Table 4 posed challenges, as 52.94% (45/85) of the mid-range H-index researchers with Web of Science profiles reviewed were labeled ‘Claim Profile,’ hindering data collection (Table S4). When comparing the researchers in Table 1 to those in Table 4, we found that, in both cases, few researchers actively engage in peer review work. However, for those who do participate in peer review, the corrSPR-index tends to yield higher values than the H-index, highlighting its ability to capture a different dimension of academic contribution.
4. Discussion
One of the primary limitations of the H-index, as highlighted in this study, is its heavy reliance on citation counts as a measure of research impact. Citation counts can be influenced by various factors, such as disciplinary citation practices, self-citations, and the age of publications, which may introduce biases and inaccuracies when comparing researchers across diverse fields (Hirsch, 2005; Waltman, 2016). Moreover, the H-index does not account for the quality or significance of publications, as it focuses solely on citation frequency. This limitation hinders its ability to capture other critical aspects of academic contributions, including researchers’ influence beyond academia, participation in collaborative projects, or engagement in peer review activities (Bornmann & Daniel, 2007; Moed, 2017). Additionally, citation patterns vary significantly across disciplines, with some fields naturally accumulating citations more rapidly than others. Consequently, the H-index may disadvantage researchers in disciplines with inherently lower citation rates, rendering it an incomplete metric for comprehensive academic evaluation (Ruiz-Castillo & Waltman, 2015).
The need for alternative metrics to address these shortcomings has spurred the development of indices such as the corrSPR-index, proposed in this study. The adjSPR-index aims to provide a more holistic assessment by incorporating not only the number of publications and citation frequency but also verified peer reviews and, potentially, the length of those reviews. These additional factors offer a broader perspective on researchers’ contributions, engagement, and depth of involvement in the scholarly community (Gingras, 2016; Wouters et al., 2019). While the H-index remains widely used, ongoing discussions and refinements of evaluation metrics are essential to ensure fair and comprehensive assessments of research impact. The adjSPR-index represents a step forward in this direction; however, further research and validation are required to establish it as a reliable and widely adopted metric (Kamrani et al., 2021).
The corrSPR-index has the potential to revolutionize science by recognizing researchers who actively contribute to peer review. When analyzing researchers with a high corrSPR-index, we observe that only a few contribute substantially. However, unlike the H-index, which does not account for peer review, the corrSPR-index appropriately rewards these contributions. Our analysis revealed no significant relationship between the corrSPR-index and the H-index. The weak and non-significant correlations, coupled with the low explanatory power of the regression model, indicate that the corrSPR-index does not directly predict variations in the H-index. However, the well-defined clustering structure suggests the presence of distinct researcher profiles, underscoring that the corrSPR-index captures a complementary aspect of scholarly impact, particularly in the context of peer review contributions. These findings reinforce the notion that the corrSPR-index represents a distinct dimension of academic performance that is not strongly associated with citation-based metrics such as the H-index, thereby emphasizing the need for alternative bibliometric indicators to assess broader aspects of scientific engagement.
Despite the potential advantages of the corrSPR-index, our analysis revealed significant inconsistencies in the Highly Cited Researchers list. Approximately 25% (173/690) of the profiles were marked as “Claim Profile,” indicating that these researchers do not actively manage or engage with their citation records. This percentage is even higher among those with a mid-range H-index (15–25), reaching 52.94% (45/85; Table S4), which imposes notable limitations on the model presented here. Additionally, we identified critical errors in the list, including incorrect researcher links, name mismatches, and the inclusion of individuals with only a single publication or an H-index of zero—who should not qualify for inclusion. These findings highlight major flaws in the database’s data curation process, underscoring the need for more rigorous verification and quality control (Ioannidis et al., 2014). Furthermore, these inaccuracies impose limitations on the corrSPR-index, as it relies on potentially flawed or imprecise data. Another challenge is the lack of a standardized word count for reviewer comments, complicating efforts to establish a meaningful baseline. Due to these limitations, the corresponding data could not be included in Table S1. These issues emphasize the urgent need for a more stringent approach to ensuring data accuracy and improving review processes, which may extend beyond the database used in this study. Addressing these concerns could enhance the reliability of researcher impact assessments (Tennant & Ross-Hellauer, 2020). These inconsistencies in researcher records not only highlight flaws in data management but also raise questions about the engagement of highly cited researchers in fundamental academic responsibilities, such as peer review.
Our results align with previous studies that challenge the reliance on single bibliometric measures to comprehensively evaluate scholarly impact. Khurana and Sharma (2022) argue that ranking methodologies based solely on the H-index may systematically undervalue the contributions of early-career and lower-ranked researchers, whose academic influence might not yet be fully reflected in citation-based metrics. They emphasize that alternative indices, such as modifications of the H-index, can better account for the early-stage impact of researchers, thereby promoting a more equitable ranking system within a discipline.
Furthermore, the well-defined clustering structure observed in our study reinforces the notion that academic performance is inherently multidimensional, shaped by factors beyond citation accumulation. Ameer and Afzal (2019) demonstrate that while both quantitative and qualitative bibliometric indices offer valuable insights, no single metric is sufficient for consistently identifying top-performing researchers, particularly in the neuroscience domain. Their analysis reveals that even the most effective indices, such as the hg-index and R-index, fail to rank at least 60% of award-winning researchers within the top 10% of their respective ranked lists. This limitation underscores the inherent challenges of relying on any single metric to comprehensively capture scholarly excellence, highlighting the need for a more integrative approach that considers diverse dimensions of academic contribution.
In line with this perspective, growing attention over the past decade has been directed toward the limitations of the H-index, leading to the proposal of more refined and robust bibliometric indicators. Among these, the success index introduced by Franceschini et al. (2012) stands out for its ability to normalize citation impact across scientific fields and its suitability for evaluating interdisciplinary or institutionally diverse publication sets. By using a reference sample rather than bibliographic references alone to estimate the propensity to cite, the success index avoids key statistical weaknesses and reduces the risk of metric manipulation. In a critical reassessment of the H-Index, Koltun and Hafner (2021) argued that it no longer provides a reliable proxy for scientific reputation. They highlighted its susceptibility to self-citation and promotion strategies, as well as its inability to differentiate between the quantity and quality of research output. Their large-scale analysis further demonstrated that emerging authorship patterns, such as hyperauthorship, have significantly contributed to the metric’s declining effectiveness. Similarly, Ding et al. (2020) reinforced that no single metric is universally reliable and emphasized the need for contextualized and multidimensional evaluation practices. They stressed that bibliometric indicators should be complemented by peer review and social impact assessments and that author influence must consider the diversity of citation sources, not just their frequency.
Taken together, these findings underscore the challenges of relying on a single metric to evaluate academic performance. They reaffirm the importance of adopting a more holistic and balanced approach that considers various dimensions of research influence—including contributions to peer review, interdisciplinary collaborations, and mentorship. By integrating these factors, academic assessment can become more equitable and provide a more comprehensive measure of scholarly impact.
Another concerning issue is that many highly cited researchers do not actively contribute to the peer review system. While they publish extensively and receive significant citations, they either abstain from peer review activities, do not claim their reviews, or fail to enable the option to display their review history in Clarivate. This lack of engagement raises concerns about the equitable distribution of responsibilities within the academic ecosystem. A select group benefits from high status, funding, recognition, and career advancement opportunities—including positions at leading global institutions—while contributing little to the system that upholds research integrity (Costas & van Leeuwen, 2012; Smith, 2006; Teixeira da Silva & Dobránszki, 2015).
The reluctance of researchers to review manuscripts submitted to scientific journals—particularly paid open-access journals—presents additional challenges for the peer review system. This trend inadvertently shifts the burden onto those who remain committed to reviewing, regardless of the journal type. The resulting imbalance in review workload not only affects the efficiency of the evaluation process but also raises concerns about potential biases in research assessment. Addressing this issue requires broader systemic changes; however, immediate efforts should focus on alleviating the burden on dedicated reviewers and ensuring the sustainability of the peer review system during this transitional period (Ross-Hellauer, 2017; Tennant et al., 2017).
As proposed in this study, the corrSPR-index could incentivize researchers to acknowledge and value peer review efforts by actively recording and claiming their reviews. Moreover, this highlights the need for Clarivate to implement stricter data collection and verification measures before publishing such a prestigious list. By explicitly recognizing and quantifying peer review efforts, the corrSPR-index provides a valuable tool for fostering a more sustainable peer review system, ensuring that essential academic contributions receive the acknowledgment they deserve. Ensuring that peer review contributions are transparently documented and integrated into researcher evaluations is critical for fostering a fairer and more sustainable academic system (Bornmann, 2011; Haustein & Larivière, 2015).
5. Conclusions
The corrSPR-index, introduced as an enhancement to the H-index, offers a more comprehensive framework for researcher evaluation by integrating normalized publication impact with their verified peer review contributions. By incorporating review length, the adjSPR-index acknowledges both the depth of engagement and the intellectual effort invested in the review process, addressing a critical gap in traditional bibliometric indices. While this metric represents a step toward a more holistic assessment of research impact, its widespread adoption requires further validation through empirical studies, cross-disciplinary testing, and the refinement of data collection methodologies. Additionally, addressing inconsistencies in citation databases and standardizing peer review documentation will be essential to ensuring the corrSPR-index’s reliability and effectiveness in academic evaluations. However, for those who do participate in peer review, the corrSPR-index tends to yield higher values than the H-index, highlighting its ability to capture a different dimension of academic contribution.
Supplementary Materials
The following supporting information can be downloaded at: https://www.mdpi.com/article/10.3390/publications13020022/s1, Figure S1. Comparison of corrSPR-index (bars) and H-index (line) for 20 researchers; Figure S2. A histogram and Q–Q plot illustrating the distribution of H-index values; Figure S3. A histogram and Q–Q plot showing the distribution of the corrSPR-index; Figure S4. A histogram and Q–Q plot of the residuals from the linear regression model; Table S1: Highly cited researchers from Web of Science; Table S2: Data compilation errors in Web of Science among 690 highly cited researchers; Table S3: list of highly cited researchers without a profile on Web of Science (Displayed as “Claim Profile”); Table S4: The availability of Web of Science profiles for researchers with a mid-range H-index (15–25).
Author Contributions
Conceptualization: U.J.B.d.S., B.J.M.C. and F.S.C.; methodology: U.J.B.d.S., B.J.M.C., E.E.G. and F.R.S.; software: U.J.B.d.S., B.J.M.C. and F.S.C.; validation: U.J.B.d.S., B.J.M.C., E.E.G. and F.S.C.; formal analysis: U.J.B.d.S., B.J.M.C., F.S.C. and F.R.S.; investigation: U.J.B.d.S., B.J.M.C., E.E.G., F.R.S. and F.S.C.; resources: F.S.C. and F.R.S.; data curation: U.J.B.d.S., B.J.M.C. and F.S.C.; writing—original draft preparation: U.J.B.d.S., B.J.M.C. and F.S.C.; writing—review and editing: U.J.B.d.S., B.J.M.C., E.E.G., F.R.S. and F.S.C.; visualization: U.J.B.d.S., B.J.M.C. and F.S.C.; supervision: F.S.C. and F.R.S.; project administration: U.J.B.d.S., B.J.M.C. and F.S.C.; funding acquisition: F.S.C. All authors have read and agreed to the published version of the manuscript.
Funding
This research received no external funding.
Data Availability Statement
The original contributions presented in this study are included in the article. Further inquiries can be directed to the corresponding author.
Acknowledgments
We would like to express our gratitude to our students and colleagues whose insightful discussions and inquiries have inspired this study. Their engagement has reinforced the importance of recognizing peer review as a fundamental component of academic contributions. We hope this work will be useful to researchers, particularly early-career scholars, by providing a more comprehensive framework for assessing scholarly impact. Additionally, we acknowledge the support of our respective institutions in fostering an environment conducive to scientific inquiry. FRS and FSC are fellows of the Brazilian National Research Council (CNPq).
Conflicts of Interest
The authors declare no conflicts of interest.
Abbreviations
The following abbreviations are used in this manuscript:
| SPR-index | Scientific Peer Review Index |
| H-index | Hirsch index |
| IF | Impact factor |
| NP | Number of publications |
References
- Adler, R., Ewing, J., & Taylor, P. (2009). Citation statistics. Statistical Science, 24, 1–14. [Google Scholar] [CrossRef]
- Ameer, M., & Afzal, M. T. (2019). Evaluation of h-index and its qualitative and quantitative variants in Neuroscience. Scientometrics, 121(2), 653–673. [Google Scholar] [CrossRef]
- Bornmann, L. (2011). Scientific peer review. Annual Review of Information Science and Technology, 45, 197–245. [Google Scholar] [CrossRef]
- Bornmann, L., & Daniel, H. D. (2007). What do we know about the h index? Journal of the American Society for Information Science and Technology, 58, 1381–1385. [Google Scholar] [CrossRef]
- Bornmann, L., & Daniel, H. D. (2009). The state of h-index research. EMBO Reports, 10, 2–6. [Google Scholar] [CrossRef]
- Chigbu, U. E., Atiku, S. O., & Du Plessis, C. C. (2023). The science of literature reviews: Searching, identifying, selecting, and synthesising. Publications, 11, 2. [Google Scholar] [CrossRef]
- Cochran, W. G. (1977). Sampling techniques (3rd ed.). John Wiley & Sons. [Google Scholar]
- Costas, R., & van Leeuwen, T. N. (2012). Approaching the “reward triangle”: General analysis of the presence of funding acknowledgments and “peer interactive communication” in scientific publications. Journal of the American Society for Information Science and Technology, 63, 1647–1658. [Google Scholar] [CrossRef]
- Ding, J., Liu, C., & Kandonga, G. A. (2020). Exploring the limitations of the h index and h type indexes in measuring the research performance of authors. Scientometrics, 122, 1303–1322. [Google Scholar] [CrossRef]
- Egghe, L. (2006). Theory and practice of the g-index. Scientometrics, 69, 131–152. [Google Scholar] [CrossRef]
- El-Guebaly, N., Foster, J., Bahji, A., & Hellman, M. (2023). The critical role of peer reviewers: Challenges and future steps. Nordisk Alkohol Narkotikatidskrift, 40, 14–21. [Google Scholar] [CrossRef]
- Franceschini, F., Galetto, M., Maisano, D. A., & Mastrogiacomo, L. (2012). The success-index: An alternative approach to the h-index for evaluating an individual’s research output. Scientometrics, 92(3), 621–641. [Google Scholar] [CrossRef]
- Gingras, Y. (2016). Bibliometrics and research evaluation: Uses and abuses. MIT Press. [Google Scholar] [CrossRef]
- Glänzel, W. (2006). On the h-index—A mathematical approach to a new measure of publication activity and citation impact. Scientometrics, 67, 315–321. [Google Scholar] [CrossRef]
- Haustein, S., & Larivière, V. (2015). The use of bibliometrics for assessing research: Possibilities, limitations and adverse effects. In I. M. Welpe, J. Wollersheim, S. Ringelhan, & M. Osterloh (Eds.), Incentives and performance: Governance of knowledge-intensive organizations (pp. 121–139). Springer International Publishing. [Google Scholar]
- Hirsch, J. E. (2005). An index to quantify an individual’s scientific research output. Proceedings of the National Academy of Sciences, 102, 16569–16572. [Google Scholar] [CrossRef] [PubMed]
- Ioannidis, J. P., Boyack, K. W., & Klavans, R. (2014). Estimates of the continuously publishing core in the scientific workforce. PLoS ONE, 9, e101698. [Google Scholar] [CrossRef]
- Kamrani, P., Dorsch, I., & Stock, W. G. (2021). Do researchers know what the h-index is? And how do they estimate its importance? Scientometrics, 126, 5489–5508. [Google Scholar] [CrossRef]
- Khurana, P., & Sharma, K. (2022). Impact of h-index on author’s rankings: An improvement to the h-index for lower-ranked authors. Scientometrics, 127(8), 4483–4498. [Google Scholar] [CrossRef]
- Koltun, V., & Hafner, D. (2021). The h-index is no longer an effective correlate of scientific reputation. PLoS ONE, 16, e0253397. [Google Scholar] [CrossRef]
- Moed, H. F. (2017). Citation analysis in research evaluation. Springer. [Google Scholar] [CrossRef]
- Nguyen, L. T., & Tuamsuk, K. (2024). Unveiling scientific integrity in scholarly publications: A bibliometric approach. International Journal of Educational Integrity, 20, 16. [Google Scholar] [CrossRef]
- Perneger, T. (2023). Authorship and citation patterns of highly cited biomedical researchers: A cross-sectional study. Research Integrity and Peer Review, 8, 13. [Google Scholar] [CrossRef]
- Qiao, L., Zhao, S. X., Ji, Y., & Li, W. (2025). A measure and the related models for characterizing the usage of academic journal. Journal of Informetrics, 19, 101643. [Google Scholar] [CrossRef]
- R Core Team. (2024). R: A language and environment for statistical computing. R Foundation for Statistical Computing, Vienna, Austria. Available online: https://www.R-project.org/ (accessed on 20 March 2025).
- Ross-Hellauer, T. (2017). What is open peer review? A systematic review. F1000Research, 6, 588. [Google Scholar] [CrossRef]
- Ruiz-Castillo, J., & Waltman, L. (2015). Field-normalized citation impact indicators using algorithmically constructed classification systems of science. Journal of Informetrics, 9, 102–117. [Google Scholar] [CrossRef]
- Schubert, A., & Glänzel, W. (2007). A systematic analysis of Hirsch-type indices for journals. Journal of Informetrics, 1, 179–184. [Google Scholar] [CrossRef]
- Smith, R. (2006). Peer review: A flawed process at the heart of science and journals. Journal of the Royal Society of Medicine, 99, 178–182. [Google Scholar] [CrossRef]
- Teixeira da Silva, J. A., & Dobránszki, J. (2015). Problems with traditional science publishing and finding a wider niche for post-publication peer review. Accountability in Research, 22, 22–40. [Google Scholar] [CrossRef] [PubMed]
- Teixeira da Silva, J. A., & Nazarovets, S. (2022). The role of Publons in the context of open peer review. Publishing Research Quarterly, 38, 760–781. [Google Scholar] [CrossRef]
- Tennant, J. P. (2018). The state of the art in peer review. FEMS Microbiology Letters, 365, fny204. [Google Scholar] [CrossRef]
- Tennant, J. P., Dugan, J. M., Graziotin, D., Jacques, D. C., Waldner, F., Mietchen, D., Elkhatib, Y., Collister, B. L., Pikas, C. K., Crick, T., Masuzzo, P., Caravaggi, A., Berg, D. R., Niemeyer, K. E., Ross-Hellauer, T., Mannheimer, S., Rigling, L., Katz, D. S., Greshake Tzovaras, B., … Colomb, J. (2017). A multi-disciplinary perspective on emergent and future innovations in peer review. F1000Research, 6, 1151. [Google Scholar] [CrossRef]
- Tennant, J. P., & Ross-Hellauer, T. (2020). The limitations to our understanding of peer review. Research Integrity and Peer Review, 5, 6. [Google Scholar] [CrossRef]
- Tennant, J. P., Waldner, F., Jacques, D. C., Masuzzo, P., Collister, L. B., & Hartgerink, C. H. (2016). The academic, economic and societal impacts of open access: An evidence-based review. F1000Research, 5, 632. [Google Scholar] [CrossRef]
- Waltman, L. (2016). A review of the literature on citation impact indicators. Journal of Informetrics, 10, 365–391. [Google Scholar] [CrossRef]
- Waltman, L., & van Eck, N. J. (2015). Field-normalized citation impact indicators and the choice of an appropriate counting method. Journal of Informetrics, 9, 872–894. [Google Scholar] [CrossRef]
- Wickham, H. (2016). ggplot2: Elegant graphics for data analysis. Springer-Verlag New York. ISBN 978-3-319-24277-4. Available online: https://ggplot2.tidyverse.org (accessed on 20 March 2025).
- Wouters, P., Sugimoto, C. R., Larivière, V., McVeigh, M. E., Pulverer, B., de Rijcke, S., & Waltman, L. (2019). Rethinking impact factors: Better ways to judge a journal. Nature, 569, 621–623. [Google Scholar] [CrossRef] [PubMed]
- Yan, X., Zhai, L., & Fan, W. (2012). C-index: A weighted network node centrality measure for collaboration competence. Journal of Informetrics, 6, 603–612. [Google Scholar] [CrossRef]
- Zhao, S. X., Rousseau, R., & Ye, F. Y. (2011). h-degree as a basic measure in weighted networks. Journal of Informetrics, 5, 668–677. [Google Scholar] [CrossRef]
Disclaimer/Publisher’s Note: The statements, opinions and data contained in all publications are solely those of the individual author(s) and contributor(s) and not of MDPI and/or the editor(s). MDPI and/or the editor(s) disclaim responsibility for any injury to people or property resulting from any ideas, methods, instructions or products referred to in the content. |
© 2025 by the authors. Licensee MDPI, Basel, Switzerland. This article is an open access article distributed under the terms and conditions of the Creative Commons Attribution (CC BY) license (https://creativecommons.org/licenses/by/4.0/).

