Abstract
The Global Quality Score (GQS) is one of the most frequently used tools to evaluate the content quality of online health information. To the author’s knowledge, it is frequently misnamed as the Global Quality Scale, and occasionally secondary sources are cited as the original source of the tool. This work aimed to reveal the current situation especially regarding the citations among published studies. Web of Science, Scopus, and PubMed were queried to identify papers that mentioned the use of the GQS. Among a total of 411 analyzed papers, 45.0% misnamed it as Global Quality Scale, and 46.5% did not cite the primary source published in 2007 to credit it as the original source. Another 80 references were also cited from time to time as the source of the GQS, led by a secondary source published in 2012. There was a decreasing trend in citing the primary source when using the GQS. Among the 12 papers that claimed that the GQS was validated, half of them cited the primary source to justify the claim, but in fact the original publication did not mention anything about its validation. To conclude, future studies should name and cite the GQS properly to minimize confusion.
1. Introduction
The Global Quality Score was introduced by Bernard et al. back in 2007, in a “systematic review” of 34 websites that contained information for patients with inflammatory bowel disease (IBD) (Bernard et al., 2007). In that paper, Bernard et al. evaluated the websites with multiple instruments, one of which was called the Global Quality Score (GQS), which was a “five-point Likert scale developed for this study” aimed to assess the general information quality, flow, ease of use; hence, the usefulness of the website to patients. Score 1 meant poor quality and not at all useful for patients, whereas score 5 meant excellent quality and very useful for patients. The validity of the GQS was not explicitly mentioned. The other instruments were the Quality Evaluation Instrument, readability assessment tools (Jindal & MacDermid, 2017) of the Flesch Reading Ease score and Flesch–Kincaid Grade Level score, and the Integrity Score. Since these instruments were not relevant to the current study, they would not be further elaborated here.
The GQS has been frequently utilized by subsequent studies as a tool to evaluate the quality of online patient information materials. A recent systematic review identified GQS as the second most commonly used method for assessing online content quality (Osman et al., 2022), ranking only behind customized assessment scales specific to each study, but ahead of established tools such as DISCERN (Charnock et al., 1999) and the JAMA benchmark (Silberg et al., 1997). This finding might be surprising, as the original papers that introduced DISCERN and the JAMA benchmark were dedicated to explaining the rationale and design of these tools (Charnock et al., 1999; Silberg et al., 1997). In contrast, the GQS was first introduced and used in a paper focused on evaluating IBD websites, making the GQS itself a “by-product” of the publication. Terminological precision is vital in health informatics to ensure research clarity and methodological rigor. Inaccurate usage, such as the use of “tortured phrases” (e.g., referring to Alzheimer’s disease as Alzheimer’s malady), creates confusion (Teixeira da Silva, 2022). Similarly, diverse quality assessment tools in systematic reviews highlight the need for clear tool identification (Gebrye et al., 2023). Despite the widespread use of the GQS, no study has systematically examined its misnaming or mis-citation, a gap this work addresses to promote reliable online health information evaluation.
In the field of ecology, it was found that 15% of citations unfairly gave credit to review papers instead of the original studies (Teixeira et al., 2013). Some researchers refer to this practice of improper attribution as “lazy author syndrome” (Gavras, 2002) or citing an “empty reference” (Harzing, 2002). This mis-citation behavior matters as it distorts the academic record by undervaluing the contributions of original researchers, and potentially affecting their career advancement through reduced recognition in terms of citations. It also compromises scientific rigor, as the reliance on secondary sources may overlook critical details from the methodology or results interpretations and perpetuate inaccuracies. Therefore, ensuring proper attribution through accurate citations is essential for maintaining the quality of scientific research.
Before writing this report, the author observed improper citations for using the GQS that resembled the abovementioned examples. Moreover, the GQS was often described as the Global Quality Scale (instead of Score) and sometimes referred to as a “validated” tool, both of which were inaccurate. The term “Global Quality Score” refers to the specific metric developed by Bernard et al. (2007) to evaluate the quality of online health information based on defined criteria. Misnaming it as the “Global Quality Scale” implies a different measurement construct, potentially leading to confusion in its application and interpretation, which could affect the consistency and reliability of research findings. By naming it a scale, readers may assume it operates on a continuous rather than a discrete scoring system. Hence, this work aimed to survey the literature on the use of the GQS to assess the accuracy of the citations and descriptions of the tool. By examining the GQS as a case study, this work highlights systemic issues in the citation and naming of research tools, offering insights that can inform best practices for other indicators in health informatics and beyond. Such analyses are beneficial for ensuring methodological rigor and fostering trust in research outputs.
2. Materials and Methods
On 23 November 2023, the following literature searches were performed:
- (1)
- Web of Science Core Collection was queried with the following search string: Topic = “global quality scale*” OR “global quality score*”. Document type was limited to article, and publication language was limited to English. This search yielded 387 publications.
- (2)
- Scopus was queried with the following search string: TITLE-ABS-KEY = (“global quality scale*” OR “global quality score*”). Document type and language filters were similarly applied. This search yielded 391 publications.
- (3)
- PubMed was queried with the following search string for all indexed fields: “global quality scale*” OR “global quality score*”. This search yielded 403 publications.
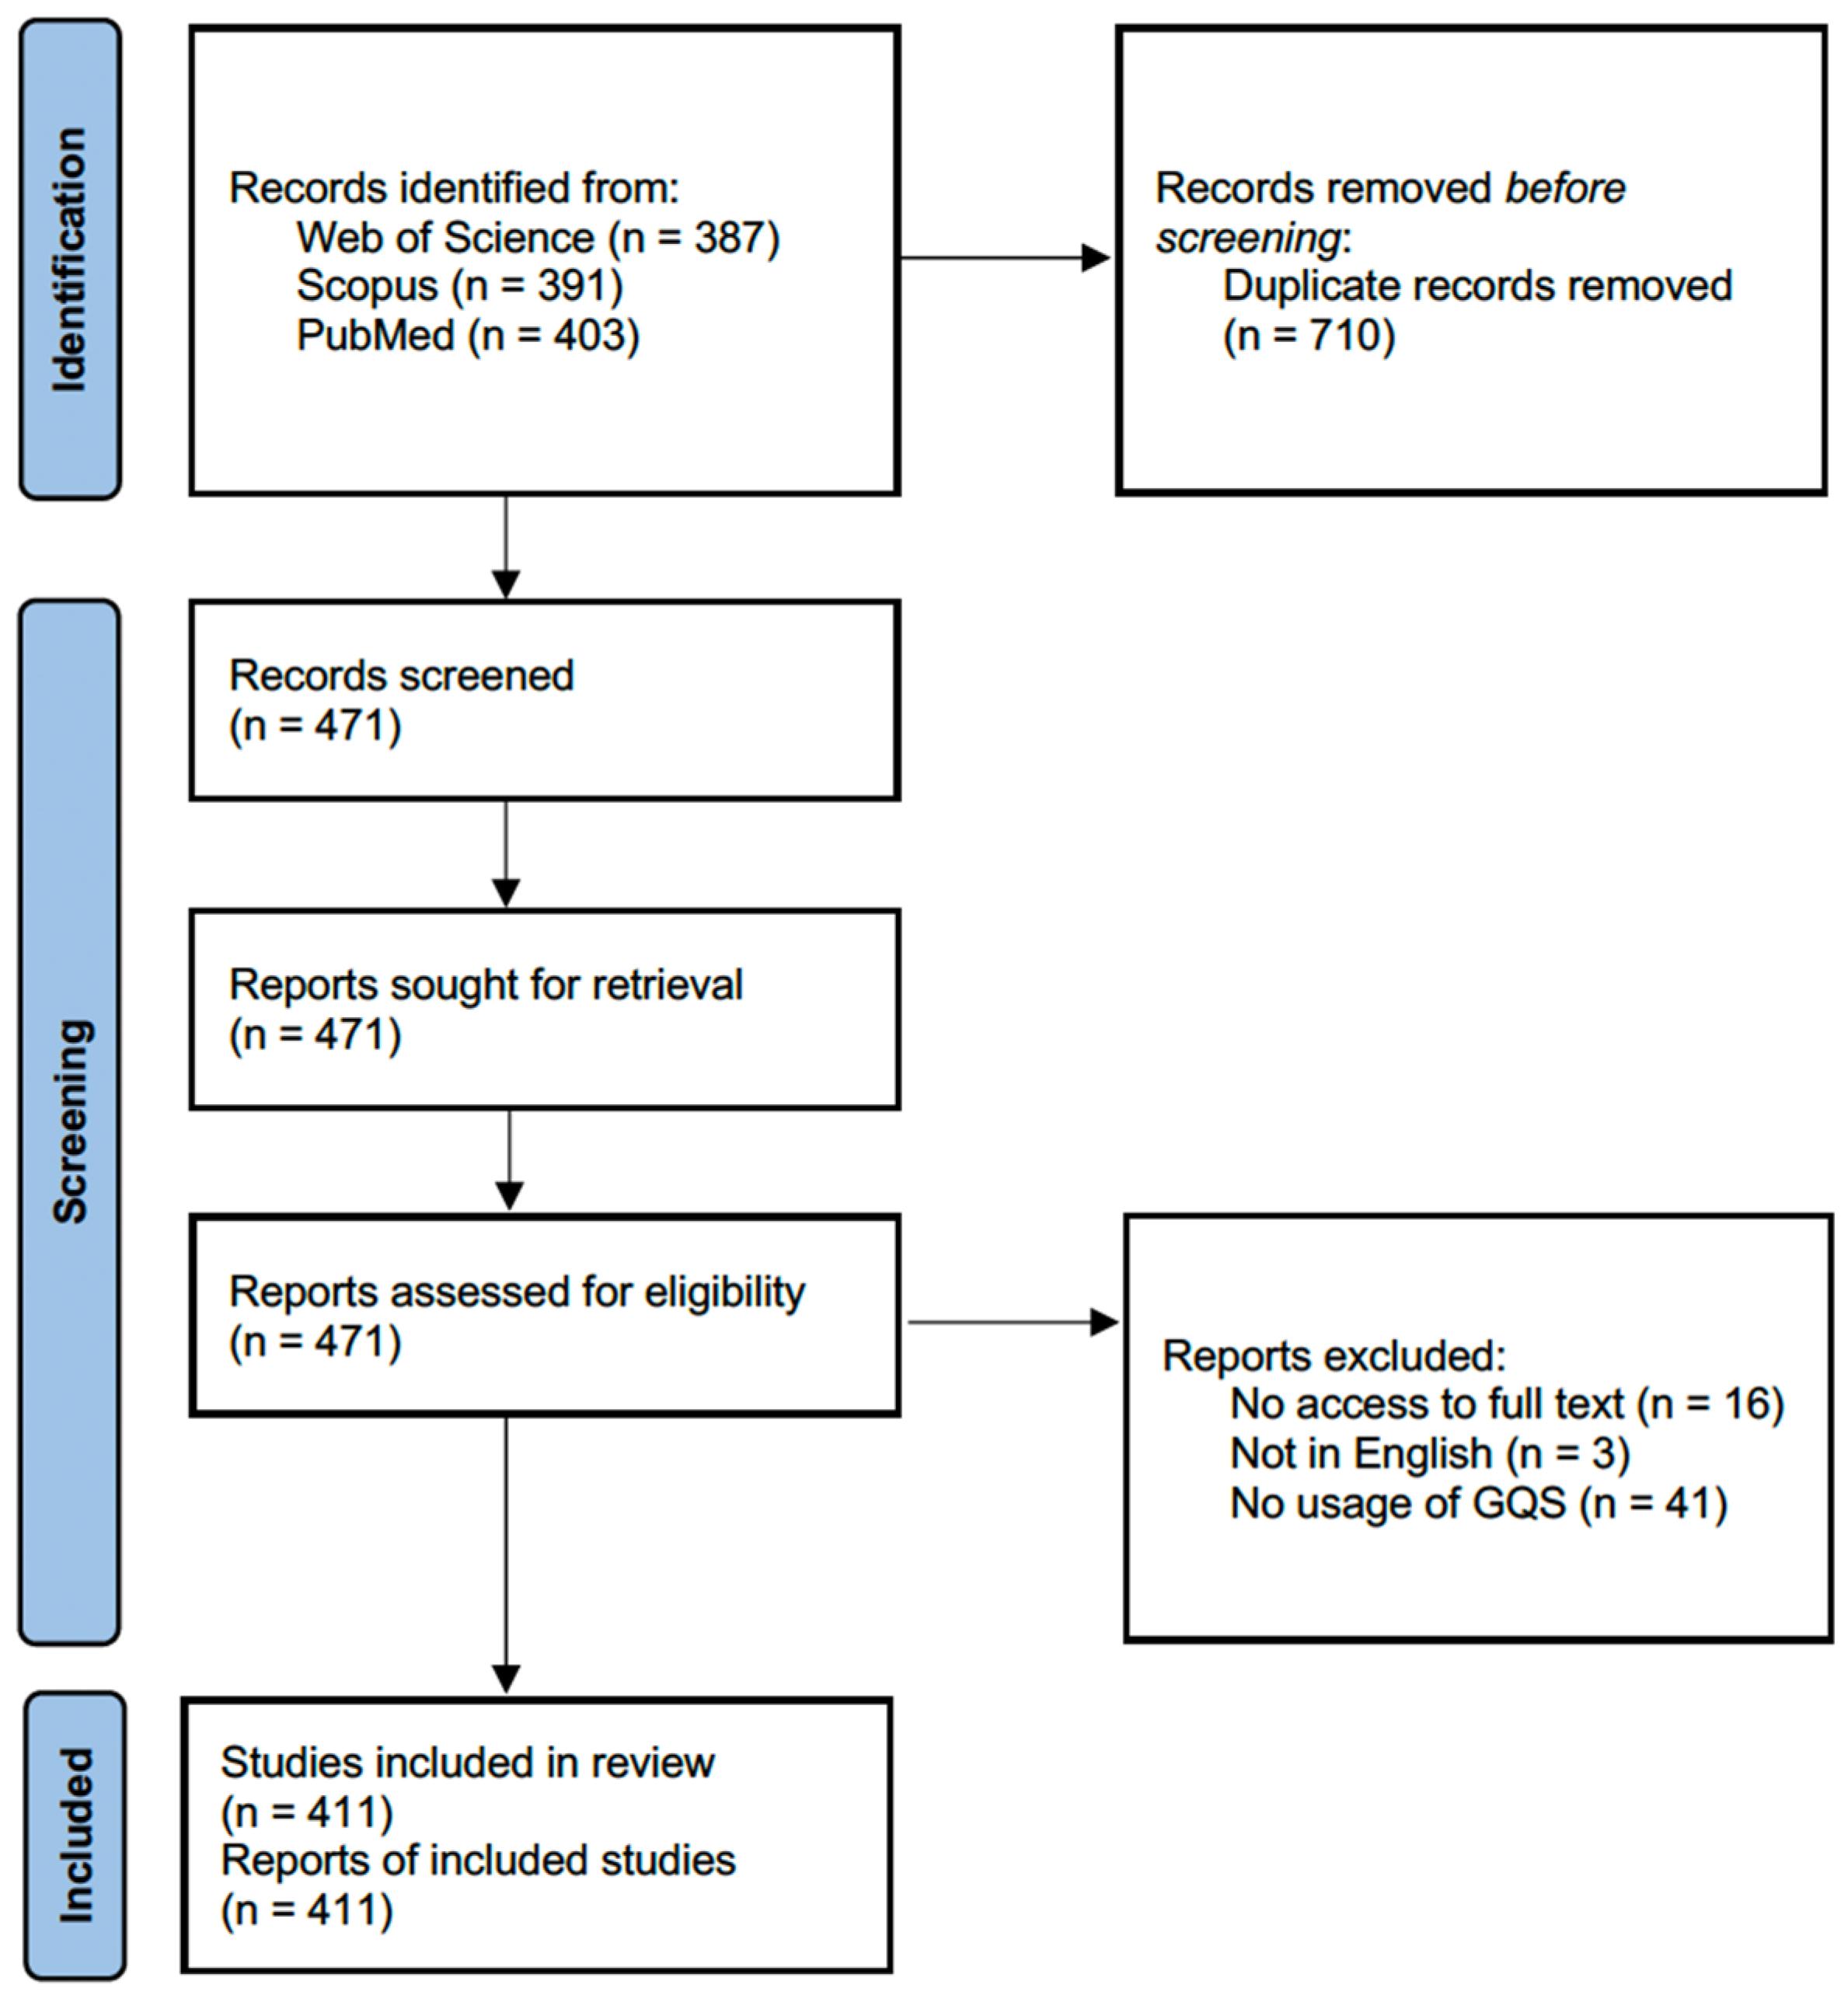
The first two searches looked for the presence of “global quality score*” or “global quality scale*” in the title, abstract, and keywords fields of original articles written in English. Meanwhile, the PubMed functionality was less versatile and hence the last search looked for all fields and did not place the filters. The search were not limited by a time frame. Yielded papers were all initially included. All the 1181 publication records were exported into an Excel spreadsheet. After removing duplicates, 471 papers remained. Among the 471 papers, 60 of them were excluded after screening due to the following reasons: no access to the full text (n = 16), full text not in English (n = 3), and irrelevance (e.g., no actual usage of the GQS, or the mentioned GQS was not the one used to evaluate online health information, n = 41). For papers with no access to the full text, the authors were not contacted. Finally, 411 papers entered the analysis (Figure 1).
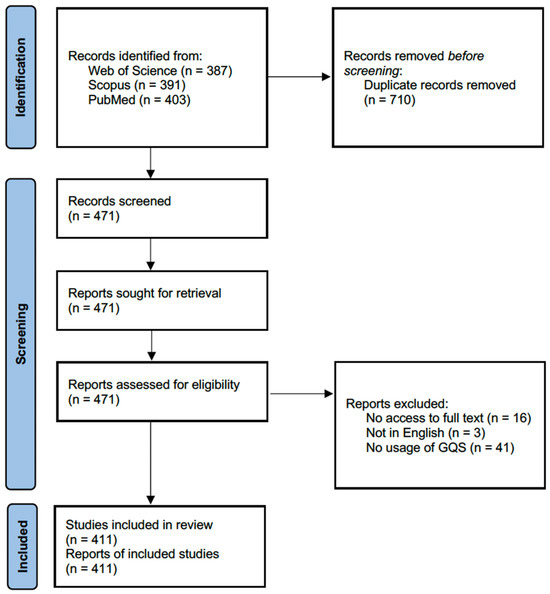
Figure 1.
PRISMA flow diagram that shows the screening process of the literature.
Then, the 411 papers were manually coded for the following parameters:
- (1)
- Whether Bernard et al. (2007) was cited as the source of the GQS.
- (2)
- What other references were cited as the source of the GQS.
- (3)
- Whether the GQS was called the Global Quality Score or Global Quality Scale.
- (4)
- What kind of online materials were evaluated.
- (5)
- Descriptions of the validity of the GQS, if any.
A chi-squared test was conducted to assess if a higher proportion of the group of papers citing Bernard and co-workers as the source of the GQS would call the GQS the Global Quality Score, relative to the group of papers that did not cite Bernard and co-workers. Linear regressions were conducted to evaluate if there were linear trends in the ratio of papers calling the GQS the Global Quality Score, citing Bernard and co-workers, and citing nothing as the source of the GQS across publication years. Papers published before 2018 were grouped into papers published in 2018 together for the tests. Statistical analyses were performed with SPSS 28.0 (IBM, Armonk, NY, USA). Results were significant if p < 0.05.
3. Results
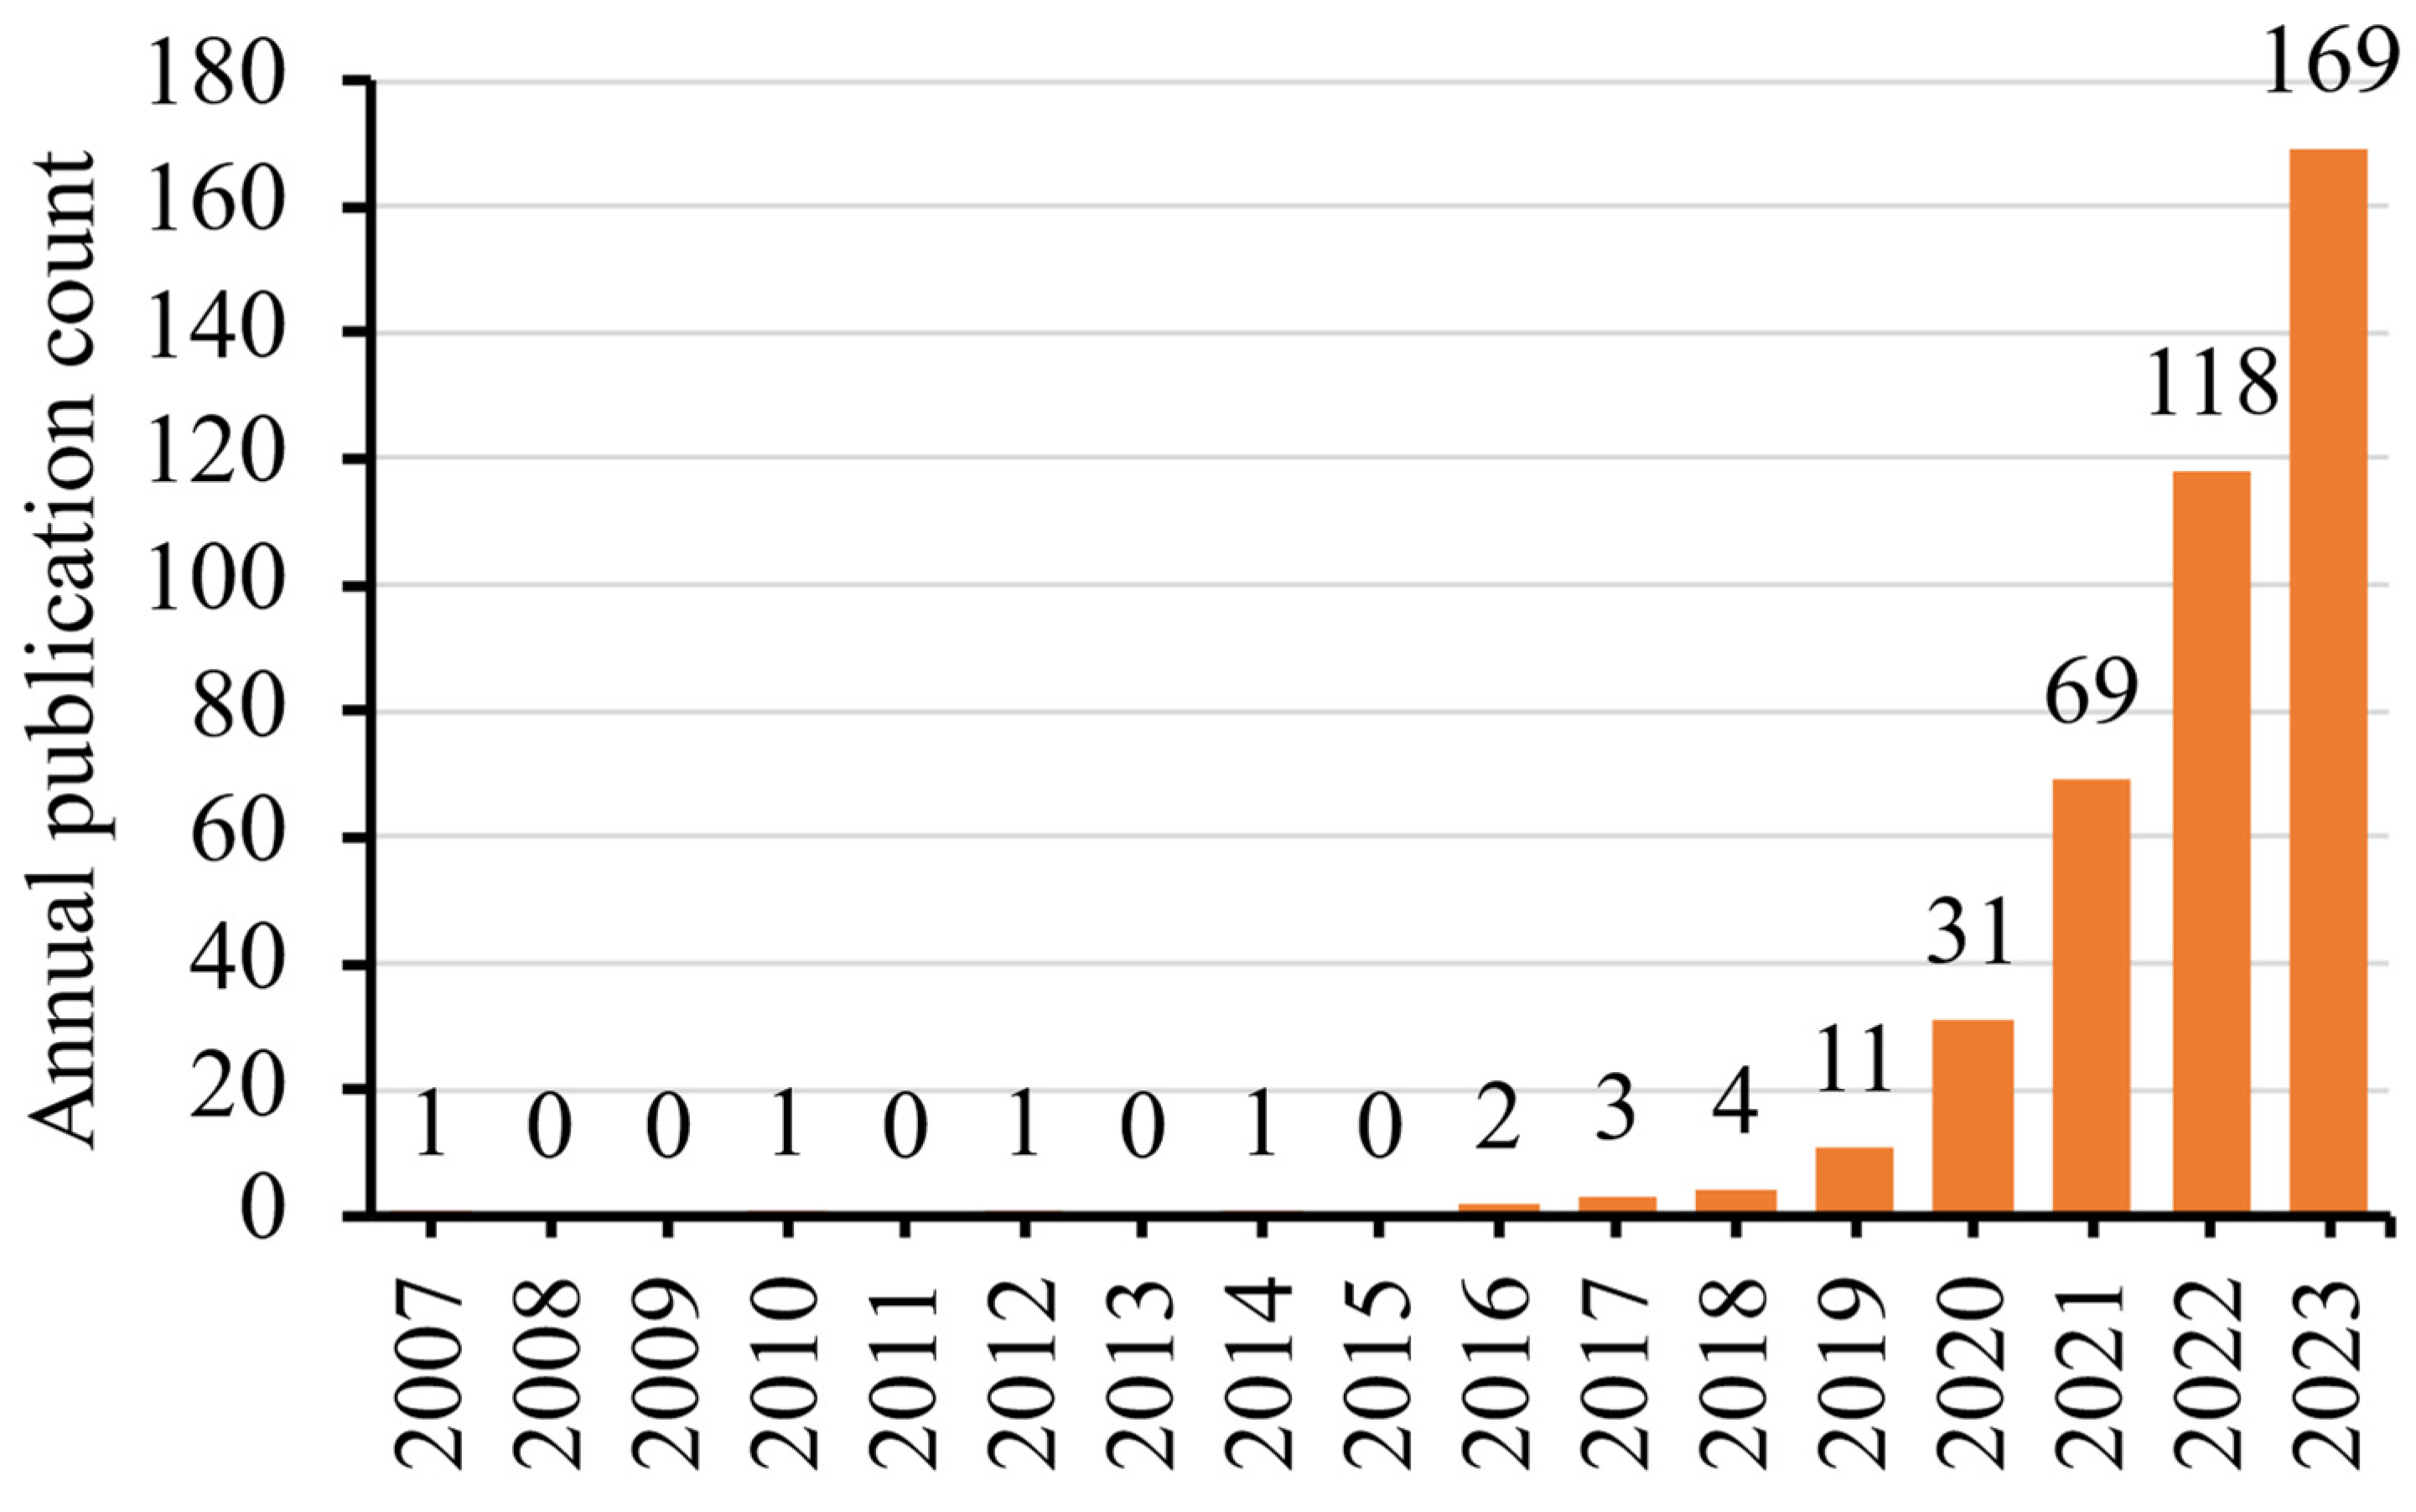
The coded data sheet for the 411 papers was provided as Supplementary File S1. Nearly all (n = 398, 96.8%) have been published since 2019 (Figure 2). Overall, 218 papers cited Bernard et al. (2007) as the source of the GQS and two papers mentioned that Bernard and co-workers introduced the GQS without a citation in the reference list. It was unclear if the citation was accidentally omitted in the reference list due to a typesetting error during the publication process. For simplicity, these two papers were merged into the 218 papers for the rest of this report, rendering it a total of 220 papers giving proper credit to Bernard and co-workers as the source of the GQS (53.5%). Among these 220 papers, 21 papers also gave credit simultaneously to other researchers (Figure 3). For those 191 papers that did not cite Bernard et al. (2007) as the source of the GQS, 62 papers did not cite any references at all. Upon closer examination, 80 other references were cited among the 411 papers as the source of the GQS, predominated by (Singh et al., 2012) (n = 43), (Erdem & Karaca, 2018) (n = 27), (Kunze et al., 2019) (n = 8), and (Langille et al., 2010) (n = 8).
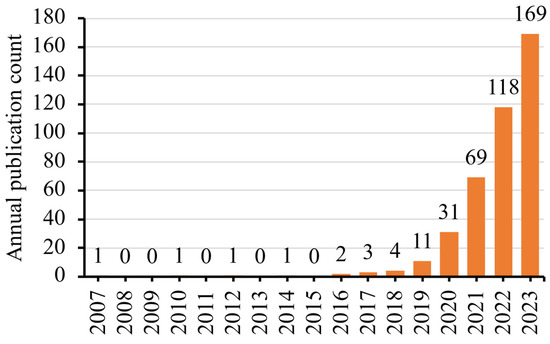
Figure 2.
Publication years of the 411 analyzed papers.
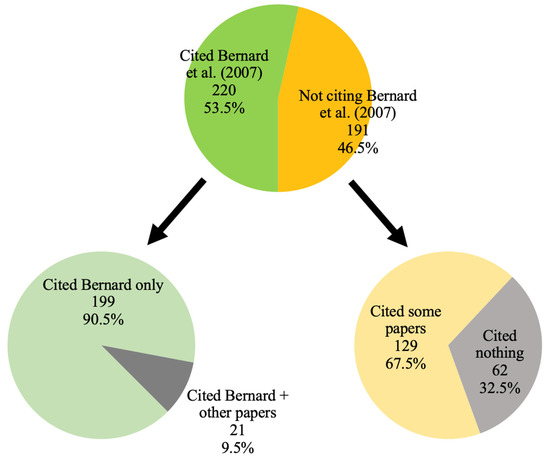
Figure 3.
Number of papers giving proper credit to Bernard and co-workers (Bernard et al., 2007) as the source of the GQS.
Meanwhile, 226 papers (55.0%) referred to the GQS by the original name, the Global Quality Score, whereas 185 papers (45.0%) referred to it as the Global Quality Scale. A chi-squared test showed that a significantly higher proportion of papers citing Bernard and co-workers as the source of the GQS actually called it the Global Quality Scale than their counterparts (50.9% vs. 38.2%, p = 0.010). Meanwhile, an exploratory chi-squared test showed that there was no significant difference in the proportion of papers that called the GQS the Global Quality Score regardless of whether Singh et al. (2012) was cited or not (48.8% vs. 55.7%, p = 0.392).
Table 1 shows the number of papers referring to the GQS as the Global Quality Score and citing Bernard et al. (2007), respectively, per year. Linear regressions showed that there was no significant temporal trend in the ratio of papers calling the GQS the Global Quality Score (r2 = 0.297, p = 0.568), whereas there was a significant reduction in the ratio of papers citing Bernard and co-workers as the source of the GQS across the years (r2 = 0.944, p = 0.005). There was no significant temporal trend in the ratio of papers that cited nothing as the source of the GQS (r2 = 0.463, p = 0.355). The Result was unchanged if papers published in 2018 or before were disregarded (r2= 0.849, p = 0.069).

Table 1.
Number of papers referring to the GQS as the Global Quality Score and citing Bernard et al. (2007), respectively, per year.
Only 24 papers (5.8%) mentioned or commented about the validity of the GQS. Interestingly, half of these 24 papers claimed that the GQS was a validated tool whereas the other half correctly claimed that the GQS was not validated.
Finally, most of the 411 papers solely evaluated YouTube videos (n = 360, 87.6%), whereas 18 papers evaluated the content of websites in general (4.4%) (Table 2). Besides those commonly evaluated materials listed in Table 2, other online information sparsely evaluated by the papers included the following: videos from Kwai, iQiYi, WebSurg, Youku, Tencent, Tudou, Xigua, and offline videos; and written materials from Wikipedia and Baidu Encyclopedia (see Supplementary File S1).
Table 2.
Number of papers that evaluated different online information.
4. Discussion
This study has several major findings regarding the use of the GQS in the literature. The foremost finding is that 45.0% of the analyzed papers misnamed the Global Quality Score as the Global Quality Scale. The term “Scale” was never mentioned in the original source of the GQS (Bernard et al., 2007), but it was listed in the second most cited reference by Singh et al. (2012), in its abstract and table heading that described the rating. At the first glance, it might be assumed that researchers were influenced by the wording by Singh et al. (2012), leading more recent publications to use the term “Scale” instead of “Score”. However, current results indicated that citing Singh et al. (2012) did not significantly increase the likelihood of using the term “Scale”. In fact, citing Bernard et al. (2007) did. Moreover, the current results did not show an increasing trend in the use of the term “Scale” over the years. This phenomenon appears to be inexplicable.
Perhaps one possible explanation was that many researchers did not think that the exact name of the evaluation tool was an important issue. However, it is actually critical to ensure the identical tool with the correct name is applied as prior studies did. Otherwise, confusion may arise. In neuroscience and psychology fields, there is a 10-item questionnaire called the Edinburgh Handedness Inventory (EHI), devised by Oldfield back in 1971 to assess the handedness of human subjects (i.e., whether a subject is right-handed or not) (Oldfield, 1971). Two large-scale literature surveys have indicated that many papers applying the EHI did not report whether the original format was maintained or simply changed the number/content of the items, response format, and cut-off score for right-handedness (Edlin et al., 2015; Yeung & Wong, 2022). Regardless, the issue of altering the original format of the tool should not affect the GQS too much, as it is only a five-point Likert scale with a simple and straightforward description indicating the overall content quality from very poor to excellent. In fact, the authors of one paper in the dataset reported that they modified the GQS into a four-point Likert scale (removing the category of very poor quality) (Aldahlawi et al., 2023). This modification was described in the main text but the abstract simply mentioned that the GQS (“Scale”) was used. Misnaming it as “Global Quality Scale” is undesirable, as it implies a different measurement construct, potentially leading to confusion in its application and interpretation. By naming it a scale, readers may assume it operates on a continuous rather than a discrete scoring system. In short, researchers should avoid confusion by naming the tool correctly, and either briefly describing the content/format of the tool or citing the original source to guide readers to check its content/format.
Another important finding was the declining ratio of papers that cited Bernard et al. (2007) as the source of the GQS. One may argue that it follows a phenomenon called “obliteration by incorporation” (Merton, 1965), meaning that a concept has become universally accepted and well known as common knowledge so that researchers no longer cite the original source or explain the concept itself (Marx & Bornmann, 2010; Yeung, 2021). The current results, however, indicated that although the ratio of papers citing nothing as the source of the GQS seemed to be higher during 2021–2023 compared to 2019 and 2020, the overall trend did not show any statistical significance. In other words, researchers recently might tend to cite other references more in the place of the original Bernard et al. (2007), instead of citing no reference at all. For example, nine papers cited both Singh et al. (2012) and Erdem and Karaca (2018) as the sources of the GQS; these were published more recently. In addition, Erdem and Karaca (2018) cited Singh et al. (2012) but not Bernard et al. (2007). Hence, subsequent researchers who referred to Erdem and Karaca (2018) might conveniently identify Singh et al. (2012) as the original source of the GQS, which should be inaccurate as Singh et al. (2012) correctly cited Bernard et al. (2007) as the source of the GQS. The key message here is that researchers should verify and hence cite the original source of information, instead of citing secondary sources (Gavras, 2002; Teixeira et al., 2013). As mentioned in the introduction, mis-citation behavior is discouraged as it undervalues the contributions of original researchers, undermines their recognition, and compromises scientific rigor by potentially overlooking critical details from the original methodology and results interpretations. Overall, 53.5% of papers cited the primary source of the GQS, namely Bernard et al. (2007). This percentage is higher than that reported by a recent study on the citation of a dental anxiety scale, in which 41.9% of surveyed papers correctly cited the primary source (Yeung, 2024). Readers should be reminded to cite the primary source to properly credit the original contributors, ensuring accurate attributions in subsequent publications.
The claim of the GQS being a validated tool was another issue to be discussed. Interestingly, none of the 12 papers that described the GQS as an unvalidated tool cited Bernard et al. (2007), but 6 of the 12 papers that described the GQS as a validated tool did. One illustrative excerpt from P.3 of (Vaira et al., 2023) was as follows: “The GQS, introduced and validated by Bernard et al., evaluates the quality and information flow of the videos and consequently their usefulness for the patient”. A careful examination of the text of Bernard et al. (2007) found no mention about the validity of the GQS, whereas another tool called QEI was indeed claimed to be validated by that paper. According to Bernard, the authors underwent several iterations of the GQS and finalized its content after pretesting (personal communication, 23 January 2025). Moreover, the face validity of the GQS is high, as the GQS was found to correlate well with validated metrics such as QEI (r = 0.81) (Bernard et al., 2007) and DISCERN (r = 0.88) (Langille et al., 2010). Also, the GQS was created to evaluate websites but not videos. Tools used to evaluate online health information were usually unvalidated but that did not deter researchers from using them. For instance, the original DISCERN tool was a validated 16-item tool that required users to answer in five-point Likert scale for all questions (Charnock et al., 1999). Then, it was modified into a five-item tool that requires binary answers, rendering a total score ranged between 0 and 5, often referred to by researchers as the Reliability Score or modified/brief DISCERN. This modification was performed in the same paper by Singh et al. (2012) that is frequently (mis-)cited as the source of the GQS (Singh et al., 2012). Again, this modified DISCERN was unvalidated. Similarly, the JAMA benchmark was a four-point scale that assessed the authorship, attribution, disclosure, and currency aspects of online health information (Silberg et al., 1997). This tool was also not validated, and according to the own words of the original authors, the benchmarks “certainly are no guarantee of quality in and of themselves” (Silberg et al., 1997). All these examples suggested that many common evaluation tools were not validated. Meanwhile, a validated tool means it has been scientifically proven. At times, however, it may be more efficient and pragmatic for researchers to devise or use a questionnaire with a good face validity, with careful considerations at various stages from item selection to small-sample pretesting, but untested for construct validity (Guyatt et al., 1986). Ultimately, researchers should not mix up between being scientifically validated and being frequently cited.
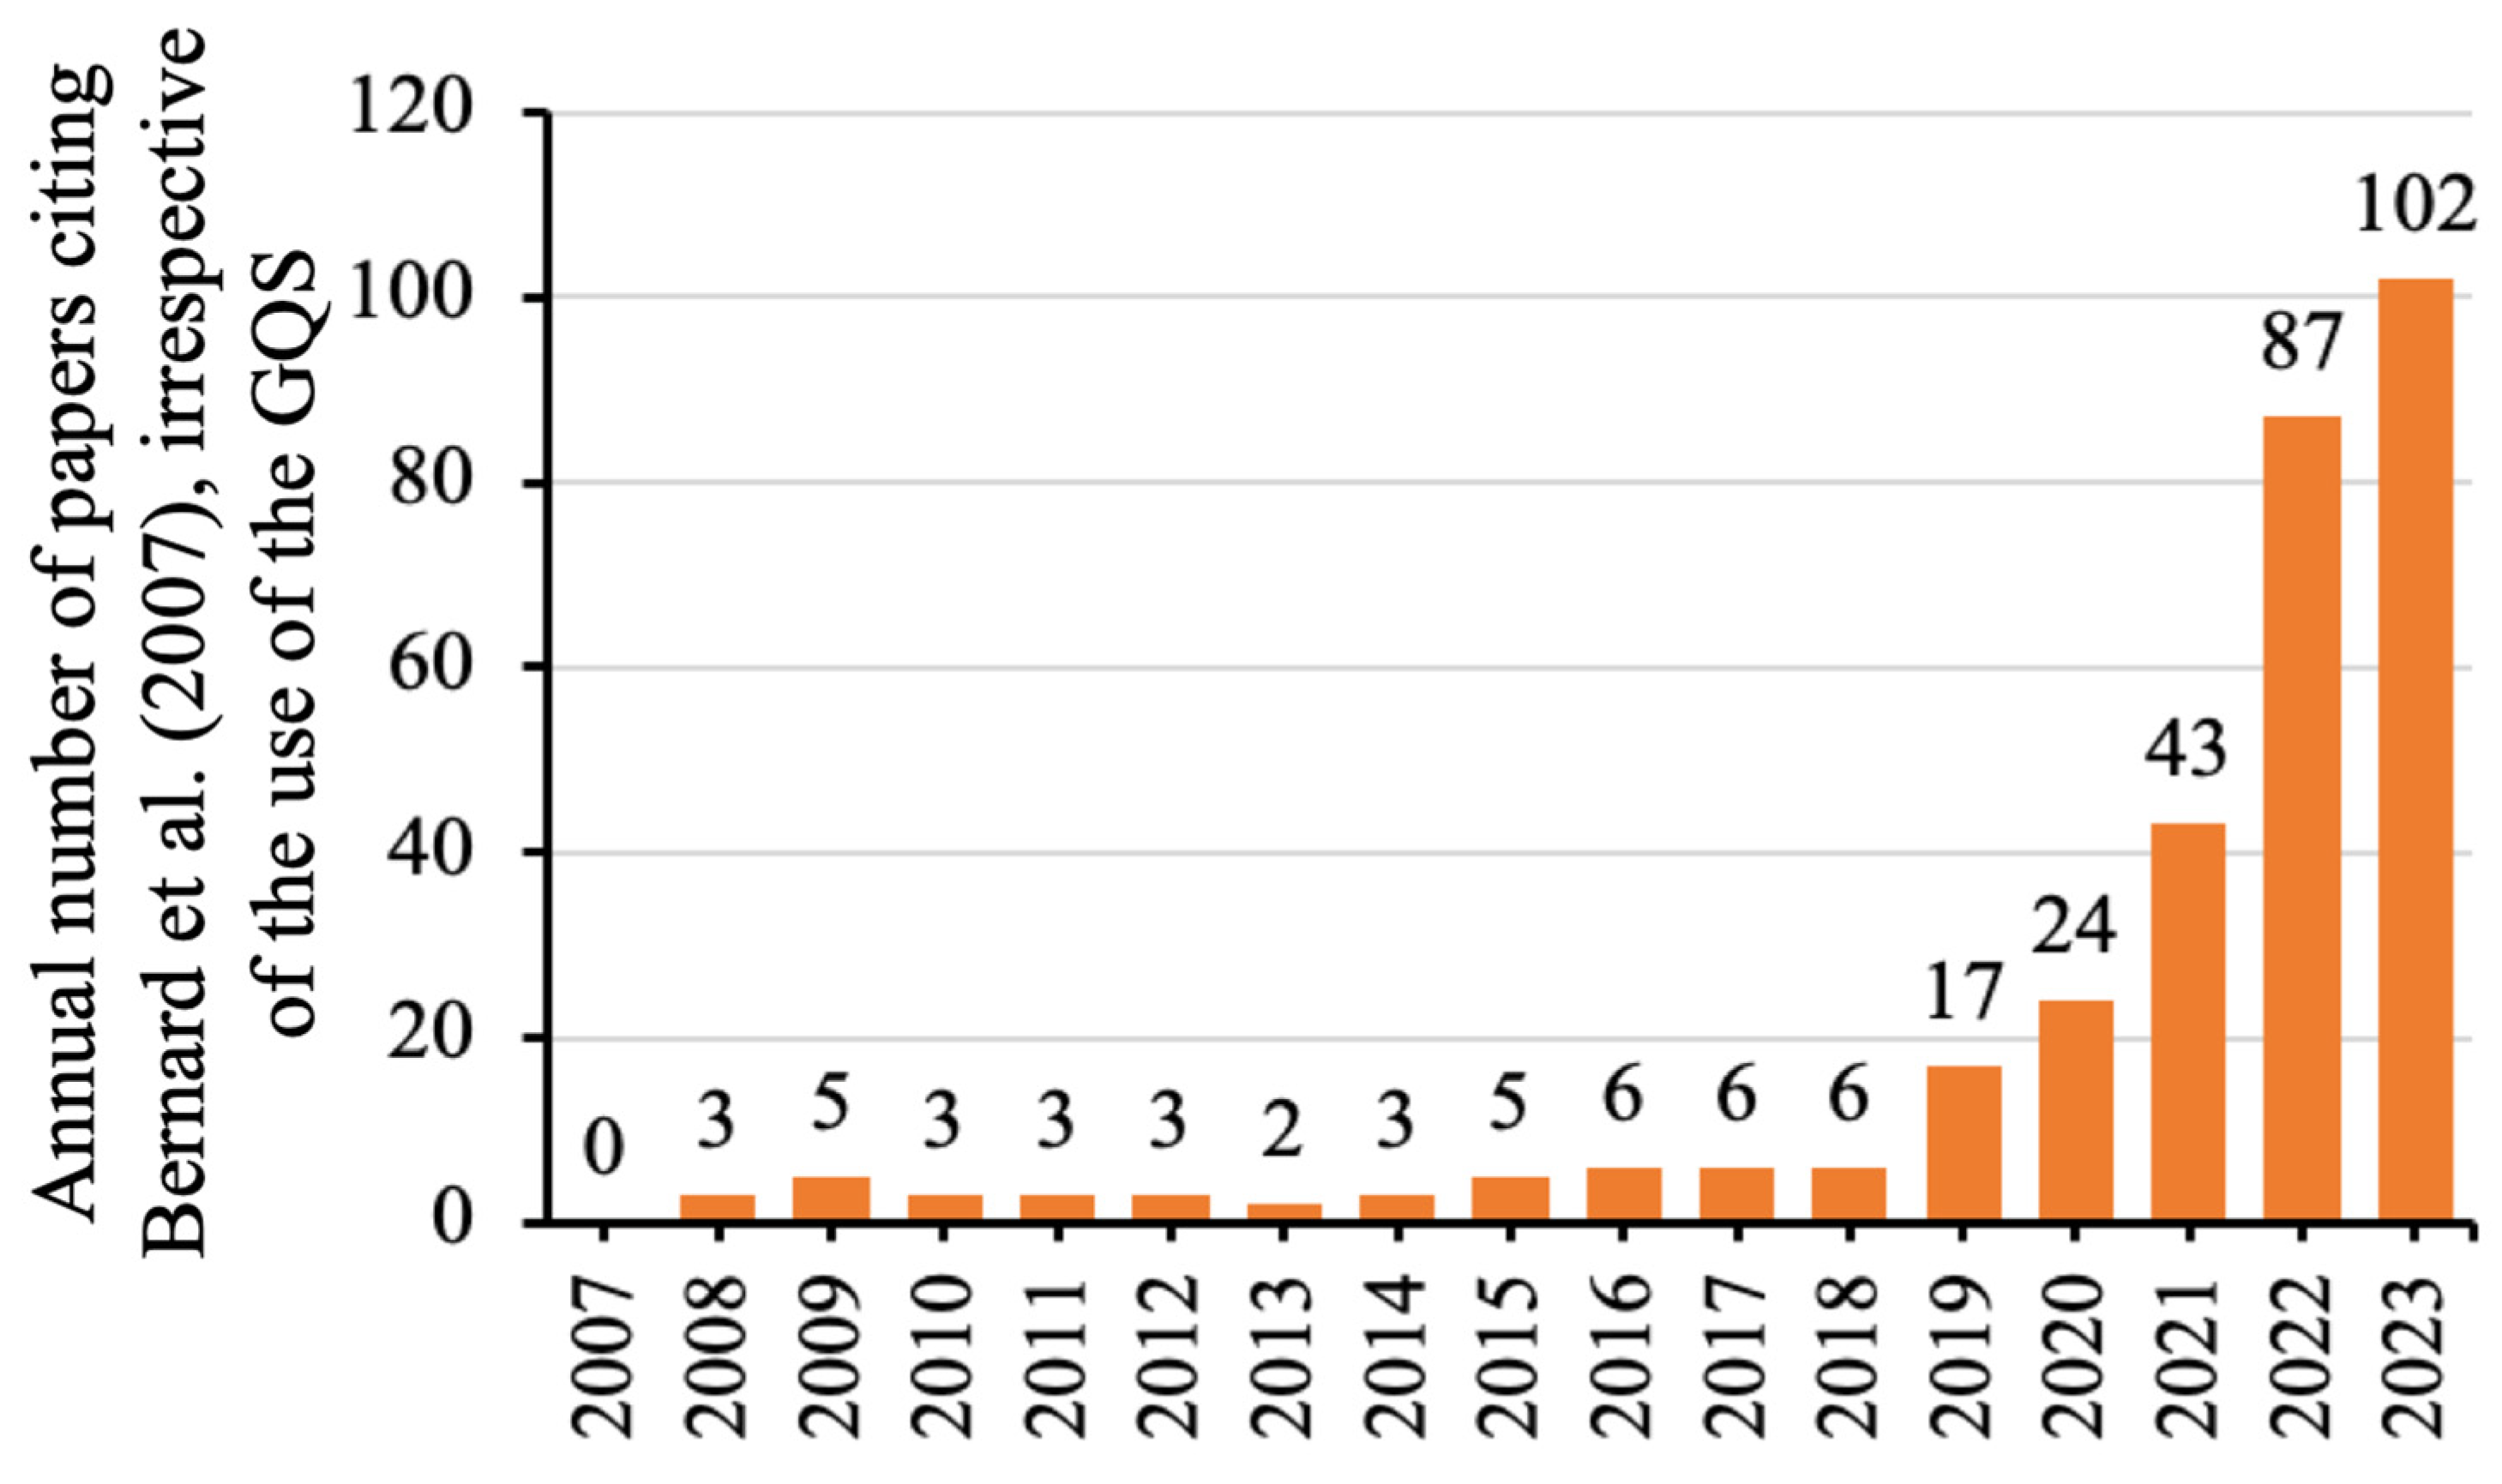
At a first glance, it was strange to note that few papers used the GQS before 2019, given that Bernard and co-workers introduced it in 2007. Meanwhile, data showed that most of the 411 papers using the GQS were evaluating videos posted on the YouTube platform, which was founded in 2005. The literature shows a similar publication trend of papers evaluating YouTube videos on dentistry topics: fewer than 10 papers were published annually before 2019, but 20–30 papers have been published per year since 2020 (Yeung et al., 2024). Another bibliometric study on the entire literature of YouTube similarly found a steeper publication growth since 2019 (Mostafa et al., 2023). For exploratory purposes, a cited reference search was conducted via the Web of Science Core Collection to investigate the temporal trend of papers citing Bernard et al. (2007), regardless of whether these citing papers dealt with the GQS or not. The search similarly showed that Bernard et al. (2007) were cited a few times per year before 2019 (Figure 4). Considering all these numbers together, one plausible reason could be that the COVID-19 pandemic hindered many research activities with social distancing and lockdowns. It might promote researchers to conduct research that did not require personal contact, such as evaluating YouTube videos.
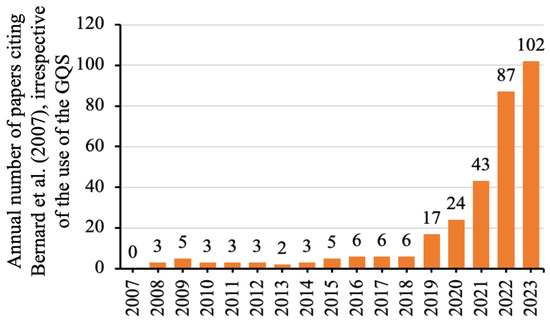
Figure 4.
Number of papers citing Bernard et al. (2007) via a cited reference search in the Web of Science Core Collection, irrespective of whether these citing papers used the GQS or not.
The current work focused on the citation behavior and naming accuracy of the GQS. Future studies with a larger dataset can conduct a bibliometric analysis on authorship, country of origin, journal, and related altmetrics.
5. Conclusions
The GQS was a frequently used evaluation tool to assess the online health information no matter if the information was in written or video format. Among the 411 analyzed papers, 45.0% misnamed it as the Global Quality Scale (should be “Score”), and 46.5% did not cite Bernard et al. (2007) to credit their work as the original source. Another 80 references were also cited from time to time as the source of the GQS, led by Singh et al. (2012). There was a decreasing trend in citing Bernard et al. (2007) when using the GQS. Among the 12 papers that claimed that the GQS was validated, half of them cited Bernard et al. (2007) to justify their claim, but in fact, the latter did not mention its validation. With the advancement in artificial intelligence and natural language processing, it may be possible for manuscript submission systems to detect and recommend corrections to such misnomer and inconsistent citations in the future. There is also a need for peer reviewers to increase their awareness to ensure seminal work within the field is properly cited in the main text and included in the reference list. Researchers should be aware of the suboptimal situation, and name and cite the GQS properly to minimize confusion and stop the dissemination of misinformation.
Supplementary Materials
The following supporting information can be downloaded at https://www.mdpi.com/article/10.3390/publications13020023/s1. Supplementary File S1: Coded data sheet for the 411 papers.
Funding
This research received no external funding.
Data Availability Statement
Data are provided in the main text and Supplementary Materials.
Conflicts of Interest
The author declares no conflict of interest.
Abbreviations
The following abbreviations are used in this manuscript:
| GQS | Global Quality Score |
| IBD | Inflammatory Bowel Disease |
| QEI | Quality Evaluation Instrument |
References
- Aldahlawi, S. A., Homeida, L., & Aldhlaawi, S. (2023). YouTube as a source of patient information on oral manifestations of COVID-19: A cross-sectional evaluation of its utility, dependability, and content. Cureus, 15(8), e42885. [Google Scholar] [CrossRef] [PubMed]
- Bernard, A., Langille, M., Hughes, S., Rose, C., Leddin, D., & Van Zanten, S. V. (2007). A systematic review of patient inflammatory bowel disease information resources on the World Wide Web. American Journal of Gastroenterology, 102(9), 2070–2077. [Google Scholar] [CrossRef]
- Charnock, D., Shepperd, S., Needham, G., & Gann, R. (1999). DISCERN: An instrument for judging the quality of written consumer health information on treatment choices. Journal of Epidemiology and Community Health, 53(2), 105–111. [Google Scholar] [CrossRef]
- Edlin, J. M., Leppanen, M. L., Fain, R. J., Hackländer, R. P., Hanaver-Torrez, S. D., & Lyle, K. B. (2015). On the use (and misuse?) of the Edinburgh Handedness Inventory. Brain and Cognition, 94, 44–51. [Google Scholar] [CrossRef] [PubMed]
- Erdem, M. N., & Karaca, S. (2018). Evaluating the accuracy and quality of the information in kyphosis videos shared on YouTube. Spine, 43(22), E1334–E1339. [Google Scholar] [CrossRef]
- Gavras, H. (2002). Inappropriate attribution: The “lazy author syndrome”. American Journal of Hypertension, 15(9), 831. [Google Scholar] [CrossRef]
- Gebrye, T., Fatoye, F., Mbada, C., & Hakimi, Z. (2023). A scoping review on quality assessment tools used in systematic reviews and meta-analysis of real-world studies. Rheumatology International, 43(9), 1573–1581. [Google Scholar] [CrossRef] [PubMed]
- Guyatt, G. H., Bombardier, C., & Tugwell, P. X. (1986). Measuring disease-specific quality of life in clinical trials. CMAJ: Canadian Medical Association Journal, 134(8), 889–895. [Google Scholar]
- Harzing, A. W. (2002). Are our referencing errors undermining our scholarship and credibility? The case of expatriate failure rates. Journal of Organizational Behavior, 23(1), 127–148. [Google Scholar] [CrossRef]
- Jindal, P., & MacDermid, J. C. (2017). Assessing reading levels of health information: Uses and limitations of flesch formula. Education for Health, 30(1), 84–88. [Google Scholar] [CrossRef]
- Kunze, K. N., Cohn, M. R., Wakefield, C., Hamati, F., LaPrade, R. F., Forsythe, B., Yanke, A. B., & Chahla, J. (2019). YouTube as a source of information about the posterior cruciate ligament: A content-quality and reliability analysis. Arthroscopy, Sports Medicine, and Rehabilitation, 1(2), e109–e114. [Google Scholar] [CrossRef]
- Langille, M., Bernard, A., Rodgers, C., Hughes, S., Leddin, D., & van Zanten, S. V. (2010). Systematic review of the quality of patient information on the internet regarding inflammatory bowel disease treatments. Clinical Gastroenterology and Hepatology, 8(4), 322–328. [Google Scholar] [CrossRef] [PubMed]
- Marx, W., & Bornmann, L. (2010). How accurately does Thomas Kuhn’s model of paradigm change describe the transition from the static view of the universe to the big bang theory in cosmology? A historical reconstruction and citation analysis. Scientometrics, 84(2), 441–464. [Google Scholar] [CrossRef]
- Merton, R. K. (1965). On the shoulders of giants: A Shandean postscript. Free Press. [Google Scholar]
- Mostafa, M. M., Feizollah, A., & Anuar, N. B. (2023). Fifteen years of YouTube scholarly research: Knowledge structure, collaborative networks, and trending topics. Multimedia Tools and Applications, 82(8), 12423–12443. [Google Scholar] [CrossRef] [PubMed]
- Oldfield, R. C. (1971). The assessment and analysis of handedness: The Edinburgh inventory. Neuropsychologia, 9(1), 97–113. [Google Scholar] [CrossRef]
- Osman, W., Mohamed, F., Elhassan, M., & Shoufan, A. (2022). Is YouTube a reliable source of health-related information? A systematic review. BMC Medical Education, 22(1), 382. [Google Scholar] [CrossRef]
- Silberg, W. M., Lundberg, G. D., & Musacchio, R. A. (1997). Assessing, controlling, and assuring the quality of medical information on the Internet: Caveant lector et viewor—Let the reader and viewer beware. JAMA, 277(15), 1244–1245. [Google Scholar] [CrossRef]
- Singh, A. G., Singh, S., & Singh, P. P. (2012). YouTube for information on rheumatoid arthritis—A wakeup call? The Journal of Rheumatology, 39(5), 899–903. [Google Scholar] [CrossRef]
- Teixeira, M. C., Thomaz, S. M., Michelan, T. S., Mormul, R. P., Meurer, T., Fasolli, J. V. B., & Silveira, M. J. (2013). Incorrect citations give unfair credit to review authors in ecology journals. PLoS ONE, 8(12), e81871. [Google Scholar] [CrossRef]
- Teixeira da Silva, J. A. (2022). Tortured phrases dilute the specificity of medical jargon. Journal of Health and Social Sciences, 7(2), 137–140. [Google Scholar]
- Vaira, L. A., Sergnese, S., Salzano, G., Maglitto, F., Arena, A., Carraturo, E., Abbate, V., Committeri, U., Vellone, V., & Biglio, A. (2023). Are YouTube videos a useful and reliable source of information for patients with temporomandibular joint disorders? Journal of Clinical Medicine, 12(3), 817. [Google Scholar] [CrossRef] [PubMed]
- Yeung, A. W. K. (2021). Is the influence of Freud declining in psychology and psychiatry? A bibliometric analysis. Frontiers in Psychology, 12, 631516. [Google Scholar] [CrossRef] [PubMed]
- Yeung, A. W. K. (2024). Exploring the variations in the use of Modified Dental Anxiety Scale (MDAS) in literature: A survey of studies published from 2014 to 2023. Clinical and Experimental Dental Research, 10(6), e70040. [Google Scholar] [CrossRef] [PubMed]
- Yeung, A. W. K., Matin, M., Mickael, M. E., Behrens, S., Hrg, D., Ławiński, M., Hammerle, F. P., & Atanasov, A. G. (2024). Bibliometric analysis of papers dealing with dental videos on YouTube. Publications, 12(3), 22. [Google Scholar] [CrossRef]
- Yeung, A. W. K., & Wong, N. S. M. (2022). The non-transparent usage and reporting of the edinburgh handedness inventory in functional magnetic resonance imaging literature: A survey of studies published since 2013. Laterality, 27(2), 221–231. [Google Scholar] [CrossRef]

Disclaimer/Publisher’s Note: The statements, opinions and data contained in all publications are solely those of the individual author(s) and contributor(s) and not of MDPI and/or the editor(s). MDPI and/or the editor(s) disclaim responsibility for any injury to people or property resulting from any ideas, methods, instructions or products referred to in the content. |
© 2025 by the author. Licensee MDPI, Basel, Switzerland. This article is an open access article distributed under the terms and conditions of the Creative Commons Attribution (CC BY) license (https://creativecommons.org/licenses/by/4.0/).