

Top2Vec Topic Modeling to Analyze the Dynamics of Publication Activity Related to Environmental Monitoring Using Unmanned Aerial Vehicles

 ,
,  ,
,
Abstract
1. Introduction
1.1. Background and Significance
1.2. Literature Review
2. Study Area
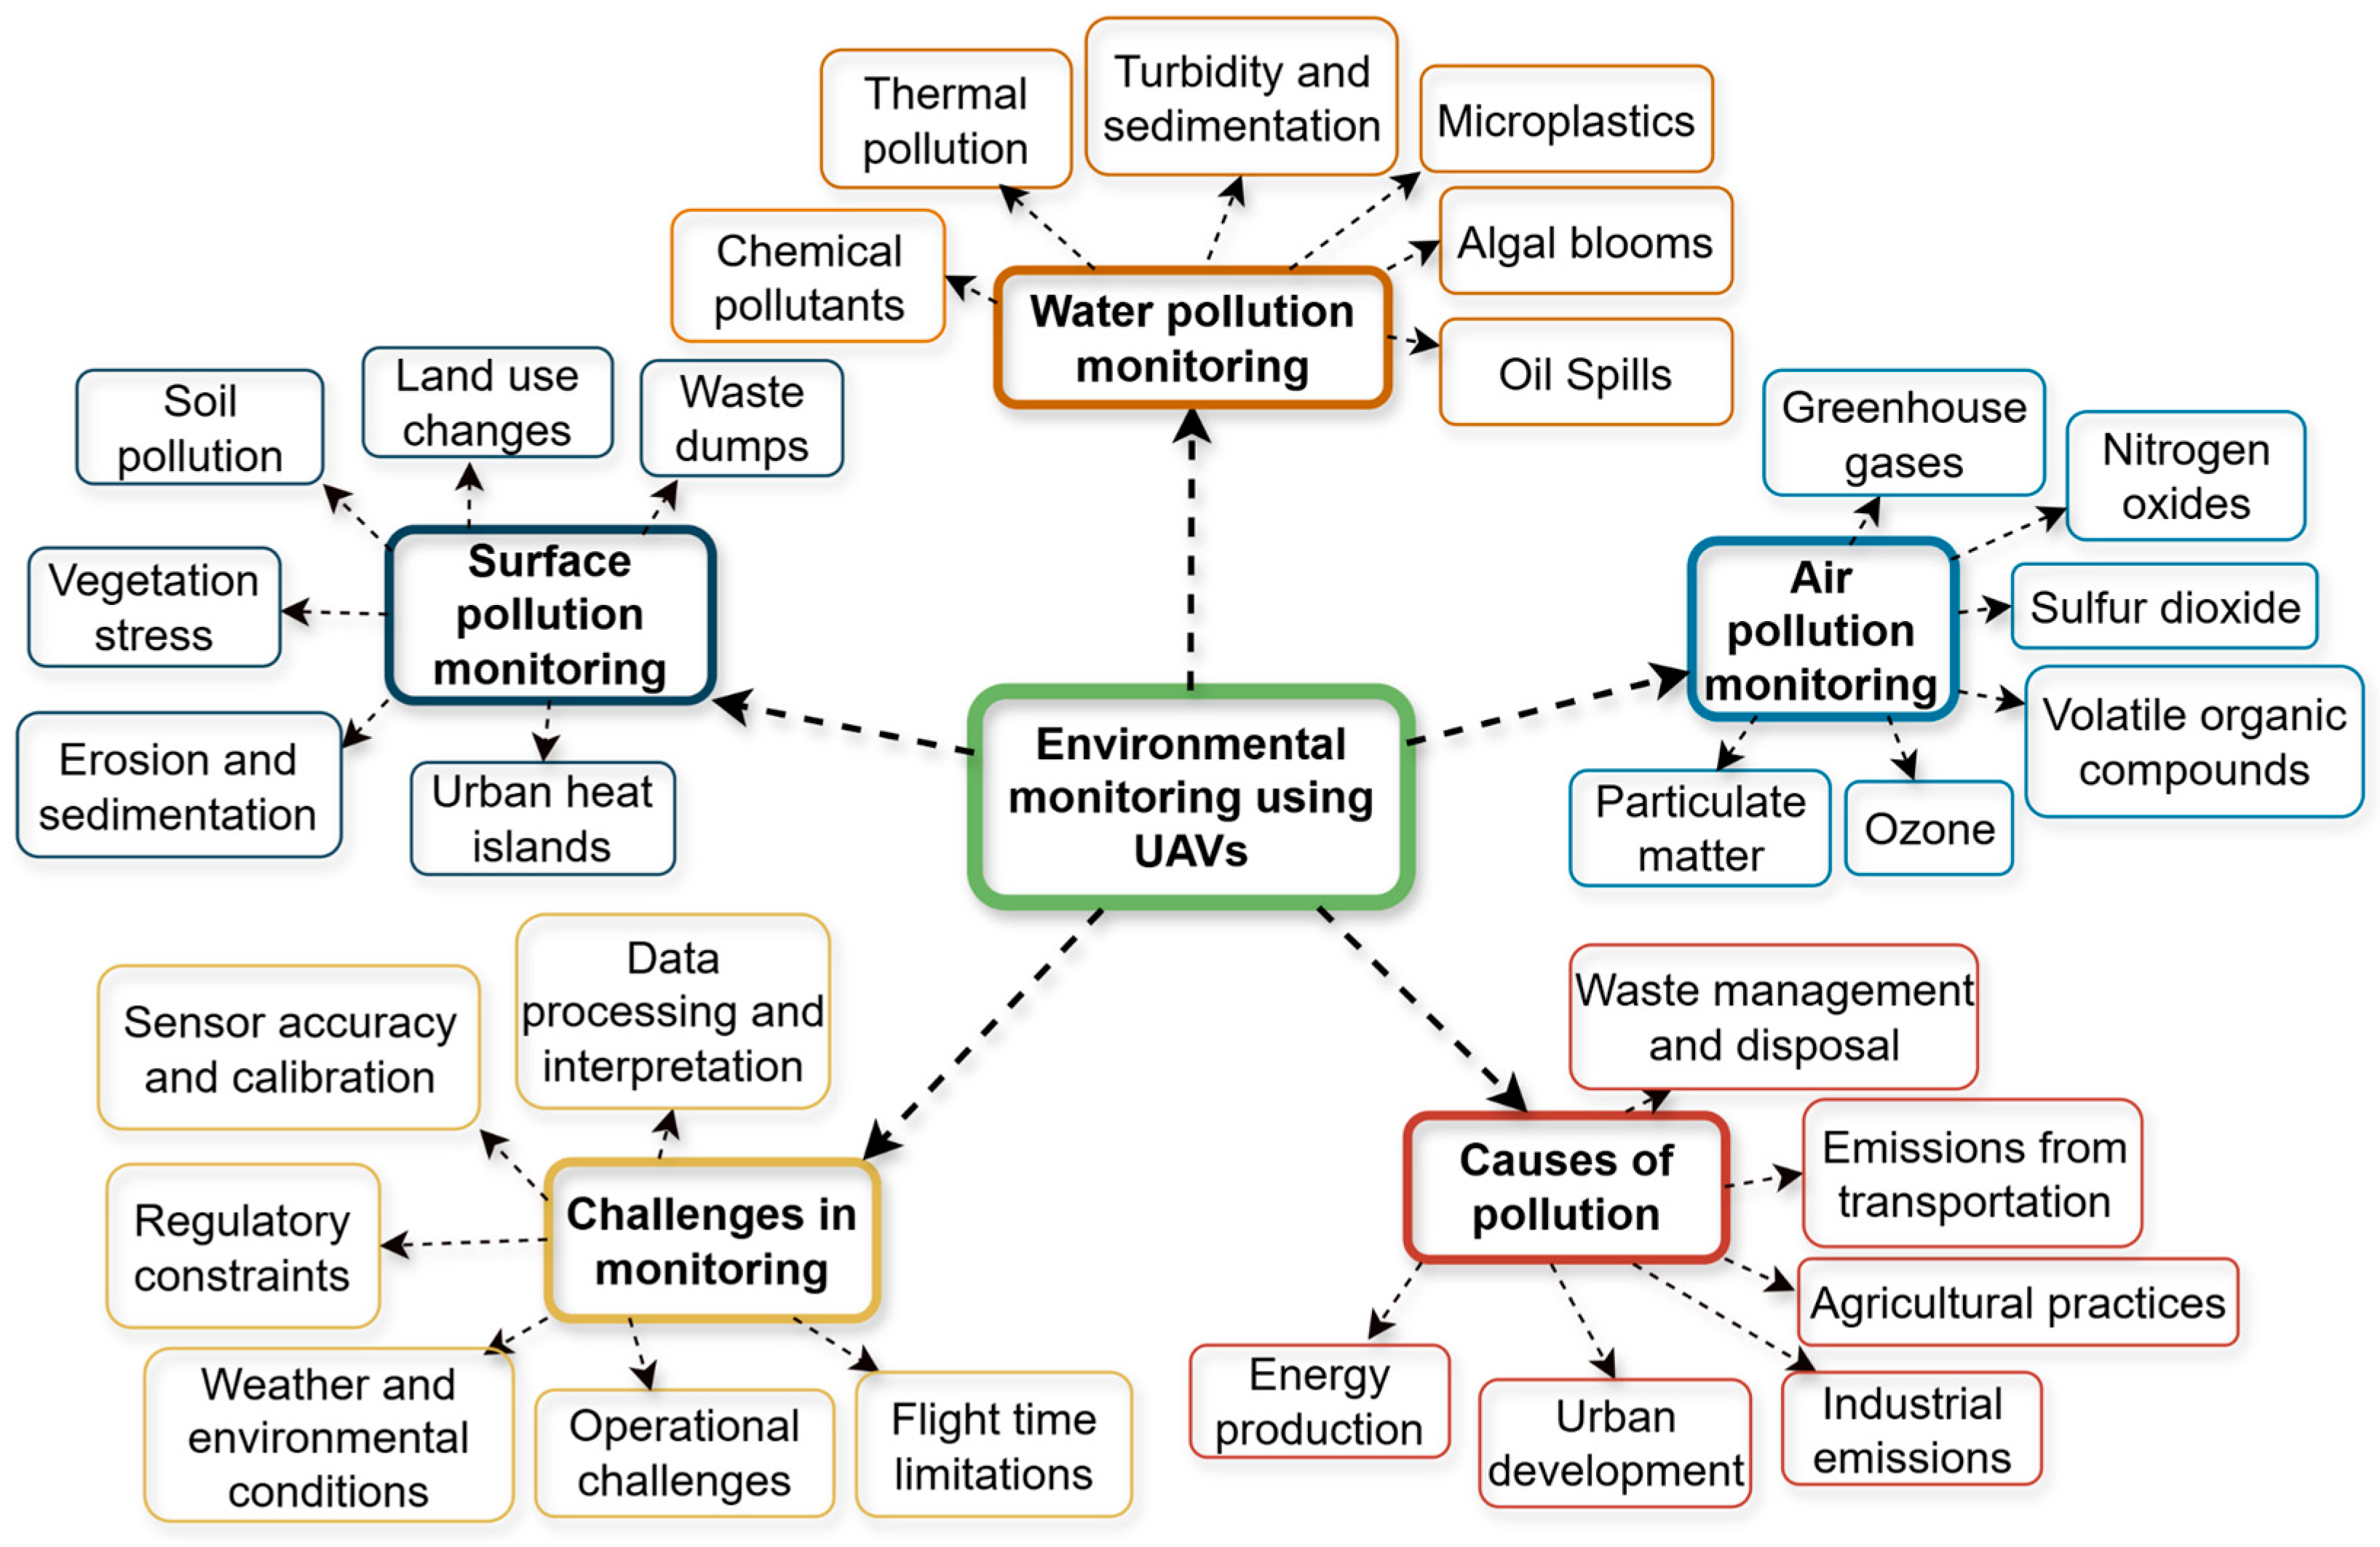
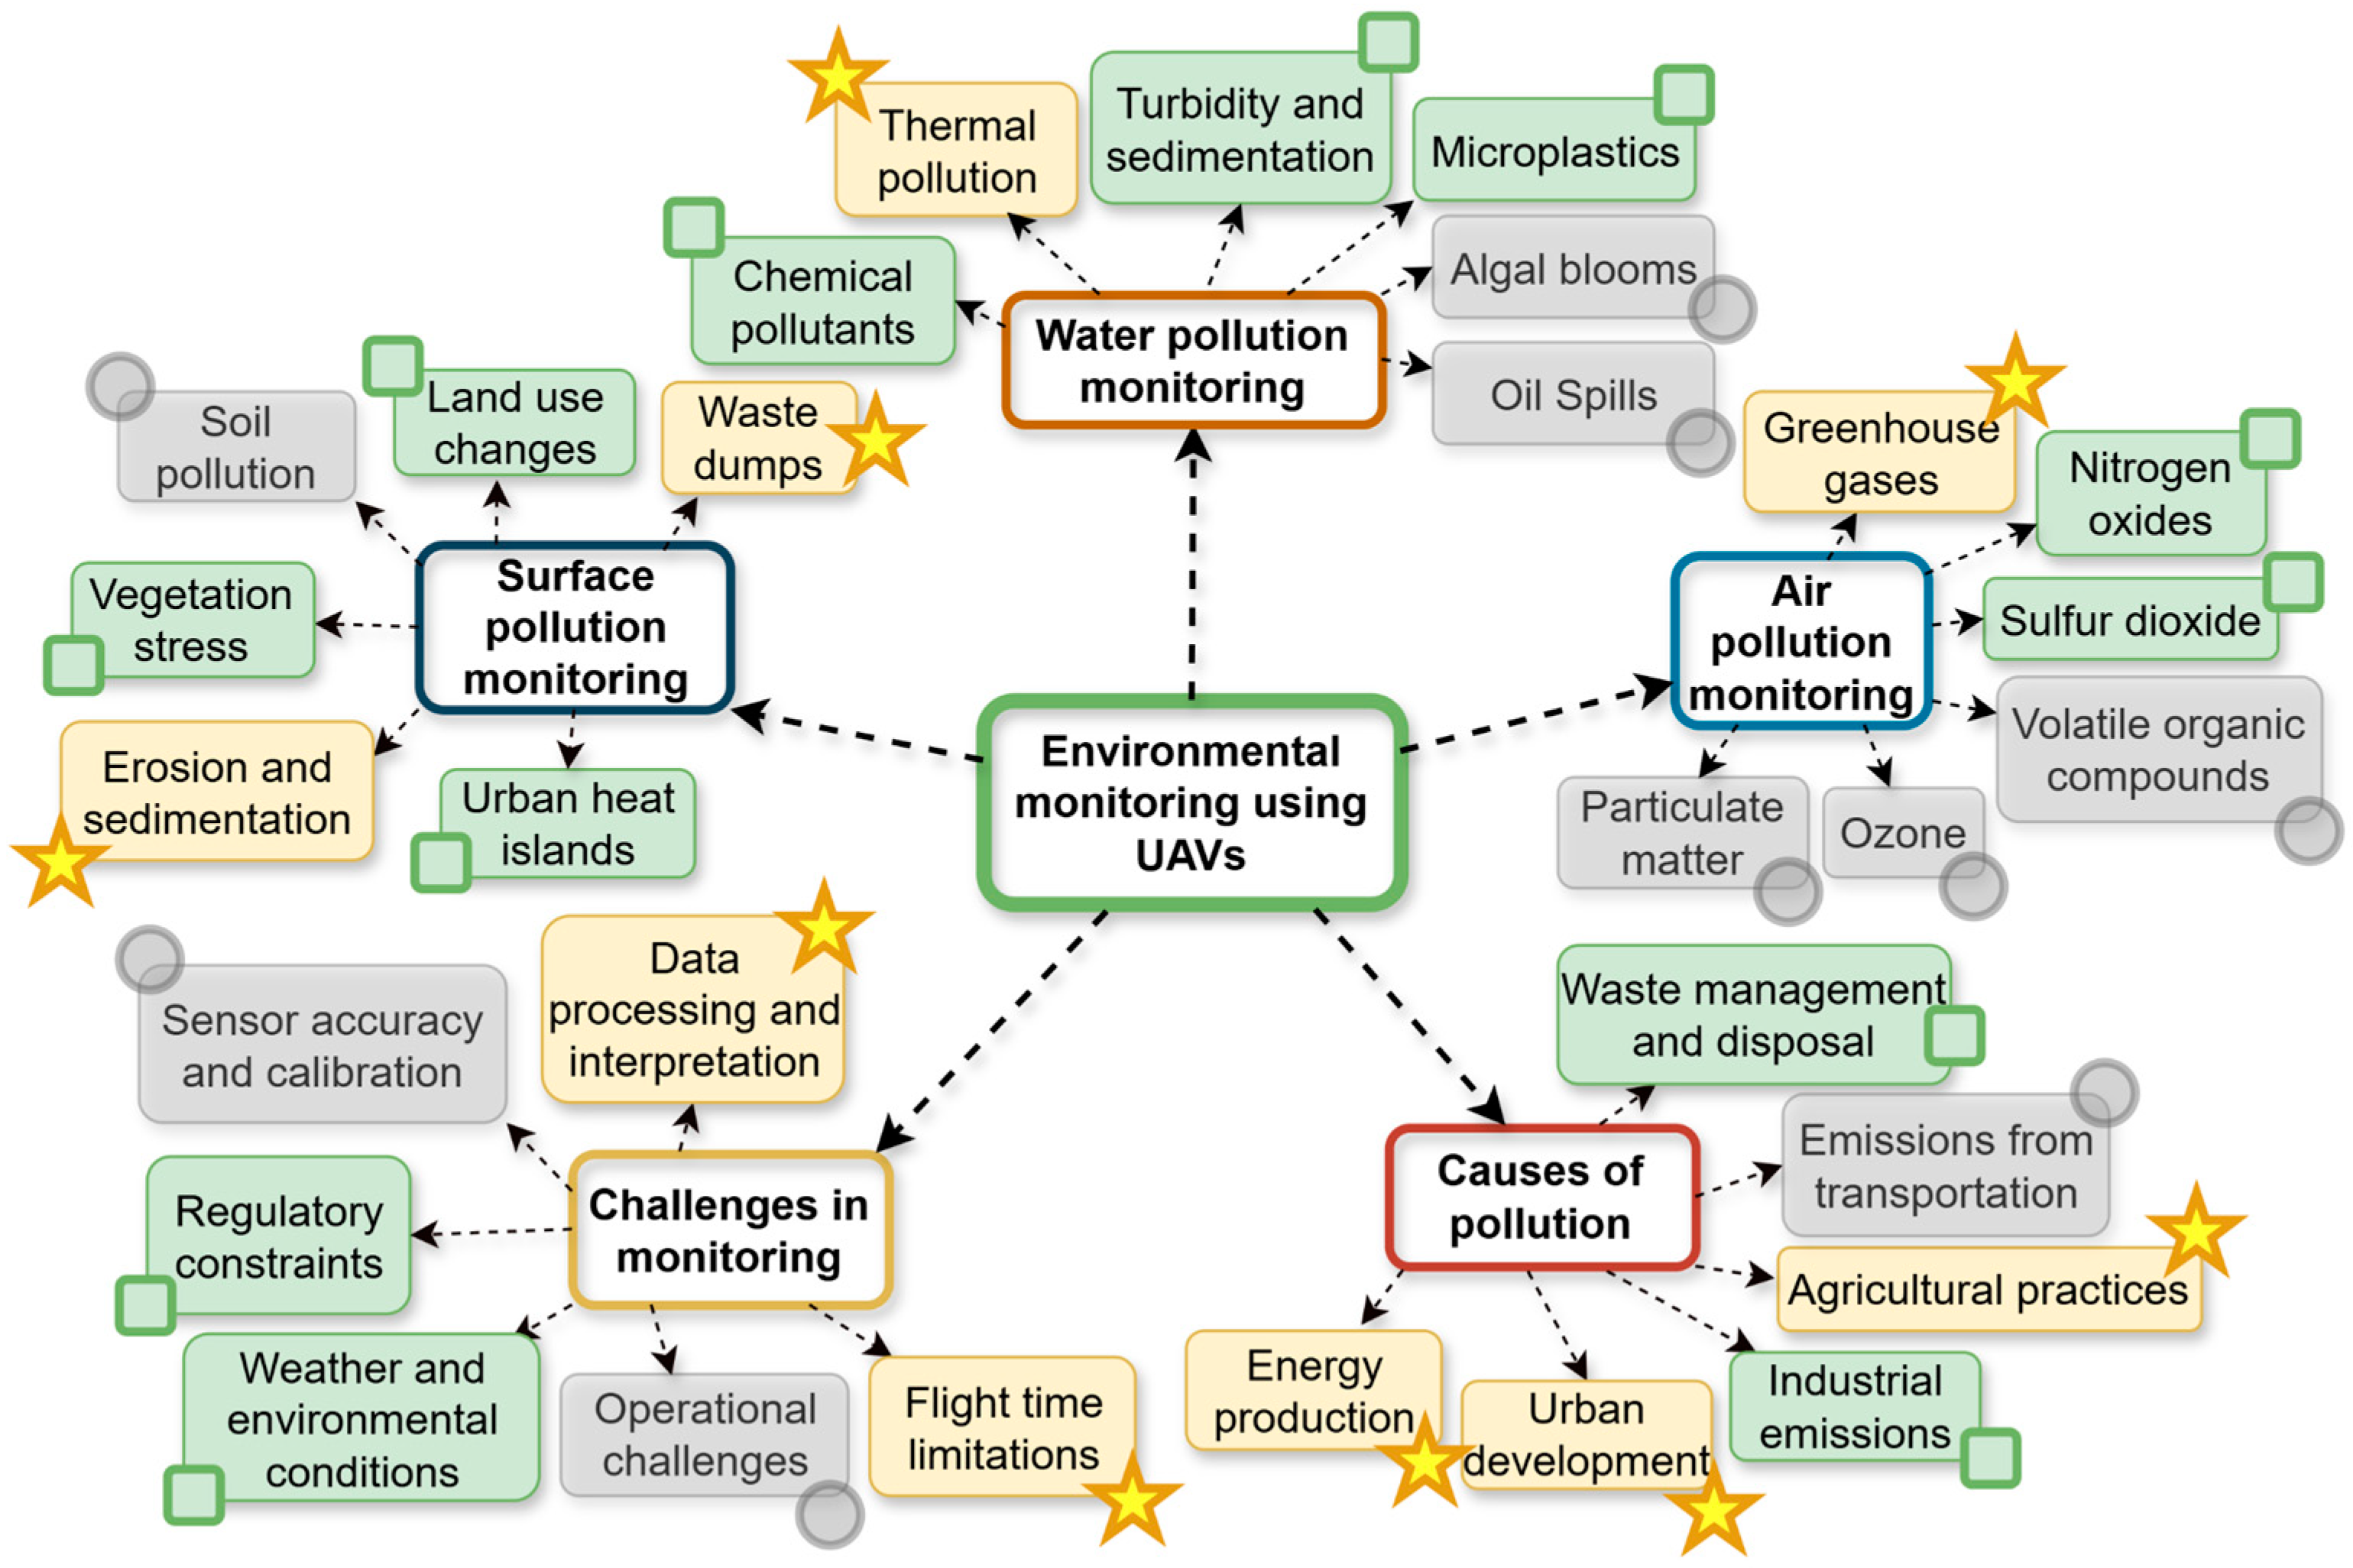
- Water pollution monitoring;
- Air pollution monitoring;
- Surface pollution monitoring;
- Causes of pollution;
- Problems in pollution monitoring.
3. Materials and Methods
3.1. Data Collection
3.1.1. Data Preprocessing
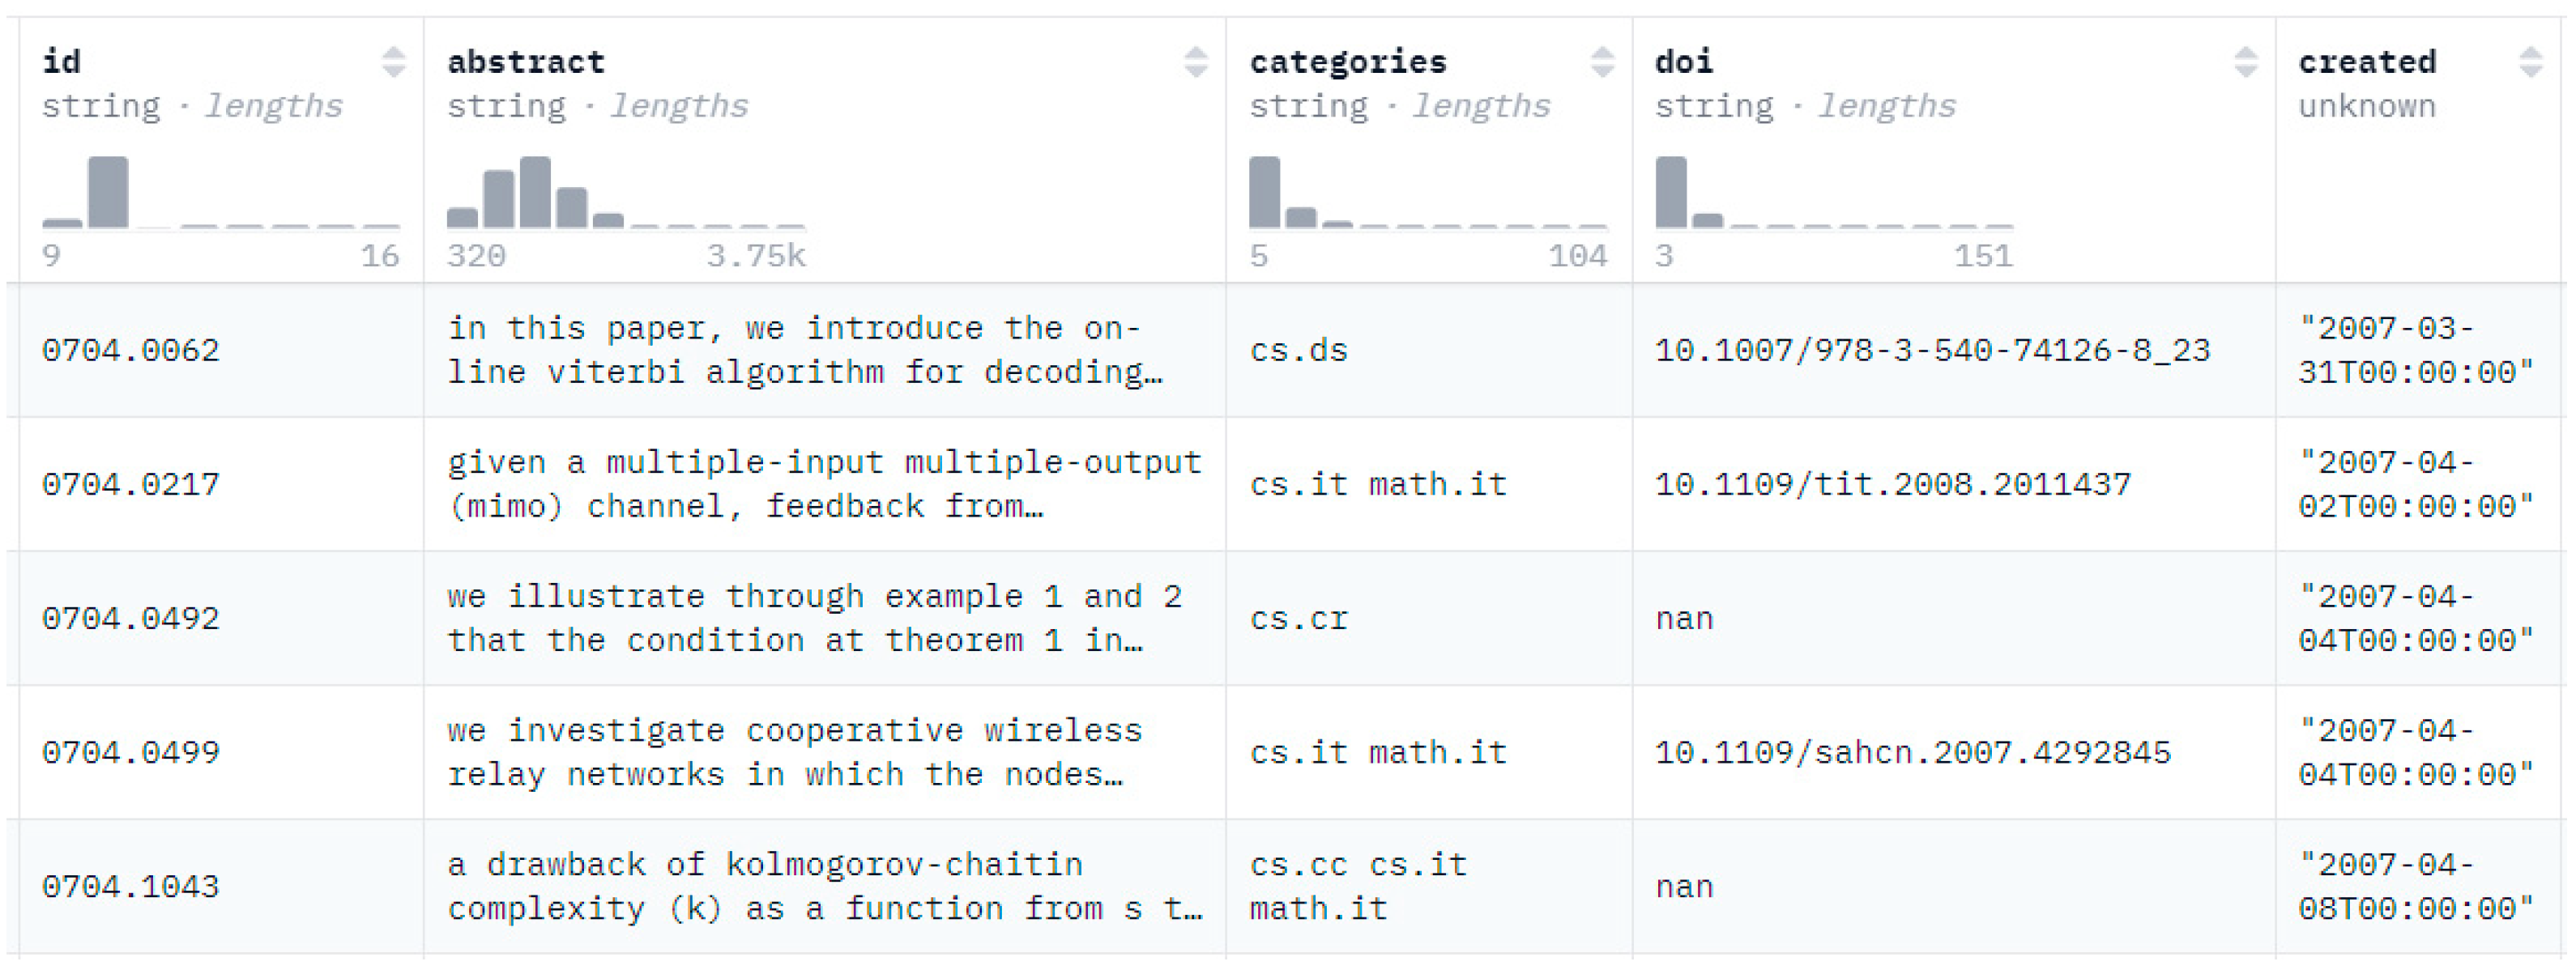
3.1.2. Text Corpus
- -
- Time period: 2010–2023;
- -
- Average abstract length: 956 characters.
- -
- Article title;
- -
- Unique identifier;
- -
- Abstract text;
- -
- arXiv categories;
- -
- DOI identifier;
- -
- Submission and last update dates;
- -
- Authors’ list;
- -
- Link to full text;
- -
- Abstract length;
- -
- Sequential identifier.
3.2. Keyword Extraction Process
- Inconsistent availability—many papers lacked author-defined keywords entirely.
- Format variations—similar concepts were expressed differently across papers, for example:
- -
- ‘UAV monitoring’, ‘drone monitoring’, ‘UAV-based monitoring’;
- -
- ‘environmental sensing’ versus ‘environmental monitoring’;
- -
- Various forms of hyphenation and compound terms.
- Semantic gaps—important related concepts were often missing.
- Analyze the provided keywords from documents within the topic.
- Identify the most representative and recurring keywords.
- Exclude any variations of ‘UAV’, ‘unmanned aerial vehicle’, or ‘drones’. For multi-word keywords, split them into single words that are commonly recognized in the field.
- Select the top five keywords that best capture the essence of the topic, ensuring they are single words.
- Format Keywords: List the selected keywords in this format: [“keyword1”, “keyword2”, “keyword3”, “keyword4”, “keyword5”].
- Provide Keywords Only: Respond with the formatted list of keywords, without any additional sentences or explanations”.
- Relation to the research topic: keywords directly related to the main aspects of UAV applications for environmental monitoring were prioritized.
- Uniqueness: rare words and phrases that occurred in the abstracts of the selected articles were considered as more meaningful and more accurately reflecting the features of the document.
- Semantic cohesion: keywords that had a strong semantic connection with other keywords in the group were considered as more relevant.
3.2.1. Monitoring Air Pollution Using UAVs
- Particulate Matter (PM2.5, PM10): [particulate, aerosol, dust, smoke, particles, pm25, pm10, coarse, respirable];
- Greenhouse Gases (CO2, Methane): [co2, methane, carbon, greenhouse, warming, climate, radiative, absorption, anthropogenic, flux];
- Ozone: [ozone, smog, photochemical, tropospheric, stratospheric, precursors, ultraviolet, depletion, formation, oxidant];
- Nitrogen Oxides: [nox, nitrogen, combustion, photochemical, nitric, dioxide, acid, traffic, industrial, catalytic];
- Sulfur Dioxide: [so2, sulfur, acid, industrial, fossil, smelting, scrubber, volcanic, coal, power];
- Volatile Organic Compounds (VOCs): [vocs, hydrocarbons, solvents, evaporative, chemical, benzene, toluene, xylene, formaldehyde, acetone].
3.2.2. Monitoring Water Pollution Using UAVs
- Algal Blooms: [algae, eutrophication, cyanobacteria, chlorophyll, nutrients, phosphorus, nitrogen, hypoxia, toxins, phytoplankton];
- Chemical Pollutants: [pollutants, toxins, heavy, metals, pesticides, industrial, runoff, leaching, bioaccumulation, organic];
- Turbidity and Sedimentation: [turbidity, sediment, suspended, solids, clarity, erosion, particles, light, penetration, deposition];
- Oil Spills: [oil, petroleum, hydrocarbon, slick, dispersant, crude, tanker, spill, marine, coastal];
- Thermal Pollution: [thermal, temperature, cooling, discharge, power, plants, ecosystem, fish, stratification, biodiversity];
- Microplastics: [microplastics, plastic, debris, fragments, fibers, polymers, marine, freshwater, ingestion, accumulation].
3.2.3. Monitoring Surface Pollution Using UAVs
- Soil Contamination: [soil, contamination, heavy, metals, pesticides, herbicides, toxicity, remediation, leaching, erosion];
- Vegetation Stress: [vegetation, stress, chlorophyll, biomass, spectral, drought, nutrient, disease, crop, forest];
- Urban Heat Islands: [urban, heat, thermal, temperature, urbanization, albedo, energy, concrete, asphalt, microclimate];
- Waste Dumps: [waste, dumping, landfill, litter, debris, illegal, hazardous, municipal, industrial, recycling];
- Land Use Changes: [landuse, deforestation, urbanization, agriculture, desertification, habitat, fragmentation, ecosystem, biodiversity, development];
- Erosion and Sedimentation: [erosion, sedimentation, topsoil, runoff, gully, rill, wind, water, coastal, desertification].
3.2.4. Causes of Environmental Pollution
- Industrial Emissions: [industrial, factory, manufacturing, smokestacks, effluents, chemical, production, processing, refineries, smelting];
- Agricultural Activities: [agriculture, pesticides, fertilizers, runoff, livestock, irrigation, monoculture, deforestation, agrochemicals, erosion];
- Transportation and Vehicle Emissions: [transportation, vehicles, exhaust, traffic, fossil, fuels, particulates, combustion, diesel, gasoline];
- Urban Development: [urban, development, construction, infrastructure, impervious, sprawl, housing, roads, demolition, landfills];
- Waste Management and Disposal: [waste, disposal, landfills, incineration, sewage, recycling, hazardous, electronic, plastic, leachate];
- Energy Production: [energy, power, plants, fossil, fuels, coal, oil, gas, nuclear, thermal].
3.2.5. Challenges in Environmental Monitoring Using UAVs
- Flight Time Limitation: [battery, endurance, power, consumption, range, duration, energy, efficiency, payload, weight];
- Sensor Accuracy and Calibration: [accuracy, calibration, precision, sensor, drift, error, correction, validation, measurement, reliability];
- Weather and Environmental Conditions: [weather, wind, rain, temperature, humidity, atmospheric, conditions, stability, interference, performance];
- Regulatory Restrictions: [regulations, laws, restrictions, permits, airspace, safety, privacy, certification, compliance, authorization];
- Data Processing and Interpretation: [data, processing, interpretation, analysis, algorithms, software, visualization, integration, modeling, classification];
- Operational Challenges: [logistics, deployment, maintenance, training, piloting, navigation, planning, coordination, communication, recovery].
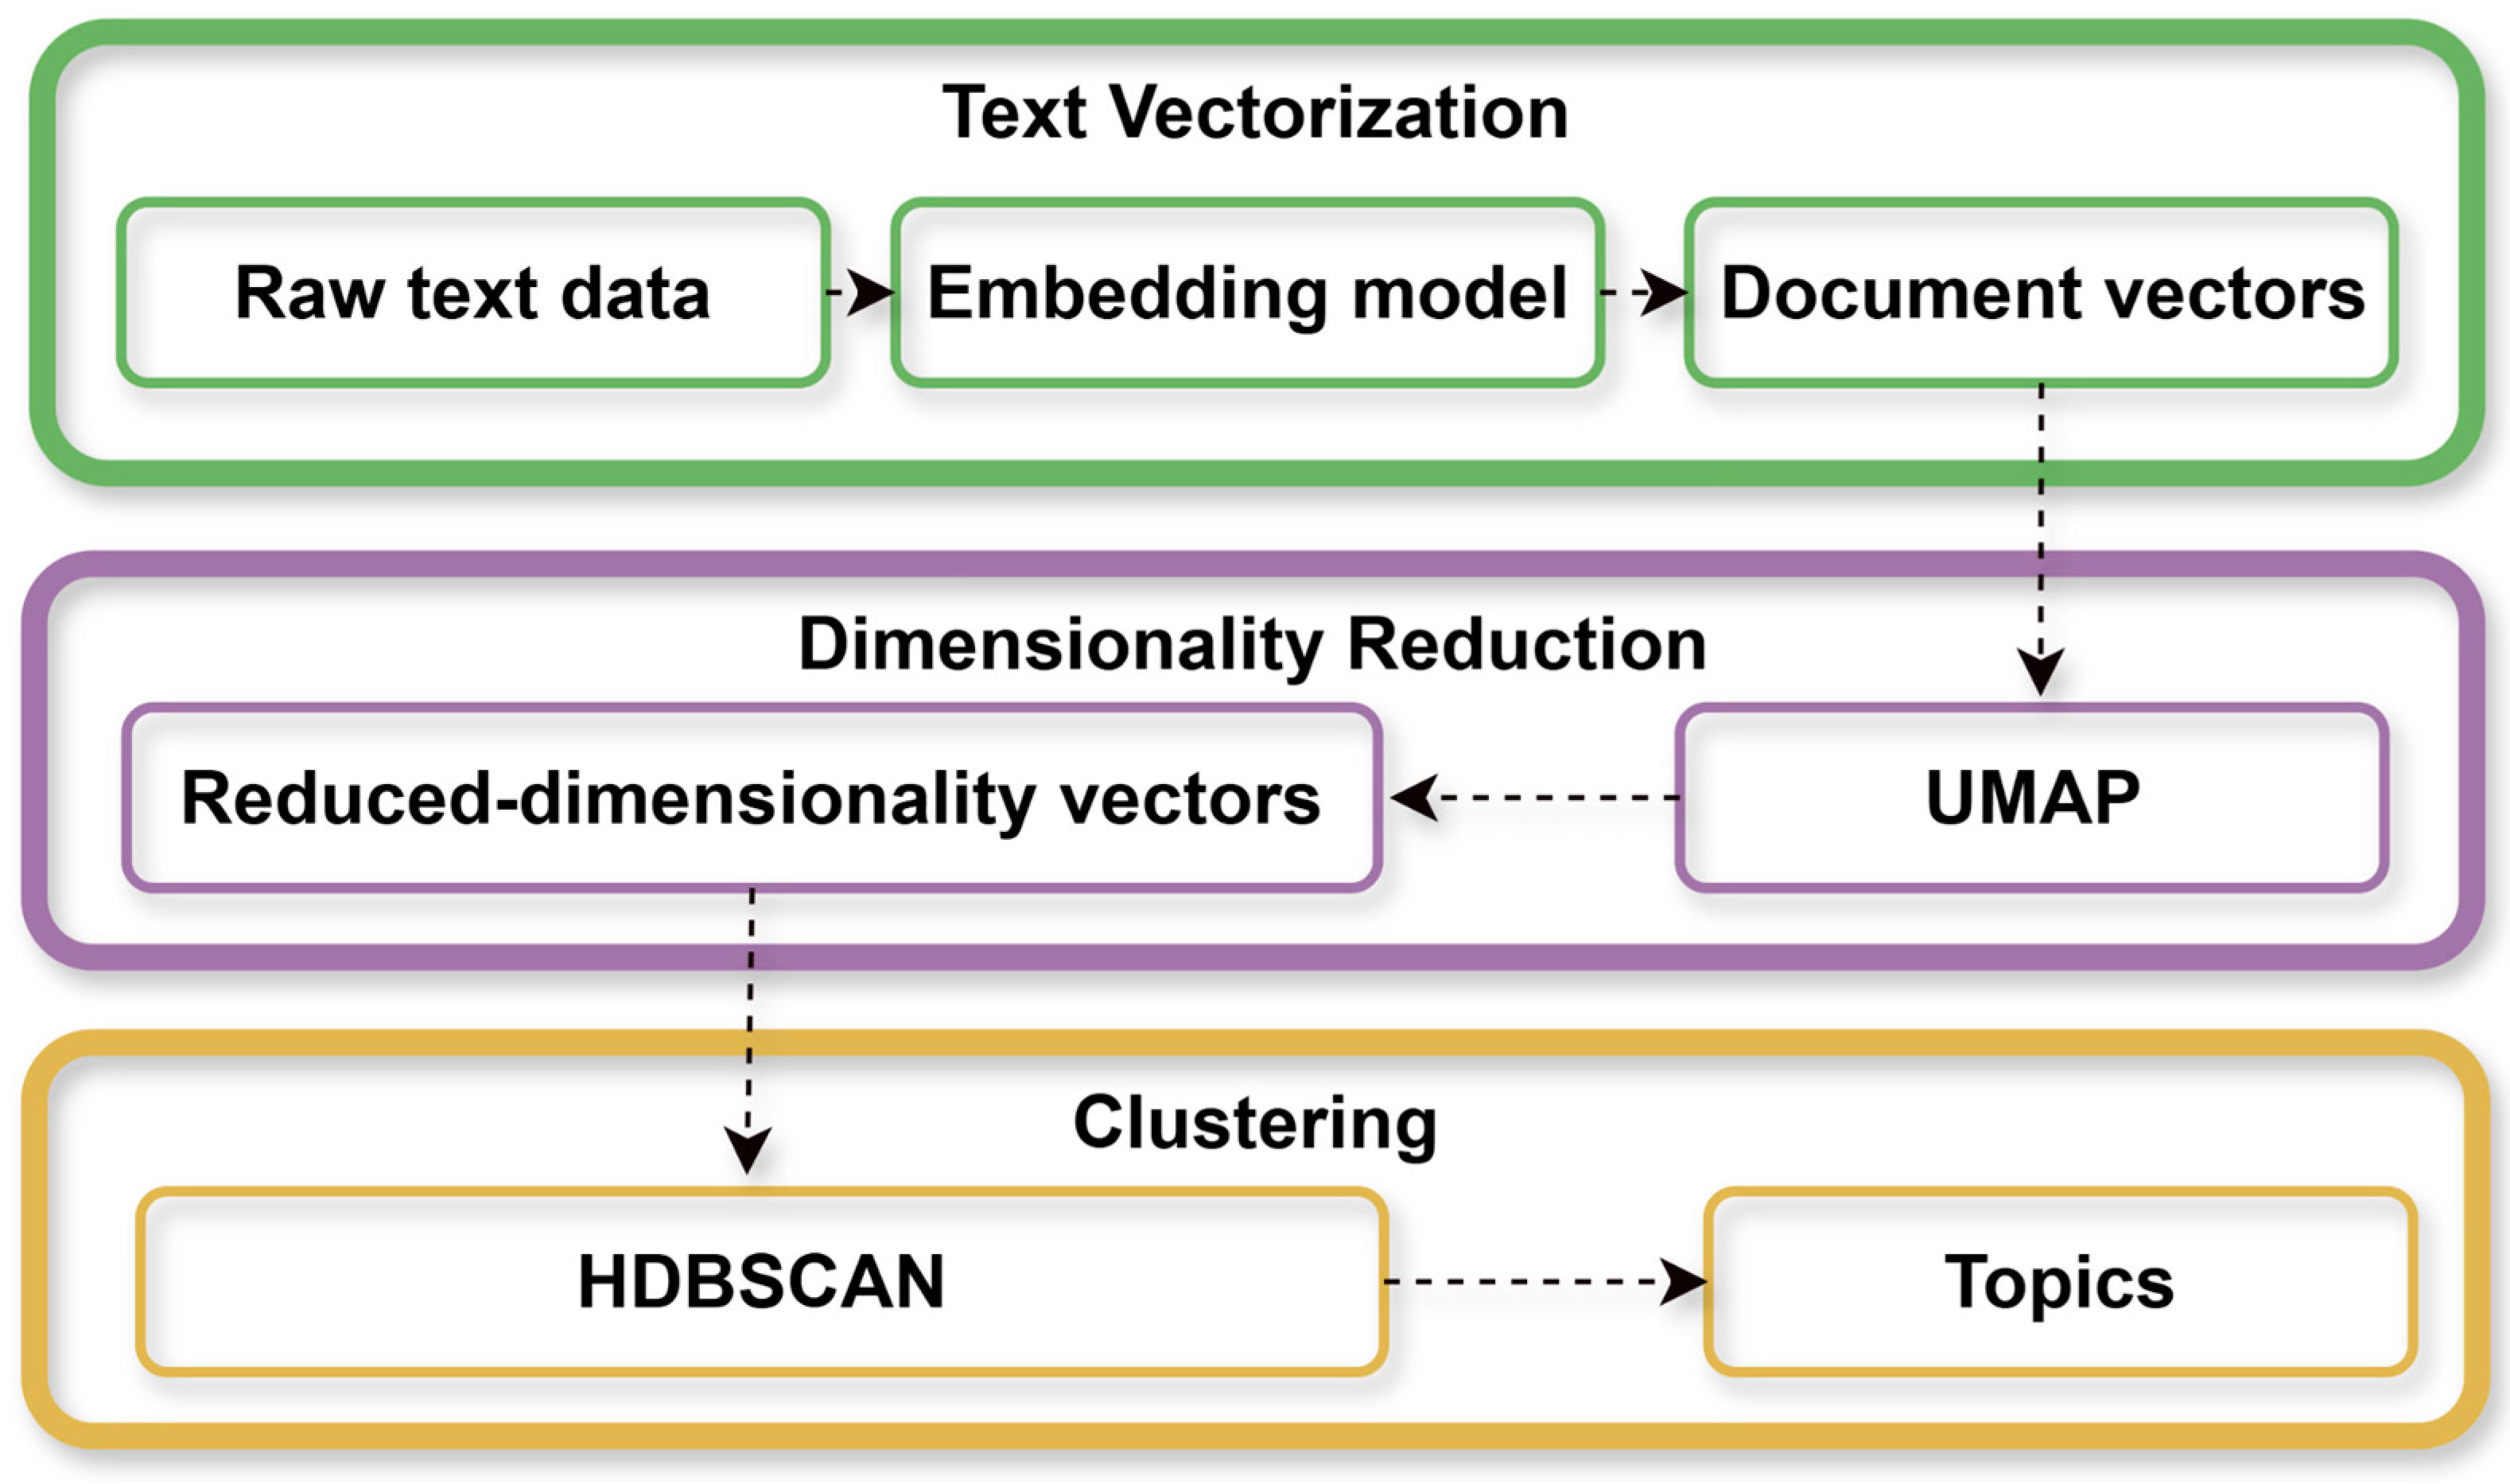
3.3. Topic Modeling
- Text Vectorization: Top2Vec can use pre-trained models of vector text representation such as Doc2Vec (Le & Mikolov, 2014), BERT Sentence Transformer (Reimers & Gurevych, 2019) or universal sentence encoder (USE) (Cer et al., 2018) to convert the documents and words into vectors. Formally, for example, is the set of documents, and is the set of unique words in these documents. The Top2vec algorithm first creates a joint vector space for documents and words. In this space, each document and each word are represented by vectors and , respectively. These vectors are generated so that semantically similar documents and words are close to each other in the vector space. In the current implementation, USE has been used to obtain the vector representations.
- Dimensionality reduction: After text vectorization, Top2Vec uses the UMAP (Uniform Manifold Approximation and Projection) (McInnes et al., 2018) algorithm to reduce the dimensionality of document vectors . This simplifies the spatial structure of the data, which facilitates subsequent clustering and visualization.
- Clustering: The final stage applies the HDBSCAN (Hierarchical Density-Based Spatial Clustering of Applications with Noise) clustering algorithm (McInnes et al., 2017) to identify dense regions in the reduced document space. HDBSCAN functions by computing a hierarchical cluster tree based on density-connectivity, extracting clusters using a density threshold λ, and assigning points to clusters or marking them as noise. Each dense region represents a group of documents that are closely related to each other in terms of meaning (topical or semantic cluster). For each dense region determined in the previous step, Top2Vec computes the centroid of document vectors in the original vector space. This centroid serves as a topic vector of the semantic cluster representing the average position of documents within a topic group. For each topic vector, the nearest words in the vector space of words are found, which become the keywords of that topic. The set of topic keywords can be defined as follows:where is distance metric in vector space, and is a threshold value for selecting the closest words. These words help to interpret the content of the semantic cluster.
3.4. Analysis of the Dynamics of Publication Activity Within the Topic Groups
- Capture non-linear trends in publication activity;
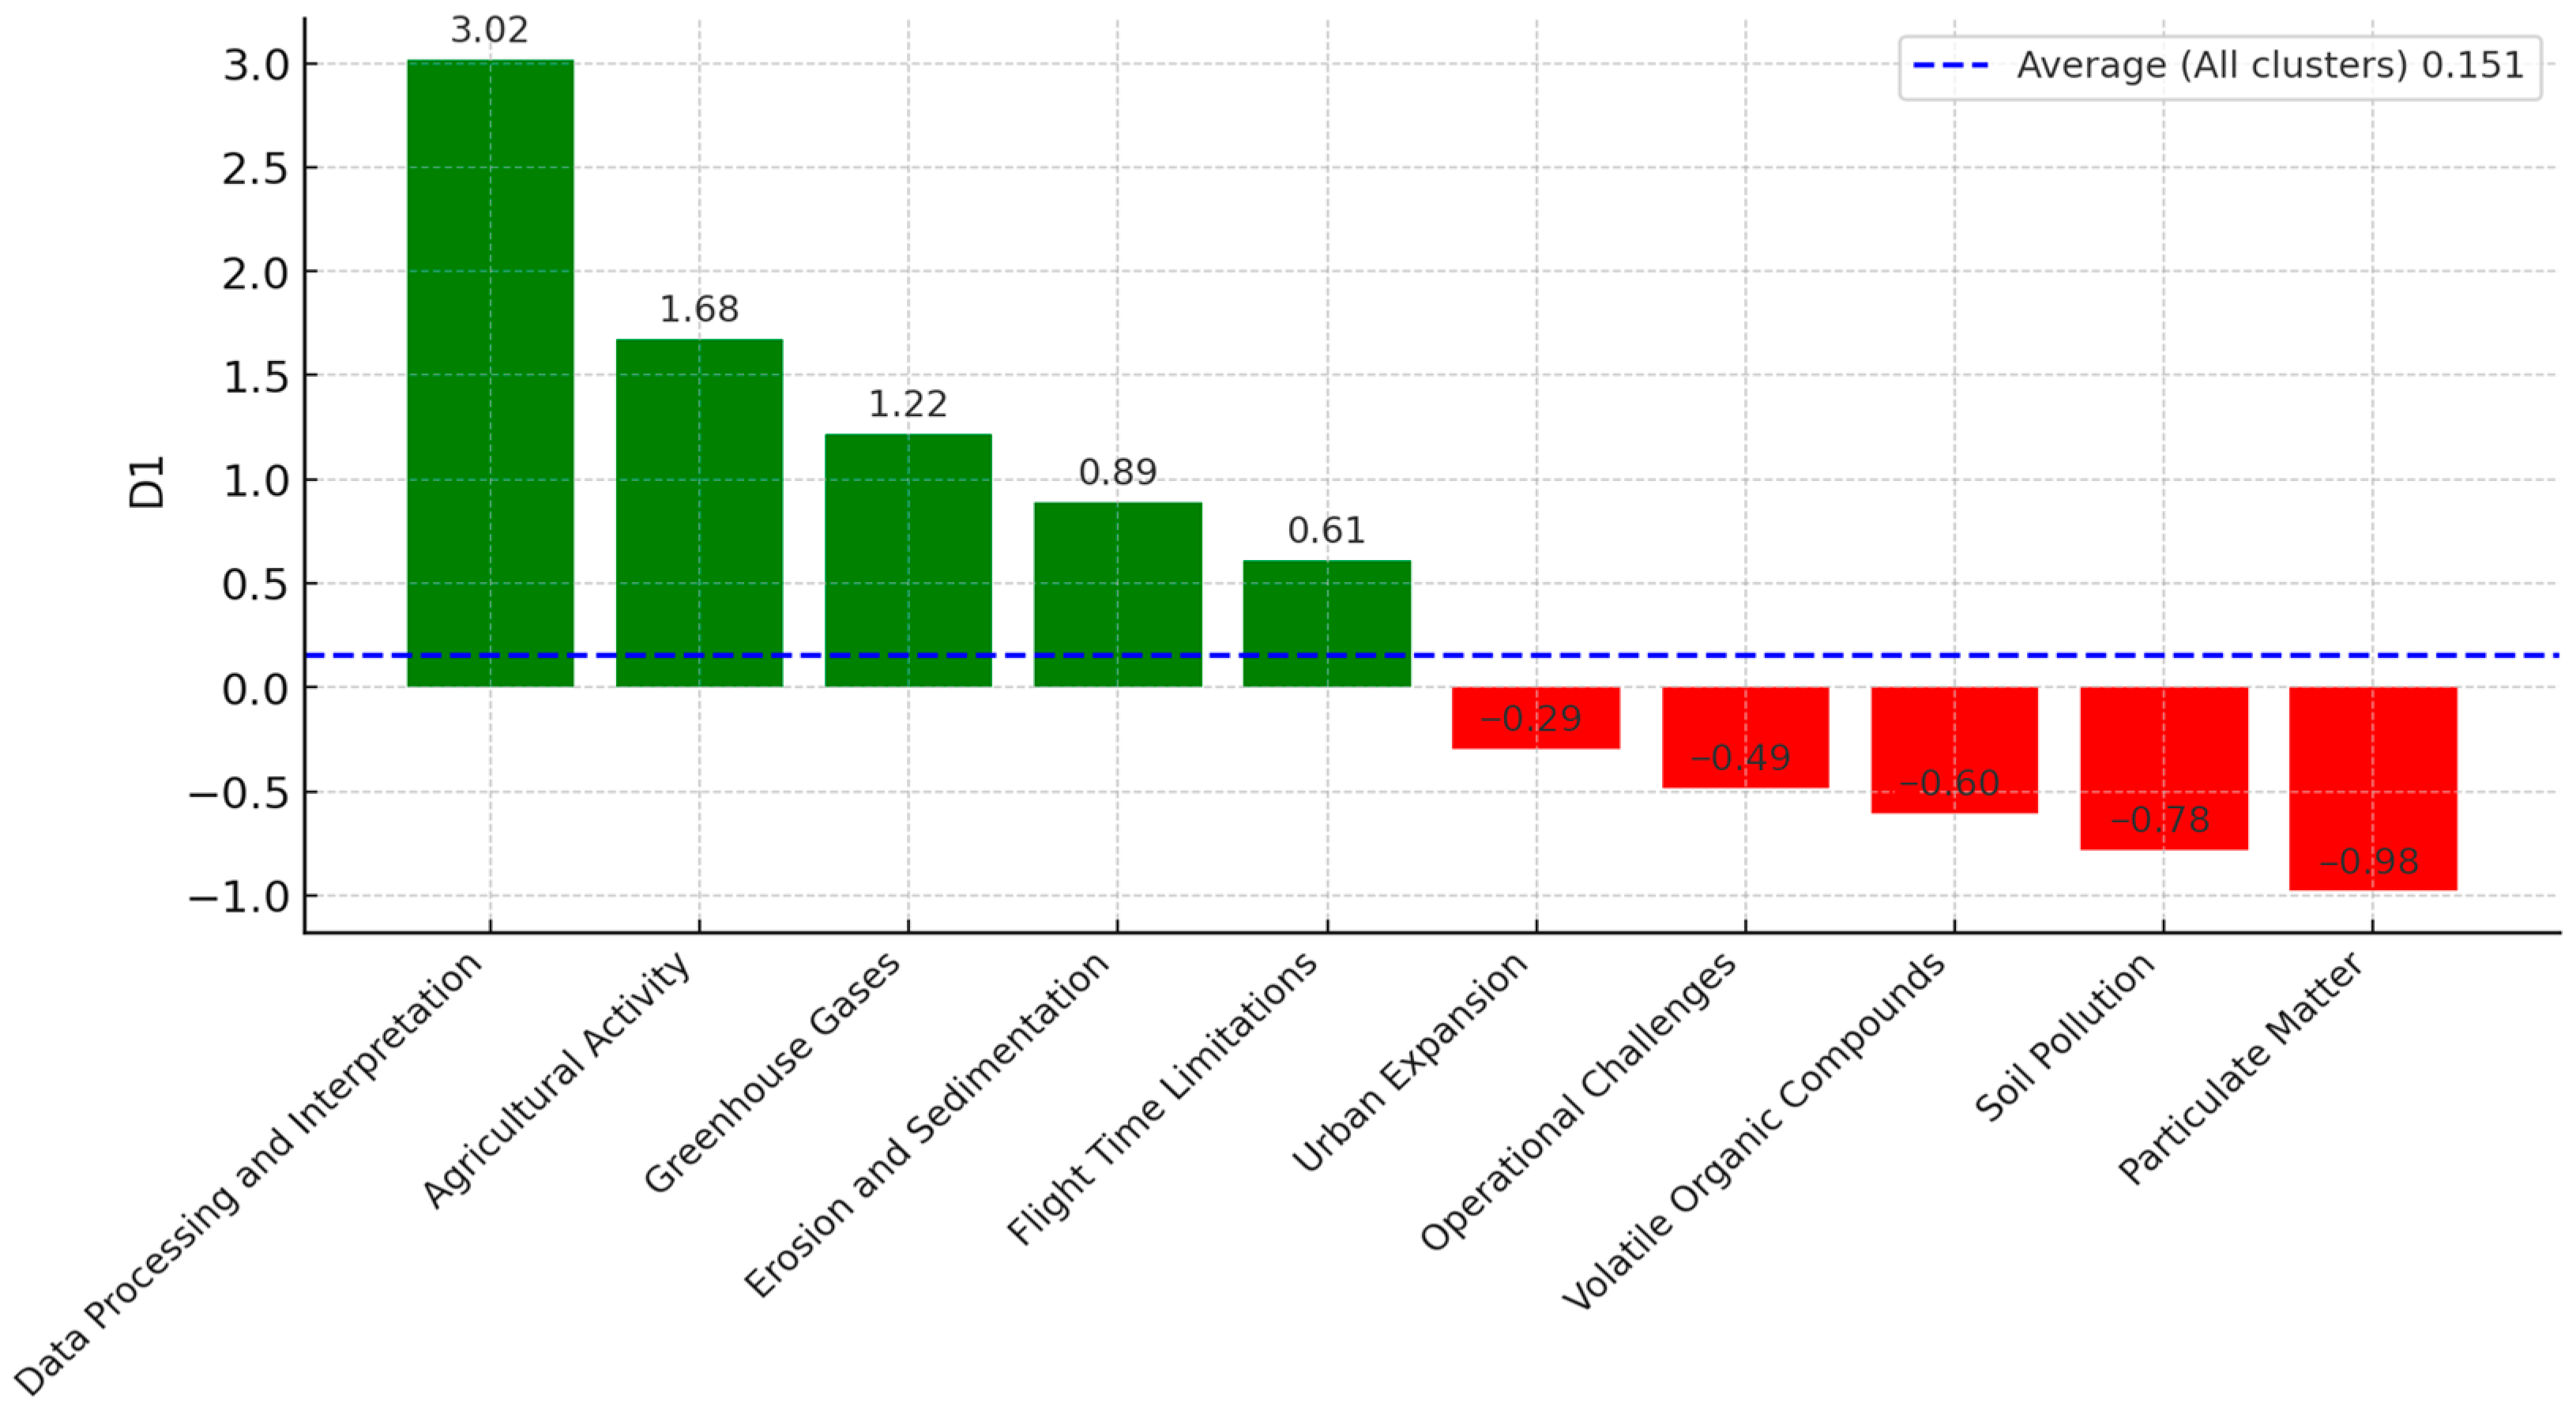
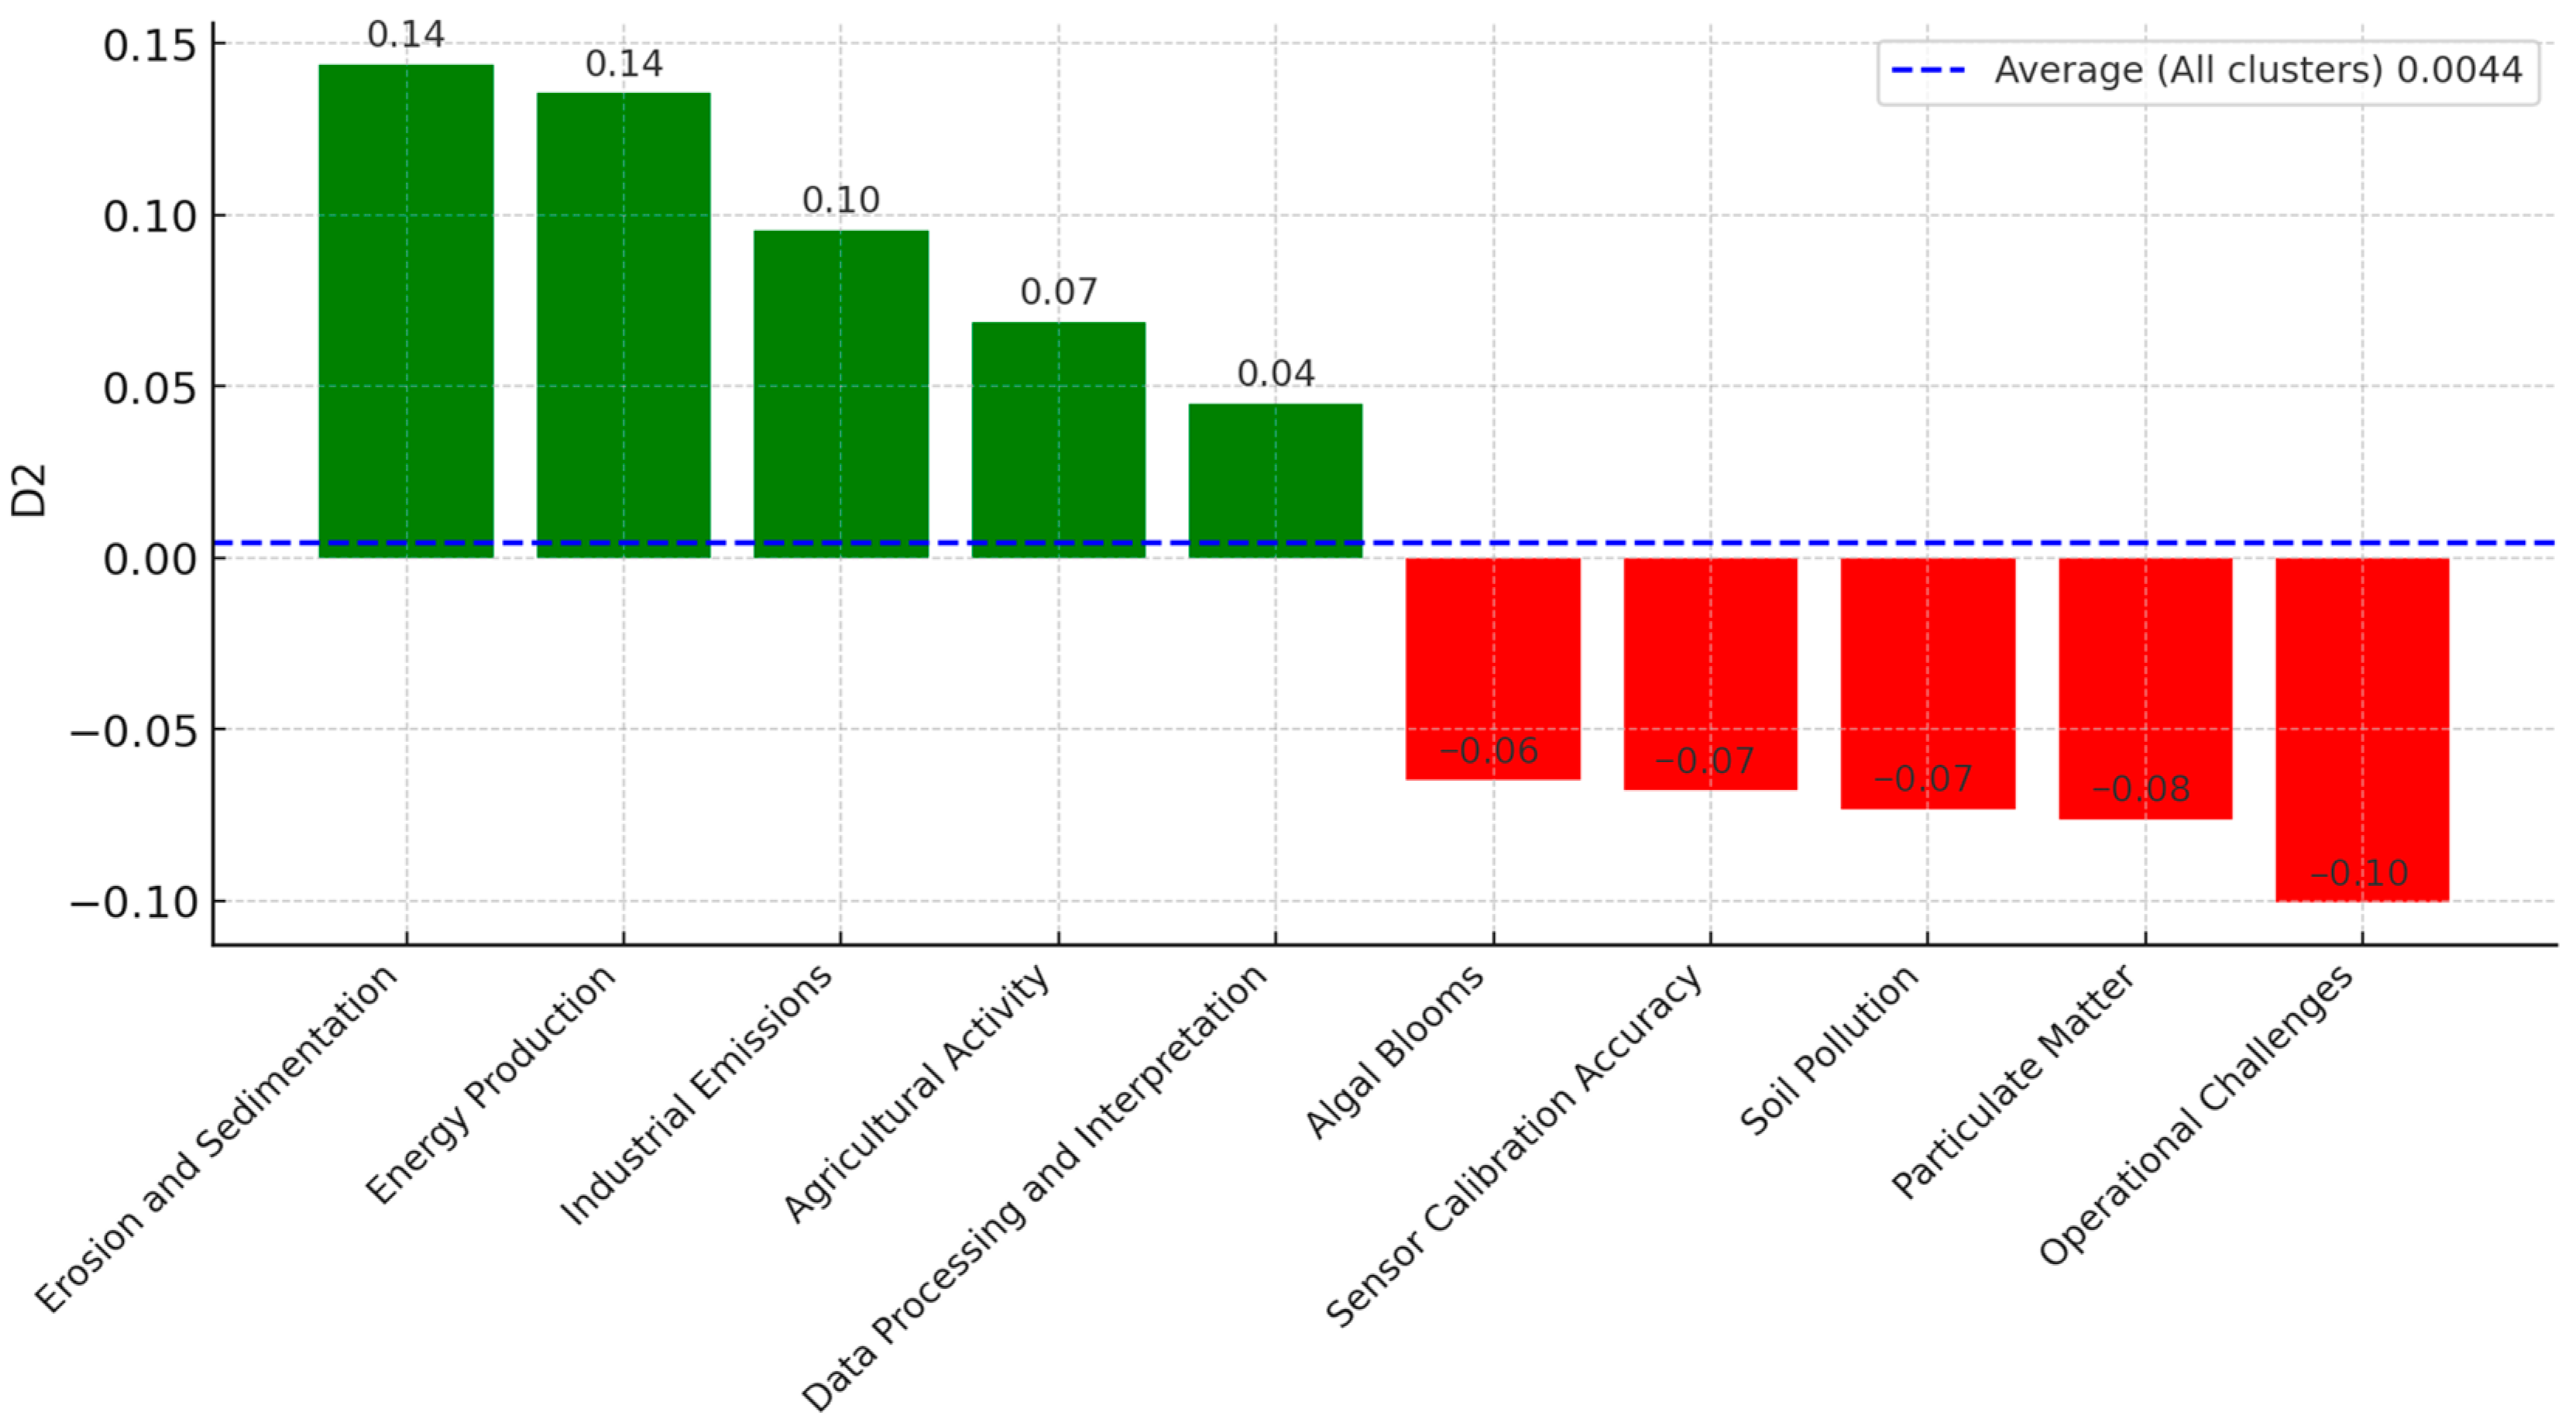
- Calculate the rate (D1) and acceleration (D2) of change in the number of publications through derivatives;
- Make predictions about future research trends.
- The maximum degree of the polynomial in the search process was limited to the number 15.
- Data were split into 5 parts using the TimeSeriesSplit method to estimate models using cross-validation.
- Accuracy for all regression degrees from 1 to 15 was estimated as the mean of the mean square error (MSE) across all 5 parts.
- The value of the degree with the minimum obtained MSE was selected.
4. Results
5. Discussion
- The method is based only on the calculation of the dynamics of publication activity without taking into account the number of citations of articles, authors’ characteristics, and their interrelation.
- The original corpus of texts was limited to abstracts of articles obtained from the arXiv platform. While this provided a good basis for analysis, expanding the corpus to include data from other scientific journals and databases could have improved representativeness.
- Using Top2vec for topic modeling leads to the following challenges:
- Too many topics may arise, each requiring detailed examination and analysis.
- The algorithm may generate outliers, in other words, topics with no clear semantic cohesion or relevance.
- Each document in the model relates to only one topic, making it difficult to evaluate cross-disciplinary research.
- There are no objective metrics to evaluate the quality of the resulting topics, making it difficult to verify the results.
- There is a risk of subjectivity in the interpretation of topic groups, since the selection and description of themes may depend on the expert’s opinion.
- The study did not formally validate the topics using external data or comparisons with other studies, which limits confidence in their reliability and universality.
- Top2vec was not compared with other topic modeling methods.
6. Conclusions
- Air pollution monitoring:
- The greatest growth is seen in research devoted to greenhouse gases. Other areas, such as the monitoring of volatile organic compounds and particulate matter, show slower growth in publications.
- Water pollution monitoring:
- Research on thermal pollution continues to gain progress, showing a steady increase in publications. Topics related to microplastics and chemical pollutants are also evolving. Such areas as oil spills show declining interest.
- Surface contamination monitoring:
- Erosion and sedimentation are the fastest-growing areas among surface pollution studies. Land use change and soil contamination remain active, but the rate of growth of publications in these areas is declining.
- Causes of environmental pollution:
- Agricultural activities, energy production, and industrial emissions continue to attract the attention of researchers, showing a steady increase in the number of publications. Emissions from vehicles show a slight decrease in interest.
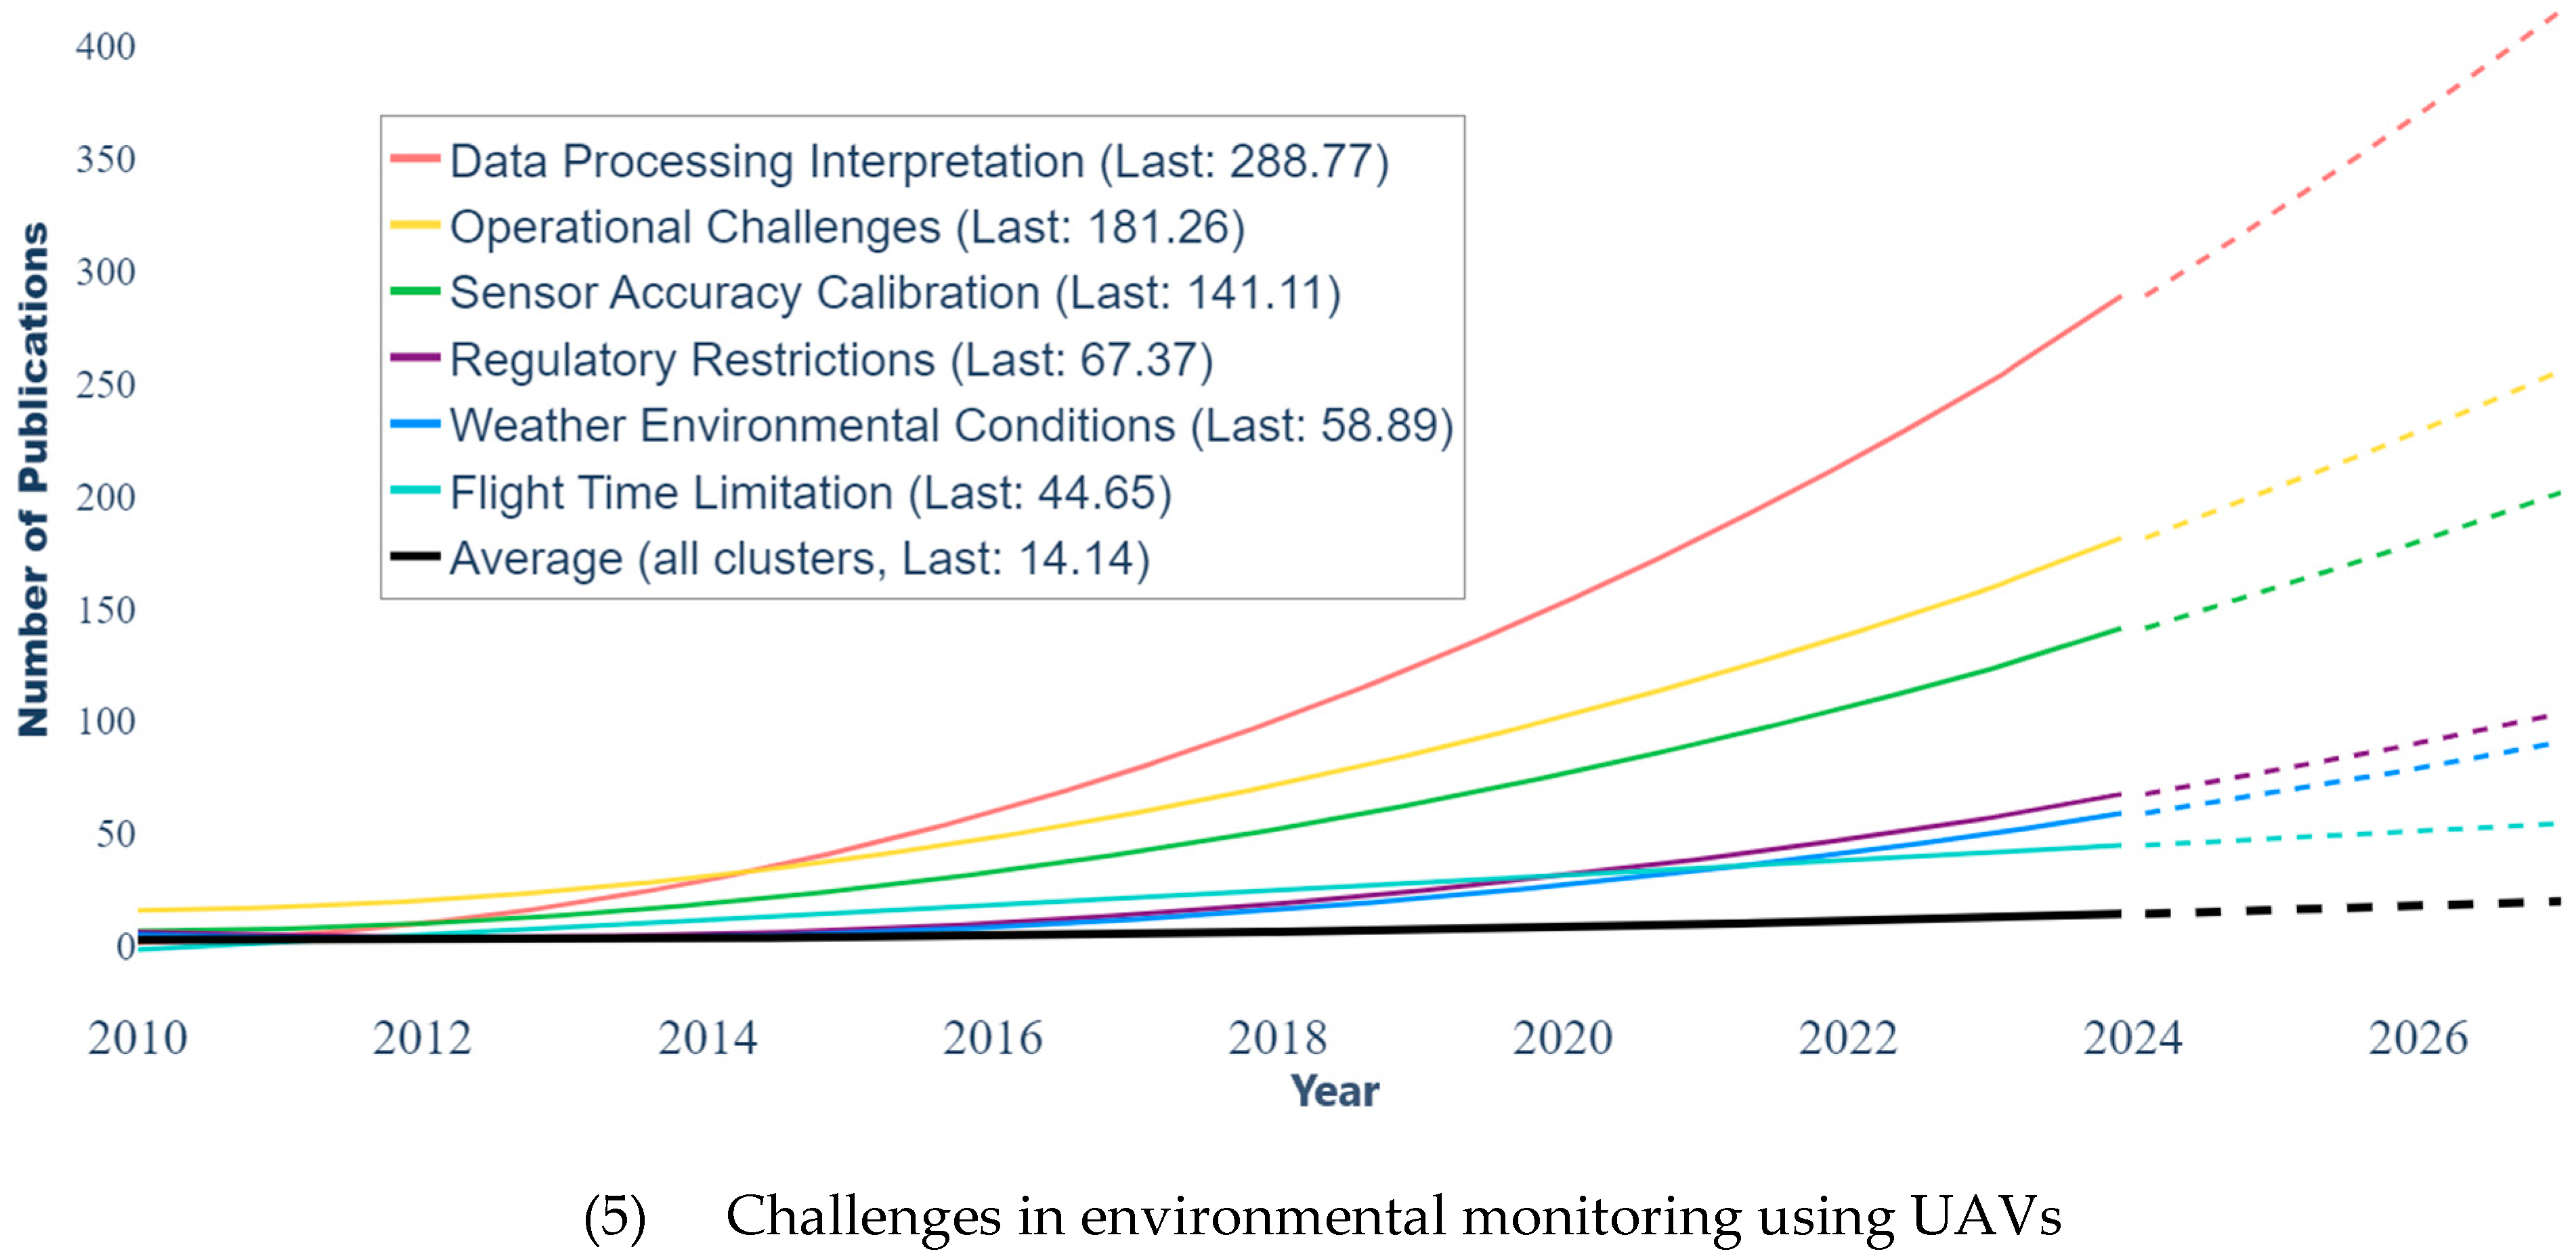
- Challenges in environmental monitoring with UAV employment:
- Data processing and interpretation and increasing flight time remain the most actively developing areas. Regulatory constraints and weather conditions remain relevant, but the pace of publications in these areas has slowed.
- Expand the corpus of texts to increase the representativeness of the analysis by including publications from other scientific journals and databases, and also use full-text articles in addition to abstracts.
- Apply various topic modeling methods to compare their performance, such as LDA, BERTopic, and others.
- Perform topic validation to improve the reliability of the results using external data or expert judgment.
- Explore the relationships between topics for a better comprehension of the topic structure of scientific publications. This will help to identify the potential interdisciplinary research areas.
- Analyze the impact of new technologies on topic trends and research directions in environmental monitoring.
Supplementary Materials
Author Contributions
Funding
Data Availability Statement
Conflicts of Interest
Appendix A. Additional Dataset Statistics

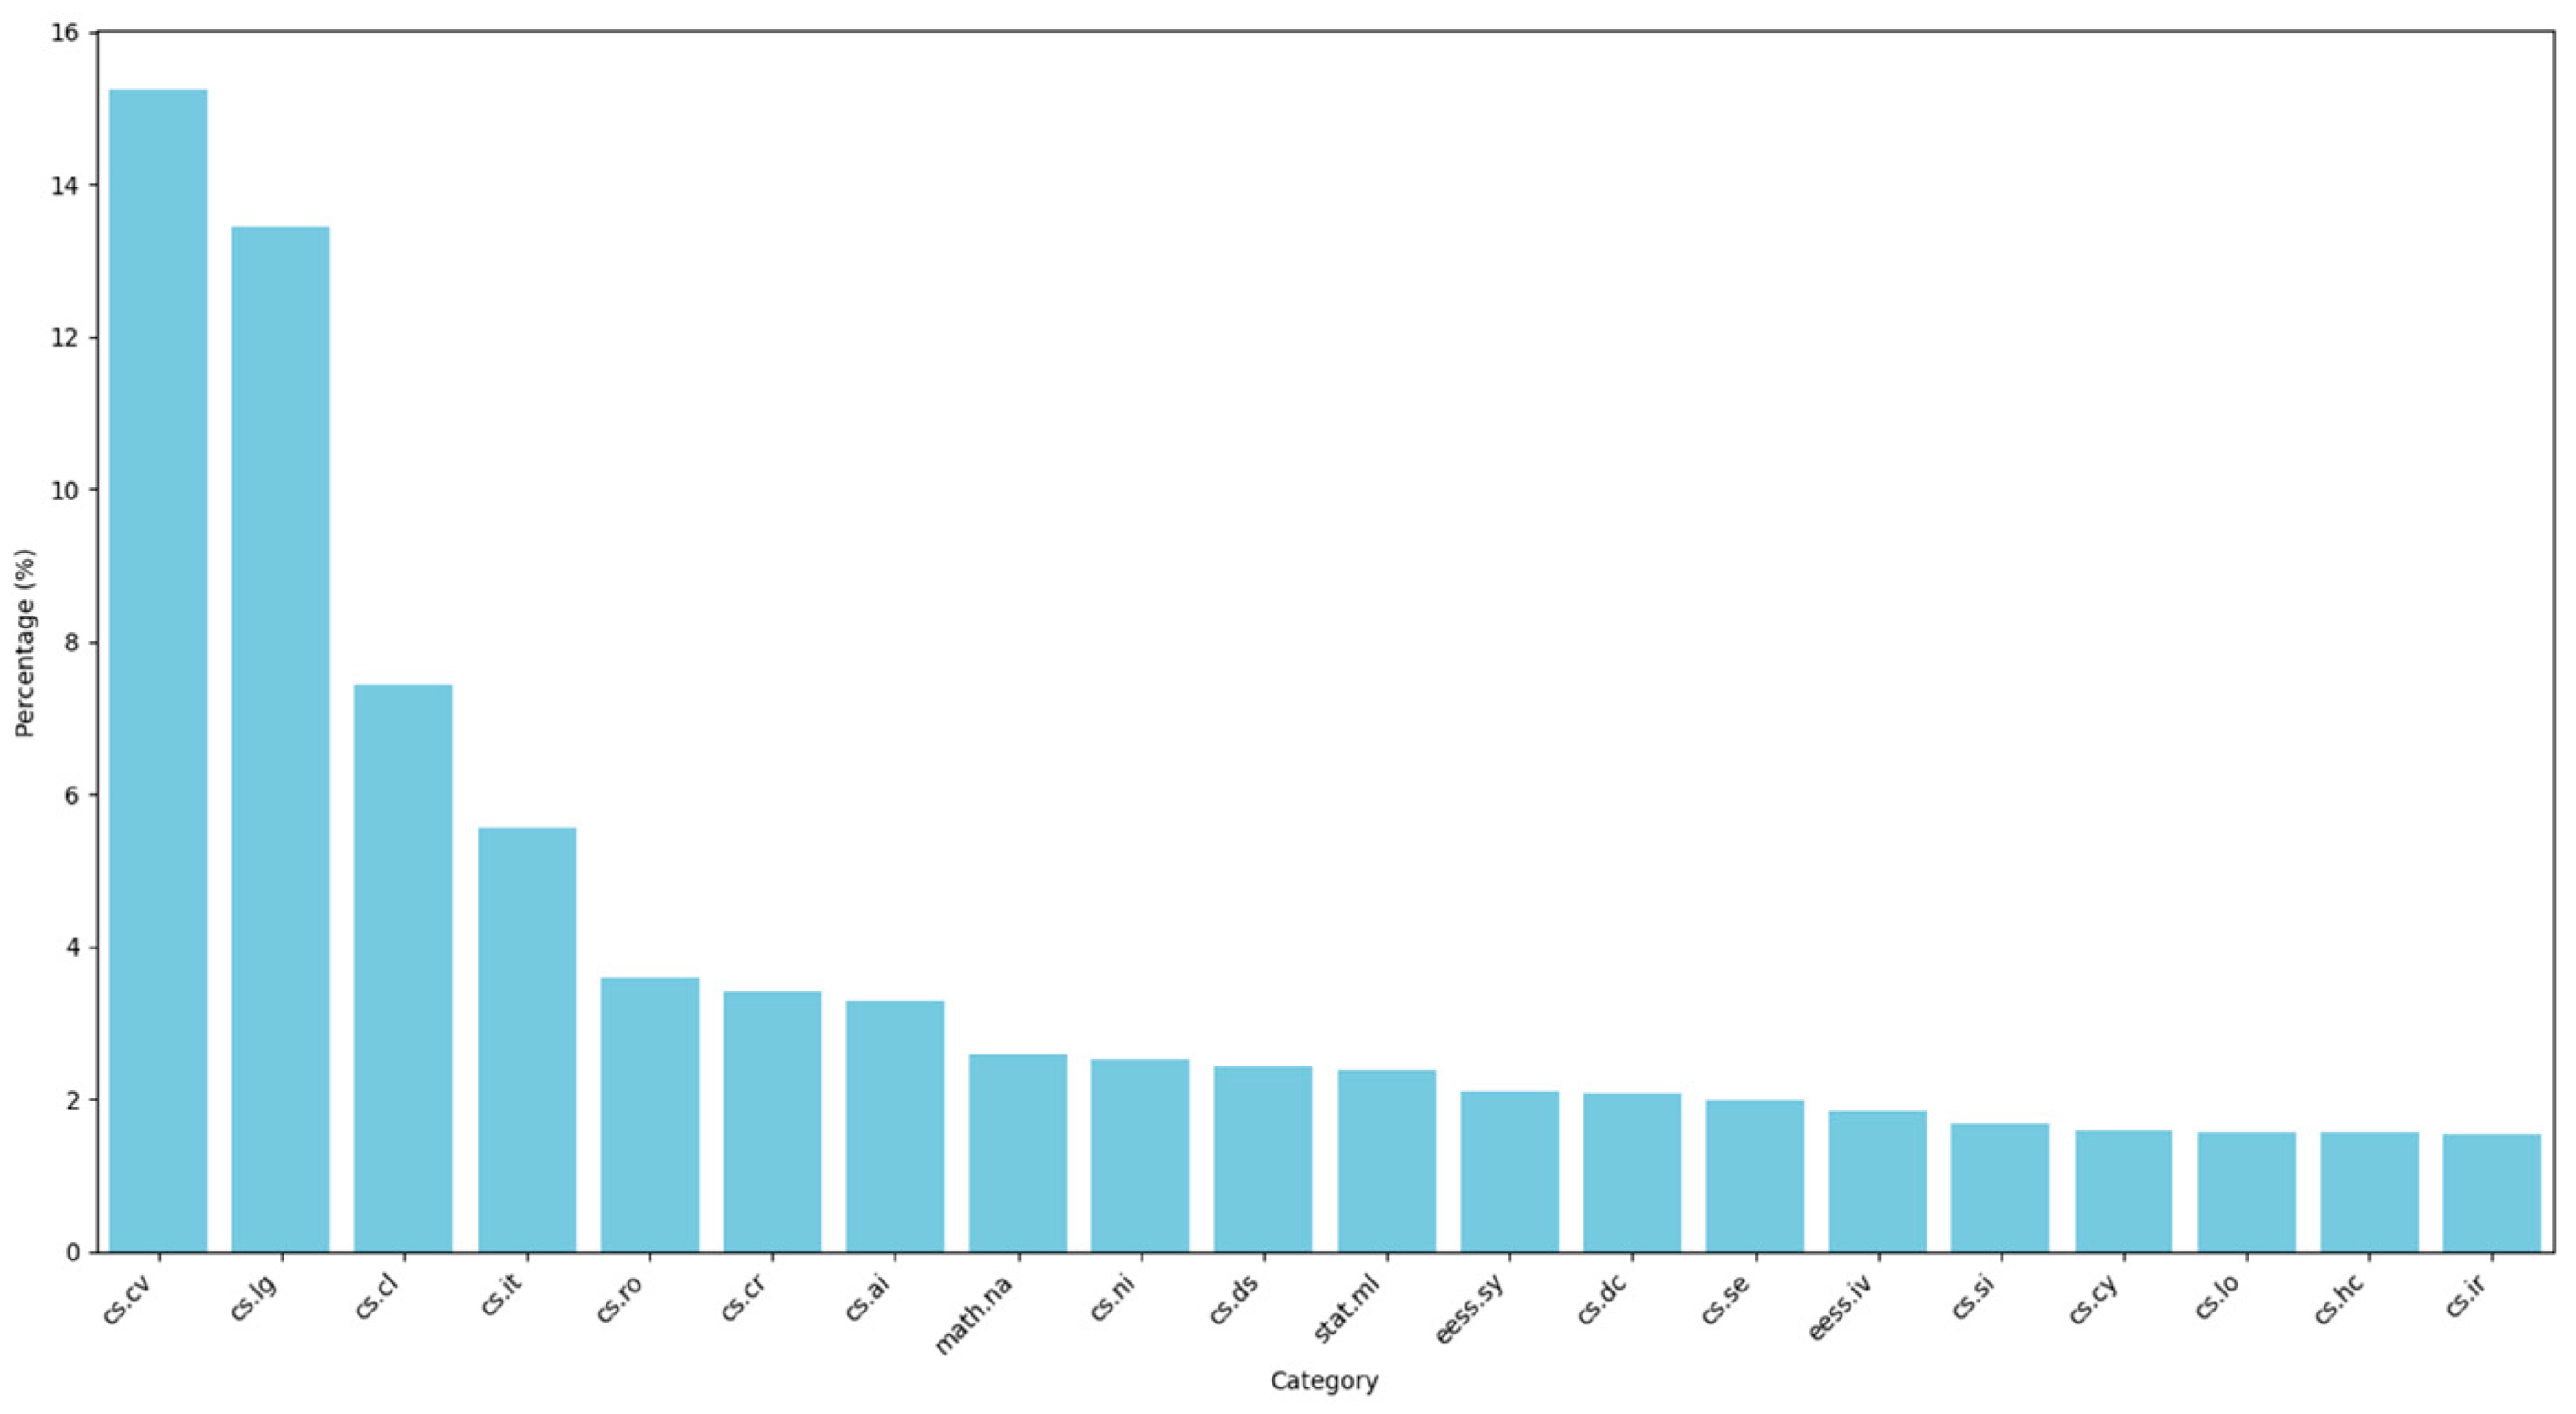
| Rank | Category | Count | Percentage (%) |
|---|---|---|---|
| 1 | cs.cv | 84,656 | 15.24 |
| 2 | cs.lg | 74,650 | 13.44 |
| 3 | cs.cl | 41,216 | 7.42 |
| 4 | cs.it | 30,811 | 5.55 |
| 5 | cs.ro | 19,967 | 3.59 |
| 6 | cs.cr | 18,929 | 3.41 |
| 7 | cs.ai | 18,247 | 3.28 |
| 8 | math.na | 14,335 | 2.58 |
| 9 | cs.ni | 13,997 | 2.52 |
| 10 | cs.ds | 13,469 | 2.42 |
| 11 | stat.ml | 13,181 | 2.37 |
| 12 | eess.sy | 11,607 | 2.09 |
| 13 | cs.dc | 11,583 | 2.08 |
| 14 | cs.se | 11,066 | 1.99 |
| 15 | eess.iv | 10,186 | 1.83 |
| 16 | cs.si | 9331 | 1.68 |
| 17 | cs.cy | 8845 | 1.59 |
| 18 | cs.lo | 8705 | 1.57 |
| 19 | cs.hc | 8700 | 1.57 |
| 20 | cs.ir | 8583 | 1.54 |
Appendix B. Tuning the Parameters of Top2vec Algorithm
- Learning speed: In the course of experiments, it was decided to use the “learn” mode for the learning speed parameter, since no significant differences were observed between the “fast-learn”, “learn”, and “deep-learn” modes in the context of this study. The “learn” mode represents a balanced option that provides sufficient vector quality with acceptable learning time.
- Embedding model: The “universal sentence encoder” model was used.
- Additional parameters for dimensionality reduction (UMAP) and clustering (HDBSCAN) algorithms were configured as follows:
- UMAP:
- n_neighbors = 15: Number of nearest neighbors used to evaluate local and global data structure.
- n_components = 5: Number of dimensions in the reduced dimensionality space.
- Metric = ‘cosine’: Distance metric used to compute distances between points in the original space.
- min_dist = 0.0: Minimum distance between points in the reduced dimension space.
- random_state = 42: Value for reproducibility of results.
- HDBSCAN:
- min_cluster_size = 15: Minimum cluster size, which defines the threshold value for cluster formation.
- Metric = ‘cosine’: A distance metric used to determine the proximity of points during clustering.
- cluster_selection_method = ‘eom’: The cluster selection method that defines the way to select a representative for each cluster.
Appendix C. Snippet of the Polynomial Model Code
| … def calc_polynomial_model(df, degree, x_range): # Prepare data x = df[‘year’].values.reshape(−1, 1) y = df[‘counts’].values # Create polynomial features poly = PolynomialFeatures(degree) x_poly = poly.fit_transform(x) # Fit linear regression on polynomial features model = LinearRegression().fit(x_poly, y) y_fit = model.predict(x_poly) # Calculate derivatives using numpy’s polyfit and polyder coefs = np.polyfit(x.flatten(), y_fit, degree) poly_der1 = np.polyder(coefs) # First derivative poly_der2 = np.polyder(poly_der1) # Second derivative return poly_der1, poly_der2, y_fit, model, poly … |
Appendix D. Indicators of Publication Activity and Number of Publications in 2023
| Domain | Topic Group | D1 | D2 | Number of Publications |
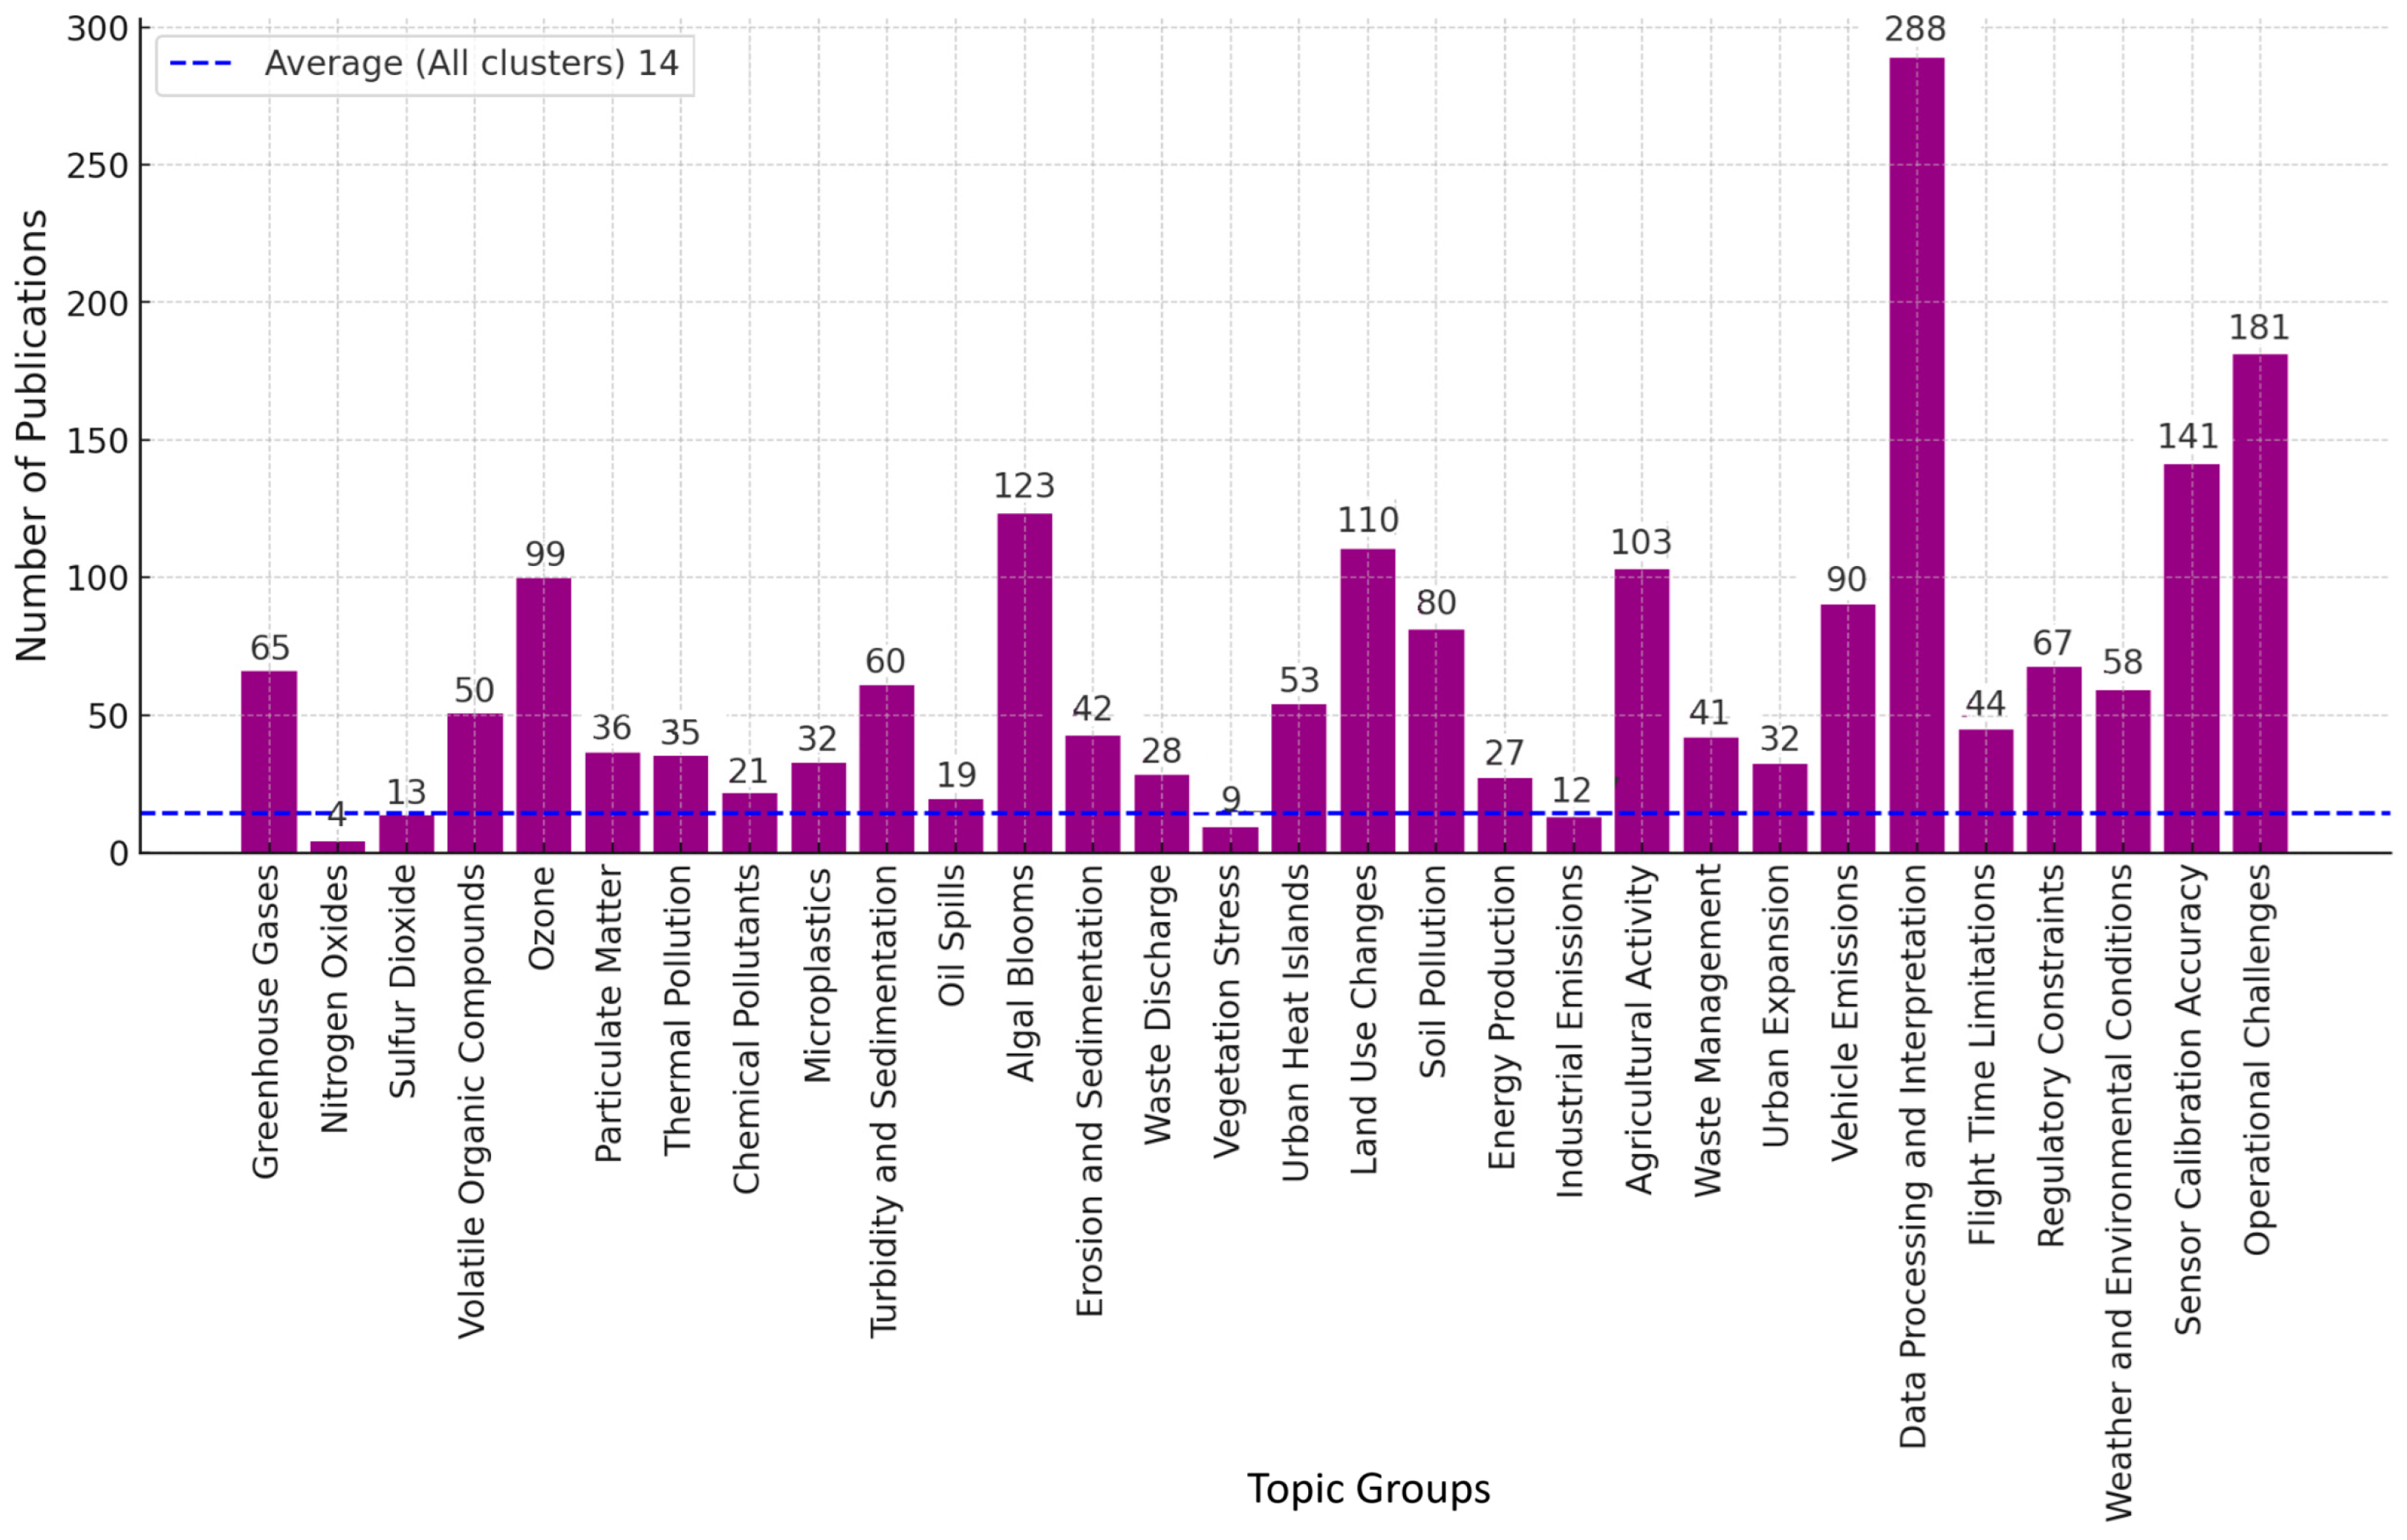
| Mean value (all 690 clusters) | 0.151 | 0.0044 | 14.14 | |
| Air pollution | Greenhouse gases | 1.218 | 0.0397 | 65.93 |
| Nitrogen oxides | 0.003 | −0.0005 | 4.06 | |
| Sulfur dioxide | −0.241 | −0.0200 | 13.42 | |
| Volatile organic compounds | −0.603 | −0.0483 | 50.40 | |
| Ozone | −0.013 | −0.0547 | 99.58 | |
| Particulate matter | −0.979 | −0.0762 | 36.44 | |
| Water pollution | Thermal pollution | 0.577 | 0.0047 | 35.17 |
| Chemical contaminants | 0.299 | 0.0023 | 21.43 | |
| Microplastics | 0.372 | 0.0010 | 32.61 | |
| Turbidity and sedimentation | 0.497 | −0.0034 | 60.99 | |
| Oil spills | −0.110 | −0.0045 | 19.53 | |
| Algal blooms | −0.077 | −0.0649 | 123.09 | |
| Surface pollution | Erosion and sedimentation | 0.887 | 0.1438 | 42.64 |
| Waste disposal | 0.220 | 0.0277 | 28.28 | |
| Vegetation stress | 0.097 | −0.0005 | 9.21 | |
| Urban heat islands | 0.312 | −0.0181 | 53.92 | |
| Land use change | 0.407 | −0.0209 | 110.23 | |
| Soil contamination | −0.779 | −0.0733 | 80.83 | |
| Causes of pollution | Energy production | 0.312 | 0.1354 | 27.13 |
| Industrial emissions | 0.236 | 0.0956 | 12.67 | |
| Agricultural activities | 1.675 | 0.0688 | 103.10 | |
| Waste disposal | 0.201 | −0.0147 | 41.82 | |
| Urban expansion | −0.294 | −0.0260 | 32.19 | |
| Vehicle emissions | 0.151 | −0.0379 | 90.23 | |
| Monitoring challenges | Data processing and interpretation | 3.016 | 0.0448 | 288.77 |
| Flight time restrictions | 0.608 | 0.0058 | 44.65 | |
| Regulatory restrictions | 0.541 | −0.0137 | 67.37 | |
| Weather and environmental conditions | 0.307 | −0.0230 | 58.89 | |
| Sensor calibration accuracy | −0.161 | −0.0679 | 141.11 | |
| Operational difficulties | −0.486 | −0.1006 | 181.26 | |
| Background colours in the table correspond to the colours of the domains of the study area, presented in Figure 4 and Figure 10. The extreme values mentioned in the text are highlighted in bold. | ||||
References
- Aljehani, M., & Inoue, M. (2019). Performance evaluation of multi-UAV system in post-disaster application: Validated by HITL simulator. IEEE Access, 7, 64386–64400. [Google Scholar] [CrossRef]
- Angelov, D. (2020). Top2vec: Distributed representations of topics. arXiv, arXiv:2008.09470. [Google Scholar]
- Asadzadeh, S., de Oliveira, W. J., & de Souza Filho, C. R. (2022). UAV-based remote sensing for the petroleum industry and environmental monitoring: State-of-the-art and perspectives. Journal of Petroleum Science and Engineering, 208, 109633. [Google Scholar] [CrossRef]
- Barbedo, J. G. A. (2019). A review on the use of unmanned aerial vehicles and imaging sensors for monitoring and assessing plant stresses. Drones, 3(2), 40. [Google Scholar] [CrossRef]
- Bayomi, N., & Fernandez, J. E. (2023). Eyes in the sky: Drones applications in the built environment under climate change challenges. Drones, 7(10), 637. [Google Scholar] [CrossRef]
- Blei, D. M., Ng, A. Y., & Jordan, M. I. (2003). Latent dirichlet allocation. Journal of Machine Learning Research, 3, 993–1022. [Google Scholar]
- Boesch, H., Liu, Y., Tamminen, J., Yang, D., Palmer, P. I., Lindqvist, H., Cai, Z., Che, K., Di Noia, A., Feng, L., Hakkarainen, J., Ialongo, I., Kalaitzi, N., Karppinen, T., Kivi, R., Kivimäki, E., Parker, R. J., Preval, S., Wang, J., … Chen, H. (2021). Monitoring greenhouse gases from space. Remote Sensing, 13(14), 2700. [Google Scholar] [CrossRef]
- Bretsko, D., Belyi, A., & Sobolevsky, S. (2023). Comparative Analysis of Community Detection and Transformer-Based Approaches for Topic Clustering of Scientific Papers. In International conference on computational science and its applications (pp. 648–660). Springer Nature Switzerland. [Google Scholar]
- Butilă, E. V., & Boboc, R. G. (2022). Urban traffic monitoring and analysis using unmanned aerial vehicles (UAVs): A systematic literature review. Remote Sensing, 14(3), 620. [Google Scholar] [CrossRef]
- Campos, R., Mangaravite, V., Pasquali, A., Jorge, A., Nunes, C., & Jatowt, A. (2020). YAKE! Keyword extraction from single documents using multiple local features. Information Sciences, 509, 257–289. [Google Scholar] [CrossRef]
- CCRss. (2024a). ArXiv papers CS dataset. Available online: https://huggingface.co/datasets/CCRss/arxiv_papers_cs (accessed on 11 September 2024).
- CCRss. (2024b). Topic modeling Top2Vec scientific texts. Available online: https://huggingface.co/CCRss/topic_modeling_top2vec_scientific-texts (accessed on 11 September 2024).
- Cer, D., Yang, Y., Kong, S. Y., Hua, N., Limtiaco, N., John, R. S., Constant, C., Guajardo-Cespedes, M., Yuan, S., Tar, C., Strope, B., & Kurzweil, R. (2018, October 31–November 4). Universal sentence encoder for English. 2018 Conference on Empirical Methods in Natural Language Processing: System Demonstrations (pp. 169–174), Brussels, Belgium. [Google Scholar]
- Devlin, J., Chang, M. W., Lee, K., & Toutanova, K. (2019, June 2–7). Bert: Pre-training of deep bidirectional transformers for language understanding. 2019 Conference of the North American Chapter of the Association for Computational Linguistics: Human Language Technologies, Volume 1 (Long and Short Papers) (pp. 4171–4186), Minneapolis, MN, USA. [Google Scholar]
- Egger, R., & Yu, J. (2022). A topic modeling comparison between lda, nmf, top2vec, and bertopic to demystify twitter posts. Frontiers in Sociology, 7, 886498. [Google Scholar] [CrossRef]
- Erdelj, M., & Natalizio, E. (2016, February 15–18). UAV-assisted disaster management: Applications and open issues. 2016 International Conference on Computing, Networking and Communications (ICNC) (pp. 1–5), Kauai, HI, USA. [Google Scholar]
- Erdelj, M., Król, M., & Natalizio, E. (2017). Wireless sensor networks and multi-UAV systems for natural disaster management. Computer Networks, 124, 72–86. [Google Scholar] [CrossRef]
- Erkec, T. Y., & Hajiyev, C. (2022). Swarm architecture of UAVs. In Progress in sustainable aviation (pp. 15–36). Springer International Publishing. [Google Scholar]
- Fascista, A. (2022). Toward integrated large-scale environmental monitoring using WSN/UAV/Crowdsensing: A review of applications, signal processing, and future perspectives. Sensors, 22(5), 1824. [Google Scholar] [CrossRef] [PubMed]
- Gailler, L., Labazuy, P., Régis, E., Bontemps, M., Souriot, T., Bacques, G., & Carton, B. (2021). Validation of a new UAV magnetic prospecting tool for volcano monitoring and geohazard assessment. Remote Sensing, 13(5), 894. [Google Scholar] [CrossRef]
- García, Y. E., Villa-Pérez, M. E., Li, K., Tai, X. H., Trejo, L. A., Daza-Torres, M. L., Montesinos-López, J. C., & Nuño, M. (2024). Wildfires and social media discourse: Exploring mental health and emotional wellbeing through Twitter. Frontiers in Public Health, 12, 1349609. [Google Scholar]
- Grootendorst, M. (2022). BERTopic: Neural topic modeling with a class-based TF-IDF procedure. arXiv, arXiv:2203.05794. [Google Scholar]
- Gulf News. (2018, November 5). Drone inspections help cut pollution by half (Staff Report). UAE. Available online: https://gulfnews.com/uae/environment/drone-inspections-help-cut-pollution-by-half-1.2263928 (accessed on 14 October 2024).
- Gupta, R. K., Agarwalla, R., Naik, B. H., Evuri, J. R., Thapa, A., & Singh, T. D. (2022). Prediction of research trends using LDA based topic modeling. Global Transitions Proceedings, 3(1), 298–304. [Google Scholar]
- Ham, Y., Han, K. K., Lin, J. J., & Golparvar-Fard, M. (2016). Visual monitoring of civil infrastructure systems via camera-equipped Unmanned Aerial Vehicles (UAVs): A review of related works. Visualization in Engineering, 4, 1. [Google Scholar] [CrossRef]
- Han, T., Xie, C., Yang, Y., Zhang, Y., Huang, Y., Liu, Y., Chen, K., Sun, H., Zhou, J., Liu, C., Guo, J., Wu, Z., & Li, S. M. (2024). Spatial mapping of greenhouse gases using a UAV monitoring platform over a megacity in China. Science of The Total Environment, 951, 175428. [Google Scholar] [CrossRef]
- Hervás, J., Barredo, J. I., Rosin, P. L., Pasuto, A., Mantovani, F., & Silvano, S. (2003). Monitoring landslides from optical remotely sensed imagery: The case history of Tessina landslide, Italy. Geomorphology, 54(1–2), 63–75. [Google Scholar]
- Hodgson, J. C., Baylis, S. M., Mott, R., Herrod, A., & Clarke, R. H. (2016). Precision wildlife monitoring using unmanned aerial vehicles. Scientific Reports, 6(1), 22574. [Google Scholar]
- Hu, J., Niu, H., Carrasco, J., Lennox, B., & Arvin, F. (2022). Fault-tolerant cooperative navigation of networked UAV swarms for forest fire monitoring. Aerospace Science and Technology, 123, 107494. [Google Scholar]
- Insider Intelligence. (2020, February 10). Commercial Unmanned Aerial Vehicle (UAV) Market Analysis—Industry trends, forecasts and companies. In Business insider. Available online: https://www.businessinsider.com/commercial-uav-market-analysis (accessed on 1 September 2024).
- Jelodar, H., Wang, Y., Yuan, C., Feng, X., Jiang, X., Li, Y., & Zhao, L. (2019). Latent Dirichlet allocation (LDA) and topic modeling: Models, applications, a survey. Multimedia Tools and Applications, 78, 15169–15211. [Google Scholar]
- Jenssen, R., & Roverso, D. (2019). Intelligent monitoring and inspection of power line components powered by UAVs and deep learning. IEEE Power and Energy Technology Systems Journal, 6(1), 11–21. [Google Scholar]
- Jońca, J., Pawnuk, M., Bezyk, Y., Arsen, A., & Sówka, I. (2022). Drone-assisted monitoring of atmospheric pollution—A comprehensive review. Sustainability, 14(18), 11516. [Google Scholar] [CrossRef]
- Jordan, S., Moore, J., Hovet, S., Box, J., Perry, J., Kirsche, K., Lewis, D., & Tse, Z. T. H. (2018). State-of-the-art technologies for UAV inspections. IET Radar, Sonar & Navigation, 12(2), 151–164. [Google Scholar]
- Khan, N. A., Jhanjhi, N. Z., Brohi, S. N., Usmani, R. S. A., & Nayyar, A. (2020). Smart traffic monitoring system using unmanned aerial vehicles (UAVs). Computer Communications, 157, 434–443. [Google Scholar]
- Kherwa, P., & Bansal, P. (2020). Topic modeling: A comprehensive review. EAI Endorsed Transactions on Scalable Information Systems, 7(24), e2. [Google Scholar]
- Lambey, V., & Prasad, A. D. (2021). A review on air quality measurement using an unmanned aerial vehicle. Water, Air, & Soil Pollution, 232, 109. [Google Scholar]
- Le, Q., & Mikolov, T. (2014). Distributed representations of sentences and documents. In International conference on machine learning (pp. 1188–1196). PMLR. [Google Scholar]
- Lee, D. D., & Seung, H. S. (1999). Learning the parts of objects by non-negative matrix factorization. Nature, 401(6755), 788–791. [Google Scholar]
- McInnes, L. (2024). UMAP parameters documentation. Available online: https://umap-learn.readthedocs.io/en/latest/parameters.html (accessed on 21 October 2024).
- McInnes, L., & Healy, J. (2024). HDBSCAN parameter selection guide. Available online: https://hdbscan.readthedocs.io/en/latest/parameter_selection.html (accessed on 14 October 2024).
- McInnes, L., Healy, J., & Astels, S. (2017). hdbscan: Hierarchical density based clustering. The Journal of Open Source Software, 2(11), 205. [Google Scholar]
- McInnes, L., Healy, J., & Melville, J. (2018). Umap: Uniform manifold approximation and projection for dimension reduction. arXiv, arXiv:1802.03426. [Google Scholar]
- Medvedev, A., Telnova, N., Alekseenko, N., Koshkarev, A., Kuznetchenko, P., Asmaryan, S., & Narykov, A. (2020). UAV-derived data application for environmental monitoring of the coastal area of Lake Sevan, Armenia with a changing water level. Remote Sensing, 12(22), 3821. [Google Scholar] [CrossRef]
- Mikolov, T., Chen, K., Corrado, G., & Dean, J. (2013). Efficient estimation of word representations in vector space. arXiv, arXiv:1301.3781. [Google Scholar]
- Mogili, U. R., & Deepak, B. B. V. L. (2018). Review on application of drone systems in precision agriculture. Procedia Computer Science, 133, 502–509. [Google Scholar] [CrossRef]
- Mohamed, N., Al-Jaroodi, J., Jawhar, I., Idries, A., & Mohammed, F. (2020). Unmanned aerial vehicles applications in future smart cities. Technological Forecasting and Social Change, 153, 119293. [Google Scholar]
- Mohsan, S. A. H., Khan, M. A., Noor, F., Ullah, I., & Alsharif, M. H. (2022). Towards the unmanned aerial vehicles (UAVs): A comprehensive review. Drones, 6(6), 147. [Google Scholar] [CrossRef]
- Mohsan, S. A. H., Othman, N. Q. H., Li, Y., Alsharif, M. H., & Khan, M. A. (2023). Unmanned aerial vehicles (UAVs): Practical aspects, applications, open challenges, security issues, and future trends. Intelligent Service Robotics, 16(1), 109–137. [Google Scholar] [CrossRef]
- Muhamedyev, R. I., Aliguliyev, R. M., Shokishalov, Z. M., & Mustakayev, R. R. (2018). New bibliometric indicators for prospectivity estimation of research fields. Annals of Library and Information Studies, 65(1), 62–69. [Google Scholar]
- Mukhamediev, R., Kuchin, Y., Yakunin, K., Symagulov, A., Ospanova, M., Assanov, I., & Yelis, M. (2020a). Intelligent unmanned aerial vehicle technology in urban environments. In International conference on digital transformation and global society (pp. 345–359). Springer International Publishing. [Google Scholar]
- Mukhamediev, R. I., Symagulov, A., Kuchin, Y., Yakunin, K., & Yelis, M. (2021). From classical machine learning to deep neural networks: A simplified scientometric review. Applied Sciences, 11(12), 5541. [Google Scholar] [CrossRef]
- Mukhamediev, R. I., Yakunin, K., Mussabayev, R., Buldybayev, T., Kuchin, Y., Murzakhmetov, S., & Yelis, M. (2020b). Classification of negative information on socially significant topics in mass media. Symmetry, 12(12), 1945. [Google Scholar] [CrossRef]
- Mukhamedyev, R. I., Kuchin, Y., Denis, K., Murzakhmetov, S., Symagulov, A., & Yakunin, K. (2019). Assessment of the dynamics of publication activity in the field of natural language processing and deep learning. In International conference on digital transformation and global society (pp. 744–753). Springer International Publishing. [Google Scholar]
- Muthusami, R., Mani Kandan, N., Saritha, K., Narenthiran, B., Nagaprasad, N., & Ramaswamy, K. (2024). Investigating topic modeling techniques through evaluation of topics discovered in short texts data across diverse domains. Scientific Reports, 14(1), 12003. [Google Scholar] [CrossRef] [PubMed]
- Park, S., & Choi, Y. (2020). Applications of unmanned aerial vehicles in mining from exploration to reclamation: A review. Minerals, 10(8), 663. [Google Scholar] [CrossRef]
- Reimers, N., & Gurevych, I. (2019). Sentence-bert: Sentence embeddings using siamese bert-networks. arXiv, arXiv:1908.10084. [Google Scholar]
- Rose, S., Engel, D., Cramer, N., & Cowley, W. (2010). Automatic keyword extraction from individual documents. In Text mining: Applications and theory (pp. 1–20). John Wiley & Sons. [Google Scholar]
- Sadjadi, M. (2017). ArXivScraper: A Python package for scraping arXiv.org. Available online: https://github.com/Mahdisadjadi/arxivscraper (accessed on 27 October 2024).
- Shakhatreh, H., Sawalmeh, A. H., Al-Fuqaha, A., Dou, Z., Almaita, E., Khalil, I., Othman, N. S., Khreishah, A., & Guizani, M. (2019). Unmanned aerial vehicles (UAVs): A survey on civil applications and key research challenges. IEEE Access, 7, 48572–48634. [Google Scholar] [CrossRef]
- Telli, K., Kraa, O., Himeur, Y., Ouamane, A., Boumehraz, M., Atalla, S., & Mansoor, W. (2023). A comprehensive review of recent research trends on unmanned aerial vehicles (uavs). Systems, 11(8), 400. [Google Scholar] [CrossRef]
- Vayansky, I., & Kumar, S. A. (2020). A review of topic modeling methods. Information Systems, 94, 101582. [Google Scholar] [CrossRef]
- Vorontsov, K., Frei, O., Apishev, M., Romov, P., & Dudarenko, M. (2015). Bigartm: Open source library for regularized multimodal topic modeling of large collections. In Analysis of images, social networks and texts: 4th international conference, AIST 2015, Yekaterinburg, Russia, April 9–11, 2015, revised selected papers 4 (pp. 370–381). Springer International Publishing. [Google Scholar]
- Yuan, S., Li, Y., Bao, F., Xu, H., Yang, Y., Yan, Q., Zhong, S., Yin, H., Xu, J., Huang, Z., & Lin, J. (2023). Marine environmental monitoring with unmanned vehicle platforms: Present applications and future prospects. Science of The Total Environment, 858, 159741. [Google Scholar] [CrossRef]
- Zengul, F., Bulut, A., Oner, N., Ahmed, A., Yadav, M., Gray, H. G., & Ozaydin, B. (2023, January 3–6). A practical and empirical comparison of three topic modeling methods using a COVID-19 corpus: LSA, LDA, and Top2Vec. 56th Hawaii International Conference on System Sciences, Maui, HI, USA. [Google Scholar]


| D1 | D2 | Interpretation of Indicators |
|---|---|---|
| “+” | “+” | accelerated growth |
| “+” | “−” | slowing growth |
| “−” | “−” | slowing decline |
| “−” | “+” | accelerated decline |
Disclaimer/Publisher’s Note: The statements, opinions and data contained in all publications are solely those of the individual author(s) and contributor(s) and not of MDPI and/or the editor(s). MDPI and/or the editor(s) disclaim responsibility for any injury to people or property resulting from any ideas, methods, instructions or products referred to in the content. |
© 2025 by the authors. Licensee MDPI, Basel, Switzerland. This article is an open access article distributed under the terms and conditions of the Creative Commons Attribution (CC BY) license (https://creativecommons.org/licenses/by/4.0/).
Share and Cite
Albrekht, V.; Mukhamediev, R.I.; Popova, Y.; Muhamedijeva, E.; Botaibekov, A. Top2Vec Topic Modeling to Analyze the Dynamics of Publication Activity Related to Environmental Monitoring Using Unmanned Aerial Vehicles. Publications 2025, 13, 15. https://doi.org/10.3390/publications13020015
Albrekht V, Mukhamediev RI, Popova Y, Muhamedijeva E, Botaibekov A. Top2Vec Topic Modeling to Analyze the Dynamics of Publication Activity Related to Environmental Monitoring Using Unmanned Aerial Vehicles. Publications. 2025; 13(2):15. https://doi.org/10.3390/publications13020015
Chicago/Turabian StyleAlbrekht, Vladimir, Ravil I. Mukhamediev, Yelena Popova, Elena Muhamedijeva, and Asset Botaibekov. 2025. "Top2Vec Topic Modeling to Analyze the Dynamics of Publication Activity Related to Environmental Monitoring Using Unmanned Aerial Vehicles" Publications 13, no. 2: 15. https://doi.org/10.3390/publications13020015
APA StyleAlbrekht, V., Mukhamediev, R. I., Popova, Y., Muhamedijeva, E., & Botaibekov, A. (2025). Top2Vec Topic Modeling to Analyze the Dynamics of Publication Activity Related to Environmental Monitoring Using Unmanned Aerial Vehicles. Publications, 13(2), 15. https://doi.org/10.3390/publications13020015