

Scholarly Communication over a Decade of Publications

Abstract
1. Introduction
- Do the outputs of Publications match the journal’s set scope and goals?
- What role does Publications take in scholarly communication?
The Role of Bilbliometric Studies
2. Method
2.1. Metrics Applied
2.2. Data and Data Cleaning
3. Results
3.1. What Was Published?
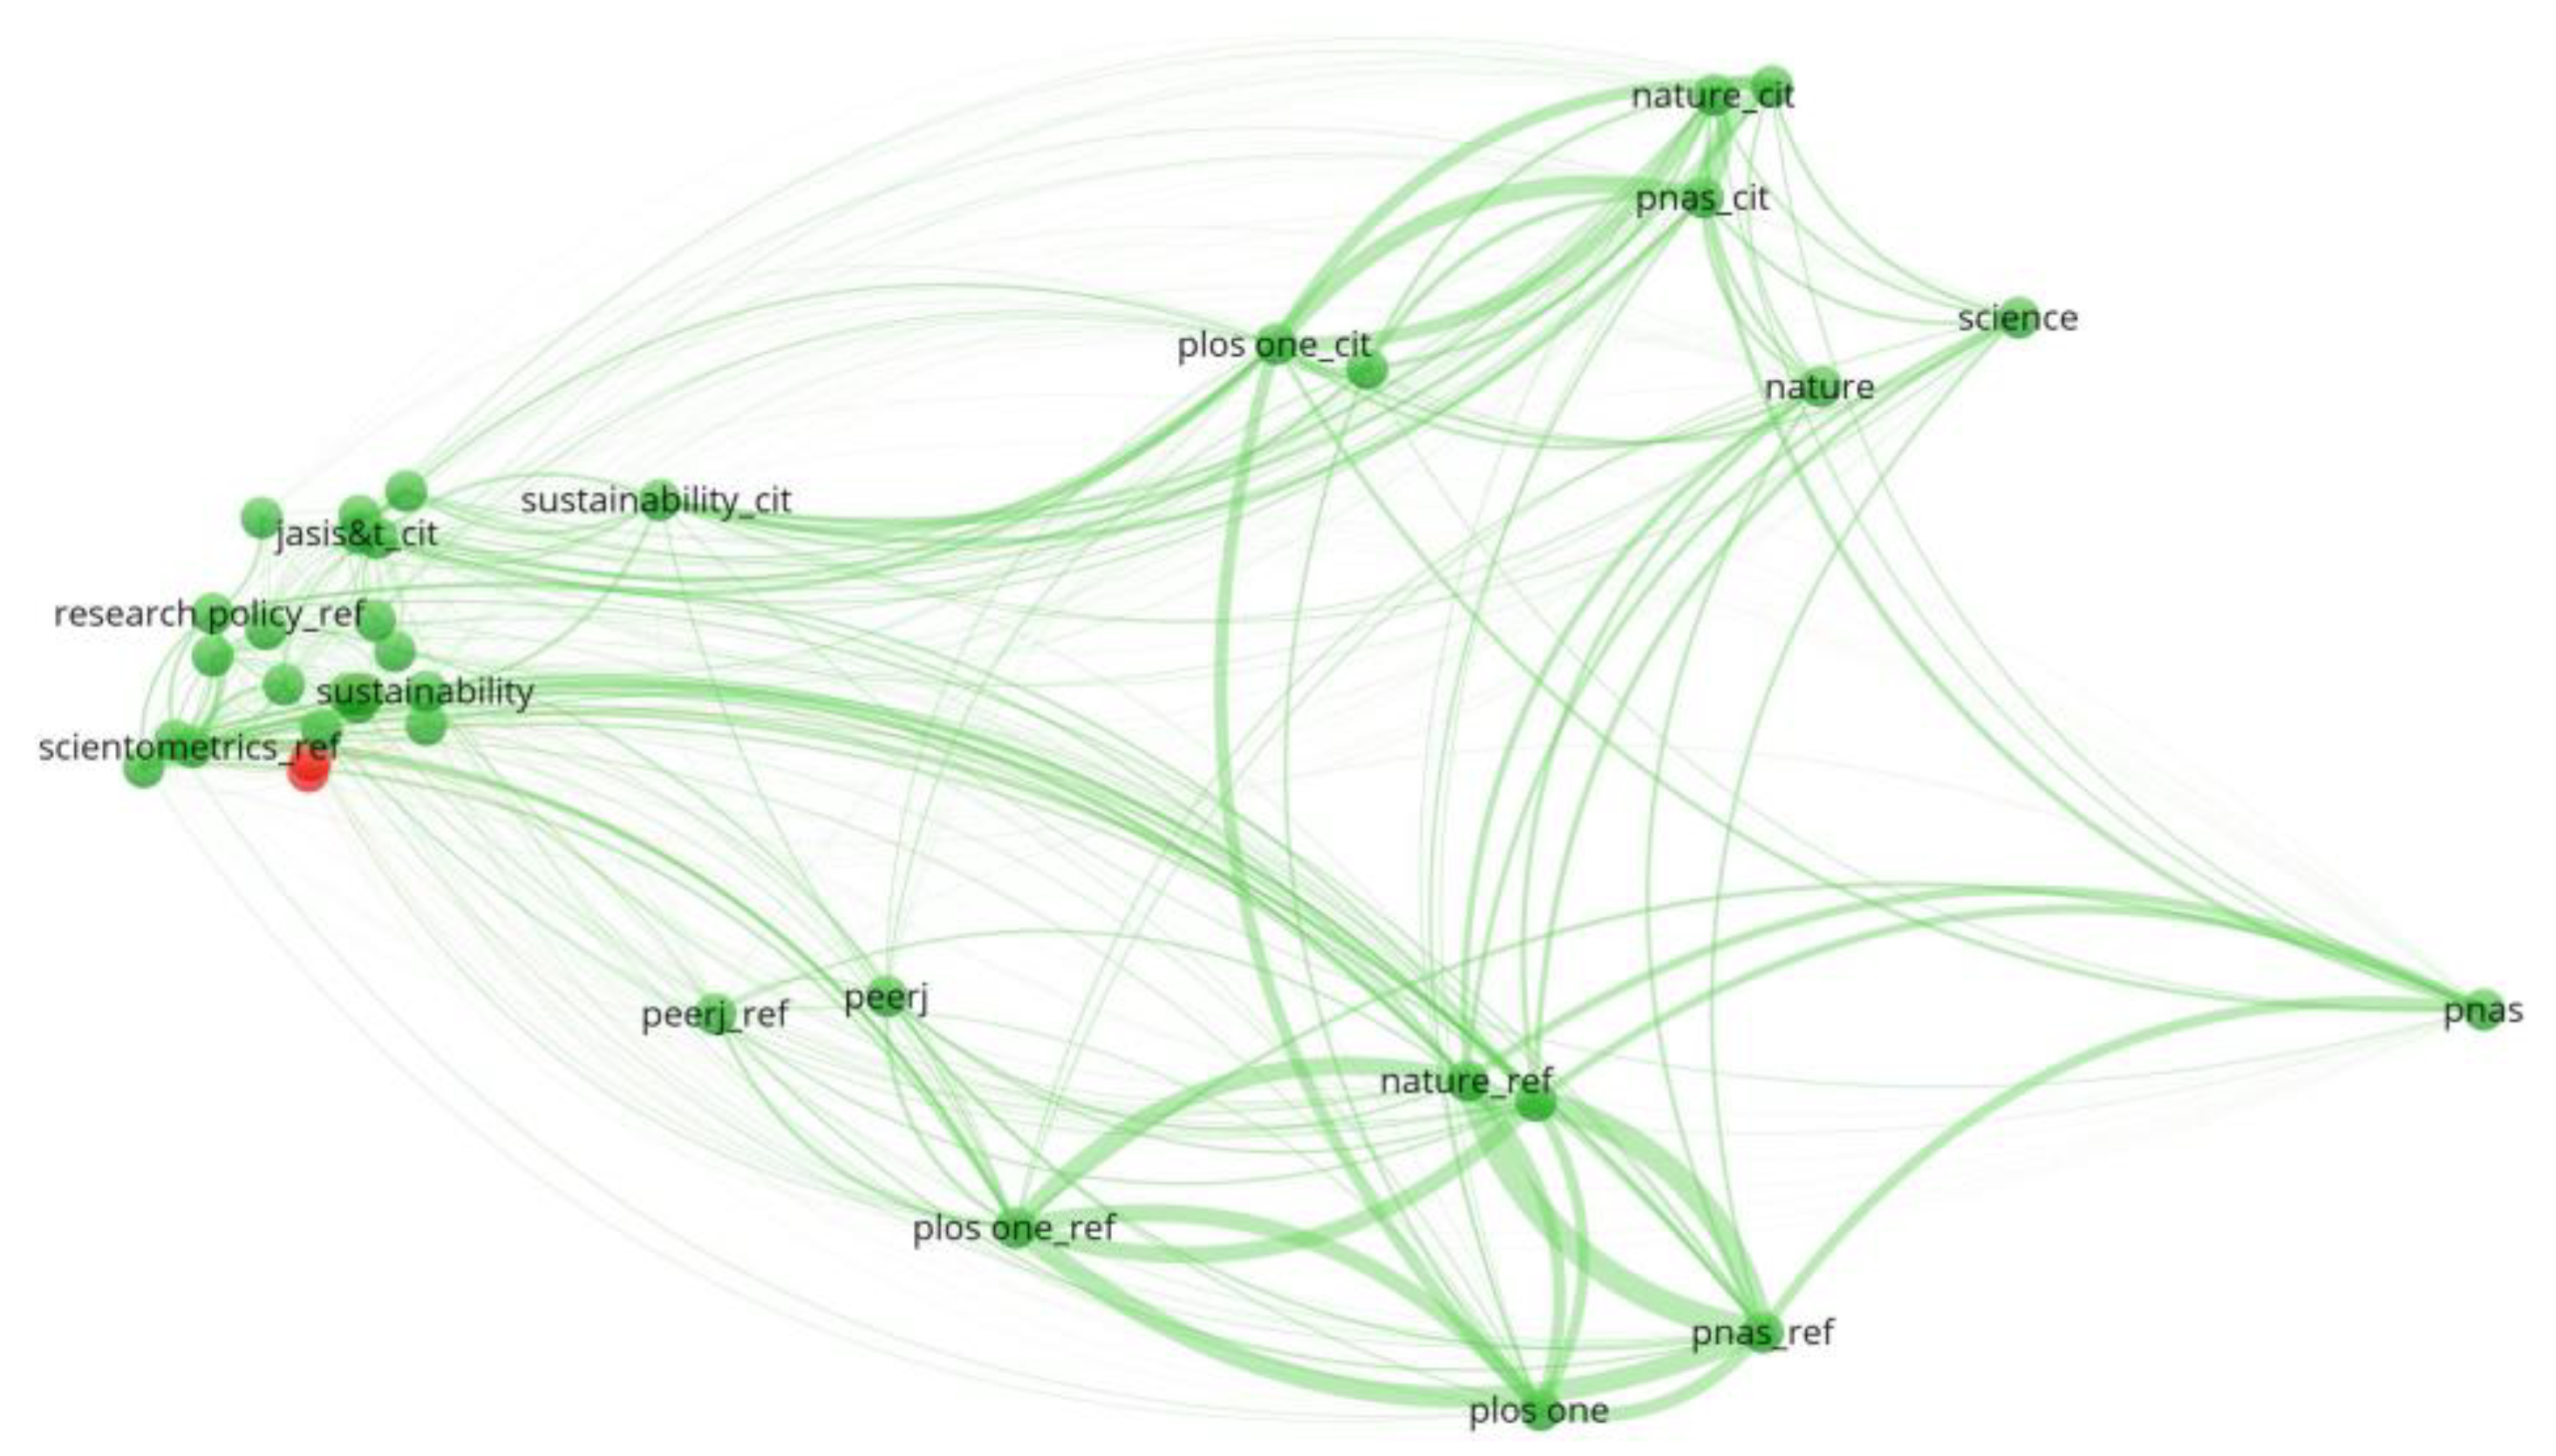
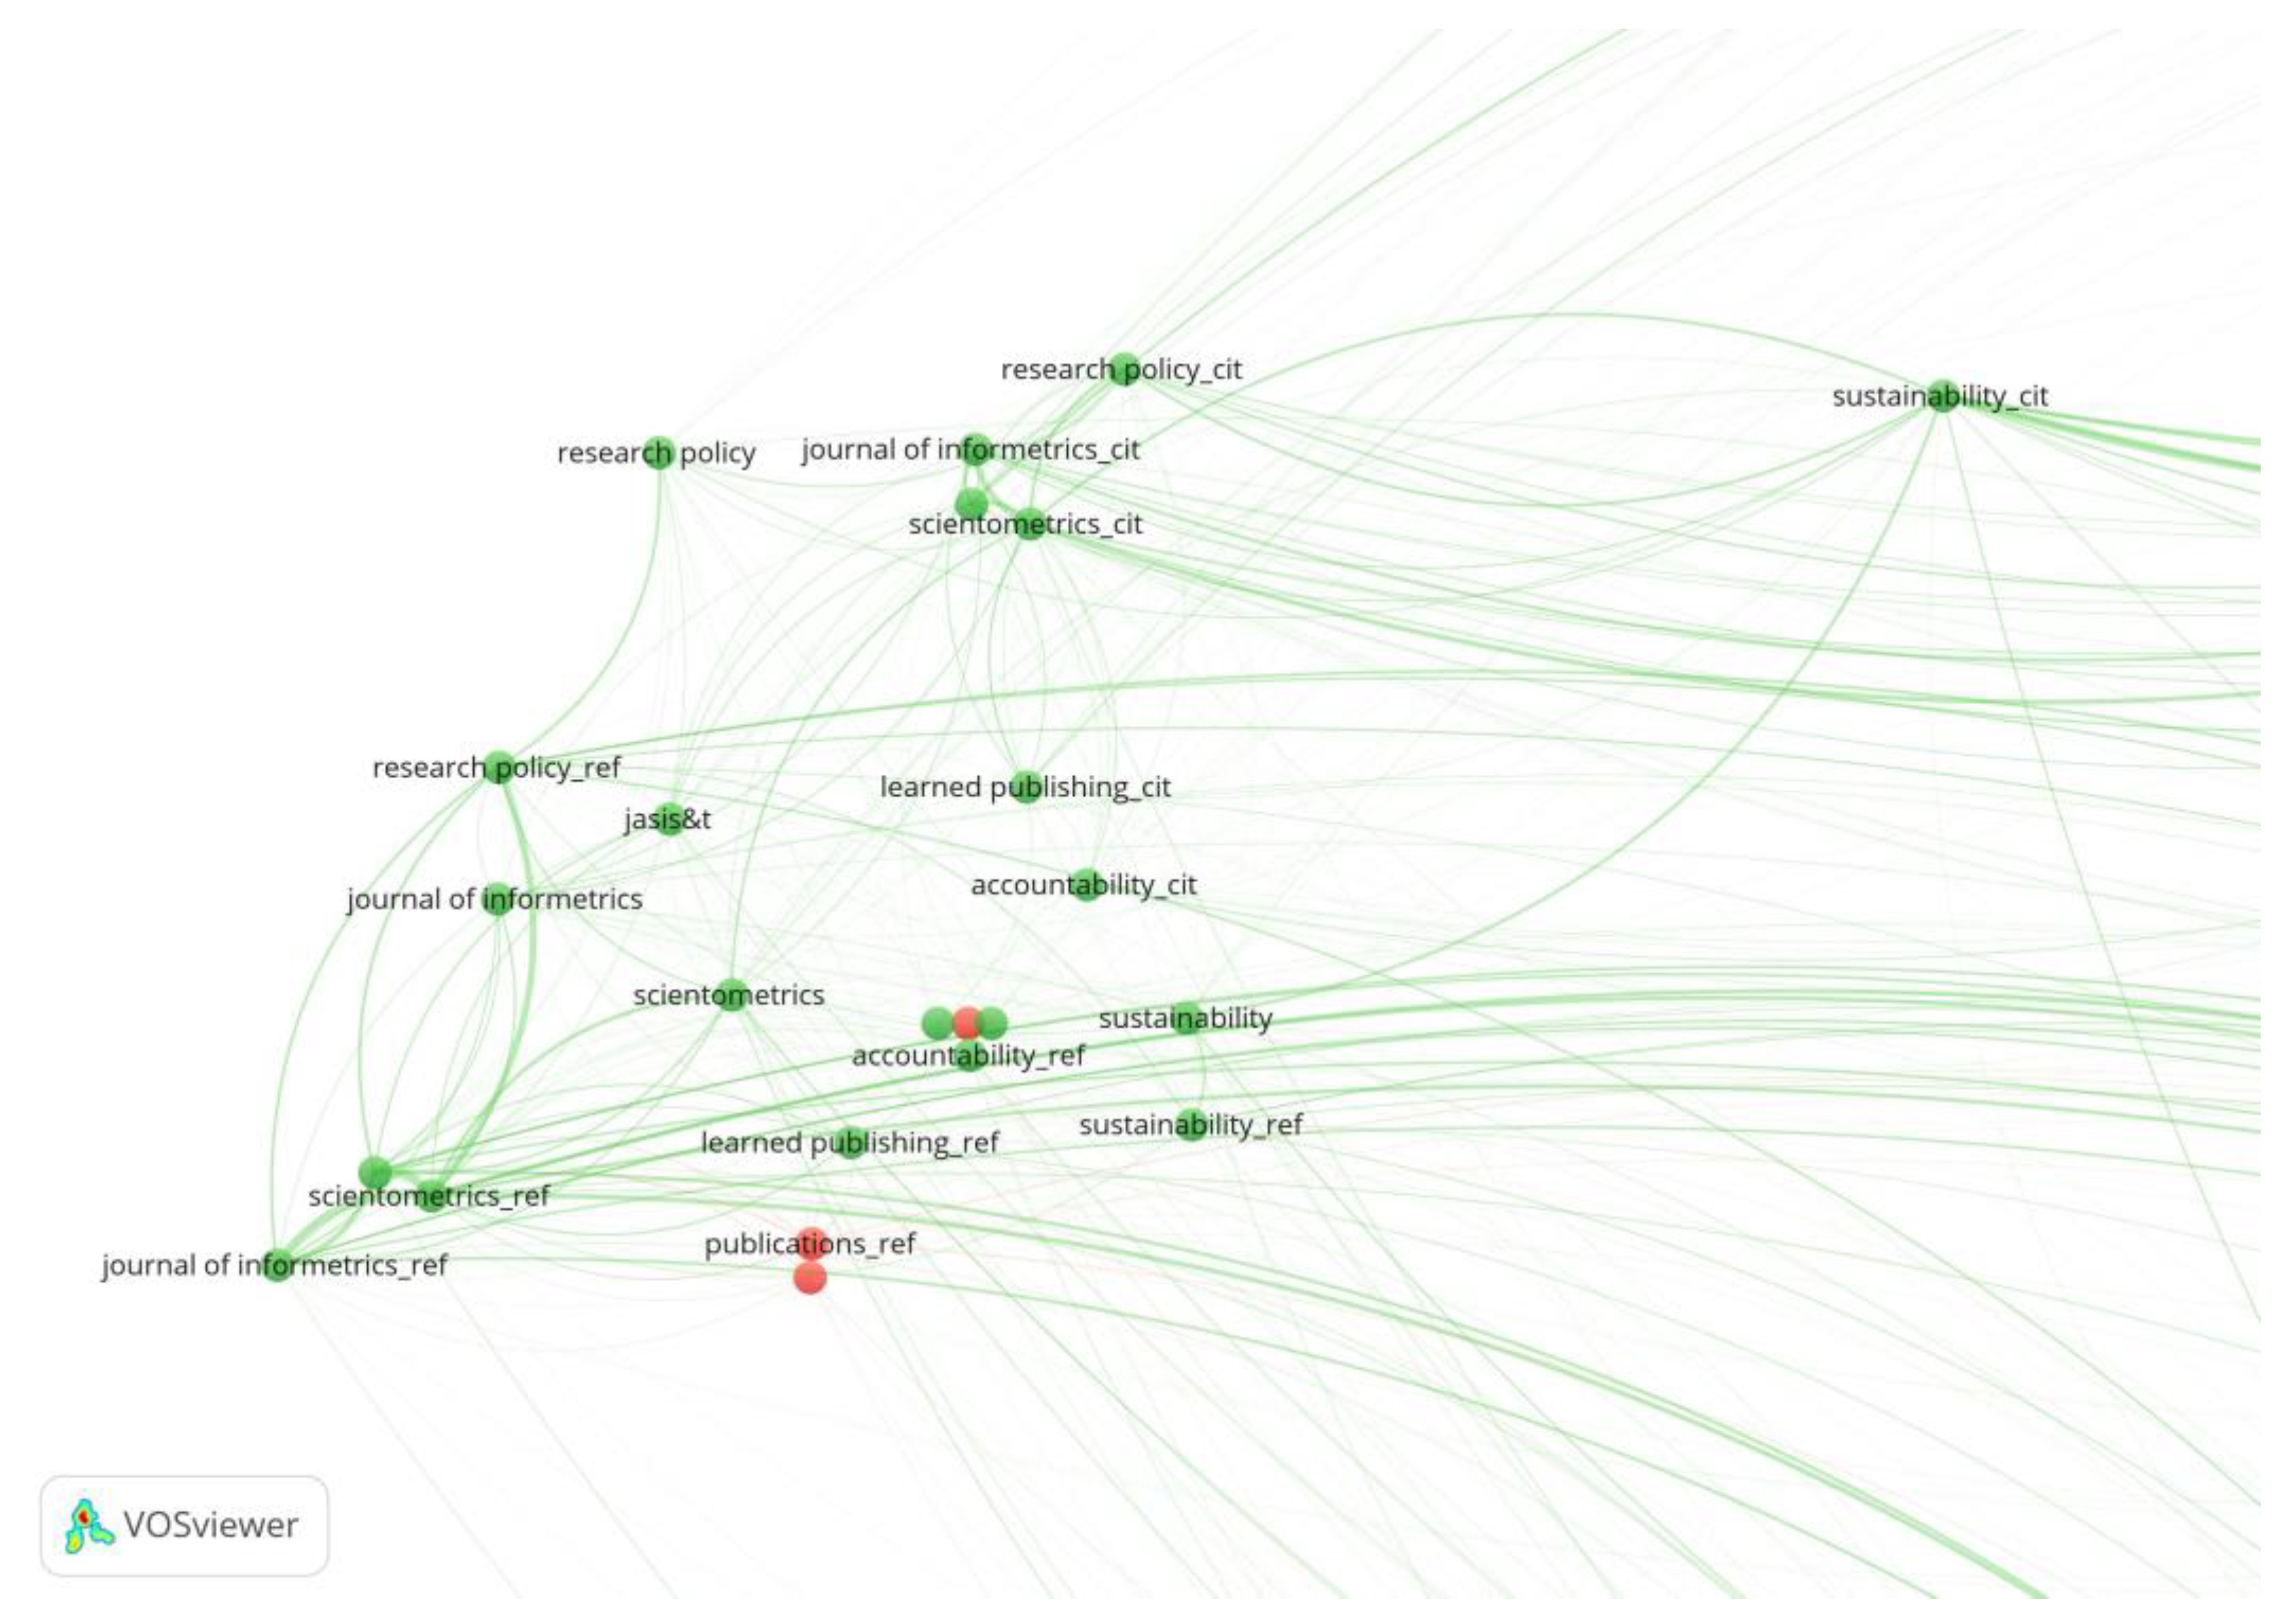
3.2. Where Does Knowledge Come From?
3.3. Where Does the Knowledge Go To?
3.4. How Multidisciplinary Is Publications?
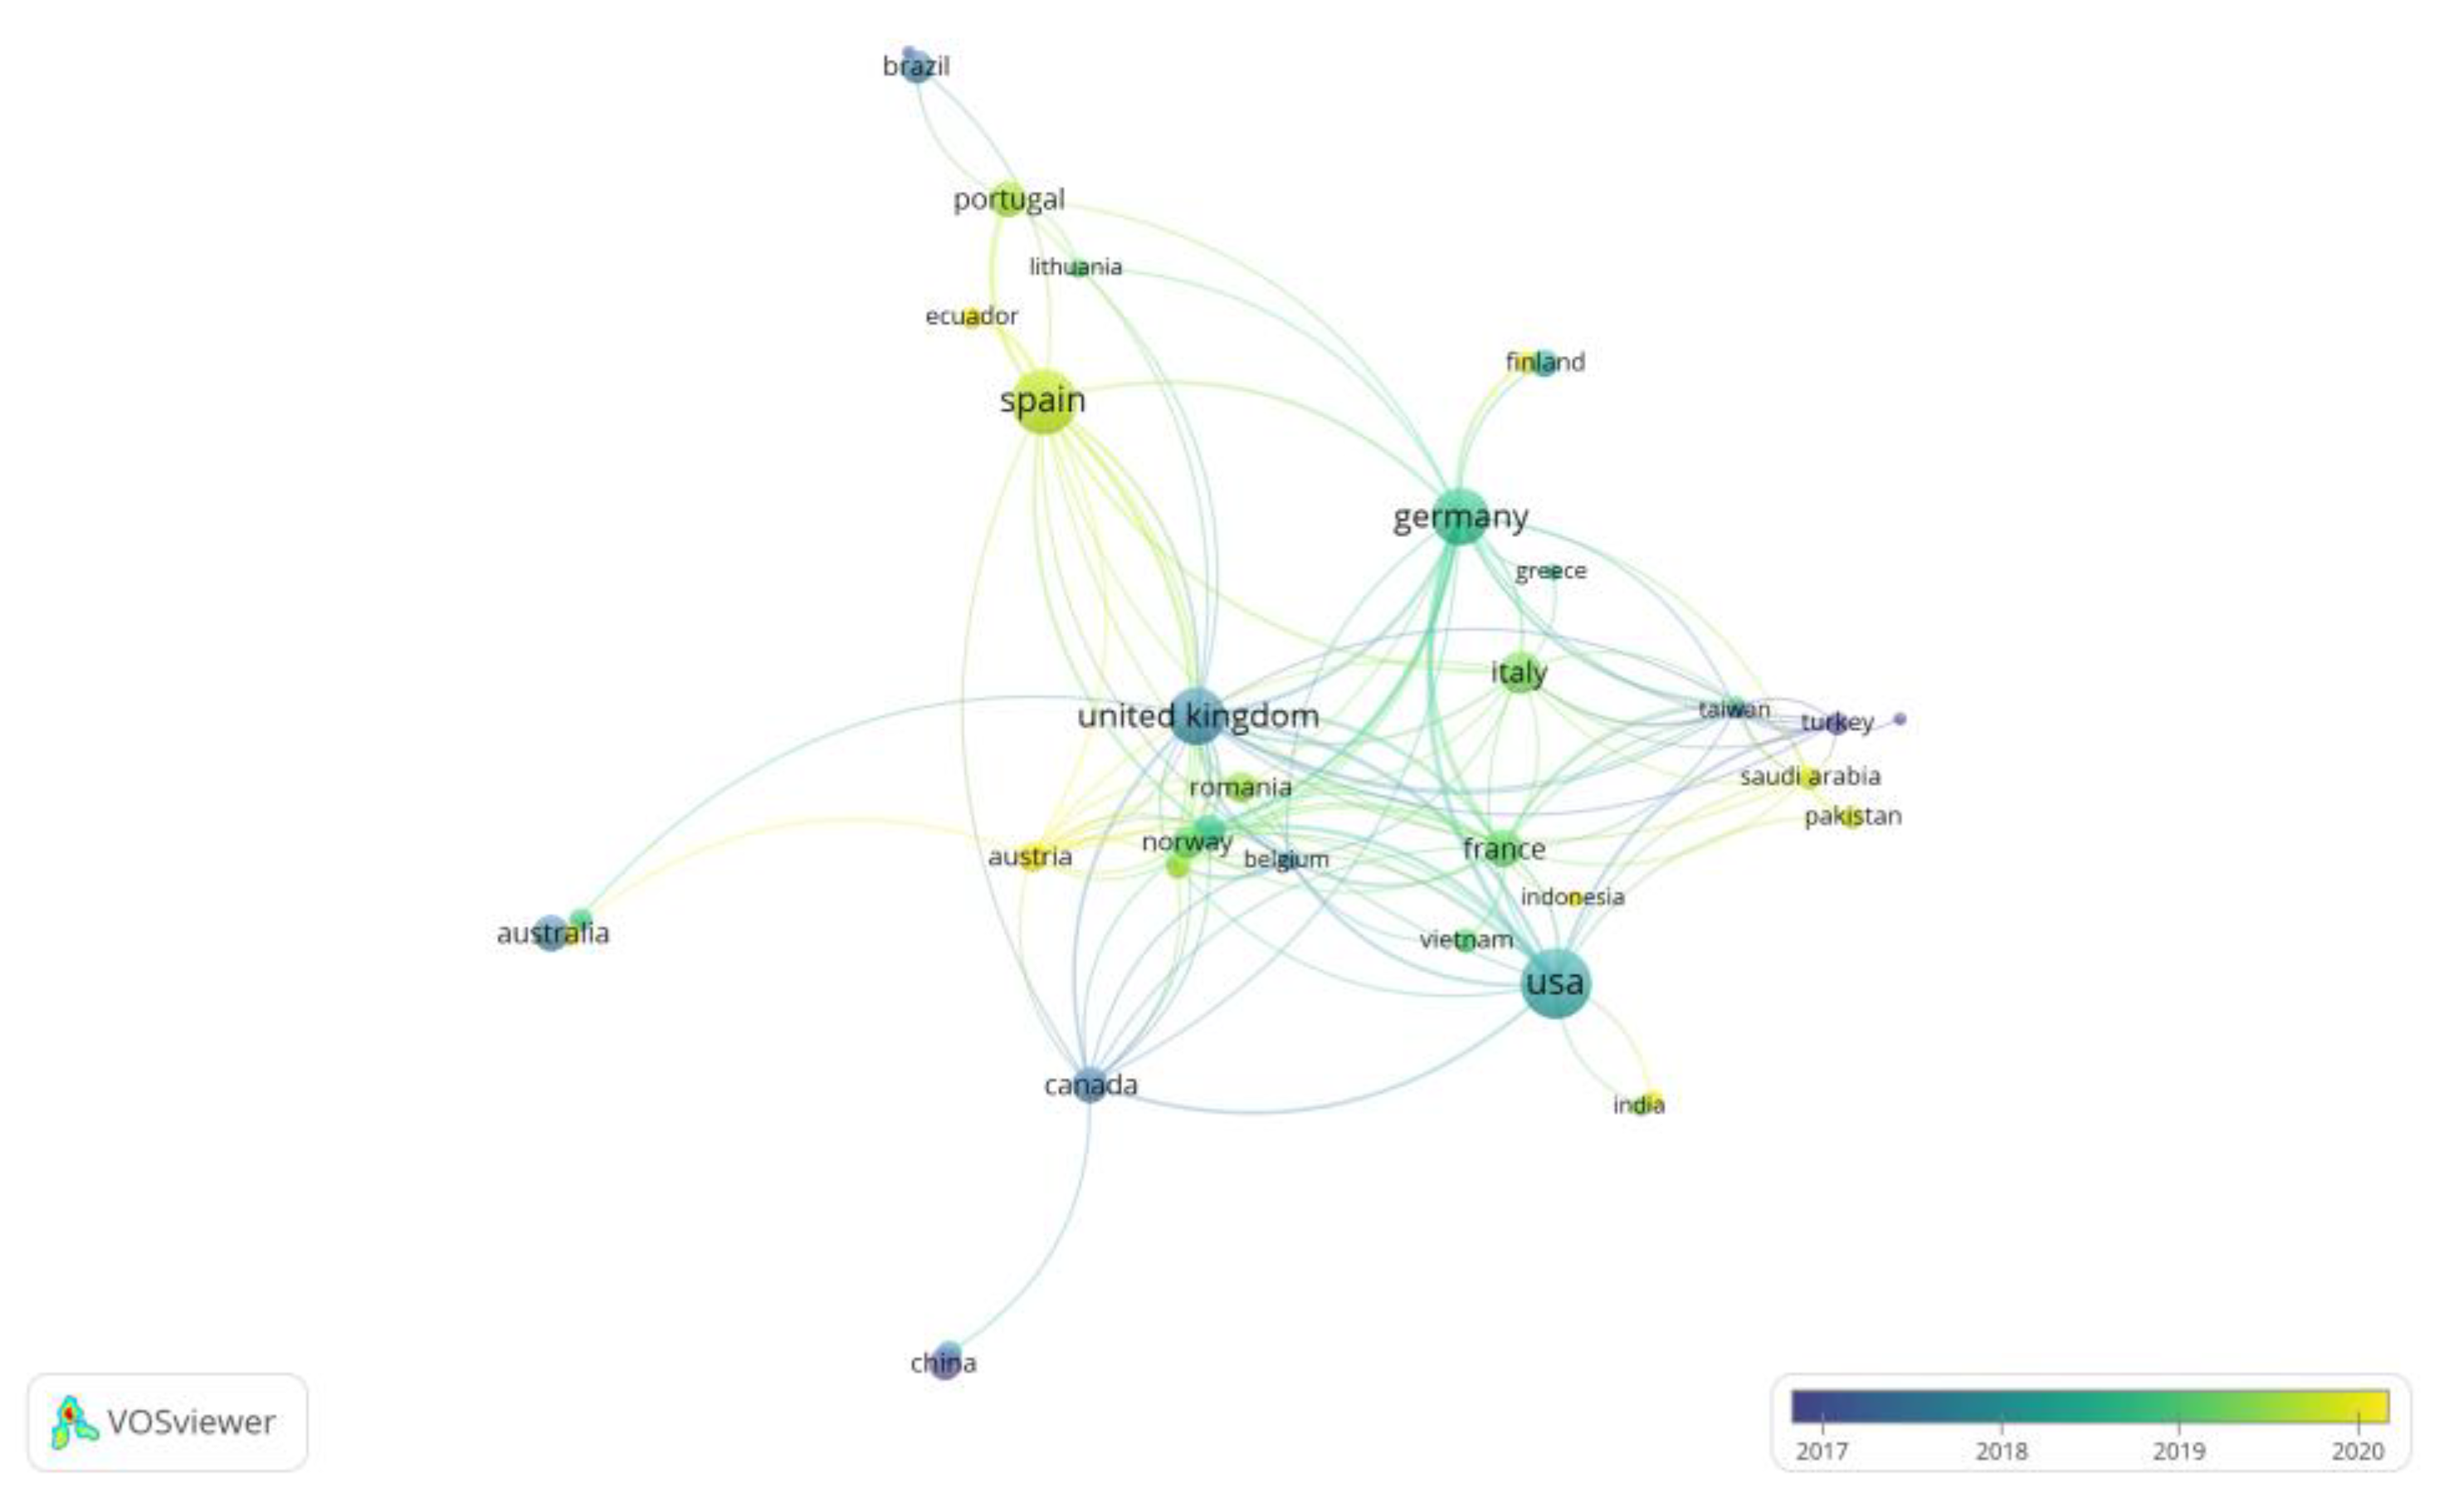
3.5. How International Is Publications?
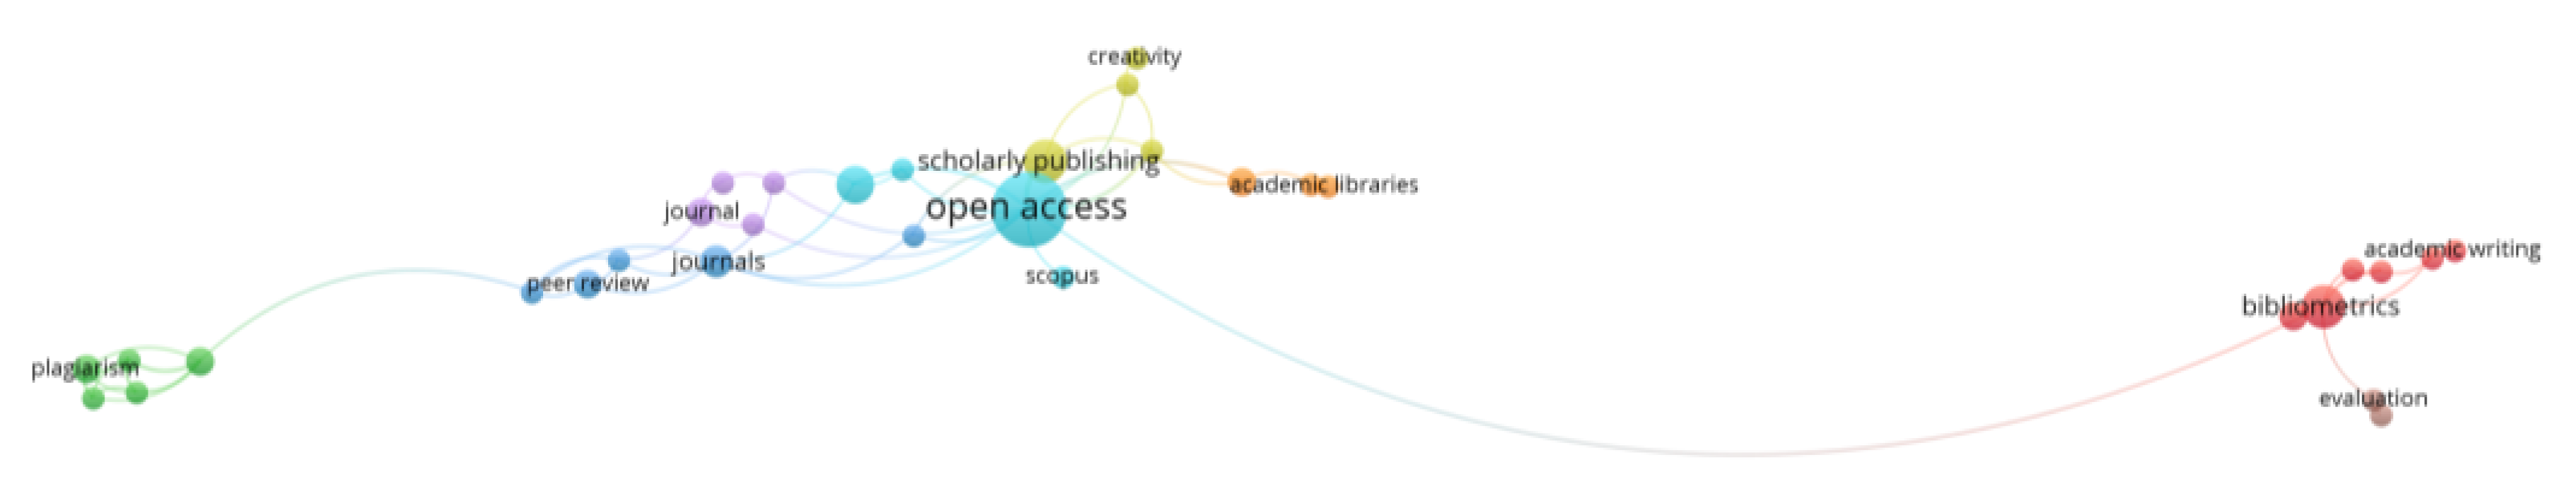
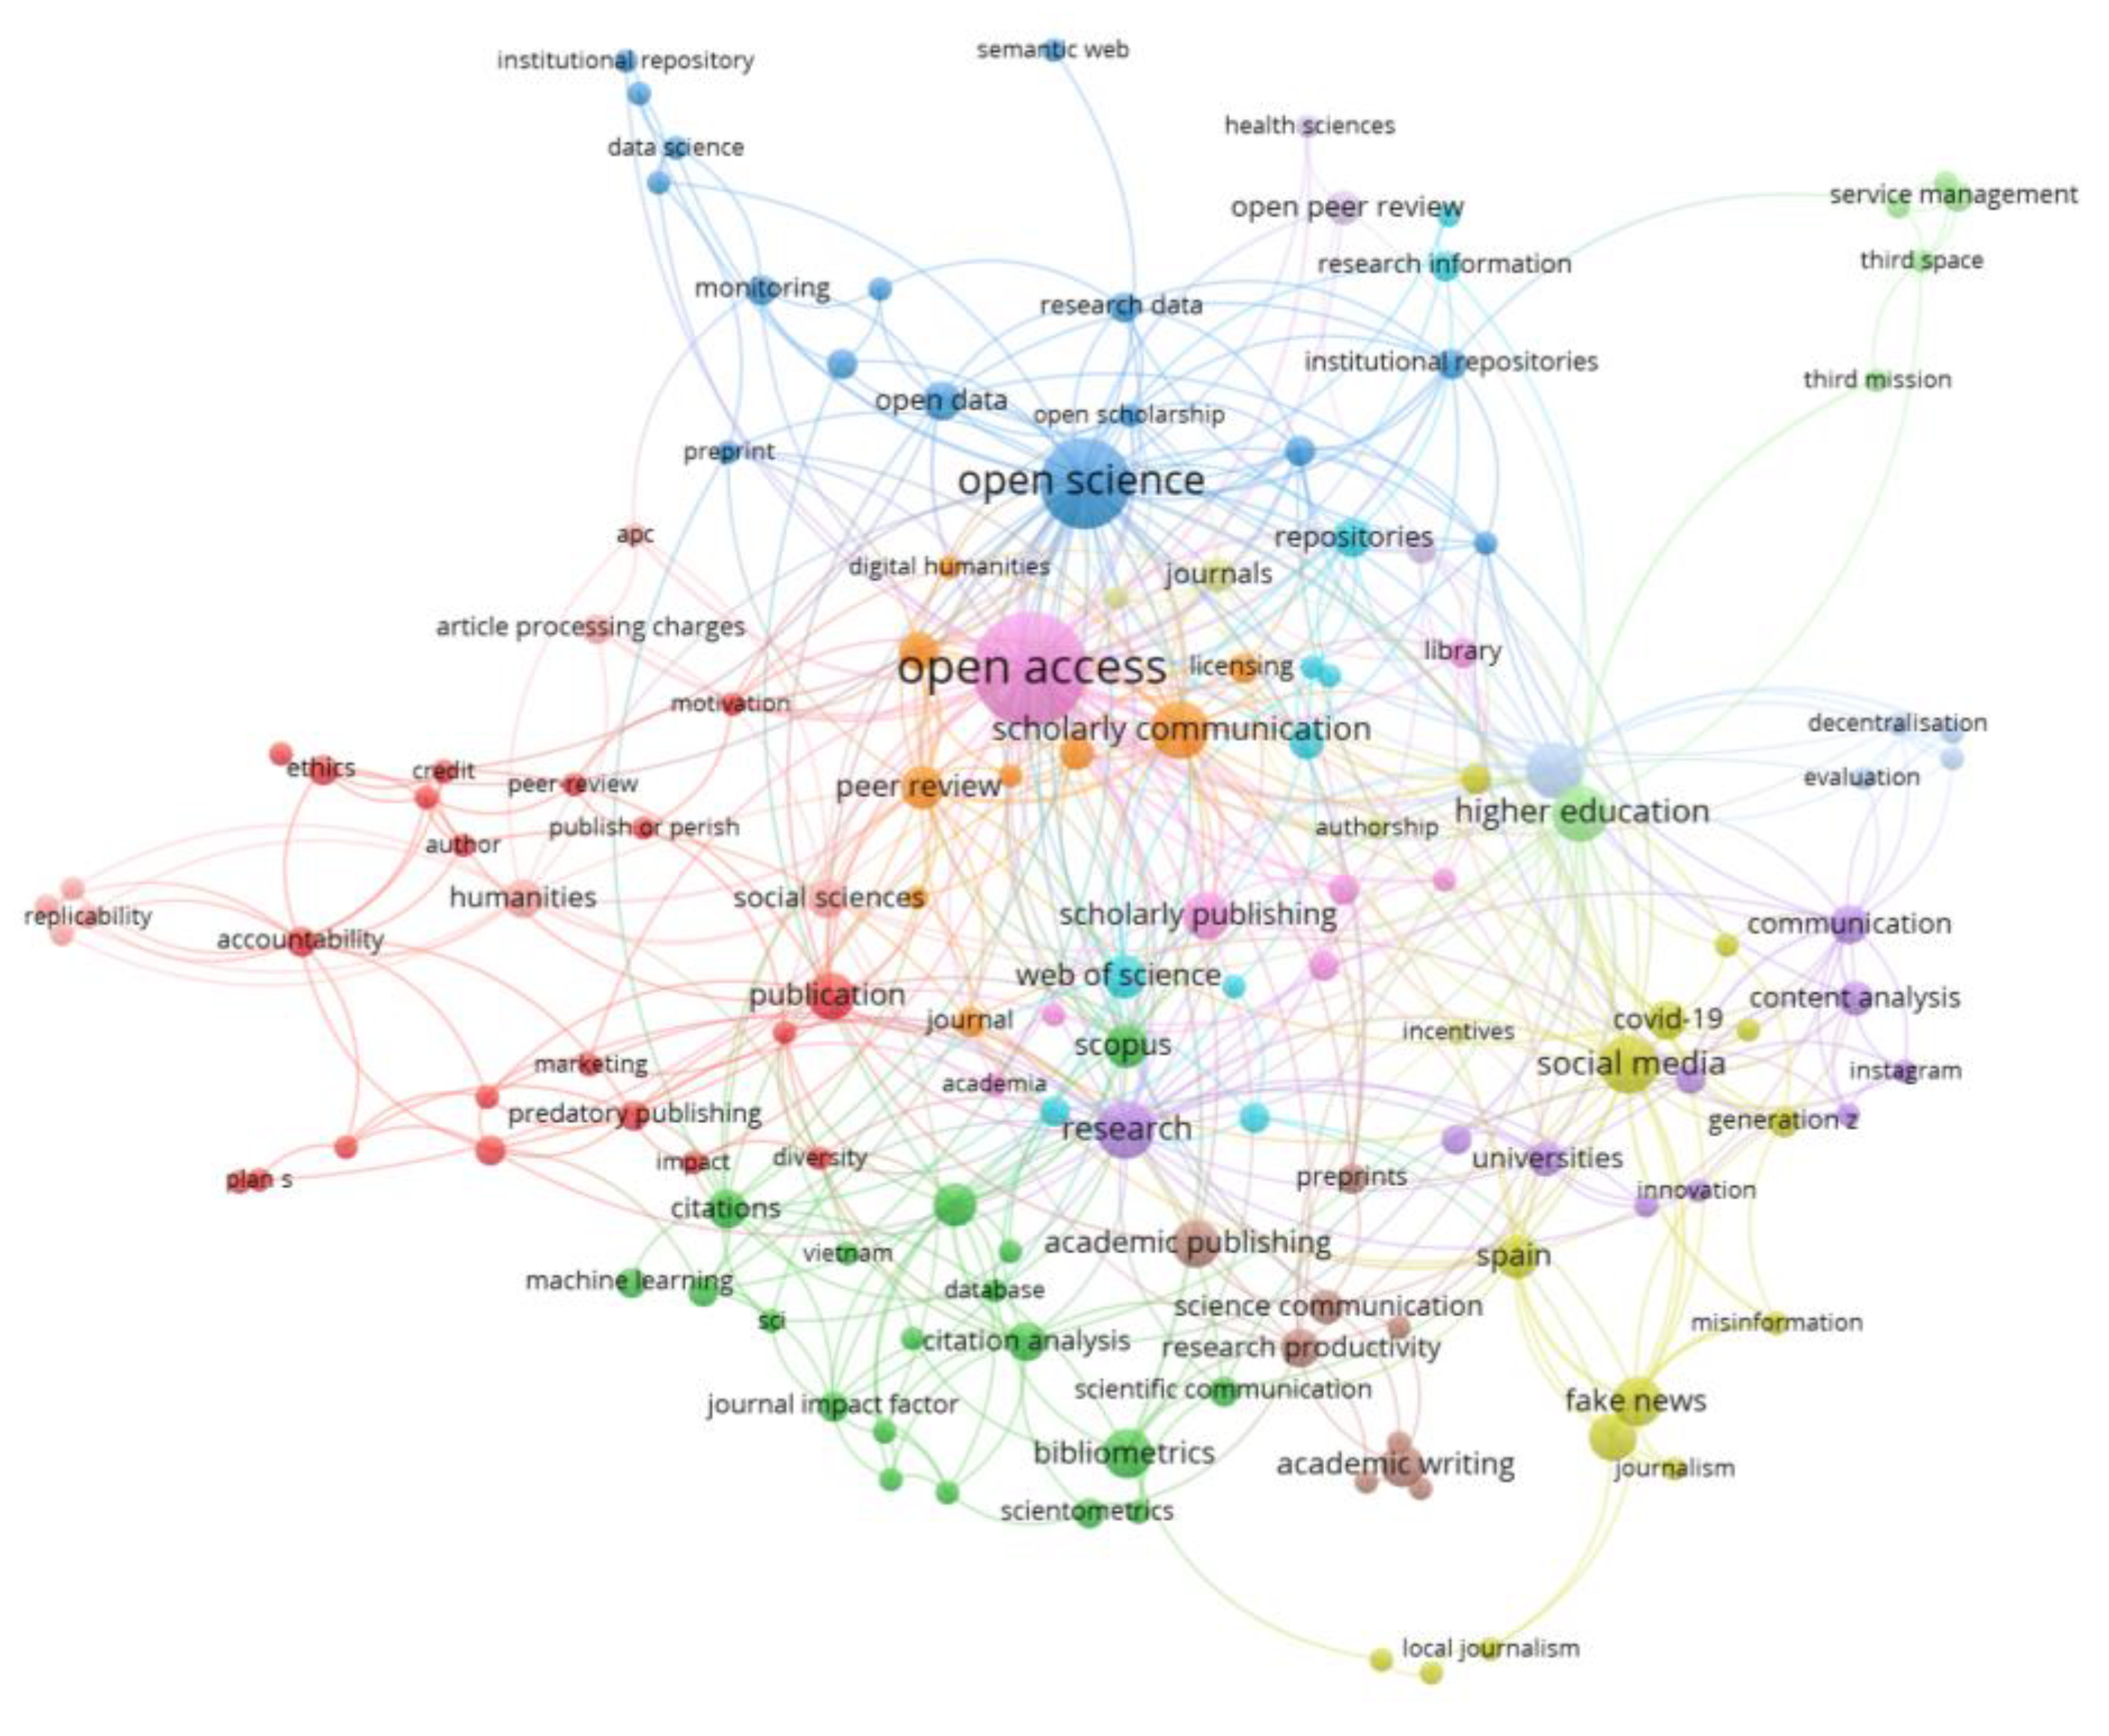
3.6. To Which Topics Does Publications Contribute?
3.7. What Does the Author Network of Publications Look Like?
4. Discussion
4.1. Do the Outputs of Publications Fit the Journal’s Set Scope and Goals?
4.2. What Role Does Publications Take in Scholarly Communication?
5. Conclusions
Author Contributions
Funding
Data Availability Statement
Acknowledgments
Conflicts of Interest
References
- Heinze, T.; Tunger, D.; Fuchs, J.E.; Jappe, A.; Eberhardt, P. Research and Teaching Profiles of Public Universities in Germany. A Mapping of Selected Fields; University of Wuppertal: Wuppertal, Germany, 2019. [Google Scholar]
- Wikipedia (n/a) Entry on “Academic Journals”. Available online: https://en.wikipedia.org/wiki/Academic_journal (accessed on 10 January 2023).
- Monavarian, M. Basics of scientific and technical writing. MRS Bull. 2021, 46, 284–286. [Google Scholar] [CrossRef]
- Publications (n/a) about Publications: Aims and Scope. Available online: https://www.mdpi.com/journal/publications/about (accessed on 15 December 2022).
- Tunger, D. On the Need for Accessibility, Standardization, Regulation, and Verification in Bibliometrics: The Leiden Manifesto and Beyond. In Handbook Bibliometrics; Ball, R., Ed.; De Gruyter Saur: Berlin, Germany, 2020; pp. 329–334. [Google Scholar]
- Tunger, D.; Wilhelm, J. The bibliometric community as reflected by its own methodology. J. Sci. Res. 2013, 2, 92. [Google Scholar] [CrossRef]
- Haustein, S.; Tunger, D. Sziento- und bibliometrische Verfahren. In Grundlagen der Praktischen Information und Dokumentation: Handbuch zur Einführung in die Informationswissenschaft und -Praxis, 6. Vollst. Neu Bearb; Kuhlen, R., Semar, W., Strauch, D., Eds.; De Gruyter: Berlin, Germany, 2013; pp. 479–494. [Google Scholar]
- Garfield, E. “Science Citation Index”–A New Dimension in Indexing. In Essays of an Information Scientist; Reprinted from Science; AAAS: Washington, DC, USA, 1964; Volume 144, pp. 649–654. [Google Scholar]
- Hicks, D.; Wouters, P.; Waltman, L.; de Rijcke, S.; Rafols, I. Bibliometrics: The Leiden Manifesto for research metrics. Nature 2015, 520, 429–431. [Google Scholar] [CrossRef] [PubMed]
- Wilsdon, J.; Bar-Ilan, J.; Frodeman, R.; Lex, E.; Peters, I.; Wouters, P. Next-Generation Metrics: Responsible Metrics and Evaluation for Open Science; European Commission: Geneva, Switzerland, 2017. [Google Scholar]
- Ràfols, I. S&T indicators in the wild: Contextualization and participation for responsible metrics. Res. Eval. 2019, 28, 7–22. [Google Scholar] [CrossRef]
- Chang, Y.-W.; Huang, M.-H. A study of the evolution of interdisciplinarity in library and information science: Using three bibliometric methods. J. Am. Soc. Inf. Sci. 2012, 63, 22–33. [Google Scholar] [CrossRef]
- Karimi, F.; Mayr, P.; Momeni, F. Analyzing the network structure and gender differences among the members of the Networked Knowledge Organization Systems (NKOS) community. Int. J. Digit. Libr. 2019, 20, 231–239. [Google Scholar] [CrossRef]


| # | Sub-Question | Analysis |
|---|---|---|
| 1 | What was published? | Dataset descriptives; scant data cleaning, data by MPDI; |
| 2 | Where does knowledge come from? | Reference analysis of journals cited; data by MDPI; scope based on Ulrichsweb |
| 3 | Where does the knowledge go to? | Citation analysis of journals citing Publications; data by OC API data; |
| 4 | How multidisciplinary is Publications? | Comparison of cited and citing journals and their network, based in WoS data; |
| 5 | How international is Publications? | Author country analysis; |
| 6 | To which topics does Publications contribute? | Keyword analysis with VOSViewer and MaxQDA; |
| 7 | What does the author network look like? | Authorship network with VOSViewer. |
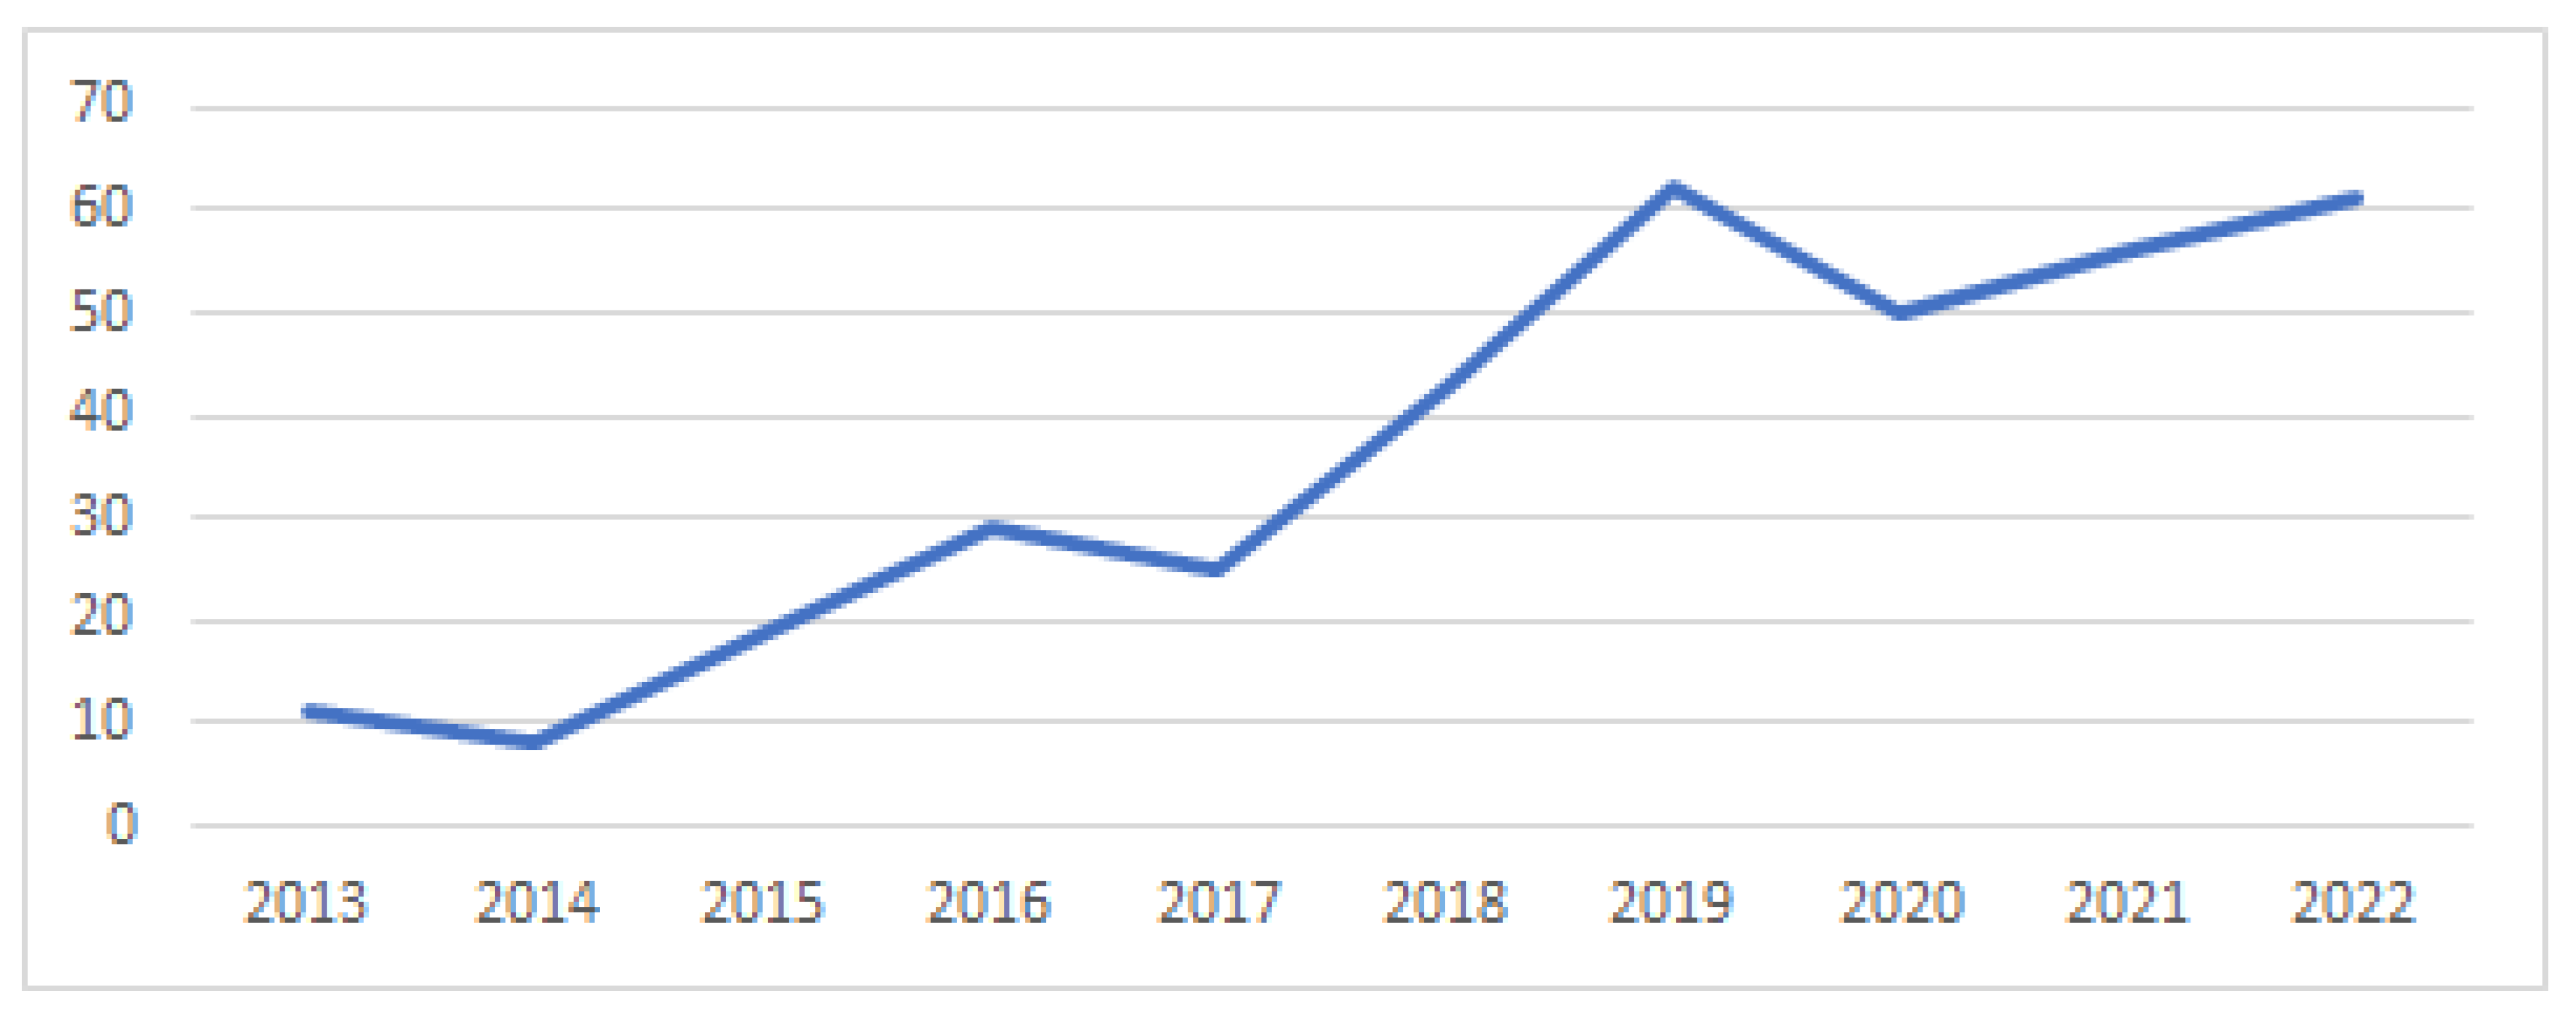
| Year | Nr. of Papers | Nr. of Authors | Nr. of References | Nr. of Citations | Nr. of Unique Countries |
|---|---|---|---|---|---|
| 2013 | 11 | 21 | 483 | 77 | 7 |
| 2014 | 8 | 15 | 308 | 47 | 4 |
| 2015 | 19 | 32 | 570 | 170 | 8 |
| 2016 | 29 | 69 | 1127 | 222 | 22 |
| 2017 | 25 | 64 | 844 | 189 | 26 |
| 2018 | 43 | 108 | 1792 | 219 | 23 |
| 2019 | 62 | 162 | 3107 | 399 | 25 |
| 2020 | 50 | 139 | 2438 | 175 | 26 |
| 2021 | 56 | 142 | 3520 | 178 | 29 |
| 2022 | 19 | 39 | 982 | 11 | 17 |
| 5-Year Period | Nr. of Papers | Nr. of Authors | Nr. of References | Nr. of Citations | Nr. of Unique Countries |
|---|---|---|---|---|---|
| 2013–2017 | 92 | 201 | 3332 | 705 | 36 |
| 2018–2022 | 230 | 593 | 11,839 | 982 | 53 |
| Document Type | Nr. of Documents | Percentage of Documents |
|---|---|---|
| article | 255 | 79.19 |
| case report | 15 | 4.66 |
| review | 15 | 4.66 |
| communication | 10 | 3.11 |
| commentary | 6 | 1.86 |
| essay | 5 | 1.55 |
| opinion | 4 | 1.24 |
| perspective | 2 | 0.62 |
| letter | 2 | 0.62 |
| systematic review | 2 | 0.62 |
| short note | 1 | 0.31 |
| conference report | 1 | 0.31 |
| concept paper | 1 | 0.31 |
| discussion | 1 | 0.31 |
| viewpoint | 1 | 0.31 |
| book review | 1 | 0.31 |
| total | 322 | 100 |
| Descriptives | Nr. |
|---|---|
| Number of references | 15,171 |
| Average number of references per article | 47 |
| Number of unique referenced sources | 5277 |
| Average reference count per unique source | 2 |
| Journal Name 2 | Nr. of Single Articles Referencing the Journal | Ulrichsweb Subject | Web of Science Category |
|---|---|---|---|
| Scientometrics | 103 | Sciences: Comprehensive works | Information Science and Library Science (SSCI) |
| JASIST1 | 99 | Library and Information Sciences Computers–Information Science and Information Theory | Information Science and Library Science (SSCI) |
| Nature | 84 | Sciences: Comprehensive works | Multidisciplinary Sciences (SCIE) |
| Publications | 83 | Publishing and book trade | Information Science and Library Science (ESCI) |
| PLOS ONE | 75 | Medical Sciences Sciences: Comprehensive works | Multidisciplinary Sciences (SCIE) |
| Science | 63 | Sciences: Comprehensive works | Multidisciplinary Sciences (SCIE) |
| Learned Publishing | 57 | Publishing and book trade | Information Science and Library Science (SSCI) |
| PNAS US | 46 | Sciences: Comprehensive works | Multidisciplinary Sciences (SCIE) |
| Journal of Informetrics | 40 | Computers–Information Science and Information Theory | Information Science and Library Science (SSCI) |
| Research Policy | 32 | Sciences: Comprehensive works Business and economics management | Management (SSCI) |
| PeerJ | 40 | No information | Multidisciplinary Sciences (SCIE) |
| Descriptives | Nr. |
|---|---|
| Number of cited articles | 259 |
| Number of citations | 1687 |
| Number of unique citations (based on doi) | 1392 |
| Average number of citations per article (based on COCI) | 6.51 |
| Average number of citations per article (based on MDPI data) | 6.84 |
| Number of unique citing sources | 705 |
| Journal Name | Nr. of Citations of Articles in Publications’ | Ulrichsweb Subject | Web of Science Category |
|---|---|---|---|
| Publications | 197 | Publishing and book trade | Information Science and Library Science (SSCI) |
| Scientometrics | 91 | Sciences: Comprehensive works | Information Science and Library Science (SSCI) |
| Sustainability | 50 | Environmental studies | Green and Sustainable Science and Technology | Environmental Studies (SSCI) |
| Learned Publishing | 44 | Publishing and book trade | Information Science and Library Science (SSCI) |
| JASIST | 19 | Library and Information Sciences Computers–Information Science and Information Theory | Information Science and Library Science (SSCI) |
| PLOS ONE | 19 | Medical Sciences Sciences: Comprehensive works | Multidisciplinary Sciences (SCIE) |
| Journal of Informetrics | 18 | Computers–Information Science and Information Theory | Information Science and Library Science (SSCI) |
| Accountability in Research | 17 | Sciences: Comprehensive works | Medical Ethics (SCIE) |
| F1000Research | 17 | Biology Medical sciences | no entry |
| Country | Nr. of Articles | % of Articles without Collaboration | % of Articles with One Other Country | % of Articles with Two and More Countries |
|---|---|---|---|---|
| USA | 64 | 73% | 22% | 5% |
| Spain | 51 | 73% | 24% | 4% |
| Germany | 38 | 55% | 32% | 13% |
| UK | 37 | 73% | 14% | 14% |
| Italy | 18 | 61% | 22% | 17% |
| France | 13 | 31% | 46% | 23% |
| Australia | 12 | 83% | 8% | 8% |
| Canada | 12 | 67% | 25% | 8% |
| Portugal | 12 | 50% | 42% | 8% |
| Brazil | 10 | 70% | 30% | 0% |
| Country | Nr. of Documents | Collaborations with Unique Countries 1 | Nr. of Collaborations With other Countries 2 |
|---|---|---|---|
| USA | 19 | 4 | 4 |
| UK | 16 | 14 | 17 |
| Germany | 7 | 11 | 13 |
| Canada | 6 | 1 | 1 |
| Italy | 5 | 11 | 13 |
| France | 4 | 11 | 12 |
| Turkey | 3 | 10 | 10 |
| Romania | 3 | 3 | 3 |
| Belgium | 2 | 6 | 6 |
| Portugal | 2 | 3 | 3 |
| Vietnam | 2 | 3 | 3 |
| New Zealand | 2 | 1 | 1 |
| Country | Nr. of Documents | Collaborations with Unique Countries 1 | Nr. of Collaborations with Other Countries 2 |
|---|---|---|---|
| USA | 45 | 17 | 26 |
| Spain | 45 | 14 | 24 |
| Germany | 31 | 13 | 25 |
| UK | 21 | 11 | 15 |
| Italy | 13 | 3 | 4 |
| Portugal | 10 | 2 | 5 |
| France | 9 | 13 | 16 |
| Norway | 8 | 11 | 13 |
| The Netherlands | 7 | 11 | 17 |
| Austria | 7 | 14 | 14 |
| Canada | 6 | 12 | 13 |
| Australia | 6 | 3 | 3 |
| Keywords 2013–2017 | Nr. of Occurrence > 2 | Keywords 2018–2022 | Nr. of Occurrence > 7 |
|---|---|---|---|
| open access | 20 | open access | 41 |
| bibliometrics | 7 | open science | 26 |
| scholarly publishing | 7 | research | 11 |
| publishing | 5 | scholarly communication | 11 |
| journals | 4 | social media | 11 |
| article processing charges | 3 | higher education | 10 |
| citation analysis | 3 | publishing | 10 |
| journal | 3 | bibliometrics | 8 |
| peer review | 3 | fake news | 8 |
| plagiarism | 3 | ||
| scientific fraud | 3 |
| Nr. of Authors | Nr. of Documents | Author Name | Nr. of Documents | Total Link Strength |
|---|---|---|---|---|
| 1 | 111 | Quan-Hoang Vuong | 4 | 16 |
| 2 | 84 | Nobes et al. * | 1 | 15 |
| 3 | 62 | Astrid Orth | 2 | 14 |
| 4 | 38 | Birgit Schmidt | 2 | 14 |
| 5 | 10 | Manh-Toan Ho | 2 | 11 |
| 6 | 8 | Lisa Matthias | 2 | 11 |
| 7 | 5 | Najko Jahn | 2 | 11 |
| 8–10 | 1 | Andrea Bertino | 2 | 10 |
| 11–15 | 0 | Thu-Trang Vuong | 2 | 10 |
| 16 | 1 |
Disclaimer/Publisher’s Note: The statements, opinions and data contained in all publications are solely those of the individual author(s) and contributor(s) and not of MDPI and/or the editor(s). MDPI and/or the editor(s) disclaim responsibility for any injury to people or property resulting from any ideas, methods, instructions or products referred to in the content. |
© 2023 by the authors. Licensee MDPI, Basel, Switzerland. This article is an open access article distributed under the terms and conditions of the Creative Commons Attribution (CC BY) license (https://creativecommons.org/licenses/by/4.0/).
Share and Cite
Heck, T.; Tunger, D.; Rittberger, M. Scholarly Communication over a Decade of Publications. Publications 2023, 11, 16. https://doi.org/10.3390/publications11010016
Heck T, Tunger D, Rittberger M. Scholarly Communication over a Decade of Publications. Publications. 2023; 11(1):16. https://doi.org/10.3390/publications11010016
Chicago/Turabian StyleHeck, Tamara, Dirk Tunger, and Marc Rittberger. 2023. "Scholarly Communication over a Decade of Publications" Publications 11, no. 1: 16. https://doi.org/10.3390/publications11010016
APA StyleHeck, T., Tunger, D., & Rittberger, M. (2023). Scholarly Communication over a Decade of Publications. Publications, 11(1), 16. https://doi.org/10.3390/publications11010016