Article

Knowledge Production: Analysing Gender- and Country-Dependent Factors in Research Topics through Term Communities

by
Parminder Bakshi-Hamm
1 and
Andreas Hamm
2,*
1
Business Studies, iba-University of Cooperative Education, 50933 Cologne, Germany
2
German Aerospace Center (DLR), Institute for Software Technology, 51147 Cologne, Germany
*
Author to whom correspondence should be addressed.
Publications 2022, 10(4), 45; https://doi.org/10.3390/publications10040045
Submission received: 18 August 2022 / Revised: 17 October 2022 / Accepted: 14 November 2022 / Published: 23 November 2022

Abstract

:
Scholarly publications are among the most tangible forms of knowledge production. Therefore, it is important to analyse them, amongst other features, for gender or country differences and the incumbent inequalities. While there are many quantitative studies of publication activities and success in terms of publication numbers and citation counts, a more content-related understanding of differences in the choice of research topics is rare. The present paper suggests an innovative method of using term communities in co-occurrence networks for detecting and evaluating the gender- and country-specific distribution of topics in research publications. The method is demonstrated with a pilot study based on approximately a quarter million of publication abstracts in seven diverse research areas. In this example, the method validly reconstructs all obvious topic preferences, for instance, country-dependent language-related preferences. It also produces new insight into country-specific research focuses. It emerges that in all seven subject areas studied, topic preferences are significantly different depending on whether all authors are women, all authors are men, or there are female and male co-authors, with a tendency of male authors towards theoretical core topics, of female authors towards peripheral applied topics, and of mixed-author teams towards modern interdisciplinary topics.

1. Introduction

1.1. Motivation and Objectives

Publishing research findings in scientific journals, conference proceedings, edited volumes, or monographs has become an essential part of scientific and academic work, further intensified by the evolution of the Internet and e-publications. Publications provide, on the one hand, a platform for researchers to showcase their expertise and gain visibility and recognition (and the rewards and status that follow), but even more importantly, on the other hand, they are a testimony of scientific achievements and knowledge production. Publications are a claim to a highly sought-after and evermore crowded public (intellectual) space, and carry with them, in the best of cases, the potential to influence thought, ideas and debates on a global scale and ultimately have a stake in posterity. Hence, it is both appropriate and interesting to attempt to track trends in knowledge production as reflected in publication activity.
An exponential growth of publication numbers has long since made it difficult, if not impossible, for researchers to maintain an overview of publication activities even in narrow subject areas. Bibliographic databases, citation indexes and publication search engines such as Web of Science1, Scopus2, Dimensions3, Crossref4, Google Scholar5, AMiner6 or OpenAlex7 have become indispensable tools for all stakeholders in the research sector.
These tools also form the basis of numerous bibliometric investigations regarding academic output in quantity and impact, suggesting often-disputed measures for assessing the success of individual researchers, of academic institutions and of national research ecosystems. In addition, bibliometrics have been used to study structural inequalities in the research sector, in particular regarding gender imbalance (see Section 1.2).
Most of the bibliometric studies focus methodologically on statistical analyses of publication numbers and citation counts or graph-theoretical analyses of citation or co-citation networks. However, since the large-scale bibliographic databases mentioned above contain abstracts for many of the listed publications, it is also possible to include content-based aspects on the level of abstracts into such studies.
The present paper proposes a new method of detecting content-related trends in the publication output of different groups of authors. Here, the authors are distinguished in particular according to their gender and the countries they are based in.
The method is based on a recent variant of community detection in term co-occurrence networks [1].
The objectives of this paper are:
  • To provide a case study as proof of concept for the suggested method with publication abstracts from four sample years in seven diverse research areas.
  • To make some observations about gender and country differences in research topics within those research fields.
An implicit goal of this paper is also to make a case for more detailed and consistent data collection to enable further analyses.
Insights into content-based differences between various groups of authors are highly relevant for two reasons: one, they can contribute to understanding the mechanisms as to why quantitative disparities in publishing behaviour and impact arise, and two, they can hint at group-specific strengths that can be leveraged by encouraging a more balanced share of diverse groups in scientific publications.

1.2. Related Work

Country comparisons of scientific publishing quantities and impact based on authors’ affiliations are standard aspects of bibliometrics. One purpose of such comparisons is to obtain information on the requirements and effectiveness of public national research funding [2], although recent studies could not find evidence for a significant positive correlation between publication impact metrics and government funding [3]. As for raw publication and citation numbers, they can be readily obtained for various countries and subject areas from [4].
Bibliometric databases have also been used for numerous studies on gender representation among authors of scientific publications. Technically, this is not as easy as analysing country dependencies: while a mapping of a publication to one or several countries is evident from affiliation addresses, which are normally part of the publication’s metadata, the gender of the authors is never directly accessible in the publication databases.
Here, only a few examples of such studies are mentioned, which are by no means exhaustive but indicate the various ways of identifying the gender of authors. Furthermore, Holman et al. [5] contains a list of 61 studies comparing the numbers of male and female authors in academic publications.
While early research, for example, Cole et al. [6], who evaluated the publication behaviour of 263 men and 263 women after they obtained their Ph.D. degrees in 1970 during the following 12 years, used relatively small sets of authors so that an explicit individual assignment of author gender was feasible, more recent large-scale studies, such as Huang et al. [7], who tracked the academic publishing behaviour of more than 1.5 million authors between 1955 and 2010 in the Web of Science database, rely on automatic procedures for recognizing an author’s gender from their name through commercial services that gather gender information from web content, social media, registry information, and census data. This is also true for Holman et al. [5], where more than 10 million science, mathematics and medicine papers from the medical publications database PubMed and the science-focussed preprint server arXiv.org were analysed.
Before such services were available, some studies such as Lariviere et al. [8], who evaluated about 5 million articles in the Web of Science database between 2008 and 2012, or West et al. [9], who used the JSTOR corpus with scholarly publications from science and humanities spanning the time from 1545 until 2011, derived their own first-name-to-gender associations from national census data, Wikipedia name lists for various countries, and US social security records.
The automatic gender identification by first names does not work perfectly, of course, as discussed further in the methods section. For this reason, medium-sized studies such as Mohammad [10], an analysis of the gender gap in the ACL Anthology, which is a digital repository of approximately 50,000 open access articles in the field of natural language processing, still take the trouble to manually curate their author gender lists.
In exceptional cases, it is possible to work with large data sets that include author gender with no need to look up the gender in external sources or guess the gender by name. Duch et al. [11] have collected nearly half a million publications in seven scientific and technological research areas at top US research institutions. As these publications are not taken from a general database but directly from faculty rosters, the gender of authors is precisely known. Similarly, Abramo et al. [12] evaluated the publications of nearly 18,000 academics listed in the Italian Observatory of Public Research, which also records the gender of researchers, and Roerstad et al. [13] worked with 19,000 scholarly publications accessible through the Norwegian Research Information System, again with authors’ gender.
Most of the studies mentioned above highlight gender differences in publication numbers, in productivity (publications per year), impact, author position, and collaboration patterns. There is a broad consensus that in nearly all subject areas, women are underrepresented in publication numbers, and that this gender gap is closing only slowly. There are some countries in which the publication gender gap is particularly pronounced, such as Japan in world-wide comparison or Germany within Europe, while several East European countries have already reached female publication numbers of over 50% [5]. Thus, the apparent equal rights accorded to democratic political systems are not entirely effective in terms of gender and academia, and the reasons for this need to be further explored.
For a long time, it was assumed that low female publication numbers were caused by lower productivity [6]. However, more recent statistics suggest that during their active research career, female and male scientists have nearly the same yearly publishing rates, so lower female publication counts are most likely due to the higher female dropout rates from academic careers [7].
While the above-mentioned and many other studies of differences in scholarly publication activities between female and male authors identify gender inequalities in quantity, productivity, impact, and collaboration, the present article addresses yet another aspect of differences—in subject specialisation and thematic orientation.
It is well known that in some disciplines—such as physics and computer sciences—the publication gender gap is especially high. Duch et al. [11] analysed data from seven other STEM disciplines and saw a correlation between lower female publication rates and typical research spending related to those disciplines, with molecular biology being the most cost-intensive discipline with markedly low female publication rates.
However, looking at somewhat finer levels of specialisation should be more revealing. In publication databases that include a classification into research sub-fields, this is relatively easy. For instance, Holman et al. [5] found, with reference to the sub-classes of medical research fields in the medical publications database PubMed, that the female share of medical publications ranges between less than 20% in orthopedics to about 50% in gynecology. The publication database Scopus uses a classification of all research fields into 27 major subject areas and more than 300 sub-areas. A recent Scopus report on gender participation in research [14] used this classification and corroborated the variations within the sub-areas of the subject area of medicine. The lowest female share in the sub-area of surgery is drastically lower than the highest female share in the sub-area of fertility and birth. Yamamoto et al. [15] identified sub-field-specific variations of female publication share in computer science by analysing contributions to sub-field-specific conferences, ranging from hardly more than 6% in theoretical computer science to 32% in human-computer interactions and 42% in computer science education.
However, differences should also show up on an even more refined level of research topics. Since information about the research topics is never directly accessible in the publication metadata, extracting topic information requires more indirect methods. Mohammad [10] took a rather basic approach to analysing topic differences: comparing the frequency of characteristic bigrams used by female or male authors. The fact that in their sample of articles from the area of natural language processing, only 15% of occurrences of the bigram dependency parsing can be attributed to female authors, in contrast to 50% of the occurrences of the domain-specific bigram (also supported by several similar cases), is a mild indication that female authors are less likely to write about highly technical topics.
A more appropriate way of identifying topics in a document collection goes back to co-word analysis [16], which searches for groups of characteristic words that frequently occur together in documents. These word groups represent the topics dealt with in the document collection. While in early versions, the identification and grouping of characteristic words was a manual task for analysts, by now, user-friendly open-source software tools such as VOSviewer [17] and bibliometrix [18] use methods of automatised unsupervised keyword extraction [19] as well as network clustering [20] and community detection [21] for sketching the thematic structure of text corpora. These methods are effective for obtaining an overview over topics.
A more in-depth analysis of topics can be based on probabilistic generative models of document creation, termed topic models. The best-known variant of this approach is latent Dirichlet allocation (LDA) [22]: assuming that the distribution of topics within a corpus as well as the distribution of words within a topic both follow Dirichlet distributions, one can infer the word probabilities within each topic from the observed distributions of words in the corpus documents, provided one chooses suitable values for some hyperparameters—the number of topics and the Dirichlet distribution parameters. The basic assumptions of LDA can hardly be considered realistic; nevertheless, it has resulted in many interesting examples of automatic topic discovery and is widely used.
There are a few applications of LDA and similar generative models that aim at finding gender differences in topic selection within scientific documents of narrow sub-areas, as follows:
Vogel and Jurafsky [23] used LDA to identify 73 substantive topics in the ACL Anthology of about 15,000 papers from the field of computational linguistics for which the first author’s gender could be determined. Within the framework of the LDA model, it is then possible to compare the probabilities that a female first author or a male first author writes about a particular topic, and it turns out that men chose formal topics such as dependency parsing or formal semantics with a higher probability, whereas women tended more toward topics with social or conversational context such as sentiment analysis or tutoring systems.
Nielsen and Börjeson [24] used LDA to analyze 36 topics in nearly 28,000 papers from the Web of Science category Management published between 2007 and 2013 for which all authors’ genders could be determined by a commercial name-to-gender service. By a correspondence analysis between topics and gender categories, they found that quantitative and efficiency-oriented topics such as operations algorithms, corporate finance, and supply chain management were male-dominated, while more social topics such as human resources, structural inequality, and healthcare were female-dominated.
Key and Sumner [25] used the structural topic model (STM) [26], another generative probabilistic approach similar to LDA but with the exploitation of document metadata in addition to the document text. They looked at nearly 2000 Ph.D. theses in the United States between 2000 and 2013 in the field of political science, deriving the author genders from the author names using a predictive model trained on a name list from the US Social Security Administration. Among the 61 topics found, race, healthcare, and narrative and discourse were more prevalent among women, whereas voting, critical theory and interstate war are preferred by men.
Heiberger [27] carried out a similar analysis for a larger dataset of more than 41,000 sociological Ph.D. theses in the United States from 1980 to 2015, resulting in 60 topics. The topics feminism, motherhood and caregiver indicated a strong preference by women, whereas the topics law enforcement, industry and crime were preferred by men.
Conde-Ruiz et al. [28] used STM to look at more than 5000 articles published in the top five economics journals between 2002 and 2019, for which they determined authors’ genders by consulting first-name databases and manual research and found 54 topics. Here, health and gender was the topic with the highest proportion among women authors, and microdecision theory was the topic with the lowest proportion among women authors.
Bittermann et al. [29] employed LDA on nearly 18,000 German language Ph.D. theses between 1968 and 2017 in the field of psychology. They identified 48 topics, of which most do not show a constant significant difference in preference between women and men, but there is one topic which is clearly more often addressed by women: mother-child relations and development in early childhood, as well as one topic which is chosen more often by men: statistics and methods.
In summary, the preferences revealed by LDA seem to corroborate the (arguably stereotypical) observation of Su et al. [30] that men tend to prefer to work with things while women tend to prefer to work with people. Thelwall et al. [31] took this observation as a basis for their investigations of gender preferences in a broader range of scientific publications. They extracted from the Scopus publication database nearly 300,000 articles published in 2017 for which the first author was located in the United States and had a first name with clear gender association, making sure that 285 of the subject sub-areas of the Scopus classification were all represented by at least 50 articles each. With this material, they established gender preferences in research topics. However, they did not use a method of automatic topic detection but identified in each subject area the terms that were used most frequently by men and those that were used most frequently by women. They manually and qualitative fit these frequent words to themes, and in this way, they arrived at gender-associated themes that spanned several research areas. While some of the gender-associated themes were consistent with the working-with-people-or-things dichotomy, there were notable exceptions, and therefore, this reasoning is not sufficient to fully explain the gender preferences in research topics.

2. Materials and Methods

2.1. Document Sets Used

In order to show the feasibility of our proposed method of discovering group-specific tendencies in the choice of research topics, we worked with sets of publications from various research areas and from different years. As a data source, we used the curated abstract and citation database Scopus.
We downloaded 28 sample sets of publication metadata and abstracts via the Scopus API8. Each sample set consisted of all listed publications with abstracts of one year within one of the Scopus subject sub-areas. More specifically, we selected seven sub-areas and looked at their publications in the four years marking four decades, 1990, 2000, 2010 and 2020, in order to obtain a good representation of their development over time.
The seven sub-areas selected were:
  • Language and linguistics (Scopus sub-area 1203)
  • Literature and literary Theory (Scopus sub-area 1208)
  • Strategy and management (Scopus sub-area 1408)
  • Human-computer interaction (Scopus sub-area 1709)
  • Aerospace engineering (Scopus sub-area 2202)
  • Toxicology (Scopus sub-area 3005)
  • Gender studies (Scopus sub-area 3318)
This choice was motivated by several factors:
  • In order to keep the sample set sizes sufficiently small for the purposes of a pilot study, we avoided extremely active sub-areas that produce well over 30,000 publications per year.
  • Automatic topic detection algorithms still need some subject expertise for topic interpretation. Therefore, we chose topics about which we know sufficiently well ourselves or where we can access expertise easily.
  • We wanted to include a diverse range of disciplines.
  • From the more technical areas, we chose one sub-area with notably low female representation (aerospace engineering), one with a relatively high amount of female representation (toxicology), and in the male-dominated field of computer sciences, the sub-area with the highest female participation (human-computer interaction).
In Table 1, we show the number of publications in each of the 28 yearly sub-area sets. We also sum up the total number of publications in each sub-area, as we worked with sub-area corpora that contained all four years. Altogether, our study comprises 277,855 publications.
Not surprisingly, the publication numbers are rising rapidly in all sub-areas, but there are obvious differences: in the well-established area of toxicology, which has a high degree of internationalisation, publication numbers in Scopus have only tripled during the last 30 years. In contrast, in the areas of human-computer interaction and literature and literary theory, the numbers of Scopus-indexed publications have multiplied by a factor in the range of 50 during the same time. The reasons for this, however, are presumably quite different for each case. Human-computer interactions was a rather new research specialisation in 1990 and has, in the meantime, developed into an essential part of the exponentially growing field of computer science. On the other hand, literature and literary theory is a very classical academic field with its own traditions of scholarly communication—often separated in country-specific language streams, which were hardly integrated into the Scopus indexing in 1990, but globalisation trends have since then led authors to aim for publications with international visibility, and they are therefore more likely to appear in Scopus.
These observations also fit well with the subject-specific publication counts that can be accessed in Scopus. While the growth of publication counts is exponential across all subjects, well-established fields of science such as pharmacy or engineering have not shown clearly accelerated growth since 1990, quite in contrast to the field of computer science with much more rapidly growing publication counts. The Scopus counts for arts and humanities as well as for social sciences are, at a much lower absolute level, rapidly growing too, but the increase is quite sudden in certain years, implying that it is caused by increased journal coverage in Scopus rather than by intensified research activities.
It is important to note that Scopus does not equally represent publications in all academic fields—in particular, in earlier times (see also [32,33]). In fact, implicit biases regarding subjects and languages are a valid point of criticism when publication databases such as Scopus are used for constructing supposedly absolute measures of global research activities [34,35]. However, such biases have only a limited effect on our investigations because we are not interested in comparing absolute publishing quantities but relative preferences in research topics.
As we aim to discover country and gender tendencies in topic preferences, we need to assign country and gender labels to the publications. These are inferred from the information available about the authors. Unlike in other studies, we refrain from putting special weight on the role of the first author in publications with multiple authors; while it is often true that the person who contributed most to a publication is named as first author, there are cases where several authors contribute equally, and also, it is not obvious that the person who did most of the work is necessarily the person who was most influential in choosing the research topics. We rather assume that all authors may be associated with the topic selection.
Hence, we have assigned countries and genders as follows: if the authors of a publication are affiliated with institutions in different countries, we count that publication equally for each of those countries (instead of trying to find an appropriate fractional counting). Regarding gender, we distinguish between three classes: publications where all authors are female, publications where all authors are male, and publications coauthored by women and men.
With respect to countries, we concentrated on the 14 highest-ranking countries in the Scimago Country Ranking [4]. Table 2 shows the counts of publications from these countries within our sub-area sets.
In all sub-areas, US-based publications show the highest counts. In the STEM and business areas, China is catching up rapidly—in 2020, China was even leading the publication numbers in the sub-areas strategy and management (China 6108 compared to US 5805), human-computer interactions (China 6903 compared to US 6067), and aerospace engineering (China 9661 compared to US 6438). Additionally, nearly all the other countries of the top 14 contribute more than a thousand publications to each of the sub-areas in our document set, so that here, we expect to obtain statistically meaningful results for all countries. The sub-area of language and linguistics is also well-represented in all countries. This is not the case in the sub-field of gender studies, which is clearly dominated by the English-speaking countries, while researchers in other countries might tend to publish in media of national standing that are not listed in Scopus. The sub-area of literature studies appears to be weakly represented in Scopus as a whole, with only the US, the UK, and Spain contributing more than 1000 publications to our sample set. This means that our findings in these sub-areas might not be globally representative but can still give an idea about topic tendencies among those scholars who seek international visibility.

2.2. Gender Attribution

For assigning gender to authors, we used the commercial name-to-gender service Gender-API9. Comparative studies [36,37] have shown that this service performs well among its competitors. Of course, there are serious problems in relying on name-to-gender services, as in several cultures, first names are not necessarily an indicator of gender. Additionally, the databases behind the name services are less complete for certain world regions. In addition, several names have different gender attributions depending on the country, and it is generally not possible to be certain about the country of origin of authors. Finally, non-binary gender identities are, unfortunately, totally out of the scope. Nevertheless, for large-scale studies, working with automatised services is the best option.
In detail, we assigned a gender to an author as follows:
  • First, we determined all given names and all affiliation countries of the author.
  • We took the first of the given names and—using Gender-API—calculated the average over all affiliation countries of the probabilities that it is female.
  • If the result was unclear, we added the average female probabilities for the second and further given names in case they existed.
  • If we ended up with an averaged female probability of at least 0.95, we considered the author female. If the female probability was less than 0.05, we considered the author male. In all other cases, we classified the gender of the author as unknown.
Small test samples indicated that the gender assigned with this method can be expected to be correct in more than 95% of the cases.
As mentioned earlier, we wanted to distinguish between three classes of publications:
  • Publications with all male authors;
  • Publications with all female authors;
  • Publications with male and female authors.
The potentially undecided result of each author’s gender attribution implied that a full classification of all publications needed additional sub divisions:
  • Publications with some male authors (and some authors of unknown gender);
  • Publications with some female authors (and some authors of unknown gender);
  • Publications where all authors have unknown gender.
Figure 1 shows in the example of the sub-area human-computer interactions that in the total—for all countries—in approximately half of the publications, the gender of the authors can be determined confidently (dark blue, dark red, and purple segments), whereas for the other half of the publications, there are uncertainties whether there are female and/or male authors involved (light blue, pink, and grey segments). (Similar diagrams for the other sub-areas and for absolute publication numbers are available in the Supplementary Materials.) It is obvious (through the size of the darker segments) that the gender determination works most reliably for Germany, France, Italy, Spain and Brazil, while it performs badly for China and South Korea and also not well for India and Japan. For the US, the UK, Canada and Australia the gender determination does not work as successfully as one might expect from the more familiar genderised European naming tradition, presumably because of the growing number of researchers with non-European backgrounds in these countries. While the problems of name-to-gender services with Asian first names are well-known, the relatively high number of first names with unrecognised gender in Russia is surprising. In publication studies that focus on Russia, it would be advisable to use family names instead of first names for gender attribution since Russian family names are typically gendered. However, for the purposes of our study we preferred to keep to the same procedure for all countries.
In the following, we include in our analysis of gender-dependent tendencies only those publications that fall into the three first-mentioned classes: dark blue (all male), dark red (all female), and purple (female and male) columns. This means that we removed the uncertainties about the gender assignment at the cost of a reduction of our sample set sizes. This perhaps decreased the statistical significance of our observations in particular for Asian countries, but there is no evident reason to expect that it will grossly distort noticeable gender tendencies in the relative topic preferences. However, in passing, we do note that the rising proportion of authors with non-gendered given names will pose a challenge for future large-scale studies of gender aspects in publication and citation counts.

2.3. Topic Detection Methodology

We will now turn to the central technical idea of this paper: how to detect topics in the sub-area corpora and how to assess to what extent the different author groups focus on these topics in their publications.
As mentioned in Section 1.2, a few studies have used LDA or similar topic models (i.e., algorithms for finding probability distributions for words used for writing about a topic) for the same aim. Here, we suggest a different approach. We first describe our method of detecting topics and assessing topic shares and will later outline the differences and potential advantages of this method over LDA.
Our procedure for detecting topics [1] consists of three steps: term extraction, term community detection, and term community presentation.
This idea falls in the tradition of co-word analysis [16] and KeyGraph [38], which start by placing the keywords of each corpus document into a network: two keywords are connected by a link with weight n if there are n documents that jointly contain both these keywords. Inspecting this network, one can then identify groups of keywords that are strongly interlinked, and these groups are indicative of certain topics.

2.3.1. Term Extraction

In our version of the method, we included not only the keywords but a more substantial fraction of all document terms into this co-occurrence network. Concretely, given a corpus D = { d 1 , , d N } of N text documents d i , we subjected every document d i to the following steps of term extraction:
(E1)
Throughout the documents, we identified word combinations that are likely to be meaningful compound terms, such as “European Union” or “Leonardo Da Vinci”. Here, we modified the original procedure of [1], where compound terms were discovered by named entity recognition [39]. Instead, we used Wikification, i.e., we checked for word combinations that are titles of a Wikipedia page or linked to a Wikipedia page. In this way, we could also recognise compound terms that are not named entities but rather concepts, for instance, “artificial intelligence”.
(E2)
We normalised and cleaned the remaining words in the following way: we lemmatised the words, removed stop words, words consisting only of one or two characters, words consisting mostly of digits, and words containing control characters.
(E3)
We retained only compound terms, nouns, proper nouns, and adjectives.
(E4)
We ranked the remaining terms according to their significance for characterising the content of the document. The method we used for ranking term significance, called posIdfRank, derives from graph-based keyword extraction methods such as TextRank [40] and PositionRank [41] but also involves the inverse document frequency (Idf) (where the document frequency of a term denotes the number of documents within the corpus that contain that term), similar to its role for capturing term specificity in tf-idf [42]. Technically, this is achieved by computing a probability distribution on the terms of a document which is constructed in a way that favours specific terms standing close to each other, tendentially more at the beginning of the text than at its end. The details of the algorithm are described in [1]. We set its parameter values as follows: the damping factor α = 0.85 , the exponent of decrease β = 0.9 , and the window size for counting terms as being close w = 5 .
(E5)
We removed from the documents all terms in the lower half of this significance ranking as they are unlikely to contribute to insights about the document’s topic. (The percentage of terms we kept is actually a parameter of the method and should be chosen depending on the average length of the corpus documents (see [1]). Here, we fixed it to 50% based on experience with documents of similar length.)
(E6)
We added one further step, which was not included in [1]: we omitted all terms falling below a minimum document frequency D min , which here was set to 3 (in corpora with significantly more documents, one should choose a greater value). The motivation for this was to omit terms which appear in only one or two documents of the corpus, as these terms are not likely to represent any topic broadly addressed in the corpus. Introducing D min does not only remove the noise introduced by terms accidentally appearing in just one or two documents but also speeds up computations.
To sum up, steps (E1) to (E6) extract terms from a document that are both characteristic for its content as well as useful for connecting it with other documents. While the resulting list of terms is similar to what is usually called a keyword list, it is typically longer and contains additional terms which by themselves do not summarise the key concepts of the document but are nevertheless helpful for its characterisation. By keeping more than the essential keywords in our term list, we gained a higher chance of detecting associations between documents that do not use the same keywords.
As an example, we show one of the documents of the strategy and management corpus, namely the publication [43]. The Box 1 displays its title and abstract, and after that, it displays the terms extracted by the procedural steps (E1) to (E6).
Box 1. Example for extracted terms.
Publications 10 00045 i001

2.3.2. Term Community Detection

With all the terms extracted from the N documents, we set up a term co-occurrence network. A network is formally defined by specifying its node set V and the link weights W i j between any two connected nodes v i V and v j V . In the present case, V is the set of all extracted terms, and W i j is the number of documents in which the two terms v i and v j appear together.
We built one co-occurrence network for each of the seven selected Scopus sub-areas (using the publications from all four sample years). Table 3 shows, next to the publication numbers in the sub-areas, the network sizes, i.e., the number of nodes and the number of links.
While in traditional co-word map applications, the typical number of nodes is several hundred or a few thousand, we are dealing with tens of thousands of nodes and millions of links. This implies a drastic difference in the way one can handle the networks. In small- and medium-sized networks a graphical visualisation of the network can be helpful for intuitive insight into its structure. This is no longer possible for huge networks, where it is more effective to resort to purely computational means.
There are various algorithms that can detect strongly interlinked groups of nodes in a network, known as community detection algorithms [21]. For the discovery of groups of terms that represent topics, maximisation of the so-called generalized modularity [44] of the network—in generalisation of the modularity concept of Newmann [45]—has proven successful [1].
Formally, given a subdivision of the node set V into m groups of nodes, C = { C κ , κ = 1 , , m } , the generalised modularity with resolution parameter γ is defined as
H γ ( C ) = I ( C ) γ J ( C )
comparing the actual fraction of link weights within groups
I ( C ) = 1 2 m i , j within same group W i j
with the expected fraction of link weights inside groups for a random network
J ( C ) = 1 ( 2 m ) 2 i , j within same group k i k j
where we used the abbreviation k i = j W i j for the degree of node i and m = 1 2 i k i for the total link weight in the network.
Intuitively, the generalised modularity of C increases for a given network if the constituting groups of C have high inner-group link weights as compared to a random network and reaches its maximum when C represents the optimal subdivision of the node set into communities as groups of strongly interlinked nodes. The parameter γ influences how much one values the gain of additional intra-group link weights. With γ = 0 , one does not compare to the random situation at all, and therefore, the optimal solution is one all-embracing community. With γ , intra-group links practically do not get rewarded, so that the extreme subdivision into one-node communities appears as the optimal solution. Hence, γ can be used to influence the size and number of the detected communities: smaller values lead to a few big communities, while larger values lead to many small communities.
There are efficient algorithms which can be used for finding a group constellation C that approximately maximizes H γ ( C ) even for large networks. We use the Leiden algorithm [46]. Employing this algorithm produces—as desired—groups of strongly connected terms, which we call term communities and which we want to interpret as topics.
Considering the size of the networks we are dealing with, it is typical that a term community contains many hundreds or even many thousands of terms.

2.3.3. Term Community Presentation

It is not easy to discover a common theme behind hundreds or thousands of terms if one presents the term communities as unsorted lists. In order to facilitate interpretation, we arranged the terms of a term community in a stratified word cloud [47]. Figure 2 and Figure 3 show two examples. The strata in that representation are visualised by different colours. They are formed by clusters in a semantic word embedding, obtained by a hierarchical clustering algorithm. Semantic word embeddings are mappings of words to vectors that map semantically related words to metrically close vectors. In other words, the strata are automatically generated groups of terms with similar meanings. In passing, we note as a technical detail that here—unlike in [47] and [1]—we did not use a pretrained fastText embedding [48] but a pretrained ConceptNet Numberbatch embedding [49] from 201910, which reproduces semantic similarity even more convincingly.
The word size within the strata of the stratified word cloud decreases with a diminishing Bayesian average [50] of the posIdfRank of the term within the corpus (see [1]). In this way, the most characteristic terms within each stratum are highlighted.
Usually, it is possible to get a clear idea of the topic by looking at the stratified word cloud. While each term community does contain several idle or even misleading words, a majority of prominent terms reveal its general gist, at least to experts in the subject area. In the example shown in Figure 2 from the sub-area gender studies, the abundance of terms connected to race, the very specific terms “black girl”, “black woman”, “black feminist“, ”culture of dissemblance“, etc., and the mention of various ethnicities make it clear that this term community describes the topic race and gender. The other example, Figure 3, from the sub-area human-computer interactions, contains many terms referring to speech and conversation, as well as typical materials and applications (”digital library”, “language understanding”, “sentiment analysis”, “speech emotion recognition”, “image captioning”) pointing to the topic of natural language processing.
In cases where the stratified word cloud does not reveal a topic conclusively, it helps to look at documents that contain a relatively large proportion of terms of that term community, because the topic will stand out in the majority of these documents.

2.3.4. Assessing Topic Shares in Documents and in Document Groups

The procedures described in the previous paragraphs served to generate a set of m term-communities, C = { C κ , κ = 1 , , m } . Each term community C κ is a collection of terms and represents a topic. For every document d, one can count the number N κ ( d ) of how often a term of C κ appears in d (if a term appears repeatedly in the document, it is not only counted once but also repeatedly). Then, the share of the topic C κ within the document d can be calculated as
s κ ( d ) = N κ ( d ) λ = 1 m N λ ( d ) ,
which is the proportion of terms belonging to that topic among all characteristic terms in d.
From this, one can calculate three measures for the topic allocation in a sub-corpus D ^ = { d 1 , . . . , d M } of the total corpus D = { d 1 , . . . , d N } ( M N ), for instance, in the sub-corpus of all the documents written by authors working in Australia or the sub-corpus of all the documents with female authors. We first specify how to compute these measures and then show a small sample calculation in order to make the formulae more comprehensible.
The first measure characterises the absolute topic contribution in the sub-corpus:
a κ ( D ^ ) = i = 1 M s κ ( d i ) ,
The second one measures the relative topic proportion within the sub-corpus:
r κ ( D ^ ) = a κ ( D ^ ) λ = 1 m a λ ( D ^ ) .
The third measure compares the relative topic proportion within sub-corpus D ^ to the mean topic proportion over all sub-corpora:
c κ ( D ^ ) = r κ ( D ^ ) r κ ¯ ,
where r κ ¯ denotes the mean of the values r κ ( D ^ α ) over all non-overlapping sub-corpora D ^ α of D .
In order to demonstrate the three different measures of topic allocation in sub-corpora, we go through their calculation in a small hypothetical corpus of six documents, of which two have female and four have male authors. For this example, we assume that the corpus deals with three different topics, and the topic shares s 1 , s 2 and s 3 are given in Table 4 for each of the six documents.
In Table 5, we show the resulting measures a κ , r κ , and c κ for the sub-corpus of documents written by female authors and the sub-corpus of documents written by male authors. Looking at the first topic, the values of a 1 show that this topic appears twice as often in the male sub-corpus compared to the female sub-corpus. However, r 1 shows that the relative prevalence of the first topic is the same for both male and female authored documents. Consequently, the topic proportion of topic 1 matches in both sub-corpora the mean proportion of topic 1: c 1 = 1 . Turning to the second topic, it is obvious that this topic is much rarer in the corpus and that female authors do not write about it at all. This results in c 2 ( D ^ female ) = 0 and c 2 ( D ^ male ) = 2 . The situation is different for the third topic. In absolute terms, the male sub-corpus contributes more: a 3 ( D ^ male ) = 1.2 > a 3 ( D ^ female ) = 0.9 . However, relative to the size of the sub-corpora, the female topic proportion is higher: r 3 ( D ^ female ) = 0.45 > r 3 ( D ^ male ) = 0.3 . This results in c 3 ( D ^ female ) = 1.2 , showing that the proportion of topic 3 in the female sub-corpus exceeds the mean by 20%, and the proportion in the male sub-corpus is accordingly below the mean: c 3 ( D ^ male ) = 0.8 .
In our comparison of topic preferences depending on gender and country, we focus on the topic proportion compared to the mean, c κ ( D ^ α ) ; every significant deviation from 1 indicates a group-specific topic preference. However, it is not easy to decide when a deviation can be considered significant. After all, determining topic shares by term counts is a rather vague method for which one cannot give robust error estimates. In addition, when it comes to gender dependencies, the uncertainties of name-to-gender mappings adds further imprecision. Therefore, a deviation of only a few percent from 1 is most likely not significant. What is also clear is that meaningful findings can only be obtained with sufficiently large sub-corpora not consisting of only a few documents, such as the small example of Table 4. However, if we observe for sub-corpora of several dozens, or even better, several hundreds of documents deviations from 1.0 of 20% or more ( c κ ( D ^ α ) 1.2 or c κ ( D ^ α ) 0.8 ), then we consider that as a relevant indication of a group-specific tendency in topic selection.

2.3.5. Relation of Term Community Detection to LDA

Since we mentioned in Section 1.2 several studies that employed probabilistic topic models such as LDA for similar research questions to ours, we want to briefly justify why we see term community detection as an attractive alternative.
Several authors have expressed concerns with the model assumptions of LDA, for instance, the unjustified choice of a Dirichlet prior, and see advantages in the use of network-based approaches in the tradition of co-word (word co-occurrence) analysis [51,52,53].
Nevertheless, an impressive number of successful applications of LDA have shown its worth for exposing thematic structures in principle. However, as for the details, the strict mathematical formulation of the model should not distract from the fact that the inferred distributions are only statistical contrivances based on unsubstantiated assumptions.
Term community detection, on the other hand, takes a purely phenomenological stance from the outset. It does not claim to be based on a generative process but simply observes distinctive word co-occurrence constellations. Hence, it is not a method for precisely measuring but for grossly estimating the extent to which a certain topic contributes to a document.
From a practical perspective, topic interpretability is often problematic in LDA. Interpretation may be easier or harder depending on the number of topics to be produced (which has to be preassigned) and is usually based on a relatively small number (7 to 20) of most probable words per topic with a risk of a too narrow or a too wide interpretation of the topic—depending on what words appear most frequently. In many studies, less than 75% of the topics could be interpreted.
On the other hand, term communities—when presented as stratified word clouds in which typically many dozens of characteristic terms stand out—can be interpreted in around 90% of the cases we have tried in various corpora. This holds true for a considerable range of the resolution parameter γ , which can be used to choose freely between a coarser or finer view of the topic structure of a corpus.
A recent study [54] has evaluated the strengths of term community-based topic detection from the perspective of social science applications, in particular its intuitive plausibility, the possibility to change the degree of topic resolution, and the good interpretability of topics.

3. Results

For our analysis of group-specific topic tendencies in the seven sub-area corpora listed in Table 3, we applied the method of term community detection as described in Section 2.3. The decision of which resolution parameter γ to use was guided by two considerations:
  • If γ was so small that only four or five topics were detected, those topics would be very broad, and group-specific tendencies could get blurred.
  • If γ was large, the method would detect finer topics, which could be expected to be group-specific; however, there would be only a few publications dealing with each topic so that the statistical relevance of observations would be low.
Therefore, we chose an intermediate value γ = 1.2 . With this value, we detected 9 to 15 topics in each corpus depending on the sub-area.
Altogether, for all seven sub-area corpora, we arrived at a total of 73 term communities, including the ones shown in Figure 2 and Figure 3. Data for all these term communities are available in the Supplementary Materials.
The term communities can be identified as topics for which it was straightforward to find descriptive labels. Figure 4, Figure 5, Figure 6, Figure 7, Figure 8, Figure 9 and Figure 10 list those topic labels for the respective sub-area corpora in their legends on the top-right-hand side.
Each of the seven figures depicts group-specific topic proportions compared to the mean, c κ ( D ^ α ) (cf. Section 2.3.4), for one sub-area corpus.
Each figure consists of three sub-diagrams, (a–c). Sub-diagram (a) shows relative topic proportions for the four years, sub-diagram (b) shows relative topic proportions for the 14 top publishing countries, and sub-diagram (c) shows relative topic proportions for publications authored solely by females, solely by males, and by mixed-author groups. The colour codes for the topics indicated in the legend of sub-diagram (a) apply to (b) and (c), as well.
Each block of column bars shows the variation of topic preferences within these groups. As an example, Figure 6c for the sub-area of strategy and management shows that in the publications of female authors, the topic personnel management and work ethics (green column) has a relatively high proportion, whereas in the publications of male authors, the topic process optimisation and modelling (orange column) has the relatively highest proportion. In the publications with mixed authorship of men and women, the topic raw materials and resource efficiency (blue column) predominates in terms of the relative topic proportions. For all other topics of the sub-area of strategy and management, no clear gender preference shows up since c κ ( D ^ α ) is mostly close to 1.
We will discuss notable observations on the results depicted in Figure 4, Figure 5, Figure 6, Figure 7, Figure 8, Figure 9 and Figure 10 in the next section. However, first, we provide some comments on the presentation of the results:
The scale used for the vertical axis is the same in all sub-diagrams (a) (years) and (c) (authors’ genders). However, in sub-diagram (b) (countries), the scale is adjusted to make maximum use of the drawing area. Generally, there are higher deviations of topic proportions from the mean in the country comparisons than in the year or in the gender comparison, and one can often find countries where topic proportions for certain topics deviate from the mean by more than 100%. In the temporal comparison and in the gender comparison, deviations do not reach that level but still show significant spikes.
We want to emphasise that the column heights of c κ ( D ^ α ) depicted in Figure 4, Figure 5, Figure 6, Figure 7, Figure 8, Figure 9 and Figure 10 do not say anything about the absolute quantities with which the various groups contribute to the topics. As an example, looking at Figure 8c, the blue column representing the topic aerospace economy is clearly higher for female authors than for male authors or mixed-author groups. However, this must not be interpreted as an indication that female authors contribute more in absolute numbers to that topic. Rather, it means that this topic is relatively predominant within publications by female authors when compared to the publications with at least one male author.
For statements about the absolute quantities with which the various groups contribute to the topics, one has to look at the measure a κ ( D ^ α ) , the absolute contribution of the topic with index κ to the sub-corpus D ^ α (see Section 2.3.4).
Figure 11 shows the absolute topic contributions for the sub-area aerospace engineering, where again the figure is divided into three sub-diagrams ((a) temporal grouping, (b) country grouping, and (c) gender grouping). This figure with the absolute contributions is the counterpart of Figure 8 with its relative proportions.
Since the various groups differ considerably with regard to the absolute values of the topic contributions, we use a logarithmic scale for the vertical axes. Thus, the linear growth of most columns over time in Figure 11a translates into an exponential growth of contributions in absolute terms for most topics.
In Figure 11b, it becomes clear that the United States and China contribute overwhelmingly to nearly all topics, followed by the UK, Germany, and India. Other countries, such as Brazil or Spain, lag behind the contributions of the leading countries by more than a factor of 10.
Figure 11c gives clear evidence of the fact that women publish much less on all topics of aerospace engineering than men. Contributions of mixed-author groups are significantly more common than those with all-female authors. One can see that the topic of aerospace economy has an accentuated importance among women, but generally, relative topic preferences are represented more clearly by the topic proportions compared to the mean, as shown in Figure 8. Therefore, we do not show the absolute topic contributions for all sub-areas here but refer to the Supplementary Materials.
However, one observation regarding the absolute topic contributions is important. As one can see from Figure 11, there are some combinations of topics and sub-corpora with very low absolute contributions of around 10. For those combinations, statements about relative topic preferences are much less reliable than for combinations where the absolute contribution is 100 or more, because when dealing with only a few publications, topic choice might be a coincidence or a highly individual decision rather than an indicator of group preference.
In Section 4, we interpret the results for the topic proportion compared to the mean, c κ ( D ^ α ) , depicted in Figure 4, Figure 5, Figure 6, Figure 7, Figure 8, Figure 9 and Figure 10, while at the same time, pointing out where those topic proportions might be less dependable because of small absolute topic contributions.

4. Discussion

4.1. Method Validation

One of the objectives of this article is to validate the suggested method of finding group-specific topic tendencies by calculating topic proportions based on term community detection, as explained in Section 2.3.
In the absence of ground truth data, which we could try to reproduce with our method, we inspect whether there are several examples in our results for c κ ( D ^ α ) showing group-dependent topic tendencies, which are undeniably correct because of convincing a priori arguments. If so, this also justifies putting trust in the method in cases where topic tendencies of groups were not clear from the outset.
It is indeed possible to find such examples because several of the topics identified are explicitly country-dependent. Referring to Figure 5, in the corpus for the sub-area literature and literary theory, there are three such topics:
  • Literature in Russia, Eastern Europe, and Central Asia
  • Literary scholarship in Romance languages
  • East Asian literature
In Figure 5b, one can clearly see corresponding peaks of the topic proportions compared to the mean—literature in Russia, Eastern Europe, and Central Asia (brown columns) has a prominent maximum in Russia, while the topic proportion compared to the mean is near or below 1 in all other countries. The topic proportion compared to the mean for literary scholarship in Romance languages (light grey columns) shows high peaks in Italy and Spain and also exceeds or reaches 1 in France, Canada, and Brazil. In all other countries, it is notably below 1. Finally, for East Asian literature, one finds maxima in South Korea, China, and Japan, whereas the topic has a low topic proportion compared to the mean in all other countries. In all three cases, c κ ( D ^ α ) allows the proper country-dependent topic tendencies to be identified correctly. This is a strong indication of the viability of the method.
We can find another case corroborating the method in the sub-area toxicology (see Figure 9b): the light blue columns in the diagram show clearly that there is a pronounced tendency to publish on the topic animal venoms in Brazil and Australia, while in all other countries, the proportion of this topic lies below the mean. This, too, is a very plausible assertion, as these are, among the listed countries, the two countries with the highest numbers of venomous animals [55].
We do not want to approach here too many topics with preconceptions about their group-specific tendencies but rather leave it to the remaining parts of Section 4 to identify tendencies from the c κ ( D ^ α ) values obtained in Section 3. However, we look at one example of a topic with an a priori certain gender dependency: in Figure 5, the light green columns represent the topic literature by and about women, identity, sexuality within the sub-area literature and literary theory. In keeping with conventional thought, one can assume that this topic is comparatively often dealt with by female authors, and this is exactly what can be seen in Figure 5c.

4.2. Temporal Tendencies

Now that we know that c κ ( D ^ α ) produces correct indications of topic tendencies, we observe noticeable peculiarities in Figure 4, Figure 5, Figure 6, Figure 7, Figure 8, Figure 9 and Figure 10. First, we concentrate on the temporal development visible in the (a) sub-diagrams of the figures.
However, at this point, it is useful to reiterate comments from Section 2.1. It is well known that the coverage of Scopus is lower for arts and humanities than for other subjects. In Section 2.1, we argued that even with incomplete coverage, it should be possible to recognize tendencies in comparative topic preferences. However, when it comes to comparing tendencies in various years, we do have the problem that the coverage of arts and humanities has changed quite drastically during each ten-year step in our data due to continuing efforts of the Scopus Content Selection and Advisory Board to add more content from the arts and humanities [56]. Hence, whenever we see temporal topic tendencies, we cannot distinguish whether they reflect actual shifts in research activities or whether they are caused by changes in the composition of what was available in Scopus in the course of these years.
Concretely, in the sub-area of language and linguistics (Figure 4a), we see that topics that were comparatively strong in 1990 (language-related medical issues and language and perception) and 2000 (computational linguistics and phonetics and dialects) are currently on the decline. This does not necessarily mean that research on these rather technical topics has lost prevalence, but that by now, more classical topics such as language of literary works or foreign language learning have gained coverage in Scopus.
Similarly, the column growth of the topic East Asian literature in the sub-area of literature and literary theory (Figure 5a) is most likely not produced simply by a shift in research interest toward this topic but probably also by the increasing coverage of Chinese publications on that topic in Scopus. Actually, in 1990, the coverage of this sub-area in Scopus was so low that no reliable conclusions about topic tendencies are possible. In passing, literature and literary theory is also different from the other sub-areas in our study in that it shows a broader thematic spread. Here, our method identified 15 topics, whereas the same parameter setting produced only up to 11 topics for each of the other sub-areas.
In the other sub-areas, coverage in Scopus has not changed so drastically over the years. Therefore, in those sub-areas, the comparison of column sizes from year to year reflects a more authentic shift in topic interest over time.
In the sub-area strategy and management (Figure 6a), we see that most topic proportions fluctuate around the mean without clearly significant deviations, with the exception of the two topics raw materials and resource efficiency and environmental management and urban planning, which have recently gained prominence. A third noteworthy topic of 2020 is healthcare and pandemic management, although its deviation from the mean is not as significant as that of the other two topics.
The sub-area human-computer interactions (Figure 7a) again does not show many striking deviations for most topics, but it is obvious that there is a shift of interest away from the topic interactivity and virtual reality and rising emphasis on the topic applications for transport and traffic. Additionally, in 2020, the topic medical foundations and applications received comparatively high attention.
In aerospace engineering (Figure 8a), there are clearly two growing topics: electric propulsion and energy storage and communication technology. Over time, the foundational topic hydrodynamics and aerodynamics has lost its dominance. The topics Space exploration and Earth observation peaked in 2000.
For the sub-area toxicology (Figure 9a), there is a strong tendency for an increased interest in the applied topics alcohol, drugs, and addictions as well as environmental toxicology compared to the more traditional topics neurotoxicology, metabolite toxicology, and reproductive toxicology.
For the sub-area of gender studies (Figure 10a), interest has shifted away from the topics gender differences in medical issues, parenting and family, and sexual norms, giving way to other topics, most significantly sexual identity.

4.3. Country-Dependent Tendencies

Evaluating the country dependencies in topic tendencies depicted in the (b) sub-diagrams of Figure 4, Figure 5, Figure 6, Figure 7, Figure 8, Figure 9 and Figure 10, one can definitely state that in all subjects, there are distinct differences in typical topic proportions depending on the countries in which the authors work.
As already mentioned, for some subject areas, the research publications covered by Scopus do not fairly represent the complete research activities in all countries, particularly where non-English publications are concerned. Therefore, the following observations should not be interpreted as statements about the topic choices of all researchers but of those researchers who are interested in international visibility as furthered by Scopus-listed publication media.
From the different ranges of the vertical axes in the figures, one can see that country dependencies are unsurprisingly more pronounced in the sub-area literature and literary theory. The sub-area gender studies also shows considerable deviations.
Language and Linguistics (Figure 4b): Researchers in Russia, Brazil, Spain, and Italy tend to work, more than average, on the topic language of literary works. In Russia and Spain, this is accompanied by another tendency towards the topic dictionaries and terminology. Researchers in India, Japan, and China show a clear tendency towards computational linguistics. In English-speaking countries, the topics language-related medical issues and language and perception receive pronounced attention.
Literature and Literary Theory (Figure 5b): Further to the observations already discussed in Section 4.1, the most significant deviations are clear tendencies in India in the engagement in the topic colonialism, post-colonialism, migration; in Russia in the topic linguistic analysis for literary scholarship; in Italy in the topic ancient and medieval literature, and in Japan in the topic theatre and film, although for the latter topic, the absolute number of publications is already too low for a reliable statement.
Strategy and Management (Figure 6b): The topic raw materials and resource efficiency clearly dominates the research in this sub-area in China but is also strong in Brazil, Japan, Russia, and India. In Russia, additionally, research on the topic process optimisation and modelling comprises a significantly higher proportion than average. The topic environmental management and urban planning receives the highest attention in China and in Japan. The UK has the greatest tendency towards the topic organisational theory and strategic foresight. For English-speaking countries in general, the topic personnel management and work ethics is important. The continental European countries Germany, France, and Italy publish a relatively high proportion of papers on the topic digital transformation and innovation, while in India, Australia, and Brazil, there is emphasis on the topic risk, quality and performance management. Research on the topic healthcare and pandemic management forms comparatively the biggest share in the US and the UK.
Human-Computer Interactions (Figure 7b): The clearest tendencies in this sub-area are those for the topic robotics in Japan and South Korea as well as for image recognition, machine learning application and uncertainty, stability, and control in China. In Germany—and to some degree also in Canada and the UK— the topic interactivity and virtual reality receives a comparatively large amount of attention. E-learning and social computer applications is a relatively frequently chosen topic in Australia and the UK. Brazil shows a tendency towards the topic cybersecurity and software quality, while India trends towards the topics natural language processing, image recognition, machine learning applications, and medical foundations and applications. Russia puts an emphasis on the topic uncertainty, stability, and control. The topic applications for transport and traffic reaches above-average proportions in Russia, Germany, and China.
Aerospace Engineering (Figure 8b): Within this sub-area, researchers in India choose the topic material science comparatively often; this topic is also important in China and Russia. In Japan and Russia, one sees an above-average tendency towards the topic space exploration. There is a peak for electric propulsion and energy storage in Spain, but this could be a random fluctuation, as absolute publications numbers in Spain are low for this sub-area. The topic communication technology plays a prominent role in Canada, Australia, and South Korea. In South Korea and China, adaptive control is a topic with a comparatively high share. Researchers in France, Germany, and Spain give relatively high attention to the topic aerospace economy.
Toxicology (Figure 9b): The topic animal venoms has been already discussed in Section 4.1. Russia shows an extraordinary research tendency towards the topics neurotoxicology and drug interactions and combinations. The topic alcohol, drugs and addictions shows the largest deviations from the mean in several countries: in India, Australia, the US, and Canada. Germany and the UK give comparatively high attention to the topic safety assessments and computational toxicology. The proportion of the topic effects on cell signalling is relatively high in South Korea and China, while that of the topic environmental toxicology is relatively high in China and Spain, and the proportion of the topic reproductive toxicology is relatively high in Japan.
Gender Studies (Figure 10b): This sub-area corpus contains the lowest number of publications, and basically only the English-speaking countries (US, UK, Canada, and Australia) produce enough material for a sound foundation of comparative statements. Within these countries, the US has several topics with prominently increased relative proportion: race and gender, sexual identity, sexual norms, and sexual violence. The other three countries keep much closer to the mean topic distribution, but each has one topic with a significantly over-average proportion. For the UK, it is race and gender, for Canada, it is sexual identity, and for Australia, it is feminism. For the non-English-speaking countries, the following peaks in the topic proportion compared to mean might also represent systematic tendencies considering their absolute topic contributions: the topics gender and sexuality in education and race and gender in Brazil, the topic parenting and family in China and South Korea, the topic gender differences in medical issues in Italy, and the topic gender equality in work life in Russia and India.
In summary, our results show that within each sub-area corpus, the topic distribution in individual countries deviates significantly from the mean topic distribution. Most countries have—as we described above—particular topics with which they engage at an above-average proportion. There is no clear pattern for these topic tendencies; they are most likely a result of historical preferences and the socio-economic environment of the country. However, some groups of countries appear to have somewhat similar topic tendencies: the English-speaking countries (US, UK, Australia, Canada), the (Western) continental European countries (Germany, France, Italy, Spain), and the East Asian countries (China, Japan, South Korea). India, Brazil and Russia do not fit into any of these three groups. They and the East Asian countries show the most drastic deviations from the mean topic distribution, which may be interpreted as distancing themselves from the established theme-setting agendas of the Western countries.

4.4. Gender-Dependent Tendencies

Looking at the (c) sub-diagrams of Figure 4, Figure 5, Figure 6, Figure 7, Figure 8, Figure 9 and Figure 10 one sees that in all seven subject sub-areas, there are topics with a significant deviation from their mean proportions for all three authorship types (all-female, all-male, or mixed female-male authors).
The following topics have a proportion significantly above average when all authors are female:
  • In the sub-area language and linguistics (Figure 4c): language of literary works;
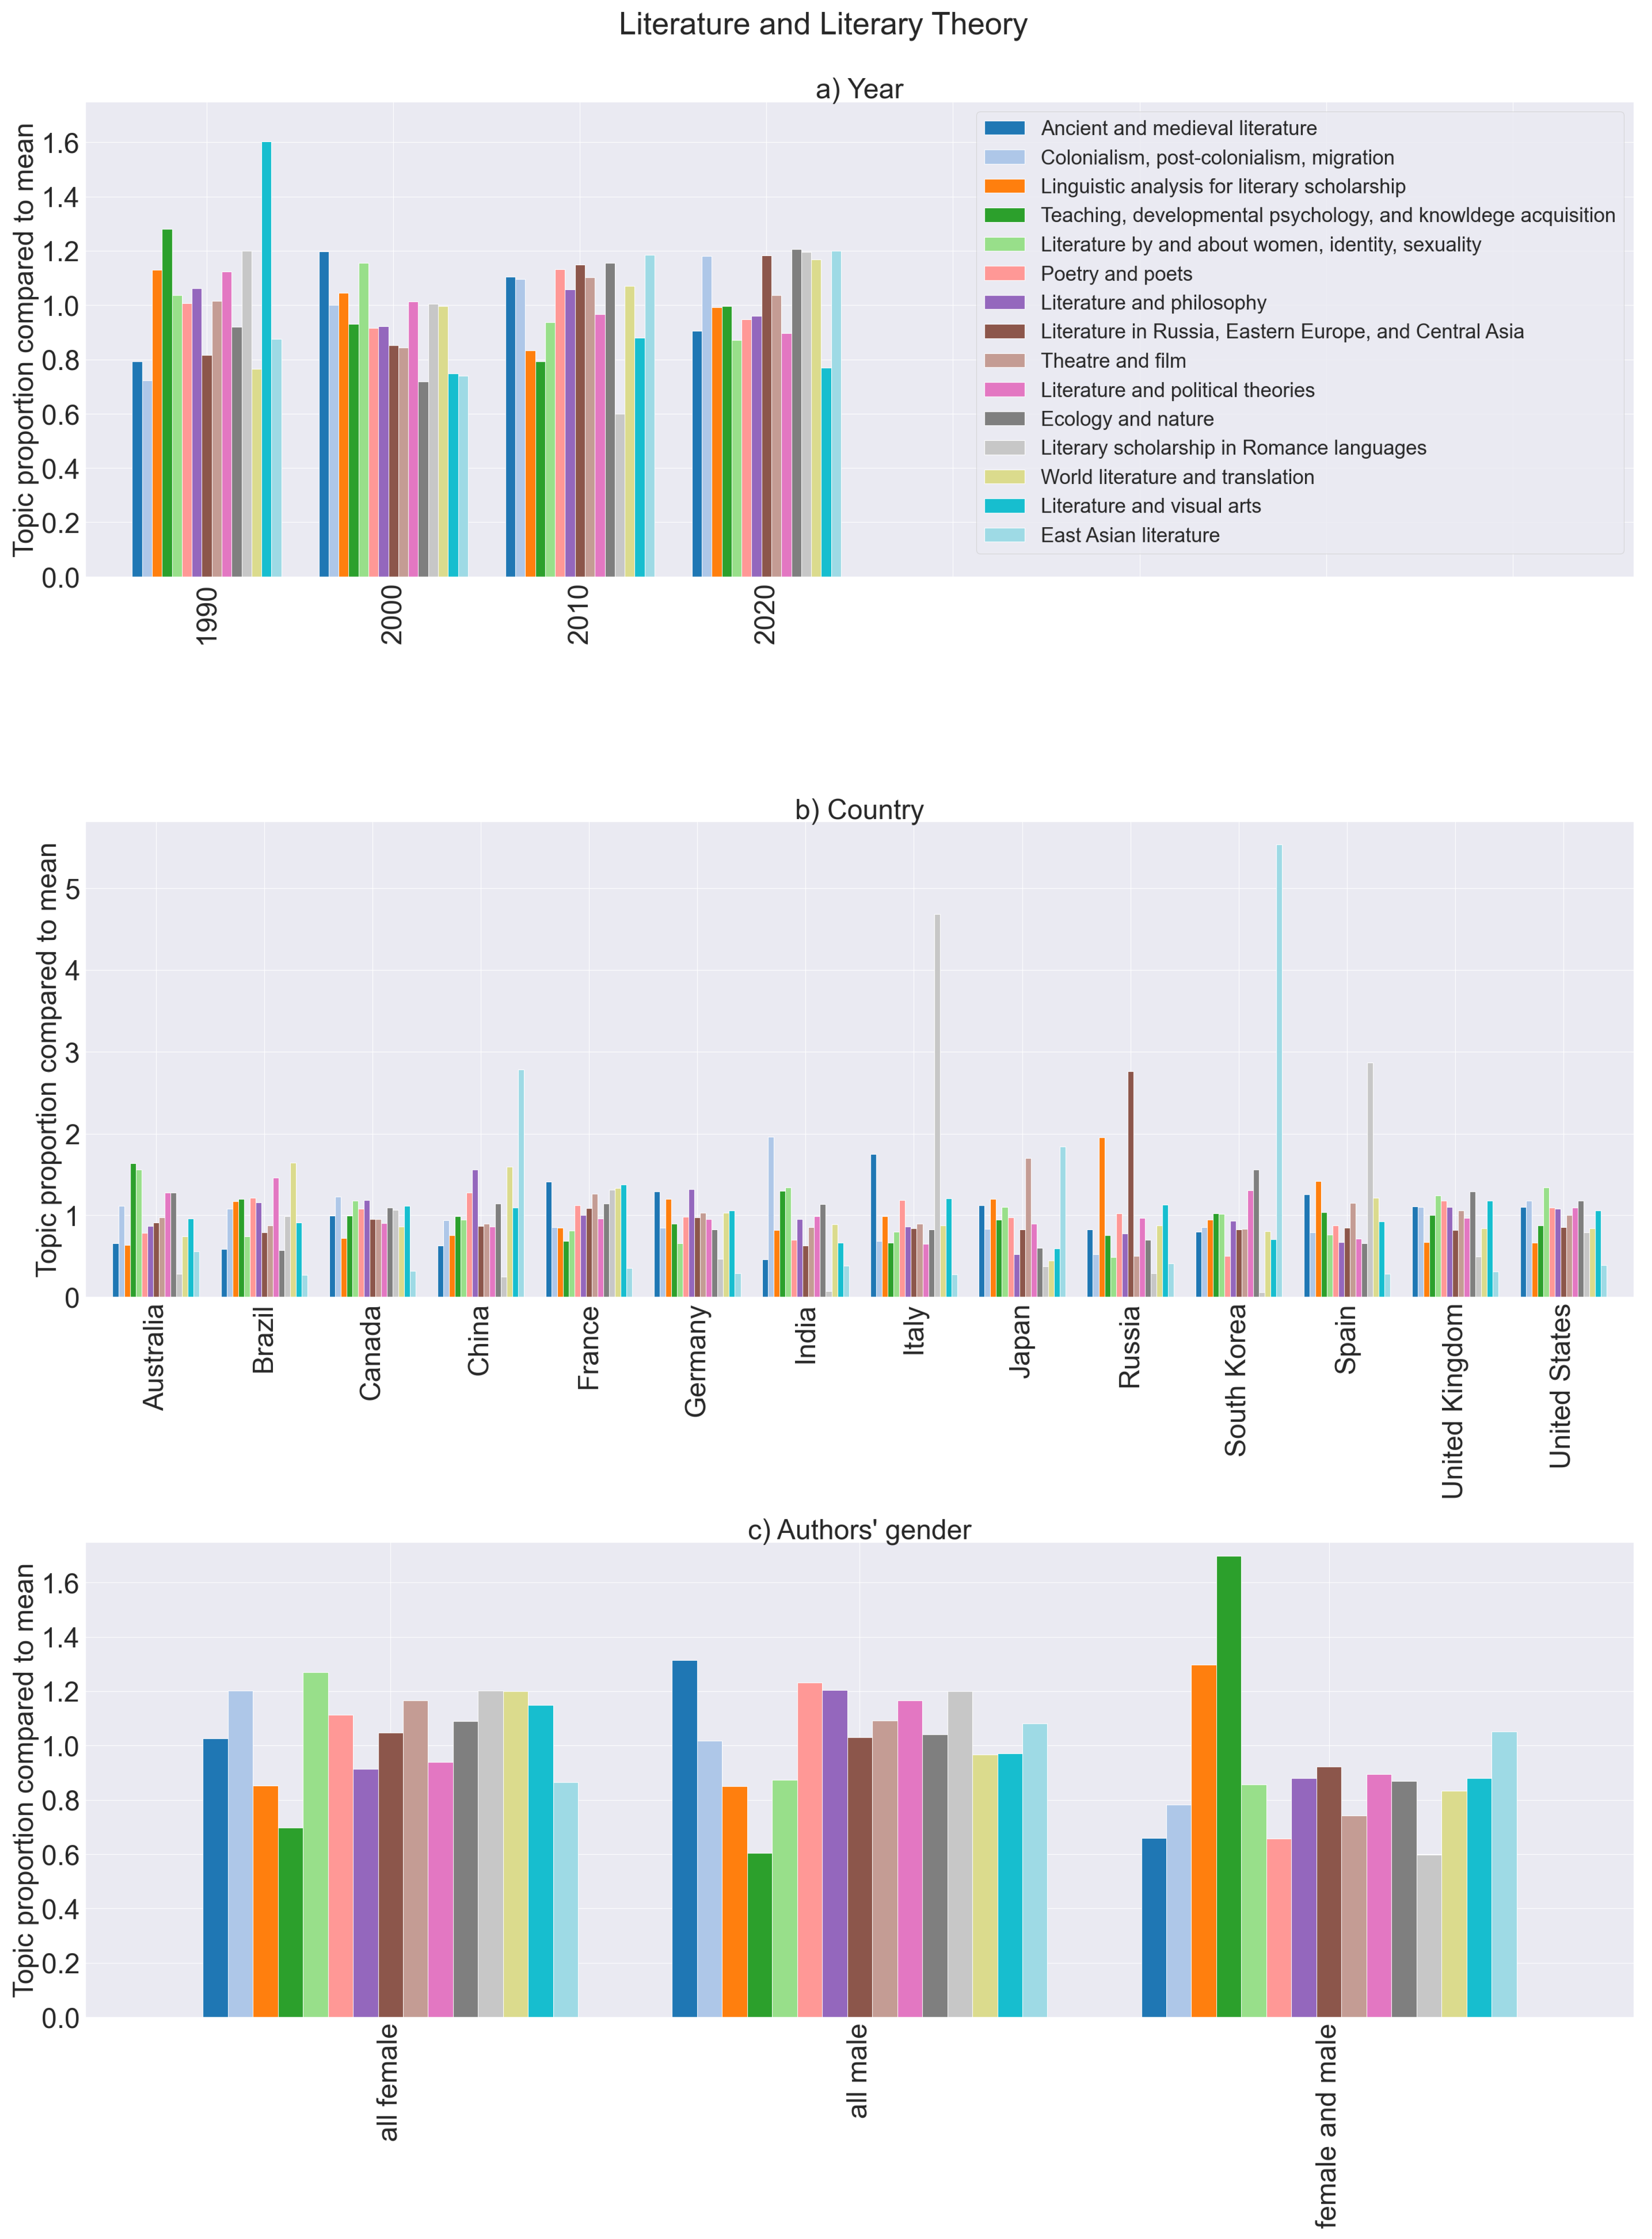
  • In the sub-area literature and literary theory (Figure 5c): literature by and about women, identity, sexuality as well as colonialism, post-colonialism, migration;
  • In the sub-area strategy and management (Figure 6c): personnel management and work ethics;
  • In the sub-area human-computer interactions (Figure 7c): E-learning and social computer applications;
  • In the sub-area aerospace engineering (Figure 8c): aerospace economy;
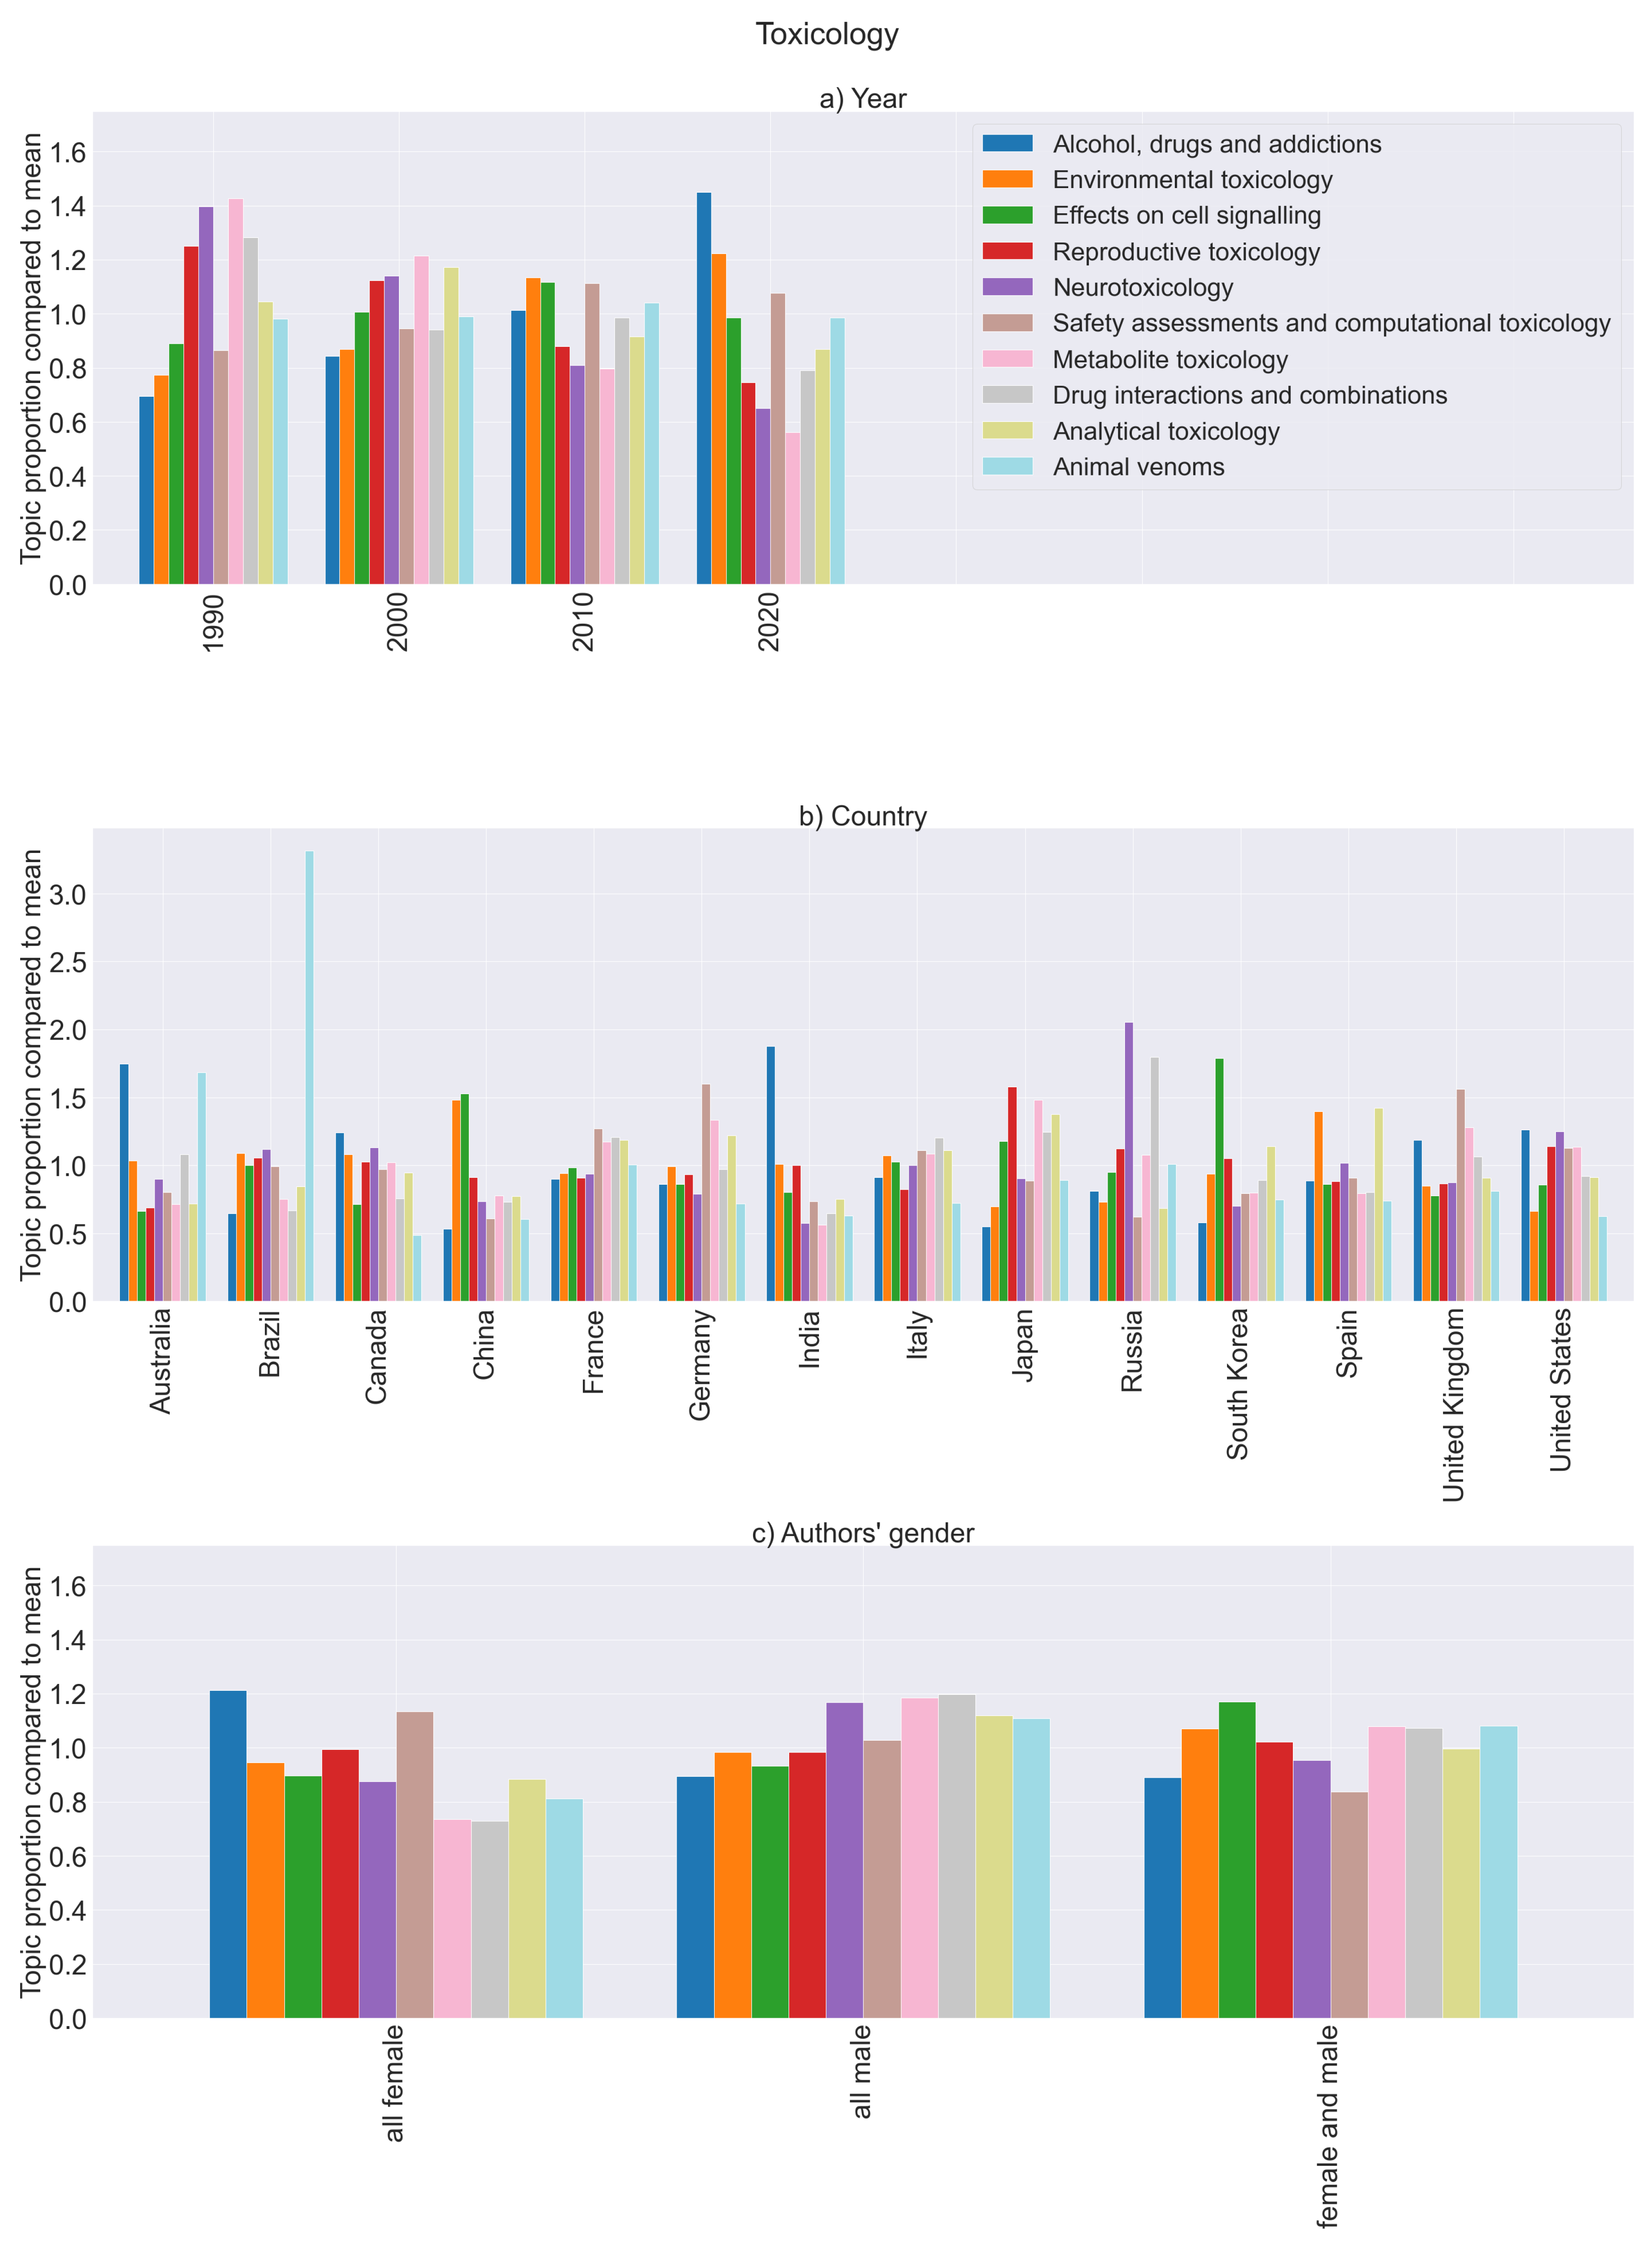
  • In the sub-area toxicology (Figure 9c): alcohol, drugs and addictions, and to a somewhat smaller degree safety assessments and computational toxicology;
  • In the sub-area gender studies (Figure 10c): feminism as well as sexualisation and sexual objectification.
In contrast, the following topics show significantly below-average proportions when all authors are female:
  • In the sub-area language and linguistics (Figure 4c): computational linguistics as well as language and perception;
  • In the sub-area literature and literary theory (Figure 5c): teaching, developmental psychology, and knowledge acquisition;
  • In the sub-area strategy and management (Figure 6c): process optimisation and modelling as well as raw materials and resource efficiency;
  • In the sub-area human-computer interactions (Figure 7c): robotics, uncertainty, stability, and control as well as image recognition, machine learning applications;
  • In the sub-area aerospace engineering (Figure 8c): hydrodynamics and aerodynamics, electric propulsion and energy storage as well as dynamics analysis and stability;
  • In the sub-area toxicology (Figure 9c): drug interactions and combinations as well as metabolite toxicology;
  • In the sub-area gender studies (Figure 10c): sexual norms as well as gender differences in medical issues.
It is tempting to assume that the lists of topics covered by an above-average or below-average proportion by publications where all authors are men would be complementary to the lists above. However, this is not the case, because we have the third authorship type: publications with at least one male and at least one female author. Hence, a topic chosen comparatively seldom by all-female authors can either also be chosen comparatively often by all-male authors or by mixed-gender author groups (or relatively often by both, in which case the deviation from average might not be significant anymore).
Therefore, we go through the above topic lists again and trace how these topics are addressed when male authors are involved. First, regarding the topics towards which women tend to lean:
  • The topic language of literary works is also covered above average when all authors are male, but it is relatively weakly represented among mixed-gender author teams.
  • The topic literature by and about women, identity, sexuality has a below-average proportion when all authors are male but also when at least one author is male.
  • The topic colonialism, post-colonialism, migration shows an average proportion in publications of all-male authors but is underrepresented in mixed-gender teams.
  • The topic personnel management and work ethics has a proportion below average when all authors are men. In mixed-author groups it has an average proportion.
  • The topic E-learning and social computer applications is also underrepresented with all-male authors but average for mixed-gender author teams.
  • The topic aerospace economy has a below-average proportion when all authors are—or even if one author is—male.
  • The topic alcohol, drugs and addictions is slightly below average in all-male and in mixed-gender author teams.
  • The topic safety assessments and computational toxicology shows an average proportion among publications authored by men only but is underrepresented in publications with mixed-author groups.
  • The topics feminism as well as sexualisation and sexual objectification are also comparatively often chosen in publication where all authors are male, but it is relatively rare that these topics are dealt with by mixed-gender authors.
After that we look at the topics which are—in comparison—not so often chosen by women-only author teams.
  • The topic computational linguistics takes an average proportion when all authors are male, but mixed-gender author teams chose it comparatively often.
  • The topic language and perception also has an above-average proportion in mixed-gender author teams but not when all authors are male.
  • The topic teaching, developmental psychology, and knowledge acquisition is also relatively rarely chosen by all-male authors, but there is a significant tendency to publish on this topic in mixed-gender author teams.
  • The topic process optimisation and modelling has a significantly above-average proportion when all authors are male but only an average proportion when women and men co-author a publication.
  • The topic raw materials and resource efficiency, in contrast, is represented above average in mixed teams and only on average in completely male teams.
  • The three topics robotics, uncertainty, stability, and control, and image recognition, machine learning applications appear comparatively often in publications where all authors are men. Their proportion in mixed-gender author groups is only average.
  • The topic hydrodynamics and aerodynamics is another example where purely male author teams are prevalent, while there is an average proportion with both female and male authors.
  • The topic electric propulsion and energy storage, on the other hand, is relatively often chosen by mixed-gender teams, whereas its proportion is average in cases where all authors are male.
  • The topic dynamics analysis and stability does not show clear tendencies neither for all-male nor for mixed teams.
  • The topics drug interactions and combinations and metabolite toxicology also do not show significant deviations from the mean for male or mixed-author groups.
  • The topics sexual norms and gender differences in medical issues show significant tendencies to surpass the average proportions in mixed-gender author teams and not in completely male teams.
Several of the topics to which female authors tend fit with the supposedly female preference for working with people mentioned in Section 1.2 (personnel management and work ethics, E-learning and social computer applications, and alcohol, drugs and addictions). Likewise, several of the topics which show comparatively stronger proportions with male authors appear to be connected with the male preference for working with things (process optimisation and modelling, robotics, and uncertainty, stability, and control). However, for other topics, it seems somewhat contrived to explain the gender-dependent proportions within the framework of this dichotomy.
It seems to be more plausible and illuminating to characterize the topics that we found to have above-average proportions within the publications of men as topics which are close to the theoretical core and foundations of the respective subject sub-areas (ancient and medieval literature, poetry and poets, literature and philosophy, process optimisation and modelling, robotics, uncertainty, stability, and control, hydrodynamics and aerodynamics, drug interactions and combinations, metabolite toxicology, and neurotoxicology). This could be interpreted as an indication that, across all subjects, the formerly overwhelming dominance of male researchers still persists in central aspects of knowledge production, and that men continue to define the fundamental principles and overall developments of a subject.
In contrast, the topics with above-average proportions in publications with exclusively female authors seem to be mostly about specialised applied aspects of the sub-area, even somewhat marginal at times (literature by and about women, identity, sexuality, personnel management and work ethics, E-learning and social computer applications, aerospace economy, alcohol, drugs and addictions, and safety assessments and computational toxicology). This might indicate that women, at least when they publish without male co-authors, prefer some niche away from the potentially male-dominated core of the subject and bring a commitment towards building on and promoting the work of other women.
It is interesting that the publications authored by women and men together show yet another form of topic proportions. Here, the topics with above-average proportions can be characterised as inter-disciplinary, often representing new trends within their sub-areas (language-related medical issues, language and perception, computational linguistics, teaching, developmental psychology, and knowledge acquisition, raw materials and resource efficiency, medical foundations and applications, material science, Earth observation, and electric propulsion and energy storage). Authors working on these topics might particularly appreciate the benefits of integrating diverse perspectives that diverse teams bring.
Finally, our results also point at some topics on which women and men seem to avoid co-authoring. These topics are kanguage of literary works, literary scholarship in Romance languages, poetry and poets, ancient and medieval literature, feminism, and sexualisation and sexual objectification.

4.5. Combined Country- and Gender-Dependent Tendencies

It would be useful to be able to examine topic tendencies depending on country and gender not only separately but also in combination, i.e., to study how the gender differences vary between the various countries. However, here, we run into the problem of insufficient sample size quite quickly. With most topics, our corpora contain only a few countries that contribute more than a dozen publications written just by female authors. In fact, only in the US publications are the numbers high enough to obtain statistically reliable results for all topics. Unfortunately, the country that is in second place in terms of absolute publication numbers, China, defies an equally conclusive analysis because the name-to-gender association for authors does not work well here.
Among the seven sub-areas we studied, strategy and management is the one with sufficiently high absolute female participation in all topics in at least several countries. In Figure 12, we present the topic proportion compared to the mean, c κ ( D ^ α ) , for six countries. This can be compared to Figure 6c, which depicts the situation aggregated over all countries.
One can see that many of the gender-specific tendencies shown in Figure 6 carry over to all the individual countries depicted in Figure 12: the highest positive deviations from the mean topic proportions for women are seen in personnel management and work ethics, for men in process optimisation and modelling, and for mixed-author groups in raw materials and resource efficiency. This indicates that there are fundamental gender-dependent topic preferences that persist in many countries notwithstanding other country-specific topic preferences (such as, in the present case, those shown in Figure 6b).
There are, however, a number of country-specific particularities in Figure 12. In the English-speaking countries (US, UK, Australia), the topic organizational theory and strategic foresight is, next to personnel management and work ethics, another topic with an above-average proportion among female researchers. In Germany, instead, pricing, sales, and marketing receives comparatively high attention from women, and in India, finance management is in a similar position. That same topic, finance management, shows, in all countries except India, a higher relative proportion among men than among women. In the UK, there is a third topic with a relatively high proportion among female authors: healthcare and pandemic management. In India, there is another peculiarity not to be found in other countries: a tendency among male authors towards the topic risk, quality and performance management.
China shows generally higher deviations of topic proportions from the mean than the other countries. This is likely to be due to higher fluctuations caused by the small female sample sizes as a consequence of missing gender attribution lacking gender-specific first names.

5. Conclusions

This paper demonstrates a novel approach for discovering within large corpora of scholarly publications preferences in research topics depending on time, country, and authors’ genders. The method is based on term community detection in co-occurrence networks, which does not only serve to identify the main topics of a corpus but can also be used to quantify how much these topics contribute to each of the corpus documents. For comparing how the distribution of topics varies over time, or from country to country, or depending on the authors’ genders, it is proposed not to look solely at the absolute quantity of topic contributions but at the respective deviations from the mean topic proportions. Whenever these deviations are about or greater than 20%, this is a clear indication that the topic concerned receives comparatively special attention in the respective year, country, or gender. The approach does not claim to be able to measure subtle differences but is meant as a broad yet efficient way for detecting major tendencies.
Consequently, this opens up the possibility of going beyond the statistics of publication numbers and citation counts to track equality and differences to include a qualitative content-related level, which is a crucial step towards highlighting deeper aspects of inequalities that can be useful in guiding future education and research programmes.
This pilot study with more than a quarter million of publication abstracts extracted from Scopus for four years out of four decades, and seven quite different subject sub-areas, has produced the following main conclusions:
  • The method correctly reconstructs all obvious topic preferences, for instance, country-dependent language-related preferences; this forms a basic proof of concept for the method.
  • All other country- and gender-dependent topic preferences deduced with the method either confirm the expected behaviour or provide convincing insights.
  • The method is less appropriate for discovering time-dependent tendencies in subject areas for which the coverage in Scopus varies significantly in time, which is especially true in the arts and humanities.
  • Insight into group-specific topic tendencies can be used as an important building block for understanding differences in publication behaviour.
  • In all seven subject sub-areas studied, topic preferences are significantly different depending on whether all authors are women, all authors are men, or there are female and male co-authors.
Regarding the last two points, the present study leads us to the hypothesis that in all subjects, research publications written by men show a strong tendency towards topics close to the theoretical core of the subject, whereas publications by women have a tendency towards peripheral applications of the subject, and publications co-authored by women and men tend towards modern, interdisciplinary topics, at the same time avoiding gender-oriented topics. It appears that such a separation of tendencies could more likely be a result of historical developments related to finding a space within a research ecosystem rather than a matter of natural inclinations. Such an approach can thus be used for actively promoting the participation of women in targeted research topics to achieve a more balanced input into knowledge production.
However, the verification of this hypothesis would need an extension of the present study to more subject areas. If one then also includes more than just four years, the dataset can well be large enough (albeit much more laborious to process) to dive deeper into the question of country differences within the gender-related topic tendencies. This pilot study only briefly indicates how to recognise such differences.
However, as things are at present, there exist serious challenges to further investigations of country differences in gender-dependencies. The big publication databases, obviously, do not keep record of authors’ genders. Instead, using gender attribution by authors’ first names works quite well in the present study. However, it is well-known that in many countries and communities, first names are not reliable indicators of gender. As this is particularly true in Asia, from where the generation of research publications is rapidly growing, a major part of publications become excluded from large-scale gender-specific analyses.

Supplementary Materials

The following supporting information can be downloaded at: https://www.mdpi.com/article/10.3390/publications10040045/s1, for all seven subject sub-areas: diagrams of shares of authors by gender per country; term communities; absolute topic contributions by year, country, and gender.

Author Contributions

Conceptualization, P.B.-H.; methodology, A.H.; software, A.H.; formal analysis, A.H.; writing, P.B.-H. and A.H. All authors have read and agreed to the published version of the manuscript.

Funding

This research received no external funding.

Data Availability Statement

The document corpora studied in this article were extracted from Scopus in the way described in Section 2.1. All resulting data can be found online as Supplementary Materials. The algorithms which were used to produce them are fully described here and in [1]. Further information can be obtained from the corresponding author.

Conflicts of Interest

The authors declare no conflict of interest.

Abbreviations

The following abbreviations are used in this manuscript:
ACLAssociation of Computational Machinery
APIApplication Programming Interface
LDALatent Dirichlet allocation
STMStructural topic modeling
STEMScience, technology, engineering, and mathematics

Notes

1
2
3
4
5
6
7
8
9
10

References

  1. Hamm, A.; Odrowski, S. Term-Community-Based Topic Detection with Variable Resolution. Information 2021, 12, 221. [Google Scholar] [CrossRef]
  2. King, D.A. The scientific impact of nations. Nature 2004, 430, 311–316. [Google Scholar] [CrossRef]
  3. Leydesdorff, L.; Bornmann, L.; Wagner, C.S. The Relative Influences of Government Funding and International Collaboration on Citation Impact. J. Assoc. Inf. Sci. Technol. 2018, 70, 198–201. [Google Scholar] [CrossRef] [PubMed] [Green Version]
  4. Scimago. SJR - SCImage Country Rank, 2022. Available online: https://www.scimagojr.com/countryrank.php (accessed on 19 April 2022).
  5. Holman, L.; Stuart-Fox, D.; Hauser, C.E. The gender gap in science: How long until women are equally represented? PLOS Biol. 2018, 16, e2004956. [Google Scholar] [CrossRef] [Green Version]
  6. Cole, J.R.; Zuckerman, H. The productivity puzzle. In Advances in Motivation and Achievement; Women in Science; JAI Press: Greenwich, CT, USA, 1984. [Google Scholar]
  7. Huang, J.; Gates, A.J.; Sinatra, R.; Barabási, A.L. Historical comparison of gender inequality in scientific careers across countries and disciplines. Proc. Natl. Acad. Sci. USA 2020, 117, 4609–4616. [Google Scholar] [CrossRef] [Green Version]
  8. Larivière, V.; Ni, C.; Gingras, Y.; Cronin, B.; Sugimoto, C.R. Bibliometrics: Global gender disparities in science. Nature 2013, 504, 211–213. [Google Scholar] [CrossRef] [PubMed] [Green Version]
  9. West, J.D.; Jacquet, J.; King, M.M.; Correll, S.J.; Bergstrom, C.T. The Role of Gender in Scholarly Authorship. PLoS ONE 2013, 8, e66212. [Google Scholar] [CrossRef] [Green Version]
  10. Mohammad, S.M. Gender Gap in Natural Language Processing Research: Disparities in Authorship and Citations. In Proceedings of the 58th Annual Meeting of the Association for Computational Linguistics, Online, 6–8 July 2020; Association for Computational Linguistics: Stroudsburg, PN, USA, 2020; pp. 7860–7870. [Google Scholar] [CrossRef]
  11. Duch, J.; Zeng, X.H.T.; Sales-Pardo, M.; Radicchi, F.; Otis, S.; Woodruff, T.K.; Amaral, L.A.N. The Possible Role of Resource Requirements and Academic Career-Choice Risk on Gender Differences in Publication Rate and Impact. PLoS ONE 2012, 7, e51332. [Google Scholar] [CrossRef] [Green Version]
  12. Abramo, G.; D’Angelo, C.A.; Caprasecca, A. Gender differences in research productivity: A bibliometric analysis of the Italian academic system. Scientometrics 2009, 79, 517–539. [Google Scholar] [CrossRef]
  13. Rørstad, K.; Aksnes, D.W. Publication rate expressed by age, gender and academic position – A large-scale analysis of Norwegian academic staff. J. Inf. 2015, 9, 317–333. [Google Scholar] [CrossRef]
  14. De Kleijn, M.; Jayabalasingham, B.; Holly, J.; Falk-Krzesinski, T.; Collins, L.; Kuiper-Hoyng, I.; Cingolani, J.; Zhang, G.; Roberge. The Researcher Journey Through a Gender Lens: An Examination of Research Participation, Career Progression and Perceptions Across the Globe, 2020. Available online: https://www.elsevier.com/connect/gender-report (accessed on 4 March 2020).
  15. Yamamoto, J.; Frachtenberg, E. Gender Differences in Collaboration Patterns in Computer Science. Publications 2022, 10, 10. [Google Scholar] [CrossRef]
  16. Rip, A.; Courtial, J.P. Co-word maps of biotechnology: An example of cognitive scientometrics. Scientometrics 1984, 6, 381–400. [Google Scholar] [CrossRef] [Green Version]
  17. van Eck, N.J.; Waltman, L. Visualizing Bibliometric Networks. In Measuring Scholarly Impact; Springer: Cham, Switzerland, 2014; pp. 285–320. [Google Scholar] [CrossRef]
  18. Aria, M.; Cuccurullo, C. bibliometrix: An R-tool for comprehensive science mapping analysis. J. Inf. 2017, 11, 959–975. [Google Scholar] [CrossRef]
  19. Firoozeh, N.; Nazarenko, A.; Alizon, F.; Daille, B. Keyword extraction: Issues and methods. Nat. Lang. Eng. 2019, 26, 259–291. [Google Scholar] [CrossRef]
  20. Lee, Y.; Lee, Y.; Seong, J.; Stanescu, A.; Hwang, C. A comparison of network clustering algorithms in keyword network analysis: A case study with geography conference presentations. Int. J. Geospat. Environ. Res. 2020, 7, 1–16. [Google Scholar]
  21. Fortunato, S.; Hric, D. Community detection in networks: A user guide. Physics Rep. 2016, 659, 1–44. [Google Scholar] [CrossRef] [Green Version]
  22. Blei, D.M.; Ng, A.Y.; Jordan, M.I. Latent dirichlet allocation. J. Mach. Learn. Res. 2003, 3, 993–1022. [Google Scholar]
  23. Vogel, A.; Jurafsky, D. He Said, She Said: Gender in the ACL Anthology. In Proceedings of the ACL-2012 Special Workshop on Rediscovering 50 Years of Discoveries, Jeju Island, Korea, 10 July 2012; pp. 33–41. [Google Scholar]
  24. Nielsen, M.W.; Börjeson, L. Gender diversity in the management field: Does it matter for research outcomes? Res. Policy 2019, 48, 1617–1632. [Google Scholar] [CrossRef]
  25. Key, E.M.; Sumner, J.L. You Research Like a Girl: Gendered Research Agendas and Their Implications. PS Political Sci. Politics 2019, 52, 663–668. [Google Scholar] [CrossRef] [Green Version]
  26. Roberts, M.E.; Stewart, B.M.; Tingley, D.; Airoldi, E.M. The structural topic model and applied social science. In Proceedings of the ICONIP 2013, Daegu, Korea, 3–7 November 2013. [Google Scholar]
  27. Heiberger, R.H. Applying Machine Learning in Sociology: How to Predict Gender and Reveal Research Preferences. KZfSS Kölner Z. Für Soziologie Und Sozialpsychologie 2022, 74, 383–406. [Google Scholar] [CrossRef]
  28. Conde-Ruiz, J.I.; Ganuza, J.J.; García, M.; Puch, L.A. Gender distribution across topics in the top five economics journals: A machine learning approach. SERIEs 2021, 13, 269–308. [Google Scholar] [CrossRef]
  29. Bittermann, A.; Greiner, N.; Fischer, A. Unterscheiden sich die Forschungsinteressen von Frauen und Männern in der Psychologie? Psychol. Rundsch. 2020, 71, 103–110. [Google Scholar] [CrossRef]
  30. Su, R.; Rounds, J.; Armstrong, P.I. Men and things, women and people: A meta-analysis of sex differences in interests. Psychol. Bull. 2009, 135, 859–884. [Google Scholar] [CrossRef] [PubMed] [Green Version]
  31. Thelwall, M.; Bailey, C.; Tobin, C.; Bradshaw, N.A. Gender differences in research areas, methods and topics: Can people and thing orientations explain the results? J. Inf. 2019, 13, 149–169. [Google Scholar] [CrossRef]
  32. Mongeon, P.; Paul-Hus, A. The journal coverage of Web of Science and Scopus: A comparative analysis. Scientometrics 2015, 106, 213–228. [Google Scholar] [CrossRef]
  33. Thelwall, M.; Sud, P. Scopus 1900–2020: Growth in articles, abstracts, countries, fields, and journals. Quant. Sci. Stud. 2022, 3, 37–50. [Google Scholar] [CrossRef]
  34. Huang, P.C.C. Citation Indexes: Uses and Misuses. Mod. China 2018, 44, 559–590. [Google Scholar] [CrossRef]
  35. Tennant, J. Web of Science and Scopus are not global databases of knowledge. Eur. Sci. Ed. 2020, 46, e51987. [Google Scholar] [CrossRef]
  36. Santamaría, L.; Mihaljević, H. Comparison and benchmark of name-to-gender inference services. PeerJ Comput. Sci. 2018, 4, e156. [Google Scholar] [CrossRef] [Green Version]
  37. Sebo, P. Performance of gender detection tools: A comparative study of name-to-gender inference services. J. Med. Libr. Assoc. 2021, 109. [Google Scholar] [CrossRef]
  38. Sayyadi, H.; Raschid, L. A Graph Analytical Approach for Topic Detection. ACM Trans. Internet Technol. 2013, 13, 1–23. [Google Scholar] [CrossRef]
  39. Montani, I.; Honnibal, M.; Honnibal, M.; Van Landeghem, S.; Boyd, A.; Peters, H.; McCann, P.O.; Samsonov, M.; Geovedi, J.; O’Regan, J.; et al. Explosion/spaCy: V3.3.0: Improved Speed, New Trainable Lemmatizer, and Pipelines for Finnish, Korean and Swedish, 2022. Available online: https://zenodo.org/record/6504092#.Y3MAFORByUk (accessed on 29 April 2022).
  40. Mihalcea, R.; Tarau, P. TextRank: Bringing Order into Text. In Proceedings of the 2004 Conference on Empirical Methods in Natural Language Processing, Barcelona, Spain, 25–26 July 2004; pp. 404–411. [Google Scholar]
  41. Florescu, C.; Caragea, C. PositionRank: An Unsupervised Approach to Keyphrase Extraction from Scholarly Documents. In Proceedings of the 55th Annual Meeting of the Association for Computational Linguistics (Volume 1: Long Papers), Vancouver, BC, Canada, 30 July–4 August 2017; pp. 1105–1115. [Google Scholar] [CrossRef]
  42. Sparck Jones, K. A statistical interpretation of term specificity and its application in retrieval. J. Doc. 1972, 28, 11–21. [Google Scholar] [CrossRef]
  43. Barton, M.A.; Christianson, M.; Myers, C.G.; Sutcliffe, K. Resilience in action: Leading for resilience in response to COVID-19. BMJ Lead. 2020, 4, 117–119. [Google Scholar] [CrossRef]
  44. Reichardt, J.; Bornholdt, S. Statistical mechanics of community detection. Physical Rev. E 2006, 74, 016110. [Google Scholar] [CrossRef] [PubMed] [Green Version]
  45. Newman, M.E.J. Modularity and community structure in networks. Proc. Natl. Acad. Sci. USA 2006, 103, 8577–8582. [Google Scholar] [CrossRef] [PubMed] [Green Version]
  46. Traag, V.A.; Waltman, L.; van Eck, N.J. From Louvain to Leiden: Guaranteeing well-connected communities. Sci. Rep. 2019, 9, 5233. [Google Scholar] [CrossRef] [PubMed] [Green Version]
  47. Hamm, A.; Thelen, J.; Beckmann, R.; Odrowski, S. TeCoMiner: Topic Discovery Through Term Community Detection. arXiv 2021, arXiv:cs.CL/2103.12882. [Google Scholar]
  48. Bojanowski, P.; Grave, E.; Joulin, A.; Mikolov, T. Enriching Word Vectors with Subword Information. arXiv 2016, arXiv:1607.04606. [Google Scholar] [CrossRef] [Green Version]
  49. Speer, R.; Chin, J.; Havasi, C. ConceptNet 5.5: An Open Multilingual Graph of General Knowledge. arXiv 2017, arXiv:1612.03975. [Google Scholar] [CrossRef]
  50. Yang, X.; Zhang, Z. Combining prestige and relevance ranking for personalized recommendation. In Proceedings of the 22nd ACM International Conference on INFORMATION & Knowledge Management, San Francisco, CA, USA, 27 October–1 November 2013. [Google Scholar] [CrossRef]
  51. Lancichinetti, A.; Sirer, M.I.; Wang, J.X.; Acuna, D.; Körding, K.; Amaral, L.A.N. High-Reproducibility and High-Accuracy Method for Automated Topic Classification. Phys. Rev. X 2015, 5, 011007. [Google Scholar] [CrossRef] [Green Version]
  52. Leydesdorff, L.; Nerghes, A. Co-word maps and topic modeling: A comparison using small and medium-sized corpora. J. Assoc. Inf. Sci. Technol. 2016, 68, 1024–1035. [Google Scholar] [CrossRef] [Green Version]
  53. Gerlach, M.; Peixoto, T.P.; Altmann, E.G. A network approach to topic models. Sci. Adv. 2018, 4. [Google Scholar] [CrossRef] [PubMed]
  54. Odrowski, S. Text Mining durch die politikwissenschaftliche Brille. Neue Ansätze für eine sozialwissenschaftlich ausgerichtete und transdisziplinär fundierte Erschließung von Text-as-Data-Verfahren und Big Text Data. Ph.D. Thesis, University of Cologne, Köln, Germany, 2022. submitted. [Google Scholar]
  55. Armed Forces Pest Management Board. Living Hazards Database, 2022. Available online: https://www.acq.osd.mil/eie/afpmb/livinghazards.html (accessed on 9 July 2022).
  56. Scopus Blog. Scopus Content Update: The Arts & Humanities, 2014. Available online: https://blog.scopus.com/posts/scopus-content-update-the-arts-humanities (accessed on 9 July 2022).
Figure 1. Shares of the six author gender classes within publications in the human-computer interaction document set. The column ALL COUNTRIES gives the fractions among all publications, while the other columns give a breakdown according to countries. The grey-coloured segments indicate publications where the gender of none of the authors could be derived from the name. The publications of the pink and light blue segments have at least one female or male author, respectively, but there are co-authors of unidentified gender.
Publications 10 00045 g001
Figure 2. Stratified word cloud for one of the topic communities of the gender studies corpus. It can be interpreted as the topic race and gender.
Publications 10 00045 g002
Figure 3. Stratified word cloud for one of the topic communities of the human-computer interactions corpus. It can be interpreted as the topic natural language processing.
Publications 10 00045 g003
Figure 4. Topic proportion compared to mean, c κ ( D ^ α ) , for 9 topics of the sub-area language and linguistics grouped by (a) publication year, (b) country, and (c) authors’ gender. The legend for the topics and their colour codes at the top right corner applies to all three sub-diagrams.
Publications 10 00045 g004
Figure 5. Topic proportion compared to mean, c κ ( D ^ α ) , for 15 topics of the sub-area literature and literary theory grouped by (a) publication year, (b) country, and (c) authors’ gender. The legend for the topics and their colour codes at the top right corner applies to all three sub-diagrams.
Publications 10 00045 g005
Figure 6. Topic proportion compared to mean, c κ ( D ^ α ) , for 10 topics of the sub-area strategy and management grouped by (a) publication year, (b) country, and (c) authors’ gender. The legend for the topics and their colour codes at the top right corner applies to all three sub-diagrams.
Publications 10 00045 g006
Figure 7. Topic proportion compared to mean, c κ ( D ^ α ) , for 9 topics of the sub-area human-computer interactions grouped by (a) publication year, (b) country, and (c) authors’ gender. The legend for the topics and their colour codes at the top right corner applies to all three sub-diagrams.
Publications 10 00045 g007
Figure 8. Topic proportion compared to mean, c κ ( D ^ α ) , for 9 topics of the sub-area aerospace engineering grouped by (a) publication year, (b) country, and (c) authors’ gender. The legend for the topics and their colour codes at the top right corner applies to all three sub-diagrams.
Publications 10 00045 g008
Figure 9. Topic proportion compared to mean, c κ ( D ^ α ) , for 10 topics of the sub-area toxicology grouped by (a) publication year, (b) country, and (c) authors’ gender. The legend for the topics and their colour codes at the top right corner applies to all three sub-diagrams.
Publications 10 00045 g009
Figure 10. Topic proportion compared to mean, c κ ( D ^ α ) , for 11 topics of the sub-area gender studies grouped by (a) publication year, (b) country, and (c) authors’ gender. The legend for the topics and their colour codes at the top right corner applies to all three sub diagrams.
Publications 10 00045 g010
Figure 11. Absolute topic contribution (logarithmic scale on vertical axes), a κ ( D ^ α ) , for 9 topics of the sub-area aerospace engineering grouped by (a) publication year, (b) country, and (c) authors’ gender.
Publications 10 00045 g011
Figure 12. Topic proportion compared to mean, c κ ( D ^ α ) , for 10 topics of the sub-area strategy and management grouped by authors’ gender for individual countries: US, China, UK, Germany, India, Australia (from top left to bottom right).
Publications 10 00045 g012
Table 1. Number of publications in the selected Scopus sub-areas by year.
Sub-Area1990200020102020Sum of Four Years
Language and Linguistics1699423911,42024,20041,558
Literature and Literary Theory264694590412,53119,393
Strategy and Management2524538913,05032,24653,209
Human-Computer Interaction530171817,84028,93249,020
Aerospace Engineering4298963320,64830,35564,934
Toxicology5586661310,73417,96240,895
Gender Studies4951041215851528846
Table 2. Number of publications (sum over sample years 1990, 2000, 2010 and 2020) in the selected Scopus sub-areas by country with the following abbreviations: US—United States, CN—China, GB—United Kingdom, DE—Germany, IN—India, JP—Japan, CA—Canada, ES—Spain, FR—France, IT—Italy, AU—Australia, RU—Russia, BR—Brasilia, and KR—South Korea.
Sub-AreaUSCNGBDEINJPCAESFRITAURUBRKR
Language/Ling.10,1702114371924714721348143725771499122513651450802432
Lit./Lit. Theory36945931709628143715201313681626499743411113
Strategy/Manag.12,43171335551206725216622080173414911794226079910711036
Human-Computer10,58396483368333313823487193111501544138816285279941469
Aerospace Eng.20,59316,268303430803600234517458902172235397819926891253
Toxicology12,4274850232819833146247214379911381127887246812861095
Gender Studies375811210451311644960019963964556125264
Table 3. Network sizes of the term co-occurrence networks in the selected Scopus sub areas.
Sub-AreaPublicationsNodes (Terms)Links
Language and Linguistics41,55834,0235,766,126
Literature and Literary Theory19,39324,1942,818,821
Strategy and Management53,20935,8767,694,237
Human-Computer Interactions49,02033,6336,390,920
Aerospace Engineering64,93443,2319,900,516
Toxicology40,89541,4068,266,924
Gender Studies884611,5901,307,635
Table 4. Small hypothetical example of a corpus consisting of six documents d 1 , , d 6 with the topics shares s 1 ( d i ) , , s 3 ( d i ) of three topics for each document d i .
DocumentAuthor Genders1s2s3
d 1 female0.500.5
d 2 female0.600.4
d 3 male0.50.10.4
d 4 male0.50.30.2
d 5 male0.60.20.2
d 6 male0.600.4
Table 5. Measures for topic allocation in the small example’s sub-corpus of female authors, D ^ female , and the sub-corpus of male authors, D ^ male . The three blocks of columns depict for the three topics ( κ = 1 , , 3 ) the absolute topic contribution, a κ ( D ^ α ) , the relative topic proportion, r κ ( D ^ α ) , and the topic proportion compared to mean, c κ ( D ^ α ) ( α { female , male } ).
Sub-Corpusa1a2a3r1r2r3c1c2c3
D ^ female = { d 1 , d 2 } 1.100.90.5500.45101.2
D ^ male = { d 3 , , d 6 } 2.20.61.20.550.150.3120.8
Publisher’s Note: MDPI stays neutral with regard to jurisdictional claims in published maps and institutional affiliations.

