Nanoclay-Reinforced Glass-Ionomer Cements: In Vitro Wear Evaluation and Comparison by Two Wear-Test Methods


Abstract
:1. Introduction
2. Materials and Methods
2.1. Materials
2.2. Sample Preparation
2.3. Wear Test
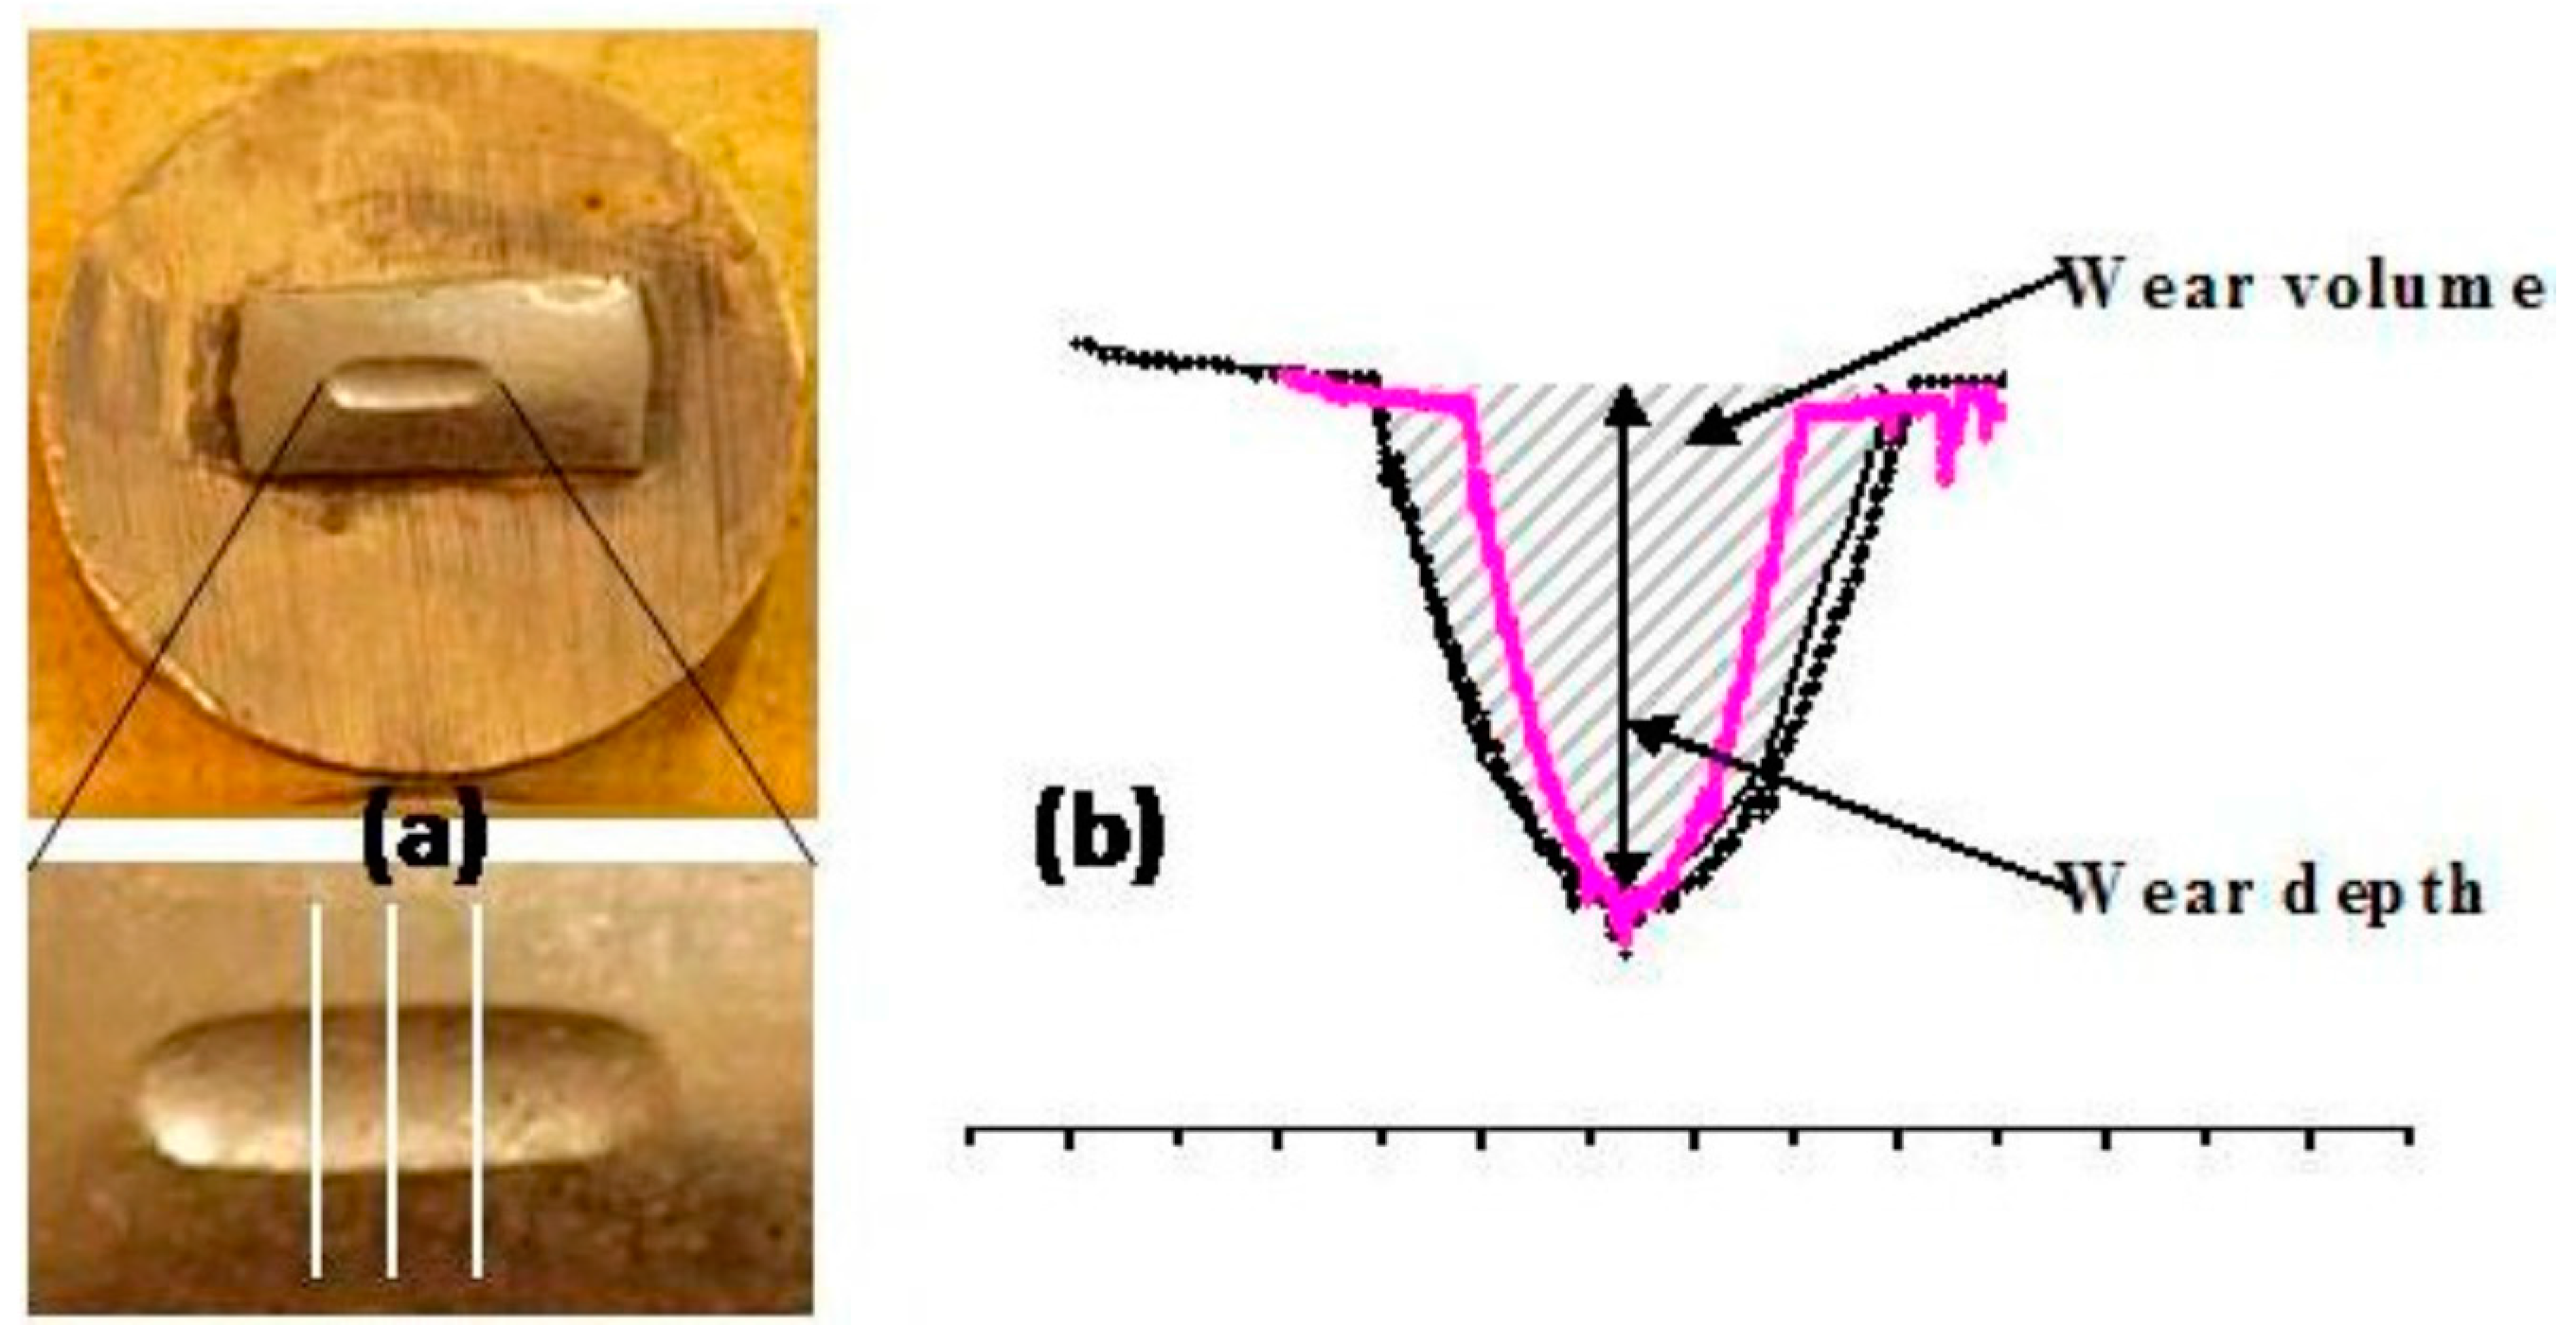
2.3.1. Reciprocating Wear Test
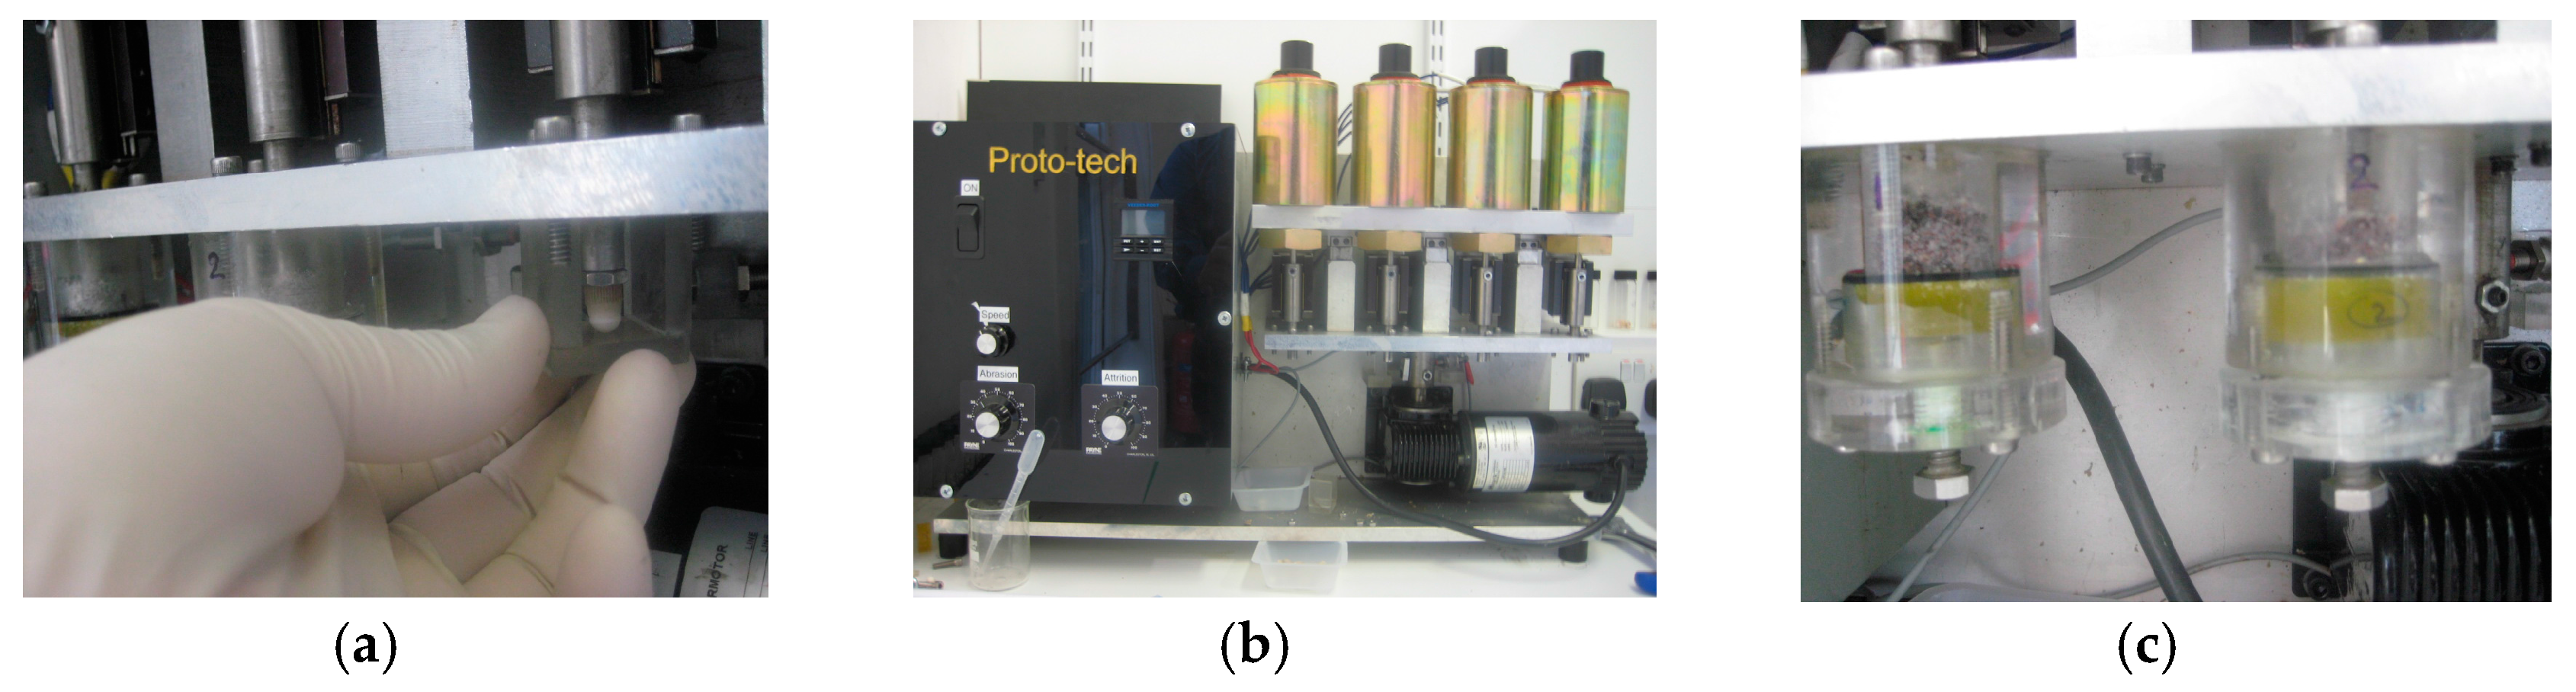
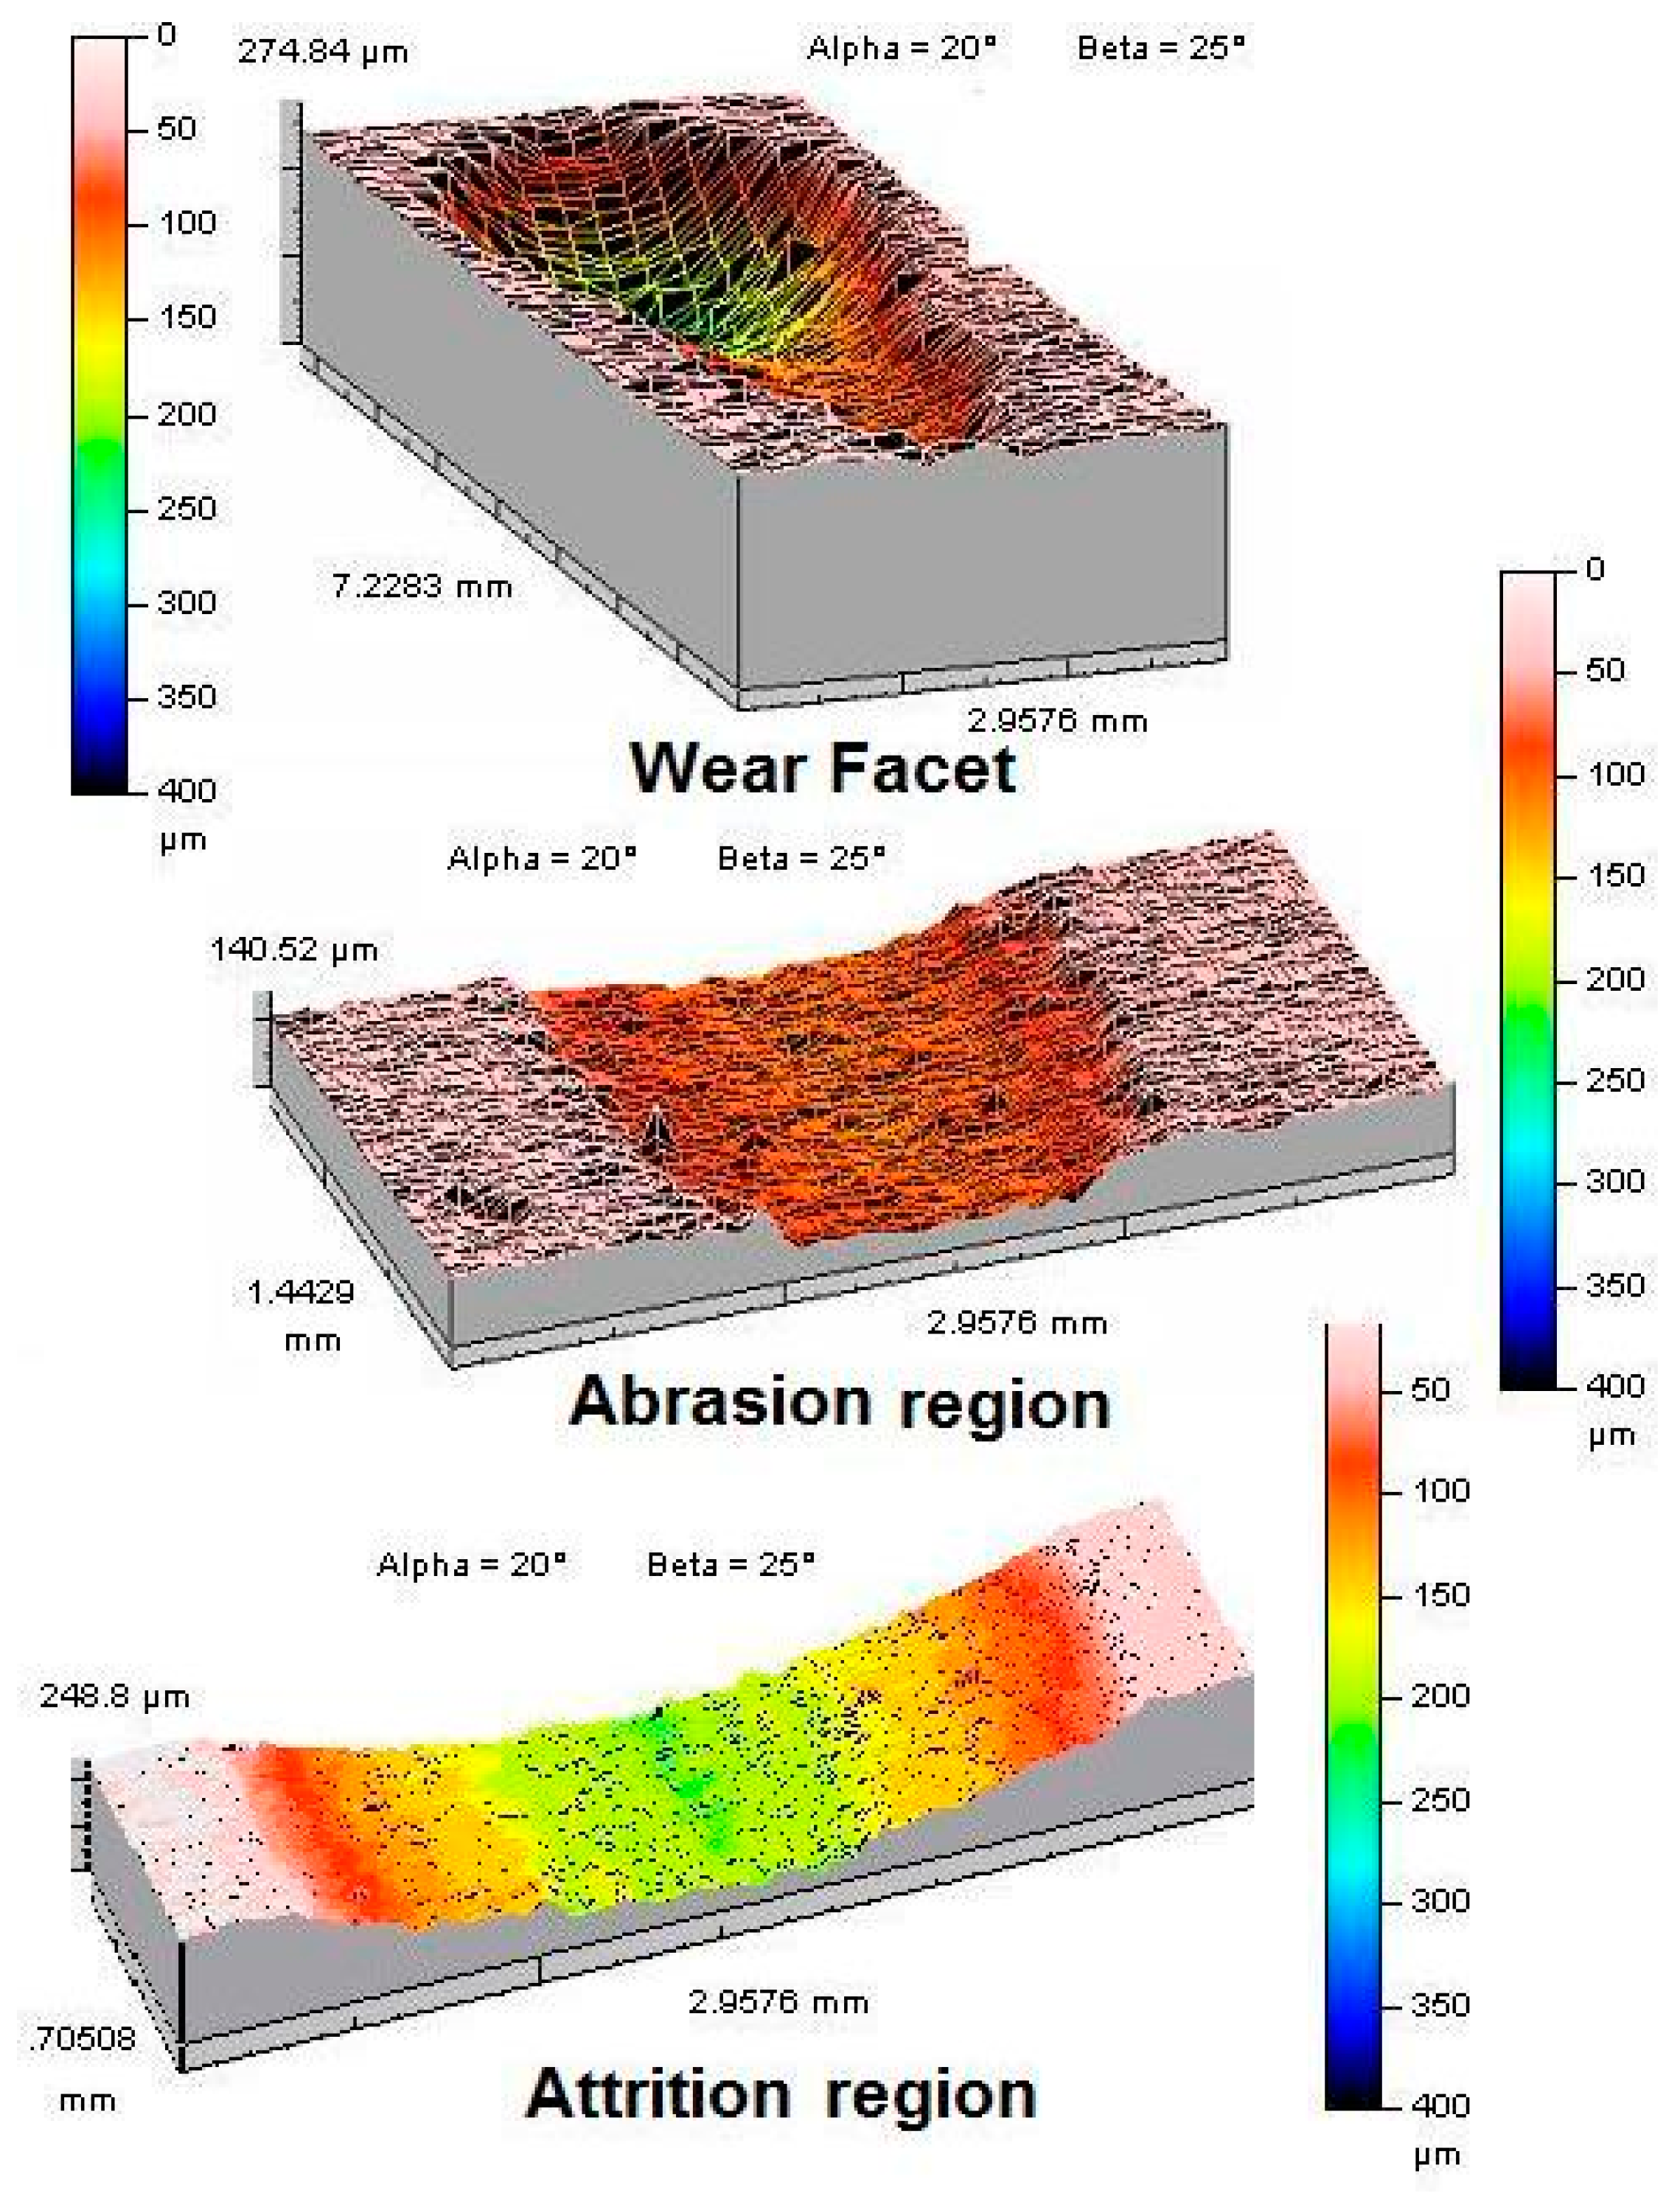
2.3.2. Oregon Health and Science University (OHSU) Wear Simulator
2.4. Vickers Hardness (HV)
2.5. Statistical Analysis
3. Results
3.1. Reciprocating Wear Test
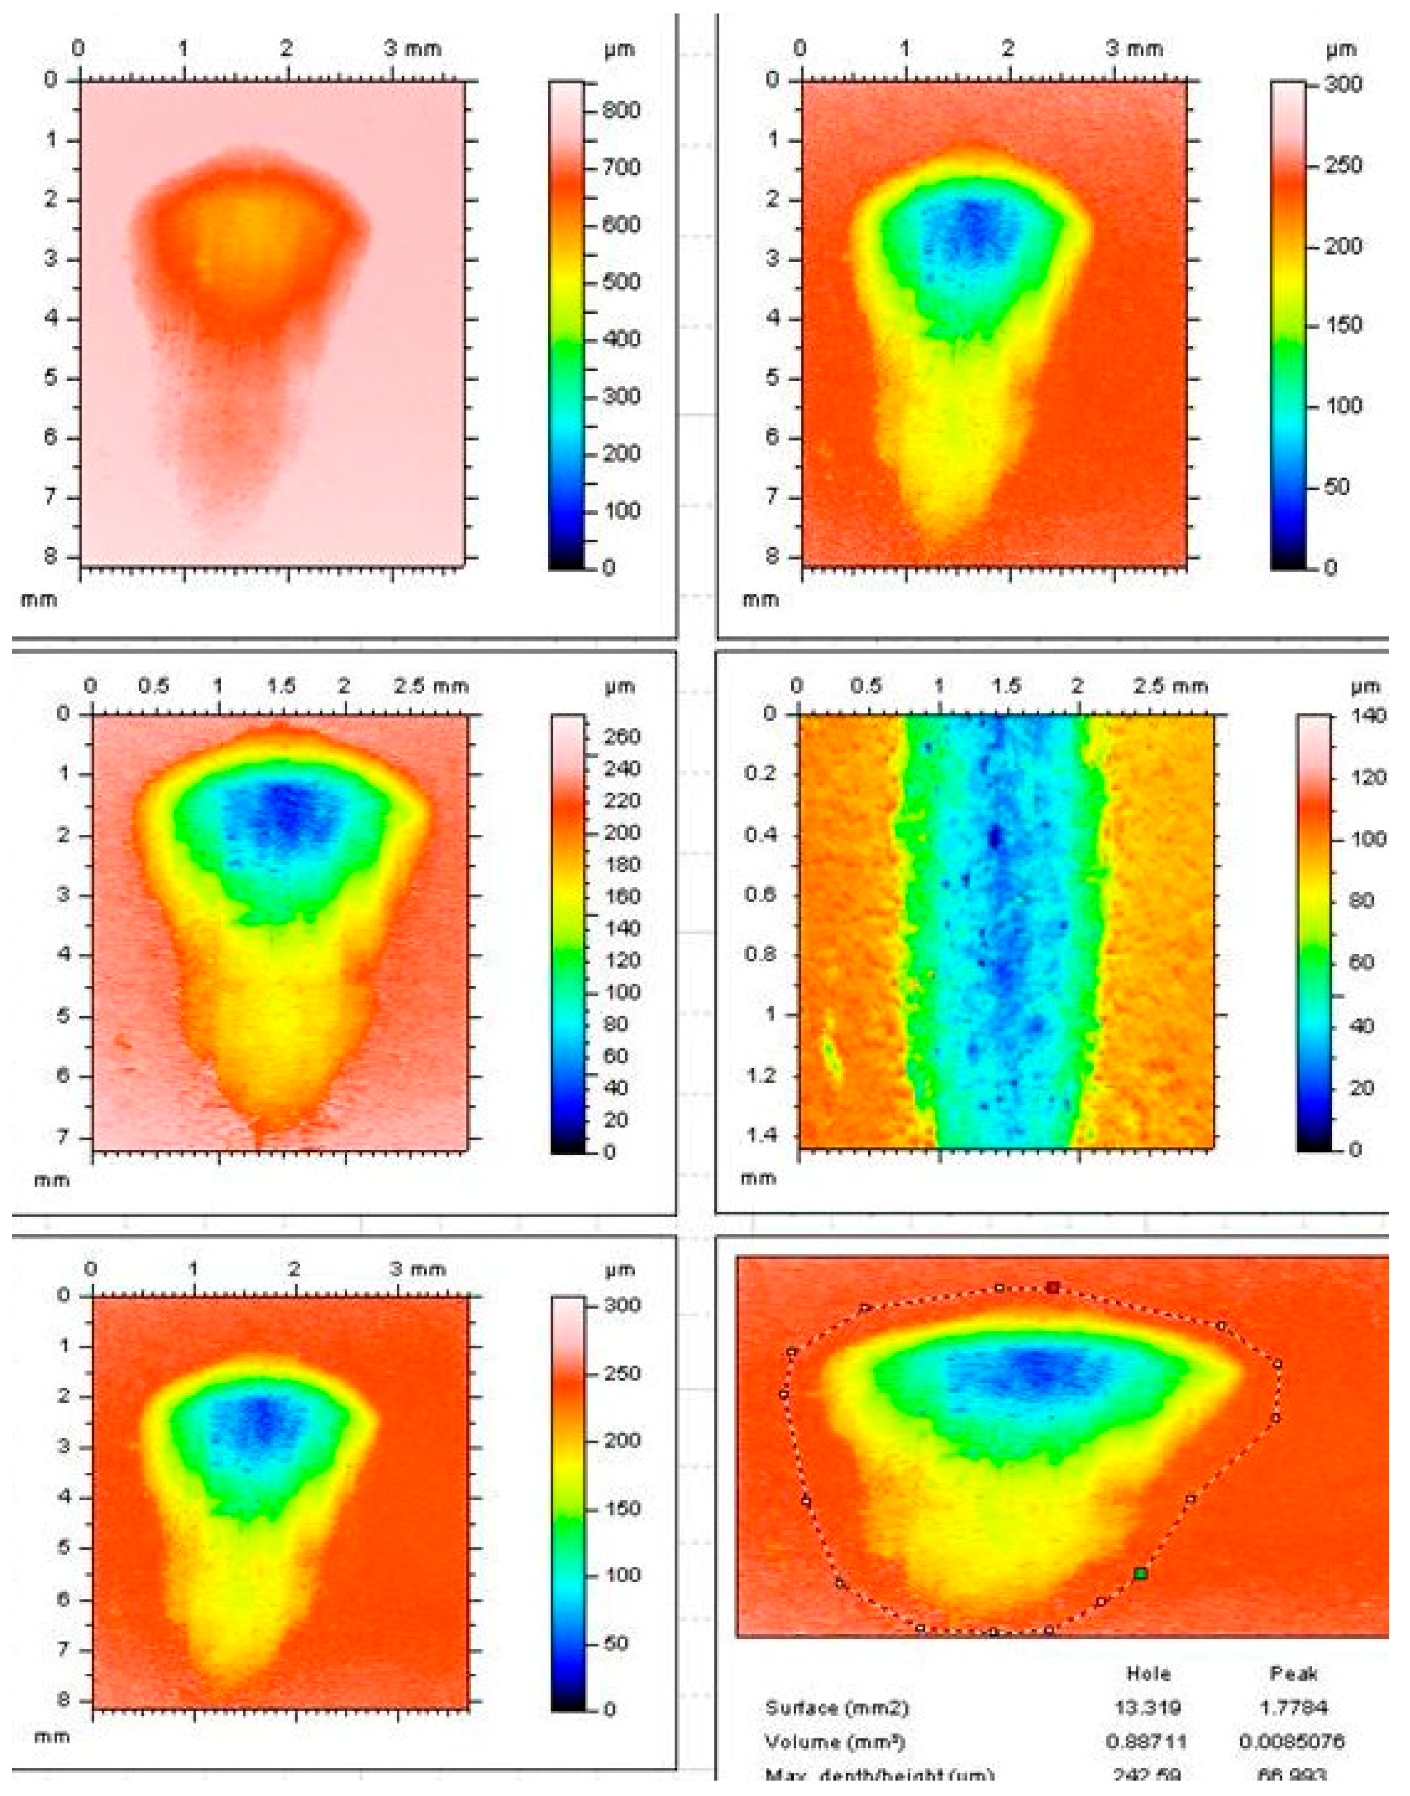
3.2. OHSU Wear Test
3.3. Vickers Hardness (HV)
4. Discussion
5. Conclusions
Acknowledgments
Author Contributions
Conflicts of Interest
References
- Mount, G.J. Glass ionomers: A review of their current status. Oper. Dent. 1999, 24, 115–124. [Google Scholar] [PubMed]
- Nicholson, J.W. Royal Society of Chemistry (Great Britain). In The Chemistry of Medical and Dental Materials, 1st ed.; Royal Society of Chemistry: Cambridge, UK, 2002. [Google Scholar]
- Sidhu, S.K.; Nicholson, J.W. A review of glass-ionomer cements for clinical dentistry. J. Funct. Biomater. 2016, 7, 16. [Google Scholar] [CrossRef] [PubMed]
- De Gee, A.J.; van Duinen, R.M.B.; Werner, A.; Davidson, C.L. Early and long-term wear of conventional and resin-modified glass ionomers. J. Dent. Res. 1996, 75, 1613–1619. [Google Scholar] [CrossRef] [PubMed]
- Mair, L.; Joiner, A. The measurement of degradation and wear of three glass ionomers following peroxide bleaching. J. Dent. 2004, 32, 41–45. [Google Scholar] [CrossRef] [PubMed]
- Ramalho, A.; Antunes, P.V. Reciprocating wear test of dental composites: Effect on the antagonist. Wear 2005, 259, 1005–1011. [Google Scholar] [CrossRef]
- Heintze, S.D.; Cavalleri, A.; Forjanic, M.; Zellweger, G.; Rousson, V. A comparison of three different methods for the quantification of the in vitro wear of dental materials. Dent. Mater. 2006, 22, 1051–1062. [Google Scholar] [CrossRef] [PubMed]
- Mechanical Testing and Evaluation (#06772G). Fraction, wear and surface testing. In ASM Handbook, 1st ed.; ASM International: Materials Parks, OH, USA, 2000; Volume 8, pp. 289–357. [Google Scholar]
- Ramalho, A.; Miranda, J.C. The relationship between wear and dissipated energy in sliding systems. Wear 2006, 260, 361–367. [Google Scholar] [CrossRef]
- Ferracane, J.L. Is the wear of dental composites still a clinical concern? Is there still a need for in vitro wear simulating devices? Dent. Mater. 2006, 22, 689–692. [Google Scholar] [CrossRef] [PubMed]
- Solhi, L.; Atai, M.; Nodehi, A.; Imani, M.; Ghaemi, A.; Khosravi, K. Poly (acrylic acid) grafted montmorillonite as novel fillers for dental adhesives: Synthesis, characterization and properties of the adhesive. Dent. Mater. 2012, 28, 369–377. [Google Scholar] [CrossRef] [PubMed]
- Fareed, M.A.; Stamboulis, A. Nanoclays reinforced glass ionomer cements: Dispersion and interaction of polymer grade (PG) montmorillonite with poly (acrylic acid). J. Mater. Sci. Mater. Med. 2014, 25, 91–99. [Google Scholar] [CrossRef] [PubMed]
- ASTM International. Standard Test Method for Linearly Reciprocating Ball-on-Flat Sliding Wear; ASTM International: West Conshohocken, PA, USA, 2005; ASTM G133-05. [Google Scholar]
- Nagarajan, V.S.; Jahanmir, S.; Thompson, V.P. In vitro contact wear of dental composites. Dent. Mater. 2004, 20, 63–71. [Google Scholar] [CrossRef]
- Condon, J.R.; Ferracane, J.L. Evaluation of composite wear with a new multi-mode oral wear simulator. Dent. Mater. 1996, 12, 218–226. [Google Scholar] [CrossRef]
- Wassell, R.W.; McCabe, J.F.; Walls, A.W. A two-body frictional wear test. J. Dent. Res. 1994, 73, 1546–1553. [Google Scholar] [CrossRef] [PubMed]
- ASTM International. Standard Test Method for Vickers Indentation Hardness of Advanced Ceramics; ASTM International: West Conshohocken, PA, USA, 2008; ASTM C1327-08. [Google Scholar]
- Friction, Lubrication and Wear Technology. In ASM Handbook, 1st ed.; American Society for Metals International: Metals Park, OH, USA, 2000; Volume 18.
- Kramer, N.; Kunzelmann, K.H.; Taschner, M.; Mehl, A.; Garcia-Godoy, F.; Frankenberger, R. Antagonist Enamel Wears More Than Ceramic Inlays. J. Dent. Res. 2006, 85, 1097–1100. [Google Scholar] [CrossRef] [PubMed]
- Heintze, S.D.; Barkmeier, W.W.; Latta, M.A.; Rousson, V. Round robin test: Wear of nine dental restorative materials in six different wear simulators—Supplement to the round robin test of 2005. Dent. Mater. 2011, 27, e1–e9. [Google Scholar] [CrossRef] [PubMed]
- De Long, R.; Douglas, W.H. An artificial oral environment for testing dental materials. IEEE Trans. Biomed. Eng. 1991, 38, 339–345. [Google Scholar] [CrossRef] [PubMed]
- De Gee, A.J.; Pallav, P. Occlusal wear simulation with the ACTA wear machine. J. Dent. 1994, 22, 21–27. [Google Scholar] [CrossRef]
- Alemzadeh, K.; Hyde, R.A.; Gao, J. Prototyping a robotic dental testing simulator. Proc. Inst. Mech. Eng. Part H J. Eng. Med. 2007, 221, 385–396. [Google Scholar] [CrossRef] [PubMed]
- Suzuki, S.; Nagai, E.; Taira, Y.; Minesaki, Y. In vitro wear of indirect composite restoratives. J. Prosthet. Dent. 2002, 88, 431–436. [Google Scholar] [CrossRef] [PubMed]
- Shortall, A.C.; Hu, X.Q.; Marquis, P.M. Potential countersample materials for in vitro simulation wear testing. Dent. Mater. 2002, 18, 246–254. [Google Scholar] [CrossRef]
- Suzuki, S.; Leinfelder, K.F.; Shinkai, K. Wear resistance of resin cements. Am. J. Dent. 1995, 8, 83–87. [Google Scholar] [PubMed]
- Leinfelder, K.F.; Suzuki, S. In vitro wear device for determining posterior composite wear. J. Am. Dent. Assoc. 1999, 130, 1347–1353. [Google Scholar] [CrossRef] [PubMed]
- Xu, H.H.K.; Quinn, J.B.; Giuseppetti, A.A. Wear and mechanical properties of nano-silica-fused whisker composites. J. Dent. Res. 2004, 83, 930–935. [Google Scholar] [CrossRef] [PubMed]
- Krejci, I.; Albert, P.; Lutz, F. The Influence of Antagonist Standardization on Wear. J. Dent. Res. 1999, 78, 713–719. [Google Scholar] [CrossRef] [PubMed]
- Zheng, J.; Yu, H.Y.; Zhou, Z.R. Comparative study of the three-body abrasive wear behavior of natural human teeth and plastic teeth. Mocaxue Xuebao Tribol. 2004, 24, 568–571. [Google Scholar]
- ISO (the International Organization for Standardization). Part 1: Wear by tooth brushing, Technical Specification 1999. In Dental Materials-Guidance on Testing of Wear; ISO: Geneva, Switzerland, 2007; ISO 14569-1-1999. [Google Scholar]
- ISO (the International Organization for Standardization). Part 2: Wear by two-and/or three body contact. In Dental Materials-Guidance on Testing of Wea; ISO: Geneva, Switzerland, 2001; ISO 14569-2. [Google Scholar]
- Heintze, S.D. How to qualify and validate wear simulation devices and methods. Dent. Mater. 2006, 22, 712–734. [Google Scholar] [CrossRef] [PubMed]
- Dowling, A.H.; Stamboulis, A.; Fleming, G.J.P. The influence of montmorillonite clay reinforcement on the performance of a glass ionomer restorative. J. Dent. 2006, 34, 802–810. [Google Scholar] [CrossRef] [PubMed]
- Luckham, P.F.; Rossi, S. Colloidal and rheological properties of bentonite suspensions. Adv. Colloid Interface Sci. 1999, 82, 43–92. [Google Scholar] [CrossRef]
- Ramos-Tejada, M.M.; Galindo-Gonzalez, C.; Perea, R.; Durain, J.D.G. Effect of charged polyelectrolytes on the electrophoretic behavior, stability, and viscoelastic properties of montmorillonite suspensions. J. Rheol. 2006, 50, 995–1007. [Google Scholar] [CrossRef]
- Mair, L.H.; Stolarski, T.A.; Vowles, R.W.; Lloyd, C.H. Wear: Mechanisms, manifestations and measurement. Report of a workshop. J. Dent. 1996, 24, 141–148. [Google Scholar] [CrossRef]
- Kunzelmann, K.H.; Brkle, V.; Bauer, C. Two-body and three-body wear of glass ionomer cements. Int. J. Paediatr. Dent. 2003, 13, 434–440. [Google Scholar] [CrossRef] [PubMed]
- Krejci, I.; Lutz, F.; Zedler, C. Effect of contact area size on enamel and composite wear. J. Dent. Res. 1992, 71, 1413–1416. [Google Scholar] [CrossRef] [PubMed]

| Material Parameters | Composition, microstructure, mechanical properties (modulus, yield strength, ductility), fracture toughness, hardness, Poisson’s ratio |
| Design Parameters | Shape and type of antagonist, loading, force/impact level, type of motion, roughness, cycle time |
| Environmental Parameters | Temperature, humidity, atmosphere, wet or dry condition, pH, contamination and so on |
| Lubrication Parameters | Type of medium, presence of slurry, stability of slurry |
| GIC Liquid | Nanoclays (wt %) | Water (%) | PAA Powder (%) |
| PAA | 0.0 | 60 | 40 |
| PAA1 | 1.0 | 59 | 40 |
| PAA2 | 2.0 | 58 | 40 |
| PAA4 | 4.0 | 56 | 40 |
| Cement Specimen | GIC Liquid | Powder | P/L Ratio |
| HiFi | PAA | HiFi glass | 4.2:1 |
| HiFi-1 | PAA1 | HiFi glass | 4.2:1 |
| HiFi-2 | PAA2 | HiFi glass | 4.2:1 |
| HiFi-4 | PAA4 | HiFi glass | 4.2:1 |
| Test Methods | Parameters | HiFi | HiFi-1 | HiFi-2 | HiFi-4 |
|---|---|---|---|---|---|
| Reciprocating wear test | Volume (mm3) | 6.08 (2.1) a | 4.90 (0.6) b | 5.66 (1.0) a | 6.22 (1.3) a |
| Depth (µm) | 481 (30) a | 419 (43) b | 512 (117) a | 419 (63) b | |
| OHSU Volumetric Wear (mm3) | Total wear volume | 0.69 (0.13) a | 0.95 (0.22) b | 0.97 (0.28) b | 1.49 (0.24) b |
| Attrition volume | 0.15 (0.03) a | 0.28 (0.03) b | 0.21 (0.05) c | 0.31 (0.07) b | |
| Abrasion volume | 0.07 (0.01) a | 0.14 (0.01) b | 0.09 (0.03) a | 0.24 (0.04) c | |
| OHSU Wear Depth (µm) | Total wear depth | 222 (17) a | 291 (35) b | 291 (33) b | 343 (44) b |
| Attrition depth | 189 (15.9) a | 245 (24) b | 247 (33) b | 300 (37) c | |
| Abrasion depth | 92.40 (5.5) a | 147 (20) b | 111 (18) b | 165 (23) b | |
| Vickers Hardness (HV) | 72.50 (3.2) a | 62.70 (6.6) a | 69.20 (4.1) a | 85.40 (9.9) a | |
| Parameters | Reciprocating Wear Test | OHSU Wear Test | |
|---|---|---|---|
| Mechanism | Ball-on-flat | Simulation | |
| Type | Two-body wear | Three-body wear | |
| Force (N) | 20 | 20 and 90 | |
| Sliding distance (mm) | 6 | 7 | |
| Contact duration | All time (to-and fro) | Plough | |
| Antagonist | Material | Alumina (Al2O3) | Steatite magnesium silicate |
| Diameter (mm) | 12.5 | 5.0 | |
| Hardness (HV) | 1700 | 650 | |
| Tendency to wear | Yes | No | |
| No. of cycles | Total cycles | 10,000 | 50,000 |
| Total time (h) | 4 | 12 | |
| Frequency (Hz) | 1 | 1 | |
| Medium | Distilled water | Yes | Yes |
| Slurry | No | Yes | |
| Temperature | Room temp. | Room temp. | |
| Profilometer | Type | Contact stylus | Non-contact optical |
| Number of scans | 3 | 1750 | |
| Step size | 1 mm | 0.004 mm | |
© 2017 by the authors. Licensee MDPI, Basel, Switzerland. This article is an open access article distributed under the terms and conditions of the Creative Commons Attribution (CC BY) license (http://creativecommons.org/licenses/by/4.0/).
Share and Cite
Fareed, M.A.; Stamboulis, A. Nanoclay-Reinforced Glass-Ionomer Cements: In Vitro Wear Evaluation and Comparison by Two Wear-Test Methods. Dent. J. 2017, 5, 28. https://doi.org/10.3390/dj5040028
Fareed MA, Stamboulis A. Nanoclay-Reinforced Glass-Ionomer Cements: In Vitro Wear Evaluation and Comparison by Two Wear-Test Methods. Dentistry Journal. 2017; 5(4):28. https://doi.org/10.3390/dj5040028
Chicago/Turabian StyleFareed, Muhammad A., and Artemis Stamboulis. 2017. "Nanoclay-Reinforced Glass-Ionomer Cements: In Vitro Wear Evaluation and Comparison by Two Wear-Test Methods" Dentistry Journal 5, no. 4: 28. https://doi.org/10.3390/dj5040028
APA StyleFareed, M. A., & Stamboulis, A. (2017). Nanoclay-Reinforced Glass-Ionomer Cements: In Vitro Wear Evaluation and Comparison by Two Wear-Test Methods. Dentistry Journal, 5(4), 28. https://doi.org/10.3390/dj5040028