

Oral Health Disparities in Type 2 Diabetes: Examining the Elevated Risk for Dental Caries—A Comparative Study


Abstract

1. Introduction
2. Materials and Methods
3. Results
4. Discussion
5. Conclusions
Author Contributions
Funding
Institutional Review Board Statement
Informed Consent Statement
Data Availability Statement
Acknowledgments
Conflicts of Interest
Abbreviations
| DCs | Dental caries |
| T2DM | Type 2 diabetes mellitus |
| nT2DM | Non-type 2 diabetes mellitus |
| BMI | Body mass index |
| HbA1c | Glycated hemoglobin |
| DT | Decayed teeth |
| MT | Missing teeth |
| FT | Filled teeth |
| DMFT | Decayed, Missing, and Filled Teeth Index |
| CI | Care Index |
| RI | Restorative Index |
| TI | Treatment Index |
References
- GBD 2021 Risk Factors Collaborators. Global burden and strength of evidence for 88 risk factors in 204 countries and 811 subnational locations, 1990–2021: A systematic analysis for the Global Burden of Disease Study 2021. Lancet 2024, 403, 2162–2203. [Google Scholar] [CrossRef] [PubMed]
- Boyajyan, V.; Bilal, U. Assessing the relationship between diabetes mellitus and dental caries among US adults: The National Health and Nutrition Examination Survey (NHANES) 2013–2020. Public Health 2025, 239, 77–79. [Google Scholar] [CrossRef] [PubMed]
- Sabharwal, A.; Stellrecht, E.; Scannapieco, F.A. Associations between dental caries and systemic diseases: A scoping review. BMC Oral Health 2021, 21, 472. [Google Scholar] [CrossRef]
- Carvalho-Silva, C.; Gavinha, S.; Vilela, S.; Rodrigues, R.; Manso, M.C.; Severo, M.; Lopes, C.; Melo, P. Dietary Patterns and Oral Health Behaviours Associated with Caries Development from 4 to 7 Years of Age. Life 2021, 11, 609. [Google Scholar] [CrossRef]
- Coelho, A.S.; Amaro, I.F.; Caramelo, F.; Paula, A.; Marto, C.M.; Ferreira, M.M.; Botelho, M.F.; Carrilho, E.V. Dental caries, diabetes mellitus, metabolic control and diabetes duration: A systematic review and meta-analysis. J. Esthet. Restor. Dent. 2020, 32, 291–309. [Google Scholar] [CrossRef]
- Khatri, H.; Pathak, R.; Yadav, R.; Patel, K.; Jyothi, R.R.; Singh, A. Dental Cavities in people with type 2 Diabetes Mellitus: An analysis of risk indicators. Georgian Med. News. 2023, 345, 140–145. [Google Scholar]
- Malvania, E.A.; Sheth, S.A.; Sharma, A.S.; Mansuri, S.; Shaikh, F.; Sahani, S. Dental caries prevalence among type II diabetic and nondiabetic adults attending a hospital. J. Int. Soc. Prev. Community Dent. 2016, 6 (Suppl. 3), S232–S236. [Google Scholar] [CrossRef]
- Zheng, Y.; Ley, S.H.; Hu, F.B. Global aetiology and epidemiology of type 2 diabetes mellitus and its complications. Nat. Rev. Endocrinol. 2018, 14, 88–98. [Google Scholar] [CrossRef]
- Khan, I.; Shan, T.; Manzoor, M. Comparison of dental caries status of type-2 diabetics with nondiabetics. Pak. Armed Forces Med. J. 2019, 69, 854–856. [Google Scholar]
- Jacob, L.; Shin, J.-I.; Grabovac, I.; Haro, J.M.; Koyanagi, A.; Tully, M.A.; Trott, M.; Kim, J.Y.; Pardhan, S.; Smith, L.; et al. Association between Diabetes and Dental Caries in Spanish Adults: A Cross-Sectional Study Including 23,089 Adults. Oral 2021, 1, 281–289. [Google Scholar] [CrossRef]
- Sandberg, G.E.; Sundberg, H.E.; Fjellstrom, C.A.; Wikblad, K.F. Type 2 diabetes and oral health: A comparison between diabetic and non-diabetic subjects. Diabetes Res. Clin. Pract. 2000, 50, 27–34. [Google Scholar] [CrossRef]
- Leung, W.K.; Siu, S.C.; Chu, F.C.; Wong, K.W.; Jin, L.; Sham, A.S.; Tsang, C.S.; Samaranayake, L.P. Oral health status of low-income, middle-aged to elderly Hong Kong Chinese with type 2 diabetes mellitus. Oral Health Prev. Dent. 2008, 6, 105–118. [Google Scholar] [PubMed]
- Jawed, M.; Khan, R.N.; Shahid, S.M.; Azhar, A. Protective effects of salivary factors in dental caries in diabetic patients of Pakistan. Exp. Diabetes Res. 2012, 2012, 947304. [Google Scholar] [CrossRef] [PubMed]
- Mohamed, H.G.; Idris, S.B.; Ahmed, M.F.; Bøe, O.E.; Mustafa, K.; Ibrahimm, S.O.; Astrøm, A.N. Association between oral health status and type 2 diabetes mellitus among Sudanese adults: A matched case-control study. PLoS ONE 2013, 8, e82158. [Google Scholar] [CrossRef]
- Bakhshandeh, S.; Murtomaa, H.; Vehkalahti, M.M.; Mofid, R.; Suomalainen, K. Dental findings in diabetic adults. Caries Res. 2008, 42, 14–18. [Google Scholar] [CrossRef]
- Bissong, M.; Azodo, C.C.; Agbor, M.A.; Nkuo-Akenji, T.; Fon, P.N. Oral health status of diabetes mellitus patients in Southwest Cameroon. Odontostomatol. Trop. 2015, 38, 49–57. [Google Scholar] [PubMed]
- Singh, P.; Singh, A.; Singh, T.; Kour, R. Diabetes an inducing factor for dental caries: A case control analysis in Jammu. J. Int. Soc. Prev. Community Dent. 2016, 6, 125–129. [Google Scholar] [CrossRef]
- Yonekura, S.; Usui, M.; Murano, S. Association between numbers of decayed teeth and HbA1c in Japanese patients with type 2 diabetes mellitus. Upsala J. Med. Sci. 2017, 122, 108–113. [Google Scholar] [CrossRef]
- Song, I.S.; Han, K.; Park, Y.M.; Ryu, J.J.; Park, J.B. Type 2 diabetes as a risk indicator for dental caries in Korean adults: The 2011–2012 Korea national health and nutrition examination survey. Community Dent. Health 2017, 34, 169–175. [Google Scholar]
- Latti, B.R.; Kalburge, J.V.; Birajdar, S.B.; Latti, R.G. Evaluation of relationship between dental caries, diabetes mellitus and oral microbiota in diabetics. J. Oral Maxillofac. Pathol. 2018, 22, 282. [Google Scholar] [CrossRef]
- Majbauddin, A.; Tanimura, C.; Aoto, H.; Otani, S.; Parrenas, M.; Kobayashi, N.; Morita, T.; Inoue, K.; Masumoto, T.; Kurozawa, Y. Association between dental caries indicators and serum glycated hemoglobin-levels among patients with type 2 diabetes mellitus. J. Oral Sci. 2019, 61, 335–342. [Google Scholar] [CrossRef] [PubMed]
- Mohan, D.; Bhuvaneshwar, Y.; Jeyaram, R.M.; Saravanan, S.; Amutha, A. Research Team. Dental caries and their relation to hba1c in adults with type 2 diabetes mellitus. Indian J. Public Health 2022, 66, 206–209. [Google Scholar] [PubMed]
- Weijdijk, L.P.M.; van der Weijden, G.A.; Slot, D.E. DMF scores in patients with diabetes mellitus: A systematic review and meta-analysis of observational studies. J. Dent. 2023, 136, 104628. [Google Scholar] [CrossRef]
- Lin, B.P.; Taylor, G.W.; Allen, D.J.; Ship, J.A. Dental caries in older adults with diabetes mellitus. Spec. Care Dentist. 1999, 19, 8–14. [Google Scholar] [CrossRef] [PubMed]
- Zielinski, M.B.; Fedele, D.; Forman, L.J.; Pomerantz, S.C. Oral health in the elderly with non-insulin-dependent diabetes mellitus. Spec. Care Dentist. 2002, 22, 94–98. [Google Scholar] [CrossRef]
- Miralles-Jorda, L.; Silvestre-Donat, F.J.; Grau Garcia-Moreno, D.M.; Hernandez-Mijares, A. Buccodental pathology in patients with insulin-dependent diabetes mellitus: A clinical study. Med. Oral. 2002, 7, 298–302. [Google Scholar]
- Arrieta-Blanco, J.J.; Bartolomé-Villar, B.; Jiménez-Martinez, E.; Saavedra-Vallejo, P.; Arrieta-Blanco, F.J. Problemas bucodentales en pacientes con diabetes mellitus (I): Indice de placa y caries dental. Med. Oral. 2003, 8, 97–109. [Google Scholar]
- Hintao, J.; Teanpaisan, R.; Chongsuvivatwong, V.; Dahlen, G.; Rattarasarn, C. Root surface and coronal caries in adults with type 2 diabetes mellitus. Community Dent. Oral Epidemiol. 2007, 35, 302–309. [Google Scholar] [CrossRef]
- Marín, N.P.; Rodríguez, J.P.L.; Solis, C.E.M.; Loyola, A.P.; Macías, J.F.R.; Rosado, J.C.O.; García, C.A. Caries, Periodontal disease and tooth loss in patients with diabetes mellitus types 1 and 2. Acta Odontol. Latinoam. 2008, 21, 127–133. [Google Scholar]
- Mauri-Obradors, E.; Estrugo-Devesa, A.; Jané-Salas, E.; Viñas, M.; López-López, J. Oral manifestations of Diabetes Mellitus. A systematic review. Med. Oral Patol. Oral Cir. Bucal. 2017, 22, e586–e594. [Google Scholar]
- Suzuki, S.; Yoshino, K.; Takayanagi, A.; Ishizuka, Y.; Satou, R.; Nara, N.; Kamijo, H.; Sugihara, N. Relationship between Blood HbA1c Level and Decayed Teeth in Patients with Type 2 Diabetes: A Cross-sectional Study. Bull. Tokyo Dent. Coll. 2019, 60, 89–96. [Google Scholar] [CrossRef] [PubMed]
- Mohanty, M.; Govind, S.; Rath, S. Prevalence of salivary microbial load and lactic acid presence in diabetic and non-diabetic individuals with different dental caries stages. Restor. Dent Endod. 2024, 49, e4. [Google Scholar] [CrossRef] [PubMed]
- Ivanovski, K.; Naumovski, V.; Kostadinova, M.; Pesevska, S.; Drijanska, K.; Filipce, V. Xerostomia and salivary levels of glucose and urea in patients with diabetes. Prilozi 2012, 33, 219–229. [Google Scholar]
- Chávez, E.M.; Borrell, L.N.; Taylor, G.W.; Ship, J.A. A longitudinal analysis of salivary flow in control subjects and older adults with type 2 diabetes. Oral Surg. Oral Med. Oral Pathol. Oral Radiol. Endodont. 2001, 91, 166–173. [Google Scholar] [CrossRef]
- Zhou, G.; Shu, X.; Long, Y.; Cao, Y.; Wang, J.; Liao, G.; Zou, L. Dental caries and salivary alterations in patients with type 2 diabetes: A systematic review and meta-analysis. J. Dent. 2024, 150, 105321. [Google Scholar] [CrossRef]
- Idrees, M.; Hammad, M.; Faden, A.; Kujan, O. Influence of body mass index on severity of dental caries: Cross-sectional study in healthy adults. Ann. Saud. Med. 2017, 37, 444–448. [Google Scholar] [CrossRef]
- Kim, Y.S.; Kim, J.H. Body mass index and oral health status in Korean adults: The Fifth Korea National Health and Nutrition Examination Survey. Int. J. Dent. Hyg. 2017, 15, 172–178. [Google Scholar] [CrossRef] [PubMed]
- Hamasha, A.A.; Alsolaihim, A.A.; Alturki, H.A.; Alaskar, L.A.; Alshunaiber, R.A.; Aldebasi, W.T. The relationship between body mass index and oral health status among Saudi adults: A cross-sectional study. Community Dent. Health 2019, 36, 217–222. [Google Scholar]
- DGS. 3° Estudo Nacional de Prevalência das Doenças Orais. DGS eds, Lisboa. 2014. Available online: https://www.dgs.pt/documentos-e-publicacoes/iii-estudo-nacional-de-prevalencia-das-doencas-orais-pdf.aspx (accessed on 24 April 2025).
- WHO. Oral Health Surveys: BASIC Methods, 5th ed.; World Health Organization: Geneva, Switzerland, 2013. [Google Scholar]
- Lambert, M.J.; Vanobbergen, J.S.N.; Martens, L.C.; Martens, L.C.; Visschere, L.M.J. Socioeconomic inequalities in caries experience, care level and dental attendance in primary school children in Belgium: A cross-sectional survey. BMJ Open 2017, 7, e015042. [Google Scholar] [CrossRef]
- OCDE/European Observatory on Health Systems and Policies. Portugal: Country Health Profile 2023, State of Health in the EU; OCDE Publishing: Paris, France, 2023; pp. 15–16. [Google Scholar]
- Carretero, M.; Calderón-Larrañaga, A.; Poblador-Plou, B.; Prados-Torres, A. Primary health care use from the perspective of gender and morbidity burden. BMC Womens Health 2014, 14, 145. [Google Scholar] [CrossRef]
- Roderick, P.; Turner, V.; Readshaw, A.; Dogar, O.; Siddiqi, K. The global prevalence of tobacco use in type 2 diabetes mellitus patients: A systematic review and meta-analysis. Diabetes. Res. Clin. Pract. 2019, 154, 52–65. [Google Scholar] [CrossRef] [PubMed]
- Žiūkaitė, L.; Weijdijk, L.P.M.; Tang, J.; Slot, D.E.; van der Weijden, G.A.F. Edentulism among diabetic patients compared to non-diabetic controls: A systematic review and meta-analysis. Int. J. Dent. Hyg. 2024, 22, 3–14. [Google Scholar] [CrossRef] [PubMed]
- Chang, Y.; Lee, J.S.; Lee, K.J.; Woo, H.G.; Song, T.-J. Improved oral hygiene is associated with decreased risk of new-onset diabetes: A nationwide population-based cohort study. Diabetologia 2020, 63, 924–933. [Google Scholar] [CrossRef]
- Bharateesh, J.; Ahmed, M.; Kokila, G. Diabetes and Oral Health: A Case-control Study. Int. J. Prev. Med. 2012, 3, 806–809. [Google Scholar]
- Ahmadinia, A.R.; Rahebi, D.; Mohammadi, M.; Ghelichi-Ghojogh, M.; Jafari, A.; Esmaielzadeh, F.; Rajabi, A. Association between type 2 diabetes (T2D) and tooth loss: A systematic review and meta-analysis. BMC Endocr. Disord. 2022, 22, 100. [Google Scholar] [CrossRef]
- Khahro, M.M.; Shaikh, Q.; Baloch, M.; Channa, S.A.; Surwaich, A. Frequency of dental caries among patients with type-II diabetes mellitus. Professional Med. J. 2019, 26, 865–869. [Google Scholar] [CrossRef]
- Khattaba, M.; Khader, Y.S.; Al-Khawaldehd, A.; Ajlounid, K. Factors associated with poor glycemic control among patients with Type 2 diabetes. J. Diabetes Complicat. 2010, 24, 84–89. [Google Scholar] [CrossRef]
- Almutairi, M.A.; Said, S.M.; Zainuddin, H. Predictors of Poor Glycemic Control Among Type Two Diabetic Patients. Am. J. Med. 2013, 3, 17–21. [Google Scholar]
- Bin Rakhis, S.A., Sr.; AlDuwayhis, N.M.; Aleid, N.; AlBarrak, A.N.; Aloraini, A.A. Glycemic Control for Type 2 Diabetes Mellitus Patients: A Systematic Review. Cureus 2022, 14, e26180. [Google Scholar] [CrossRef]


| ALL n = 666 | T2DM n = 343 | nT2DM n = 323 | p | ||
|---|---|---|---|---|---|
| Age, mean ± sd | 63.9 ± 12.7 | 67.8 ± 9.8 | 59.8 ± 14.2 | 0.533 ** | |
| Gender, n (%) | |||||
| Female | 379 (56.9) | 176 b (51.3) | 203 a (62.8) | 0.003 * | |
| Male | 287 (43.1) | 167 a (48.7) | 120 b (37.2) | ||
| BMI, n (%) | |||||
| Low weight or normal | 178 (26.8) | 53 b (15.5) | 125 a (38.7) | <0.001 *’ | |
| Pre-obese | 286 (42.9) | 163 a (47.5) | 123 b (38.1) | 0.021 *’ | |
| Obese | 202 (30.3) | 127 a (37.0) | 75 b (23.3) | <0.001 *’ | |
| Tobacco consumer | 86 (12.9) | 24 b (7.0) | 62 a (19.2) | <0.001 * | |
| Total edentulism | 83 (12.5) | 54 (15.7) | 29 (9) | <0.001 * | |
| Daily oral hygiene (all individuals) | 500 (75.1) | 256 (74.6) | 244 (75.5) | 0.787 * | |
| In the morning | 406 (61.0) | 212 (61.8) | 194 (60.1) | 0.644 * | |
| After lunch | 213 (32) | 118 (34.4) | 95 (29.4) | 0.168 * | |
| At night | 449 (67.4) | 217 b (63.3) | 232 a (71.8) | 0.018 * | |
| Daily oral hygiene (dentate individuals) | 435 (74.7) | 225 (76.5) | 210 (72.9) | 0.316 * | |
| In the morning | 367 (63.1) | 182 (61.9) | 185 (64.2) | 0.560 * | |
| After lunch | 184 (31.6) | 88 (29.9) | 96 (33.3) | 0.378 * | |
| At night | 390 (67) | 214 a (72.8) | 176 b (61.1) | 0.003 * | |
| Dental caries | |||||
| DT | n (%) | 451 (67.7) | 215 b (62.9) | 235 a (72.8) | 0.006 * |
| 95% CL % | 57.5–67.6 | 67.7–77.3 | |||
| mean ± sd | 2.0 b ± 2.7 | 2.8 a ± 2.9 | <0.001 *** | ||
| 95%CL mean: | 1.74–2.32 | 2.52–3.16 | |||
| MT | n (%) | 618 (92.8) | 323 a (94.7) | 293 b (90.7) | 0.046 * |
| 95% CL % | 62.5–72.4 | 87.0–93.5 | |||
| mean ± sd | 13.0 a ± 9.6 | 9.8 b ± 8.9 | <0.001 *** | ||
| 95%CL mean: | 11.94–13.99 | 8.82–10.77 | |||
| FT | n (%) | 452 (67.9) | 213 b (62.3) | 238 a (73.7) | 0.002 * |
| 95% CL % | 56.9–67.1 | 68.6–78.2 | |||
| mean ± sd | 2.7 b ± 2.9 | 3.3 a ± 3.3 | 0.016 *** | ||
| 95%CL mean: | 2.39–3.02 | 2.93–3.65 | |||
| DMFT | n (%) | 656 (98.5) | 336 (98.2) | 319 (98.8) | 0.585 * |
| 95% CL % | 95.8–99.1 | 96.7–99.6 | |||
| mean ± sd | 17.7 a ± 8.3 | 15.9 b ± 7.8 | 0.005 *** | ||
| 95%CL mean: | 16.82–18.57 | 15.08–16.78 | |||
| Care Index (%) | 15.4 b | 20.6 a | <0.001 * | ||
| 95% CL % | 14.49–16.31 | 19.56–21.77 | |||
| Restorative Index (%) | 57.3 a | 53.6 b | <0.001 * | ||
| 95% CL % | 56.02–58.67 | 52.13–55.13 | |||
| Treatment Index (%) | 88.6 a | 82.2 b | <0.001 * | ||
| 95% CL % | 87.73–89.34 | 81.09–83.18 | |||
| DM Controlled | DM Uncontrolled | HbA1c | |||
|---|---|---|---|---|---|
| n (%) | n (%) | n (%) | Mean ± Sd | ||
| All | 343 | 6.8 ± 1.2 | |||
| T2DM | Controlled | 240 a (70.0) | 6.2 b ± 0.4 | ||
| Uncontrolled | 103 b (30.0) | 8.2 a ± 1.3 | |||
| p | <0.001 * | <0.001 ** | |||
| Duration of T2DM | ≤5 years | 120 (35.0) | 77 a (40.4) | 23 b (22.3) | 6.6 b ± 1.2 |
| >5–10 years | 109 (31.8) | 85 a (35.4) | 24 b (23.3) | 6.5 b ± 0.9 | |
| >10 years | 114 (33.2) | 58 b (24.2) | 56 a (54.4) | 7.3 a ± 1.4 | |
| p | 0.767 *** | <0.001 *** | <0.001 **** | ||
| Hypertension | 184 (53.6) | 6.9 ± 1.3 | |||
| Nephropathy | 24 (7.0) | 6.9 ± 1.6 | |||
| Retinopathy | 40 (11.7) | 7.1 ± 1.5 | |||
| Neuropathy | 24 (7.0) | 6.7 ± 1.4 | |||
| Dyslipidemia | 299 (87.2) | 6.8 ± 1.2 | |||
| DT | p * | MT | p * | FT | p * | DMFT | p * | ||||||
|---|---|---|---|---|---|---|---|---|---|---|---|---|---|
| T2DM | nT2DM | T2DM | nT2DM | T2DM | nT2DM | T2DM | nT2DM | ||||||
| Variable | Category | Mean ± sd | Mean ± sd | Mean ± sd | Mean ± sd | ||||||||
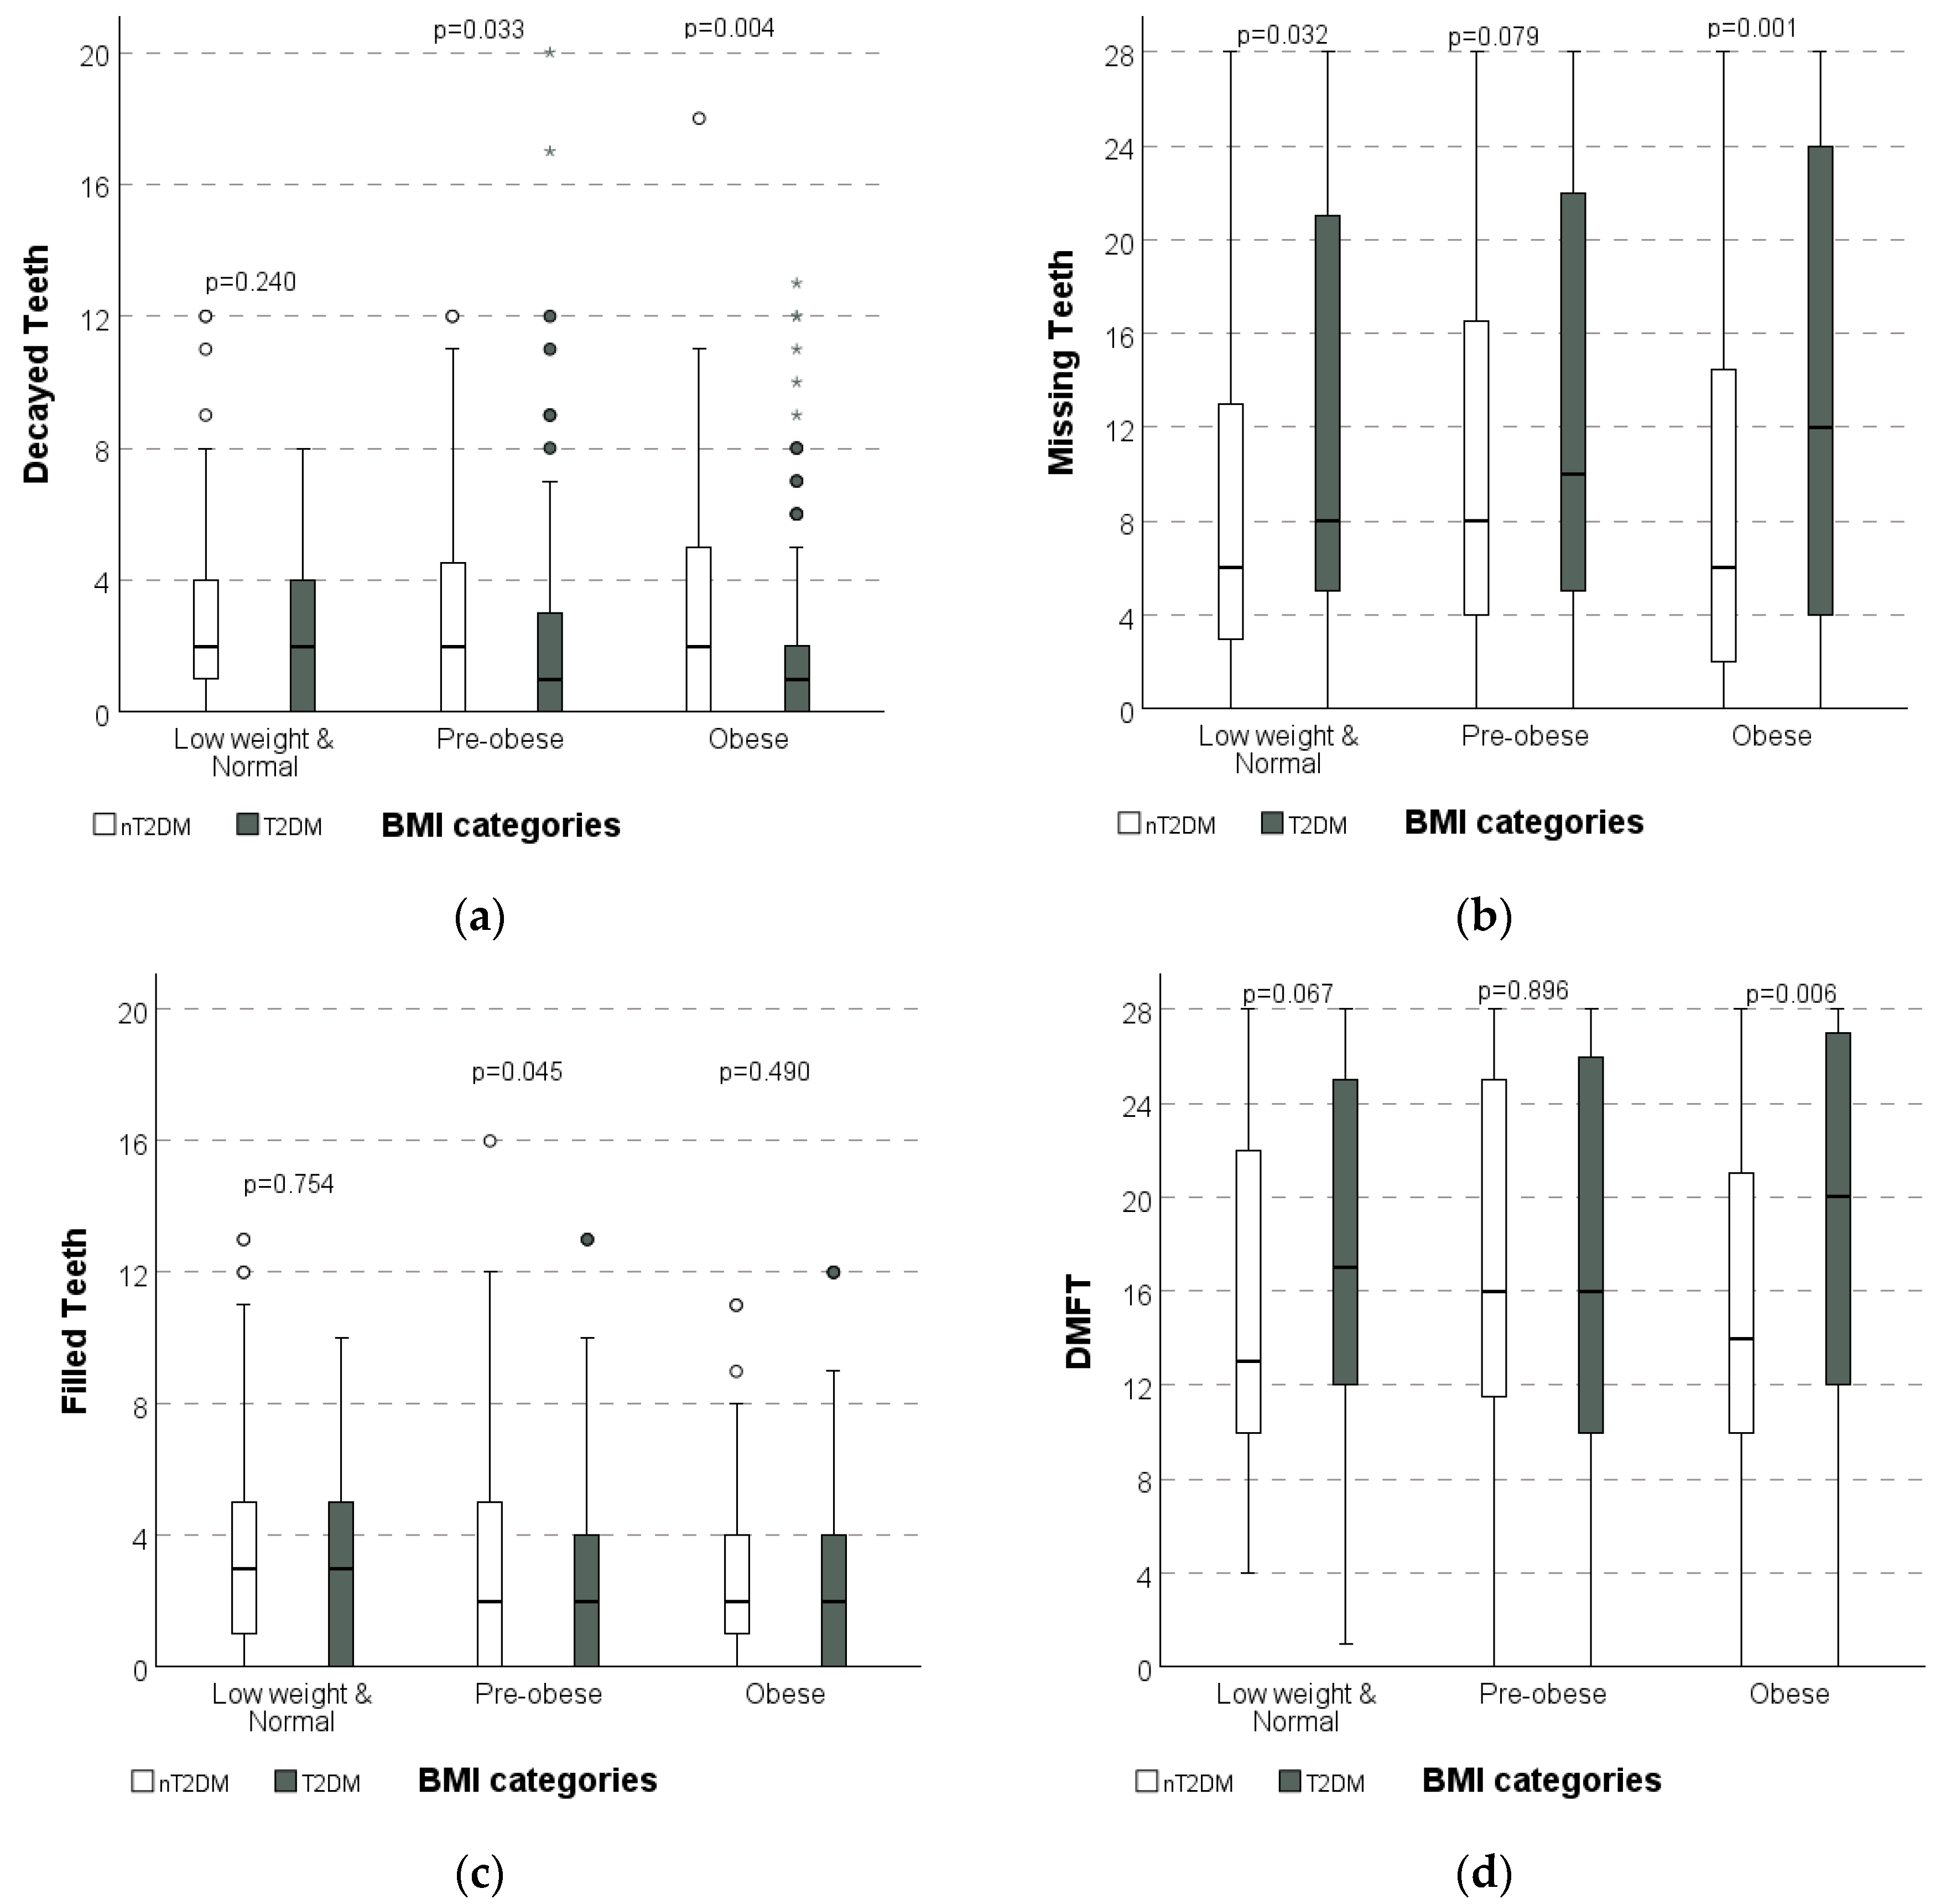
| BMI | Low weight Normal | 2.2 ± 2.1 | 2.7 ± 2.5 | 0.240 | 12.1 A ± 9.7 | 9.2 B ± 8.9 | 0.032 | 3.2 ± 2.9 | 3.4 ± 3.2 | 0.754 | 17.4 ± 7.8 | 15.4 ± 7.5 | 0.067 |
| Pre-obese | 2.1 B ± 2.8 | 2.9 A ± 3.1 | 0.033 | 12.7 ± 9.5 | 10.7 ± 9.1 | 0.079 | 2.5 B ± 2.9 | 3.4 A ± 3.6 | 0.045 | 17.2 ± 8.5 | 16.9 ± 8.0 | 0.896 | |
| Obese | 1.9 B ± 2.8 | 3.0 A ± 3.3 | 0.004 | 13.7 A ± 9.9 | 9.3 B ± 8.7 | 0.001 | 2.8 ± 3.0 | 2.9 ± 2.9 | 0.490 | 18.4 A ± 8.2 | 15.2 B ± 7.7 | 0.006 | |
| p ** | 0.115 | 0.924 | 0.565 | 0.211 | 0.295 | 0.639 | 0.478 | 0.106 | |||||
| Tobacco consumer | Yes | 2.3 ± 2.8 | 3.4 ± 3.1 | 0.090 | 15.2 A ± 10.2 | 9.8 B ± 9.0 | 0.017 | 2.8 ± 3.0 | 2.6 b ± 2.4 | 0.965 | 20.2 A ± 7.3 | 15.7 B ± 8.1 | 0.014 |
| No | 2.0 B ± 2.7 | 2.7 A ± 2.9 | <0.001 | 12.8 A ± 9.6 | 9.8 B ± 8.9 | <0.001 | 2.7 B ± 2.9 | 3.5 Aa ± 3.5 | 0.008 | 17.5 A ± 8.3 | 16.0 B ± 7.7 | 0.023 | |
| p * | 0.669 | 0.125 | 0.247 | 0.968 | 0.954 | 0.021 | 0.124 | 0.791 | |||||
| Duration of T2DM | ≤5 years | 2.3 ± 3.0 | 11.2 b ± 9.1 | 3.2 ± 3.2 | 16.5 b ± 8.2 | ||||||||
| >5–10 years | 1.8 ± 2.0 | 13.0 ab ± 9.8 | 2.4 ± 2.6 | 17.2 ab ± 8.6 | |||||||||
| >10 years | 1.9 ± 2.9 | 14.8 a ± 9.7 | 2.5 ± 3.0 | 19.3 a ± 7.9 | |||||||||
| p ** | 0.416 | 0.014 | 0.168 | 0.030 | |||||||||
| T2DM (HbA1c) | Controlled | 1.8 ± 2.3 | 12.9 ± 9.4 | 2.8 ± 2.8 | 17.5 ± 8.1 | ||||||||
| Uncontrolled | 2.4 ± 3.4 | 13.0 ± 10.2 | 2.6 ± 3.1 | 18.1 ± 8.7 | |||||||||
| p ** | 0.760 | 0.833 | 0.282 | 0.524 | |||||||||
| Prevalence | p *** | Prevalence | p *** | Prevalence | p *** | DMFT > 0 | p *** | ||||||
| T2DM (HbA1c) | Controlled | 63.7% | 0.607 | 96.2% | 0.056 | 64.6% | 0.178 | 98.8% | 0.368 | ||||
| Uncontrolled | 60.8% | 91.2% | 56.9% | 97.1% | |||||||||
Disclaimer/Publisher’s Note: The statements, opinions and data contained in all publications are solely those of the individual author(s) and contributor(s) and not of MDPI and/or the editor(s). MDPI and/or the editor(s) disclaim responsibility for any injury to people or property resulting from any ideas, methods, instructions or products referred to in the content. |
© 2025 by the authors. Licensee MDPI, Basel, Switzerland. This article is an open access article distributed under the terms and conditions of the Creative Commons Attribution (CC BY) license (https://creativecommons.org/licenses/by/4.0/).
Share and Cite
Frias-Bulhosa, J.; Manso, M.C.; Mota, C.L.; Melo, P. Oral Health Disparities in Type 2 Diabetes: Examining the Elevated Risk for Dental Caries—A Comparative Study. Dent. J. 2025, 13, 258. https://doi.org/10.3390/dj13060258
Frias-Bulhosa J, Manso MC, Mota CL, Melo P. Oral Health Disparities in Type 2 Diabetes: Examining the Elevated Risk for Dental Caries—A Comparative Study. Dentistry Journal. 2025; 13(6):258. https://doi.org/10.3390/dj13060258
Chicago/Turabian StyleFrias-Bulhosa, José, Maria Conceição Manso, Carla Lopes Mota, and Paulo Melo. 2025. "Oral Health Disparities in Type 2 Diabetes: Examining the Elevated Risk for Dental Caries—A Comparative Study" Dentistry Journal 13, no. 6: 258. https://doi.org/10.3390/dj13060258
APA StyleFrias-Bulhosa, J., Manso, M. C., Mota, C. L., & Melo, P. (2025). Oral Health Disparities in Type 2 Diabetes: Examining the Elevated Risk for Dental Caries—A Comparative Study. Dentistry Journal, 13(6), 258. https://doi.org/10.3390/dj13060258