Article

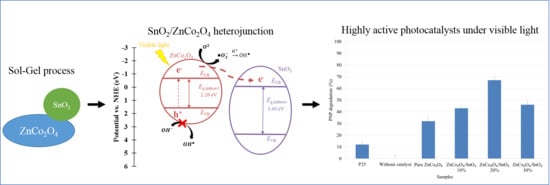
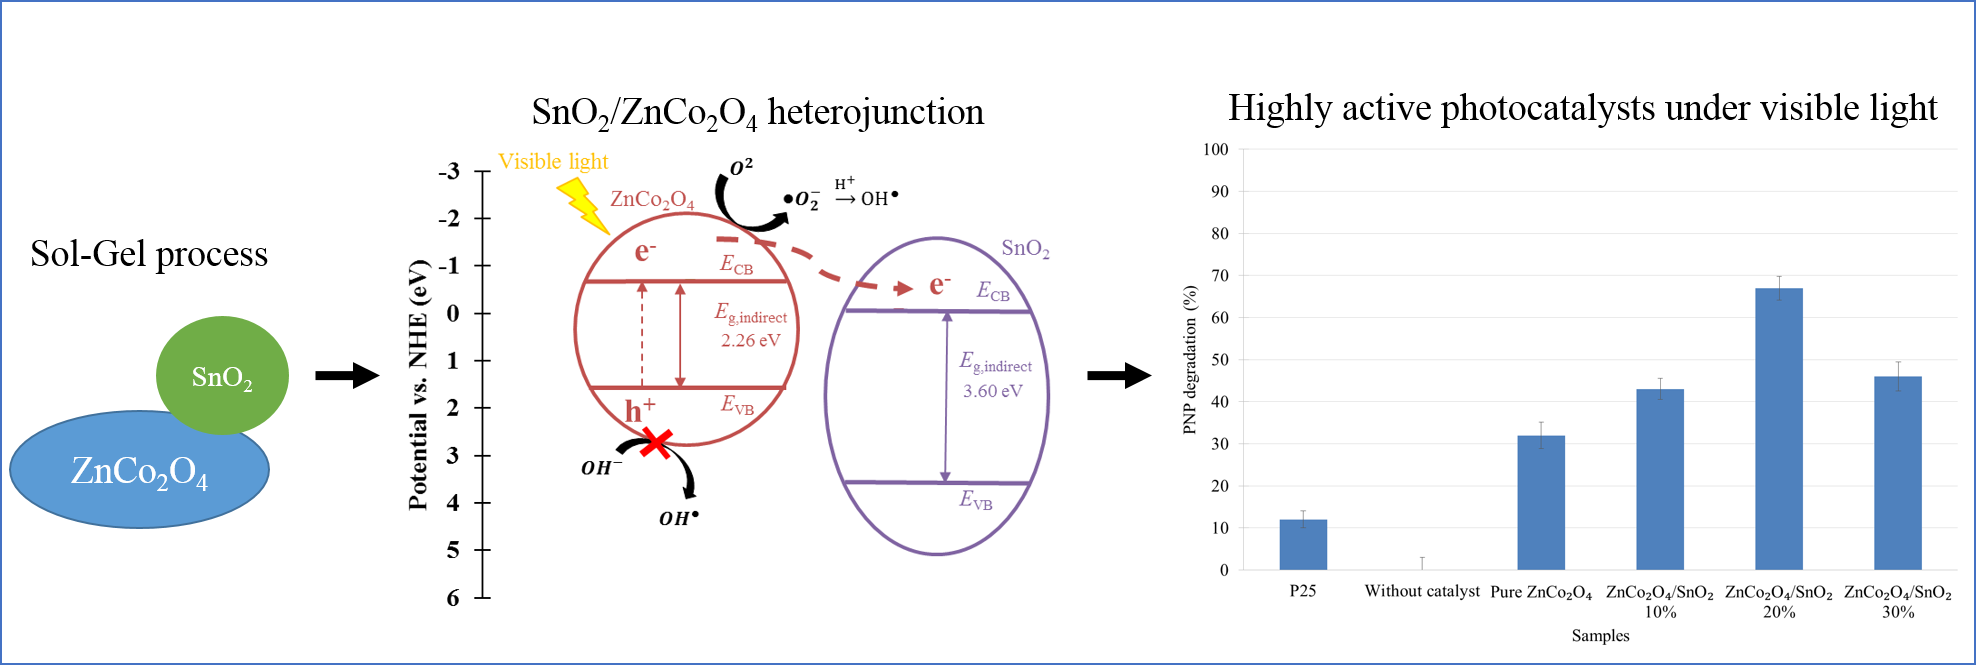
Visible Light Sensitive SnO2/ZnCo2O4 Material for the Photocatalytic Removal of Organic Pollutants in Water

1
Département de Chimie, Université Ibn-Khaldoun, Tiaret 14000, Algérie
2
Department of Chemical Engineering–Nanomaterials, Catalysis and Electrochemistry, B6a, University of Liege, 4000 Liege, Belgium
3
Laboratoire de Physiologie Végétale Appliquée au Culture Hors Sol, Département des Sciences de la Nature et de la Vie, Université Ibn-Khaldoun, Tiaret 14000, Algérie
4
Interfaculty Research Center of Biomaterials (CEIB), University of Liège, 4000 Liège, Belgium
5
Center for Education and Research on Macromolecules, University of Liège, Cesam-RU, 4000 Liège, Belgium
6
SIAM Platform, University of Namur, Rue de Bruxelles 61, 5000 Namur, Belgium
*
Author to whom correspondence should be addressed.
Inorganics 2019, 7(6), 77; https://doi.org/10.3390/inorganics7060077
Submission received: 27 May 2019 / Revised: 12 June 2019 / Accepted: 19 June 2019 / Published: 21 June 2019

Abstract

:
In this study, pure ZnCo2O4 and SnO2/ZnCo2O4 mix photocatalysts have been synthesized by the sol-gel process with three different SnO2 loading percentages (10, 20, and 30 wt %). Their photocatalytic activities were assessed on the degradation of organic pollutants in water under visible illumination. The structural, morphological, and optical properties were analyzed by X-ray diffraction (XRD), scanning electron microscopy, energy-dispersive X-ray (EDX), Fourier transform infrared (FTIR), nitrogen adsorption-desorption isotherms, X-ray photoelectron spectroscopy (XPS), and UV–Visible diffuse reflectance measurements. The results have shown that the materials are composed of a crystalline ZnCo2O4 matrix with a decrease in crystallite size with the amount of SnO2. Weakly crystalline SnO2 is also observed for loaded samples. The specific surface area is modified with the loading ratio. The evaluation of the photoactivity of the samples under visible light for the degradation of p-nitrophenol has highlighted that all materials are highly photoactive under visible light thanks to heterojunction between the two oxides. An application test has been conducted on a dye, congo red, showing the same tendencies. An optimal amount of SnO2 loading is observed for the sample containing 20 wt % of SnO2. A comparison with commercial Evonik P25 showed that the materials developed in this work have five to six times better efficiency under visible light, leading to a promising photocatalyst material.

Graphical Abstract

1. Introduction

During the past decade, water pollution has been considered as an environmental problem that requires effective solutions [1]. The removal of toxic pollutants from wastewater is necessary for the protection of health and environment. Organic pollutants and, in particular, dyes are frequently found in the wastewaters of several industries such as electroplating, textile production, cosmetics, and pharmaceuticals. In wastewater treatment, a large number of methods have been reported for effective removal of organic pollutants, including physical, chemical, and biological approaches such as volatilization, electrochemical treatment, hydrolysis, photolysis, oxidation, biodegradation, or adsorption.
Advanced oxidation processes (AOP) are efficient processes that eliminate non degradable organic pollutants by means of biological processes [2]. One of these solutions, heterogeneous photocatalysis, is nowadays recognized as a strategic area of growing importance regarding the development of sustainable technologies for energy water treatments [3]. Considerable efforts have been made to synthesize, characterize, and describe the physical and chemical properties of metal oxide nanomaterials because of their significant applications in numerous technological fields [4]. Many semiconductors, such as TiO2, ZnO, SnO2, WO3, or CeO2, have shown promising photocatalytic activity for organic pollutant degradation [5,6,7]. The most widely used photocatalyst is TiO2 [8,9], which is a non-toxic and cheap semiconductor sensitive to UV radiation [10]. Due to its large band gap (3.2 eV → 388 nm, for anatase phase), when solar light is used, only 5–8% of the solar spectrum [10] can be used. For economic and ecological reasons, much effort is being devoted to developing the efficient use of solar light, targeting materials photoactive under visible illumination [8,11].
For this purpose, mixed metal oxides, resulting from the combination of metal oxides, with spinel structure and general formula AB2O4 like MgAl2O4, CuGa2O4, CuFe2O4, ZnFe2O4, ZnMn2O4, MnCo2O4, NiCo2O4, CoMn2O4, or ZnCo2O4, have been widely studied in recent years [12]. With its large absorption range (200–800 nm), the ZnCo2O4 material is a suitable candidate for photocatalysis application under solar radiation [13]. ZnCo2O4 nanoparticles are among the most promising materials for several technological and environmental applications [14]. Cubic spinel ZnCo2O4 is isomorphic to the Co3O4 crystal structure where Co2+ tetrahedral sites (Td) in Co3O4 is replaced by Zn2+ while the content of Co3+ in octahedral sites (Oh) remains unchanged [14,15]. To increase photoefficiency, combinations with other semiconductors have been also studied as ZnO/ZnCo2O4 [16], TiO2/ZnCo2O4 [17], or ZrO2/ZnCo2O4 [18] mixing.
The sol-gel method is a very attractive chemical route due to its simplicity and flexibility in the use of different source materials that allow synthesizing amorphous and polycrystalline materials at low cost. As the name implies, the sol-gel process is the conversion of a sol to a gel. The sol-gel process is therefore a series of hydrolysis and condensation reactions of the inorganic alkoxide monomers that forms colloidal particles (sol) and converts them into a continuous network (gel) [19,20]. Indeed, this synthesis method has proven to be effective for the synthesis of a large range of oxide materials [21,22,23,24] in different shapes as powder, film, or monolith.
The aim of this present work is the development of efficient pure and SnO2/ZnCo2O4 mix photocatalysts synthesized by a sol-gel process for the removal of organic pollutant in water. The synthesized materials need to be photoactive under visible irradiation (λ > 400 nm). ZnCo2O4 and SnO2/ZnCo2O4 nanocrystalline materials were synthesized by the sol-gel process. Three different contents of SnO2 were studied: 10, 20, and 30 wt %. The resulting materials were characterized by X-ray diffraction (XRD), nitrogen adsorption-desorption measurements, Fourier-transformed infrared spectroscopy (FTIR), scanning electron microscopy coupled with an energy dispersive X-ray (SEM/EDX), X-ray photoelectron spectroscopy (XPS) and diffuse reflectance measurements. The photoefficiency was assessed based on the photodegradation of p-nitrophenol (PNP) under visible light. An application test was carried out on an industrial dye, congo red (CR). Congo red dye and p-nitrophenol are model pollutants found in literature [25,26,27,28]. However, congo red is a dye and can be affected by the process of sensitization, making it difficult to control whether the observed degradation is due to photocatalysis or not [29]. The recycling property of the catalysts was also assessed on the PNP degradation after five cycles of reaction (120 h of illumination).

2. Results and Discussion

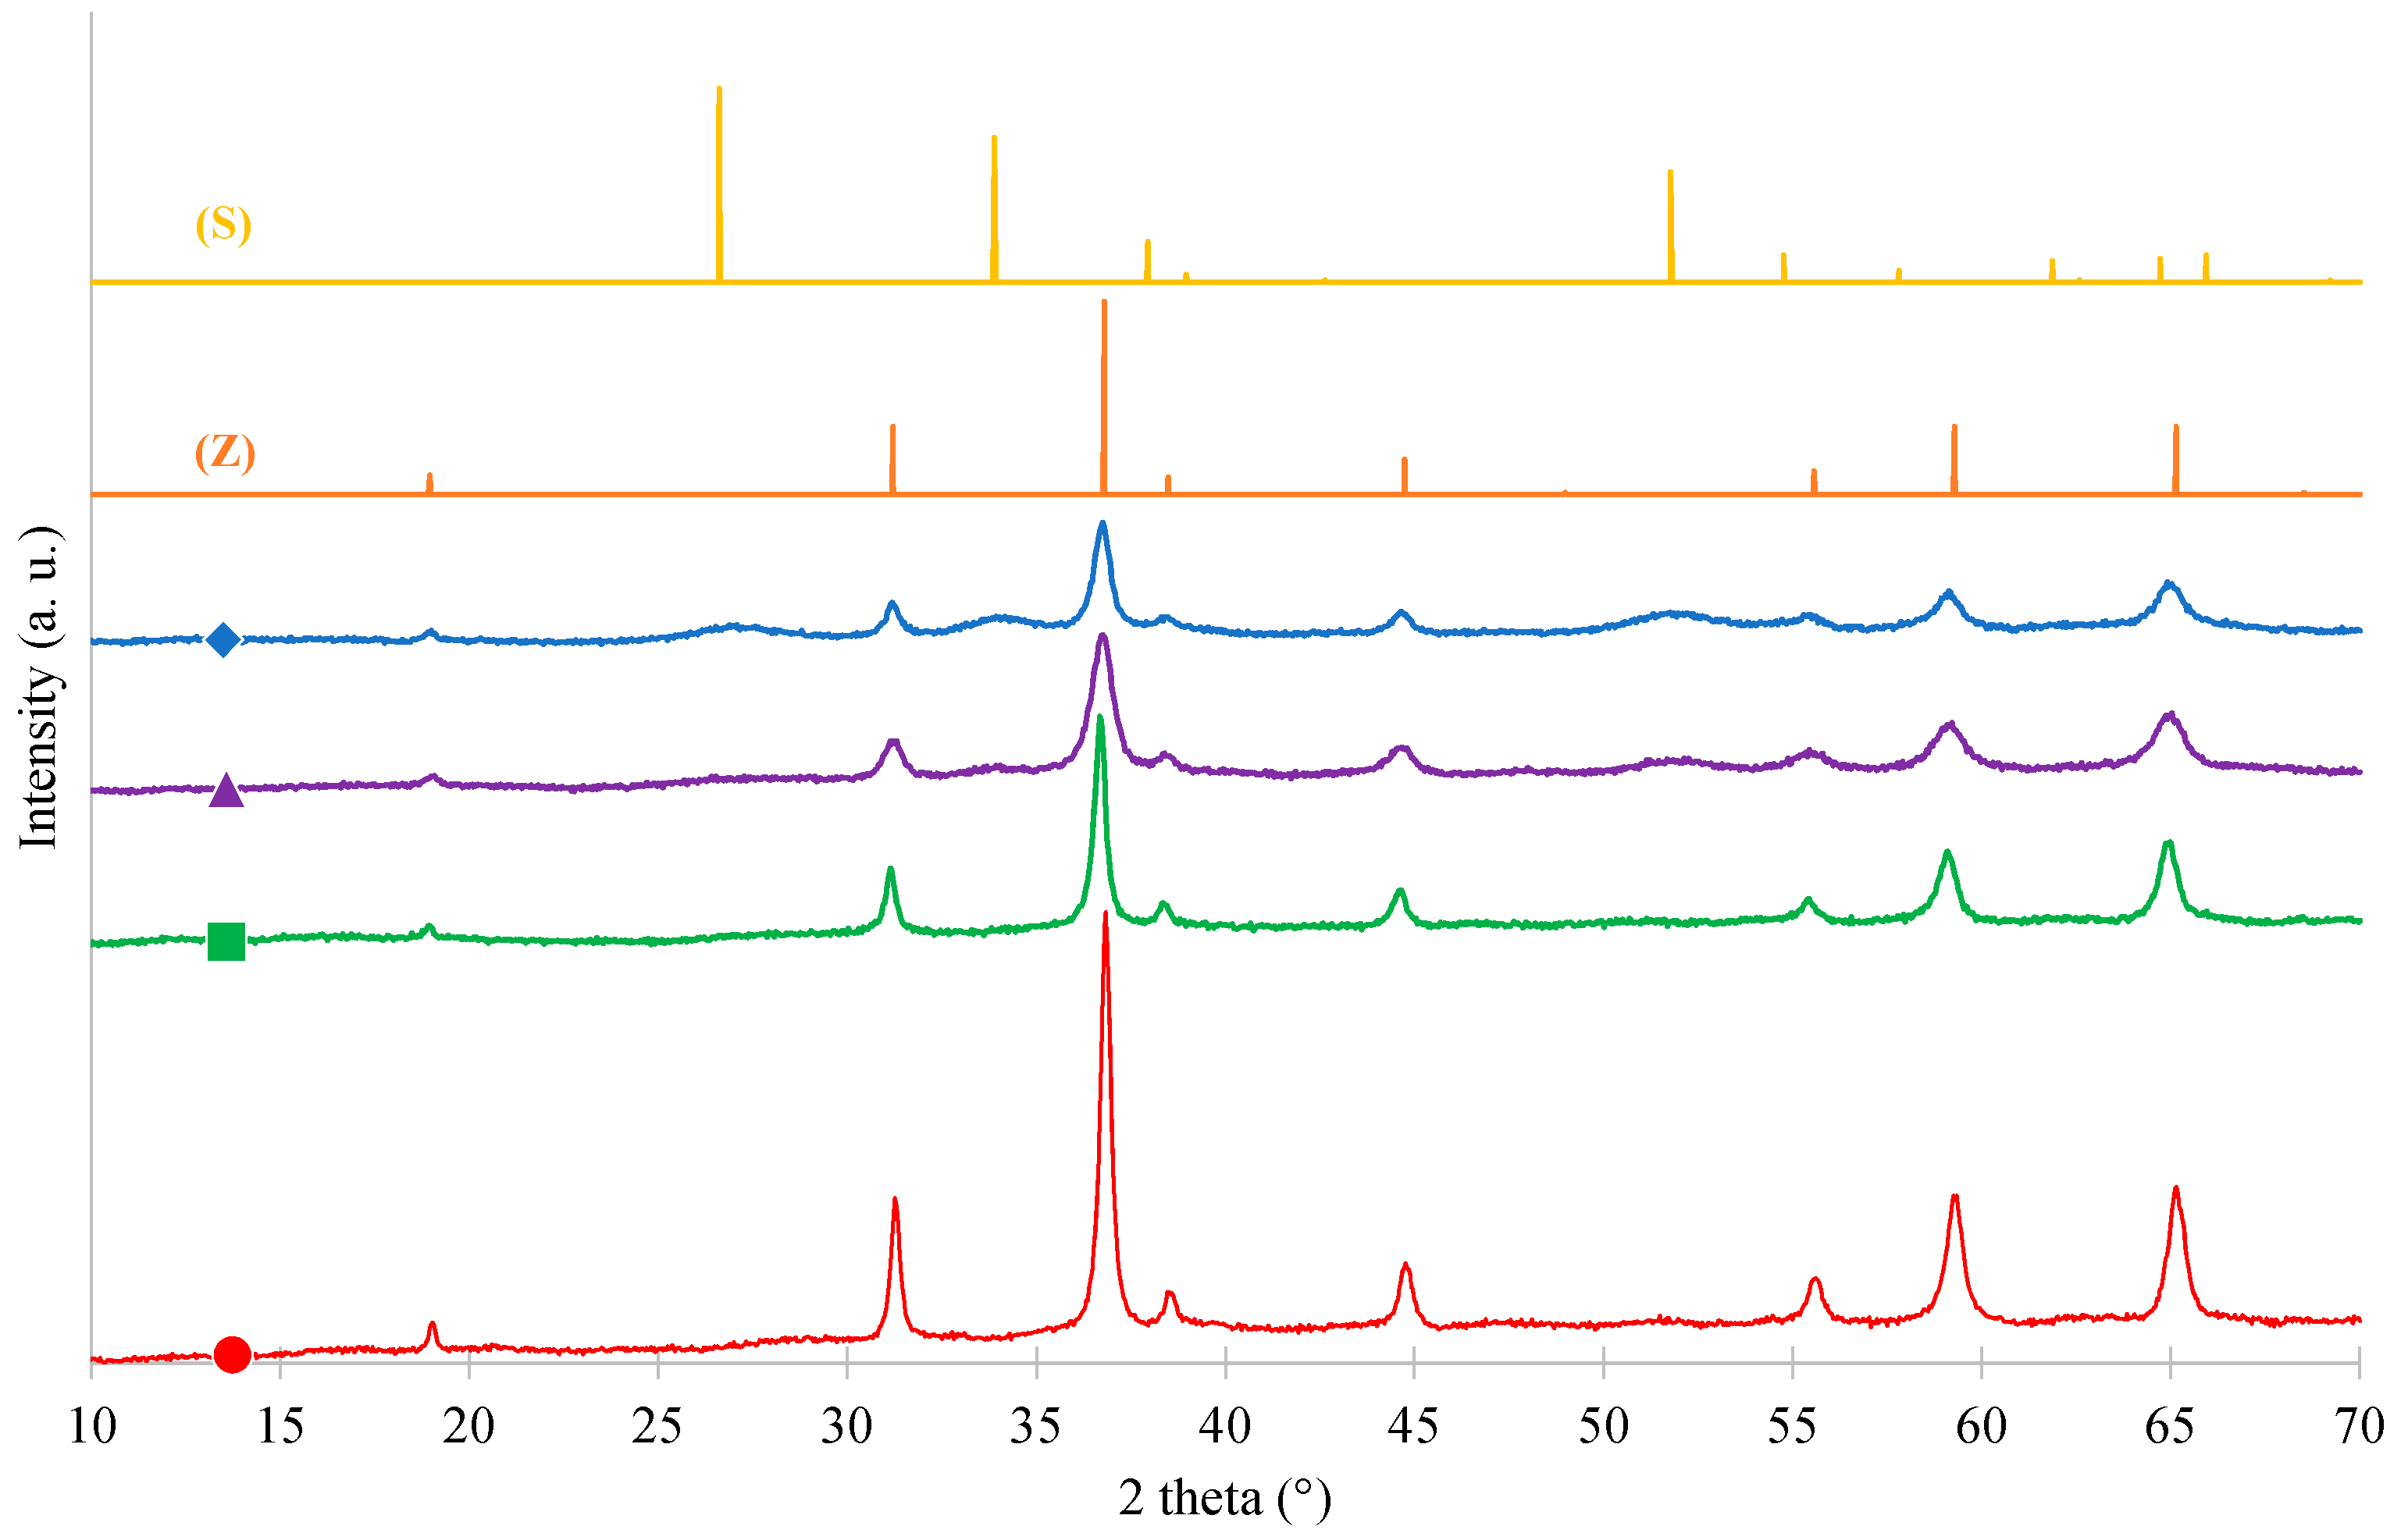
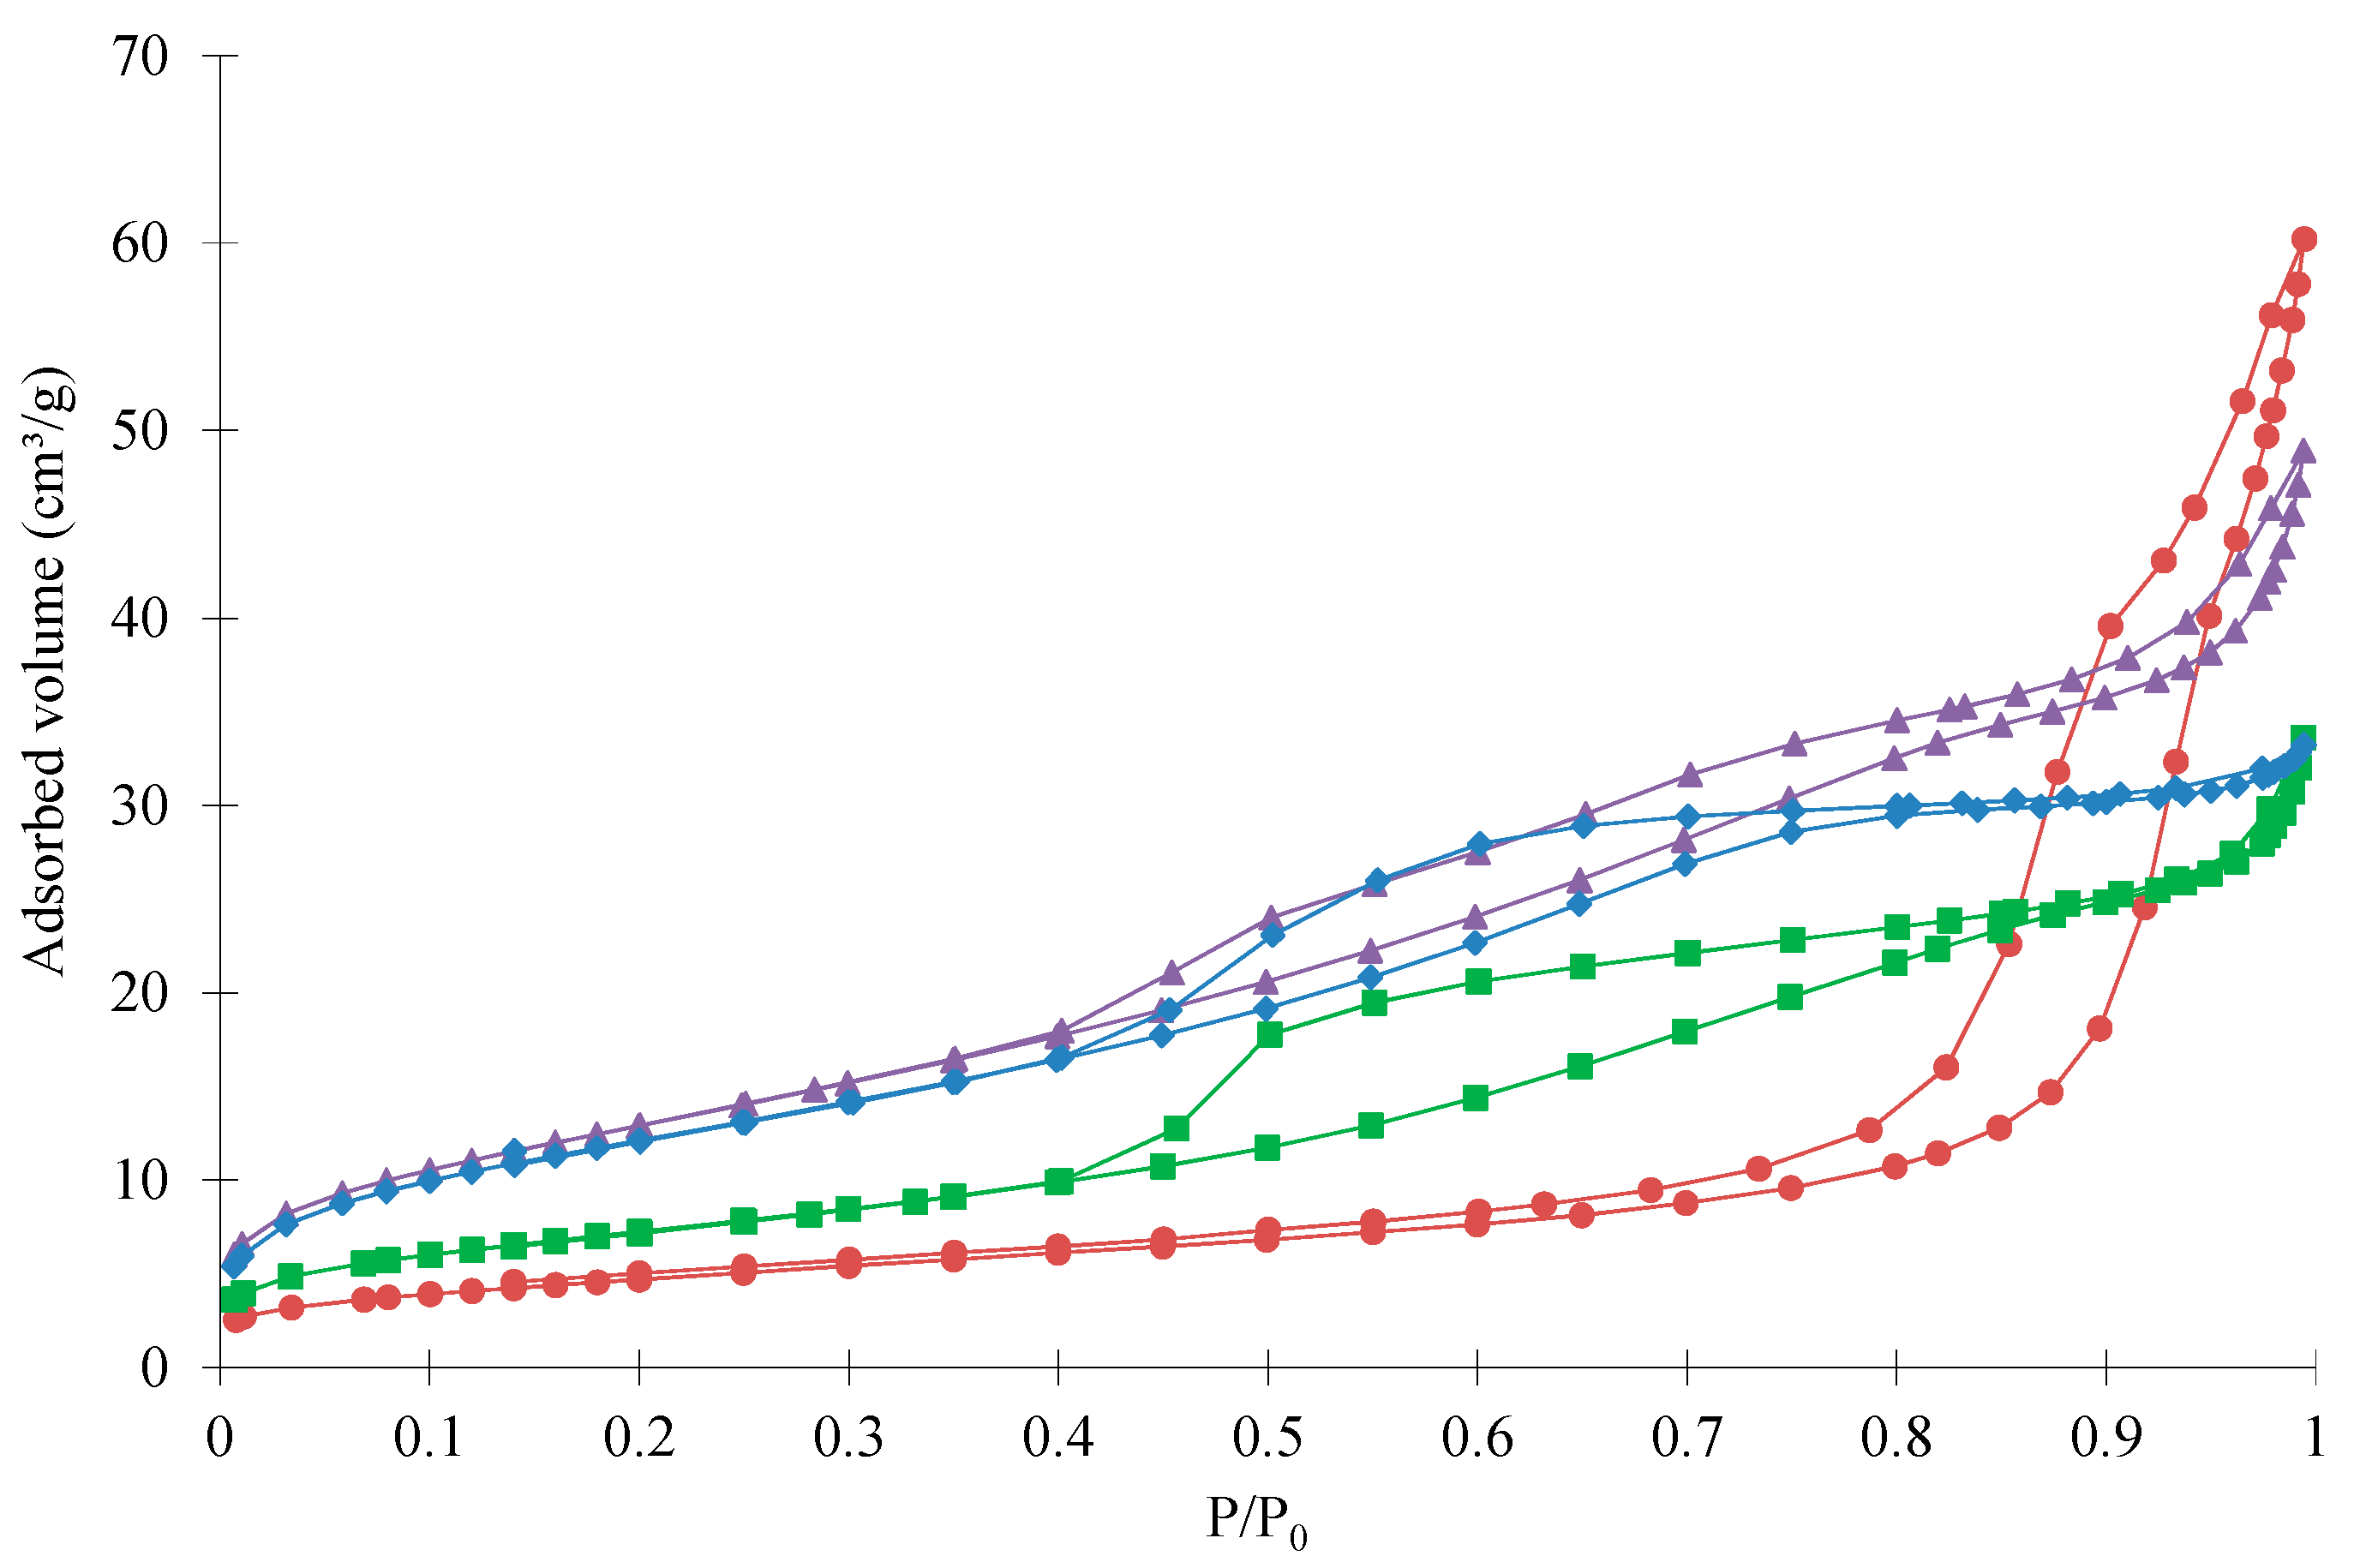
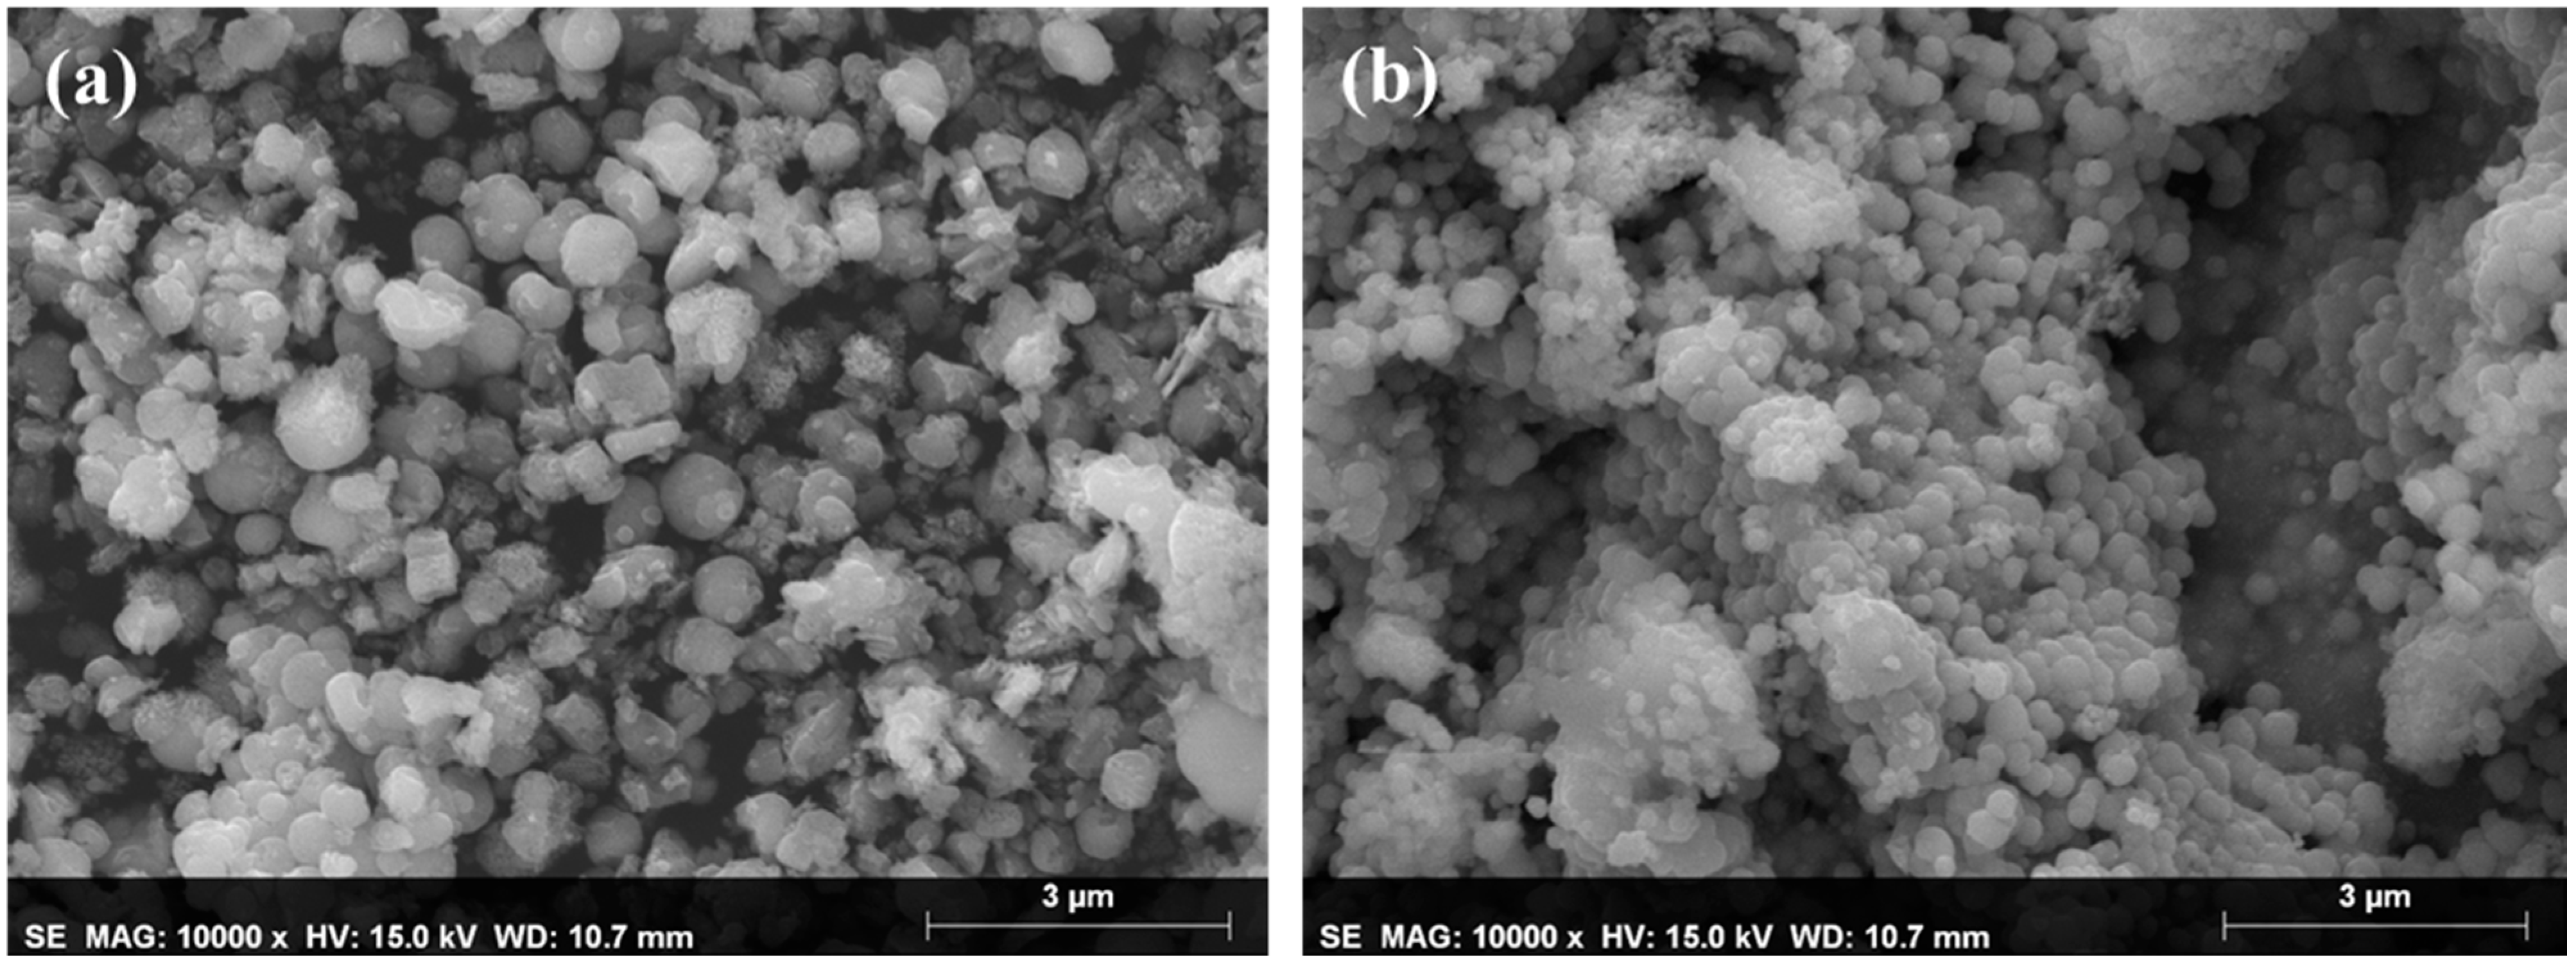
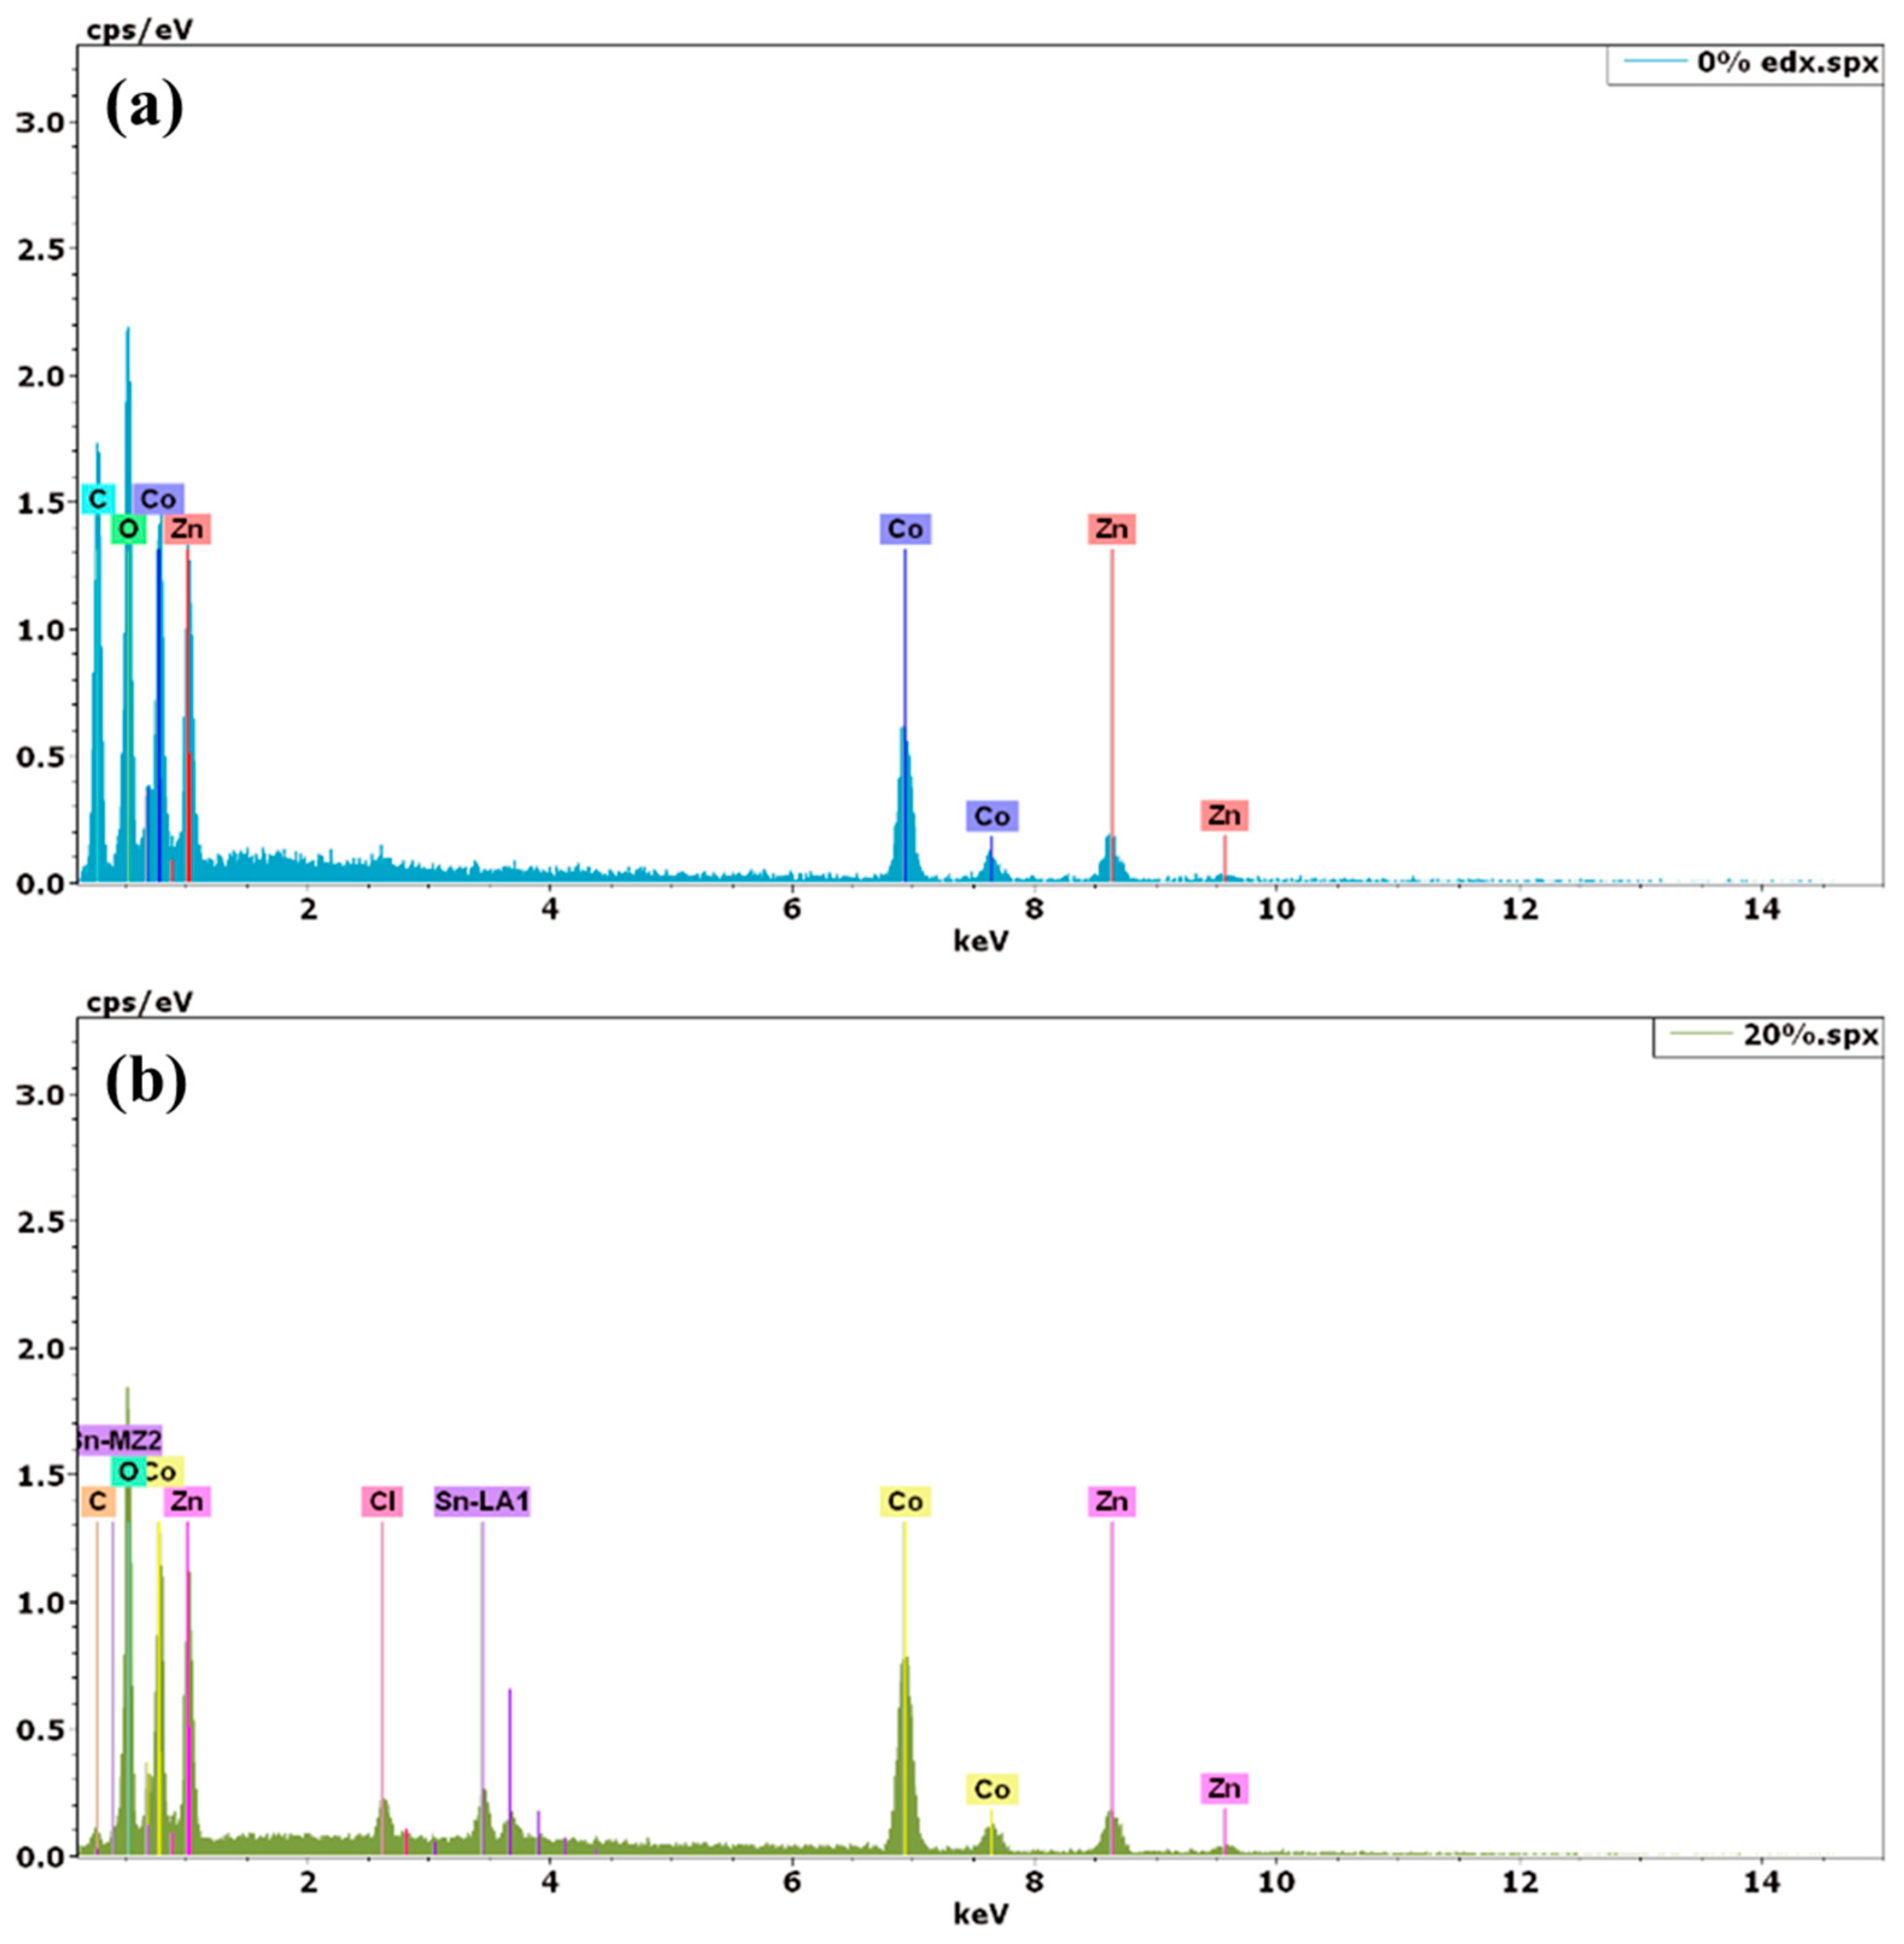
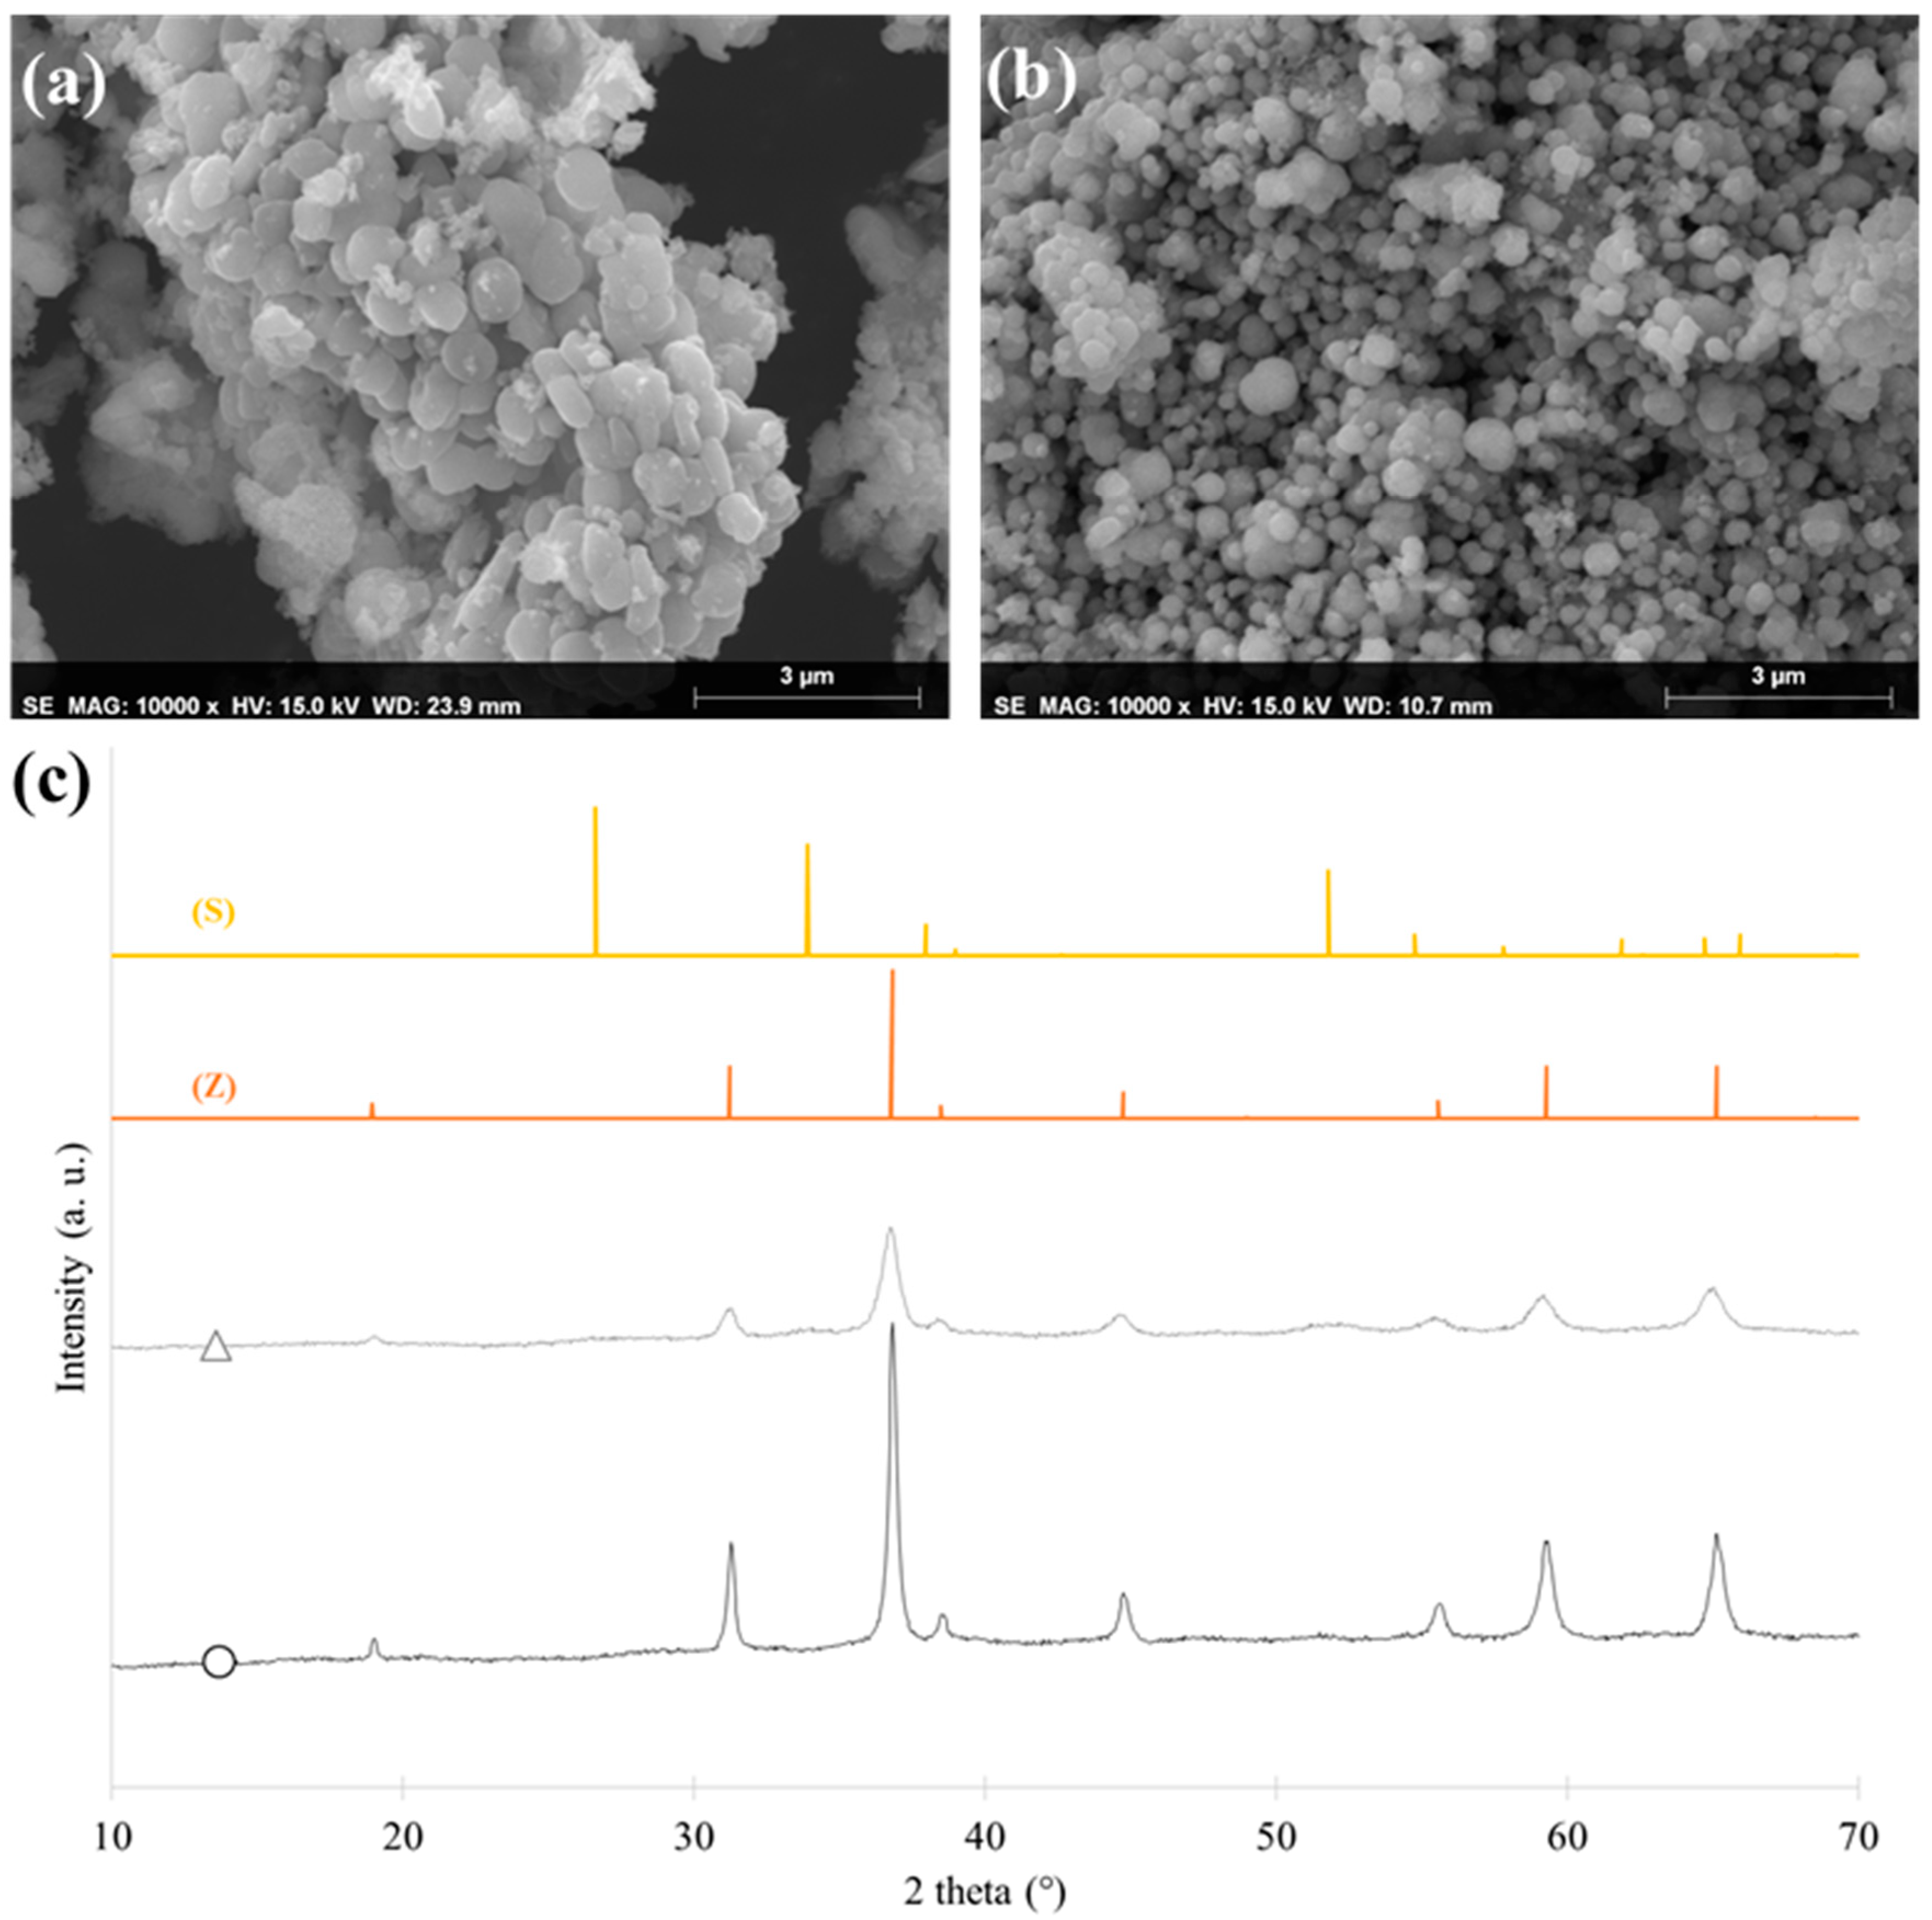
2.1. Morphology and Composition

Theoretical and actual loading of SnO2 are similar for each sample (Table 1). This means that SnO2 is fully integrated into the material and no loss occurs during the synthesis.
The XRD patterns of all samples are represented on Figure 1.
All of the diffraction peaks illustrated by the four spectra at values of 18.951°, 31.190°, 36.750°, 44.691°, 55.503°, 59.192°, and 65.050° can be assigned to (111), (220), (311), (400), (422), (511), and (440) planes of cubic spinel ZnCo2O4 (JCPDS card No. 23-1390; space group Fd3m and a = 8.10440 Å) [30]. The sharp and strong XRD peaks are indicative of a high crystallinity and high purity of the nanocrystalline samples [31]. The ZnCo2O4 crystallite size (dXRD) can be calculated with Scherrer equation (Equation (4)) with the peak at 31.190°. The different values are listed in Table 1. The crystallite size decreases (from 30 to 16 nm) when the SnO2 amount increases (from 0 to 30 wt %), as observed on Figure 1, corresponding to the decreasing peak heights with the loading percentage. The introduction of SnO2 in ZnCo2O4 matrix probably disturbs the crystallization and slows the growth rates of the crystals as observed in previous studies when dopants were added [32].
An additional diffraction peak corresponding to tetragonal rutile structure of SnO2 (JCPDS Card No: 41-1445) appears, for the loaded samples, at 2θ = 26.60° and 33.92° corresponding to the crystal planes (110) and (101) [33]. This revealed that phase segregation has occurred in the samples [34]. As expected, the intensity of SnO2 peaks increases when the amount of SnO2 increases. Nevertheless, the SnO2 crystals are smaller that ZnCo2O4 with a size around 7 nm (calculated from the peak at 26.60°) for ZnCo2O4/SnO2-30% sample.
The sample textural properties are given in Table 1 and the adsorption-desorption isotherms are represented in Figure 2. The pure ZnCo2O4 sample isotherm has a shape corresponding to a type II isotherm according to the BDDT classification [35]. Indeed, at high pressure, the adsorbed volume increases quickly (macroporous solid). This sample present also a hysteresis, which corresponds to the presence of mesopores. When the samples are loaded with SnO2, the isotherms evolve towards a mixture between types I and IV isotherms according to the BDDT classification [35]. Indeed, at low relative pressure, a sharp increase, characteristic of type I isotherm, can be observed (microporous solid). The increase at high pressure is reduced and replaced by a plateau corresponding to type IV isotherm (mesoporous solid). The hysteresis is also modified and displaced towards lower relative pressure (smaller mesopores). This shows that the pore size range evolves towards smaller pores and higher specific surface area when loaded with SnO2. Indeed, the SBET and VDR values for pure ZnCo2O4 sample are 17 m2·g−1 and 0.01 cm3·g−1, respectively, while they are 48 m2·g−1 and 0.03 cm3·g−1 for ZnCo2O4/SnO2-20%, respectively (Table 1). The ZnCo2O4/SnO2-20% sample has the highest specific surface area, which indicates that 20 wt % of SnO2 could be an optimal value. This result is confirmed by the photocatalytic experiment in Section 3.3.
The morphology of the powders synthesized and calcined at 450 °C was studied by scanning electron microscopy. Figure 3 illustrates the SEM micrographs of pure ZnCo2O4 and ZnCo2O4/SnO2-20% powders. The images clearly show that the particles have a generally spherical shape with irregular size distribution due to agglomerate formation. The sample particles are in the nanometric range, which supports the results obtained by XRD (dXRD). The particle size is bigger for the pure ZnCo2O4 sample than the ZnCo2O4/SnO2-20% one. It is in agreement with the crystallite size measured with XRD (Table 1).
In order to confirm the formation of the materials on the one hand and the effective presence of SnO2 in the SnO2/ZnCo2O4 nanomaterial on the other hand, an elemental analysis by EDX was also performed and represented in Figure 4. As shown in the spectra, the main elements (cobalt, zinc, and oxygen) are present in addition to tin in the ZnCo2O4/SnO2-20% sample (Figure 4 right). The analysis also shows the presence of a small amount of carbon (C) and chlorine (Cl) bound mainly due to the precursors used in the synthesis.
Infrared characterization, FTIR, was carried out to verify the existence of the spinel structure in the prepared photocatalysts. The spinel structure oxides have two distinct bands in the wavenumber range between 400 and 700 cm−1. FTIR spectra presented in Figure 5 for all samples, show the presence of two strong peaks at 660 and 570 cm−1 resulting from M–O stretching modes for the tetrahedral coordination of Zn and M–O vibrational mode for the octahedrally coordinated Co ions, respectively, which confirms the formation of the spinel structure [36,37,38]. The introduction of SnO2 seems to disturb the spinel matrix as the band at 570 cm−1 is modified with the SnO2 increase. A peak appears in the region in the range of 440–560 cm−1 which can indicate the presence of SnO2 and can correspond to O–Sn–O and Sn–O stretching vibration modes [39]. For wavenumbers higher than 1000, the four signals were flat.
Figure 6 shows the XPS spectra for pure ZnCo2O4 and ZnCo2O4/SnO2-20% which was representative of all samples modified by SnO2. Figure 6a represent the spectra of the Zn 2p with Zn 2p3/2 and Zn 2p1/2 located around 1021.1 eV and 1044.1 eV for pure ZnCo2O4 and 1021.3 eV and 1044.3 eV for ZnCo2O4/SnO2-20%. The sharp peaks correspond to the bivalent zinc ions [16,40]. The oxidation state of the Zn in ZnCo2O4 is further confirmed by the Auger parameter which is equal to 2011.2 eV [41]. Unfortunately, the Auger parameter in the ZnCo2O4/SnO2-20% cannot be calculated due to interference of the Sn3d peak with the Zn Auger line.
Concerning Co, (Figure 6b), three peaks were found around 779.7 eV, 789.4, 794.6 eV, and 805.0 eV and were similar for all samples. The peaks at 779.7 eV and 794.6 eV correspond to the Co 2p3/2 and Co 2p1/2 [16] and can be attributed to Co3+ ions in octahedral sites [16,42]. This signal is similar to the standard signal of Co3O4 [43], but also to that of ZnCo2O4, as both compounds are hard to distinguish by XPS technique. The satellite peaks located at around 789.5 eV and 805 eV further confirm that cobalt’s oxidation number is +3 and not +2 [44].
The O 1s signal was represented on Figure 6c and was typical for the metal-oxygen framework [45,46]. The modification of the overall shape of the O 1s signal (Figure 6c) is due to a different binding energy for the oxygen atom in the SnO2 structure compared to the ZnCo2O4 structure. The former binding energy is 530.6 eV [47], slightly higher than the latter, as Figure 6c shows.
Concerning the Sn signal (Figure 6d), two peaks were observed around 486.9 eV and 495.4 eV in all modified samples corresponding to Sn4+ [48] which is characteristic of SnO2. This is confirmed by the Auger parameter value of 919.2 eV which is correspond to SnO2.
Thus, we know that all elements are in their expected oxidation state and chemical environment.

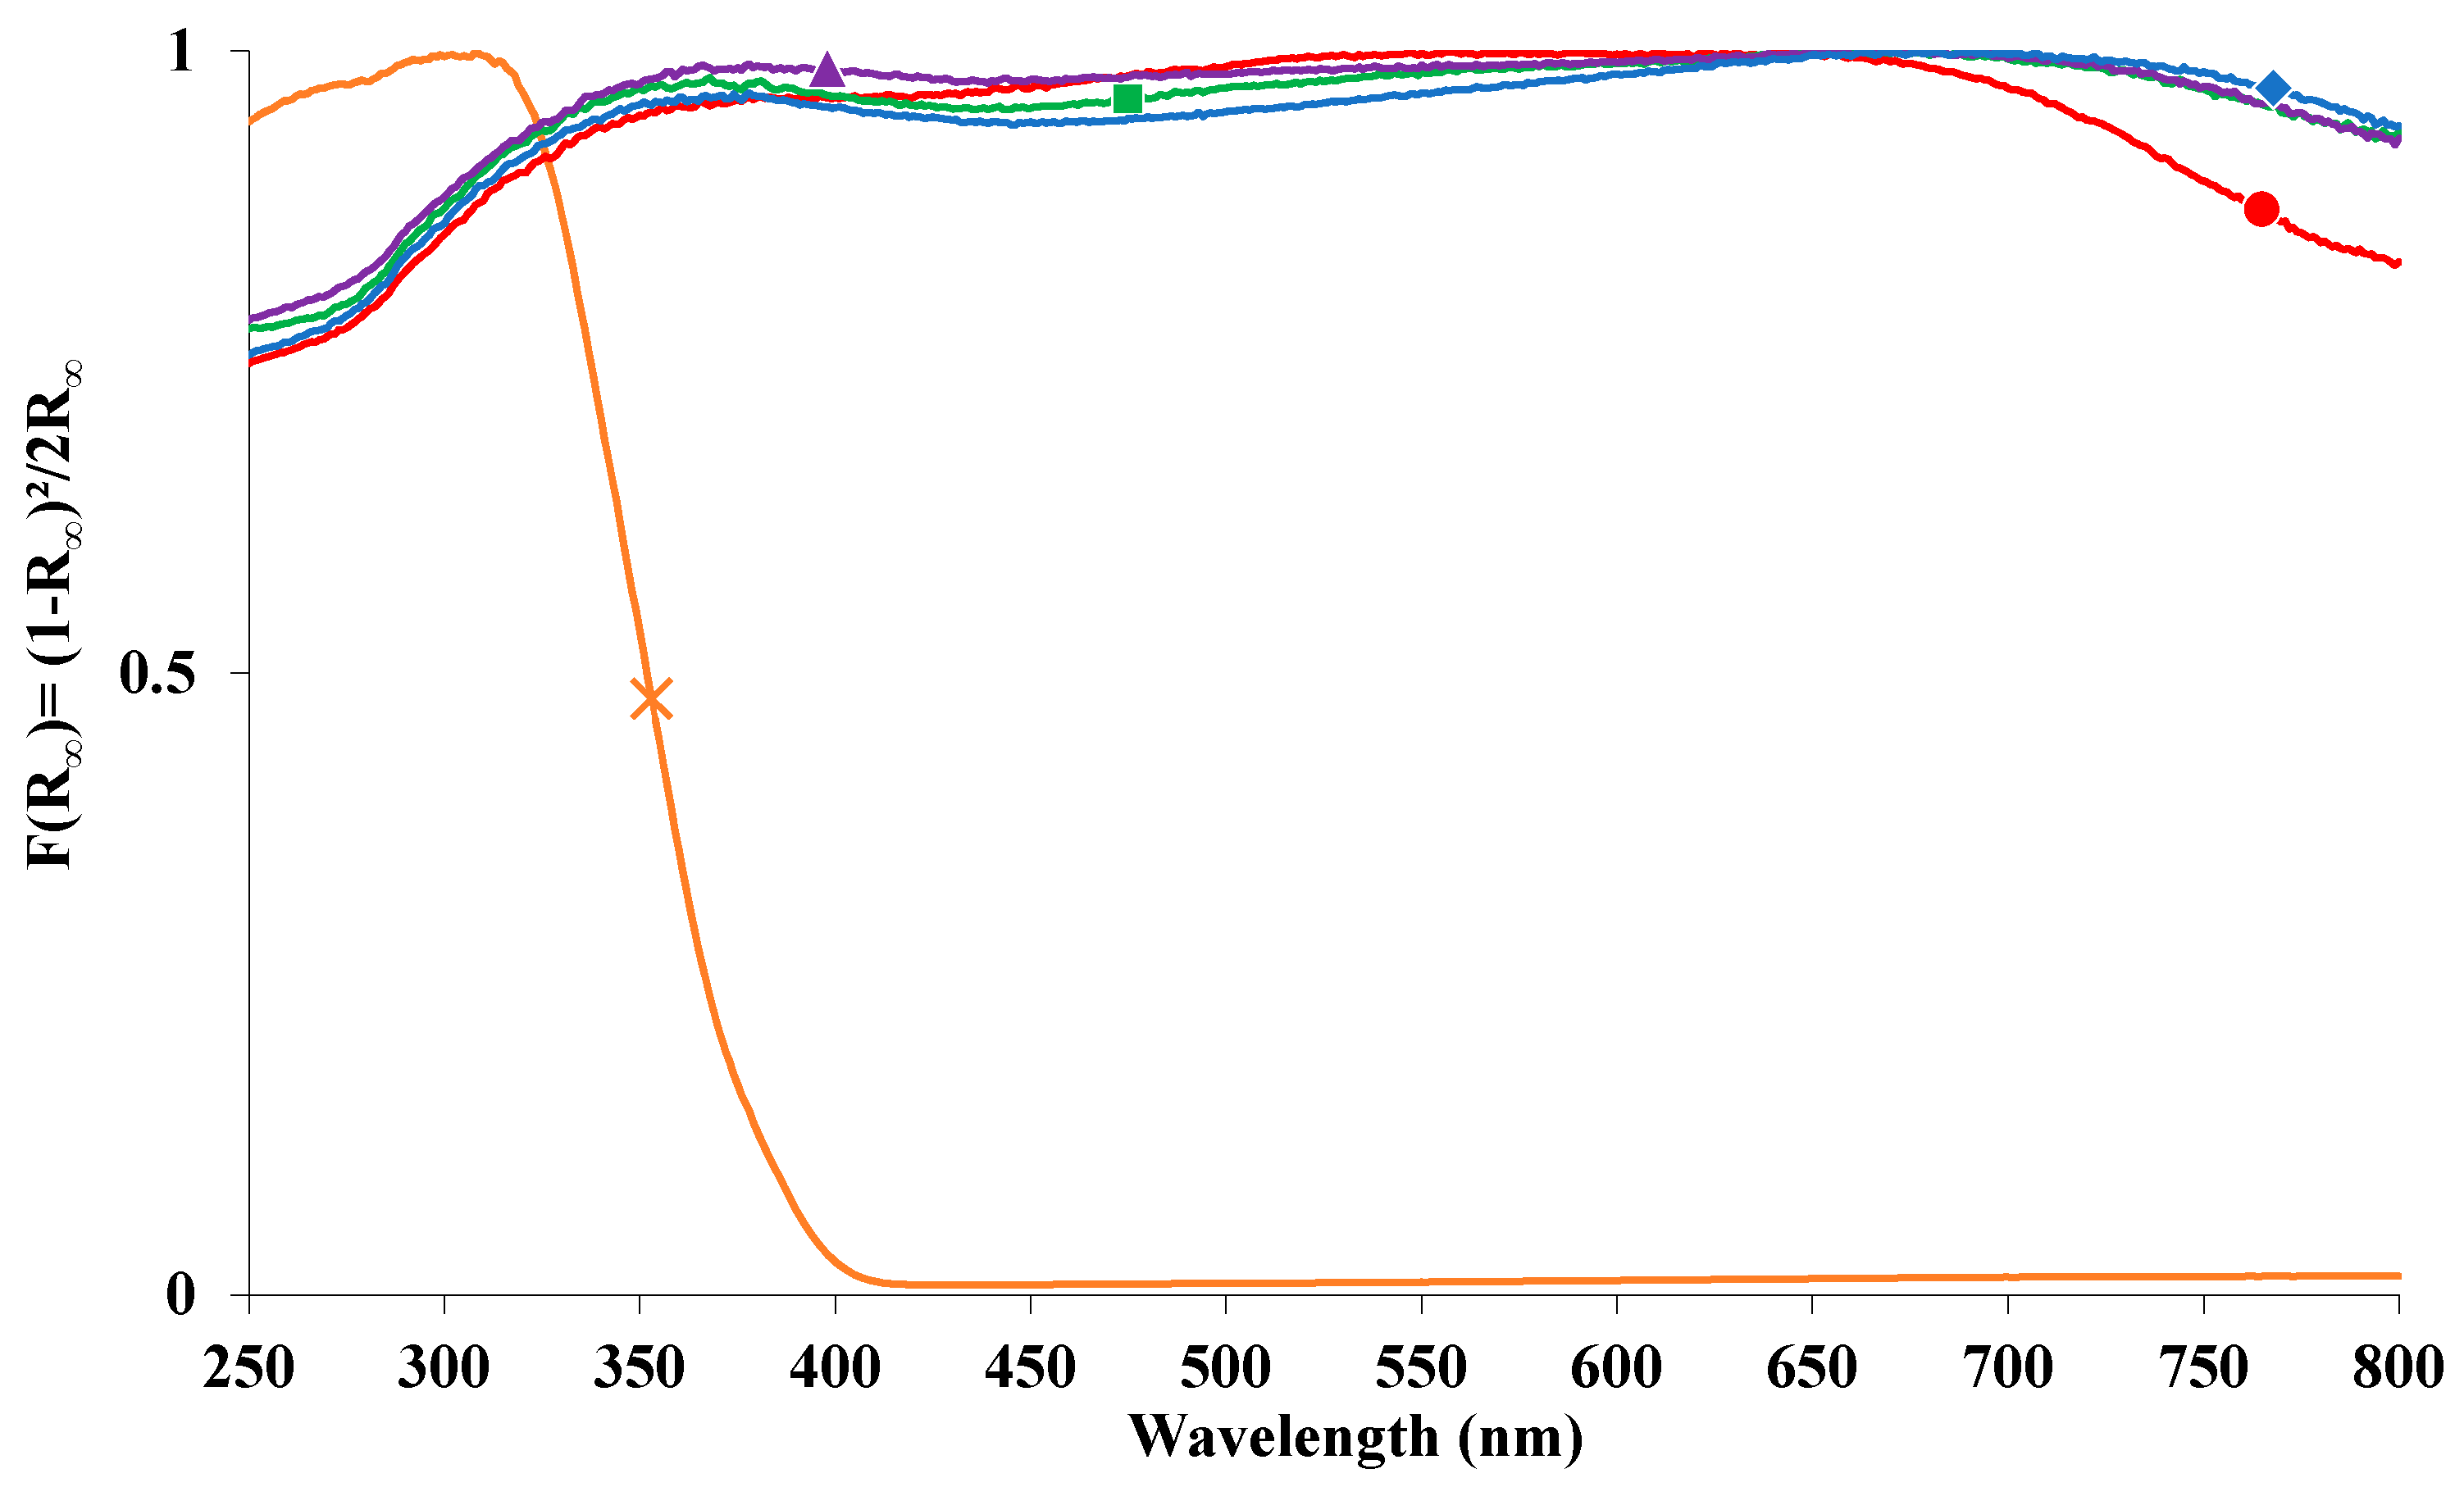
2.2. Optical Properties

The modification of the ZnCo2O4 structure and the variation of its optical properties due to the incorporation of tin dioxide were followed by UV–Vis absorption spectroscopy whose objective is the determination of band gap energies. The normalized absorption spectra obtained are shown in Figure 7. As described in [13,16], the absorption range of all ZnCo2O4 materials are in the range of 250–800 nm. Absorption in visible is well observed and so, a photoactivity with this type of illumination is expected (see Section 3.3). Due to the large absorption, it is not possible to determine a band gap value with the classical method (i.e., Kubelka-Monk functions). For comparison, the spectrum of Evonik P25 is measured (Figure 7). For this material, no absorption in visible range is observed. The photoactivity is thus expected to be lower than the ZnCo2O4 materials (see Section 3.3). The direct and indirect band gap values for P25 are 3.42 and 2.99 eV, respectively, as previously reported [28,49].

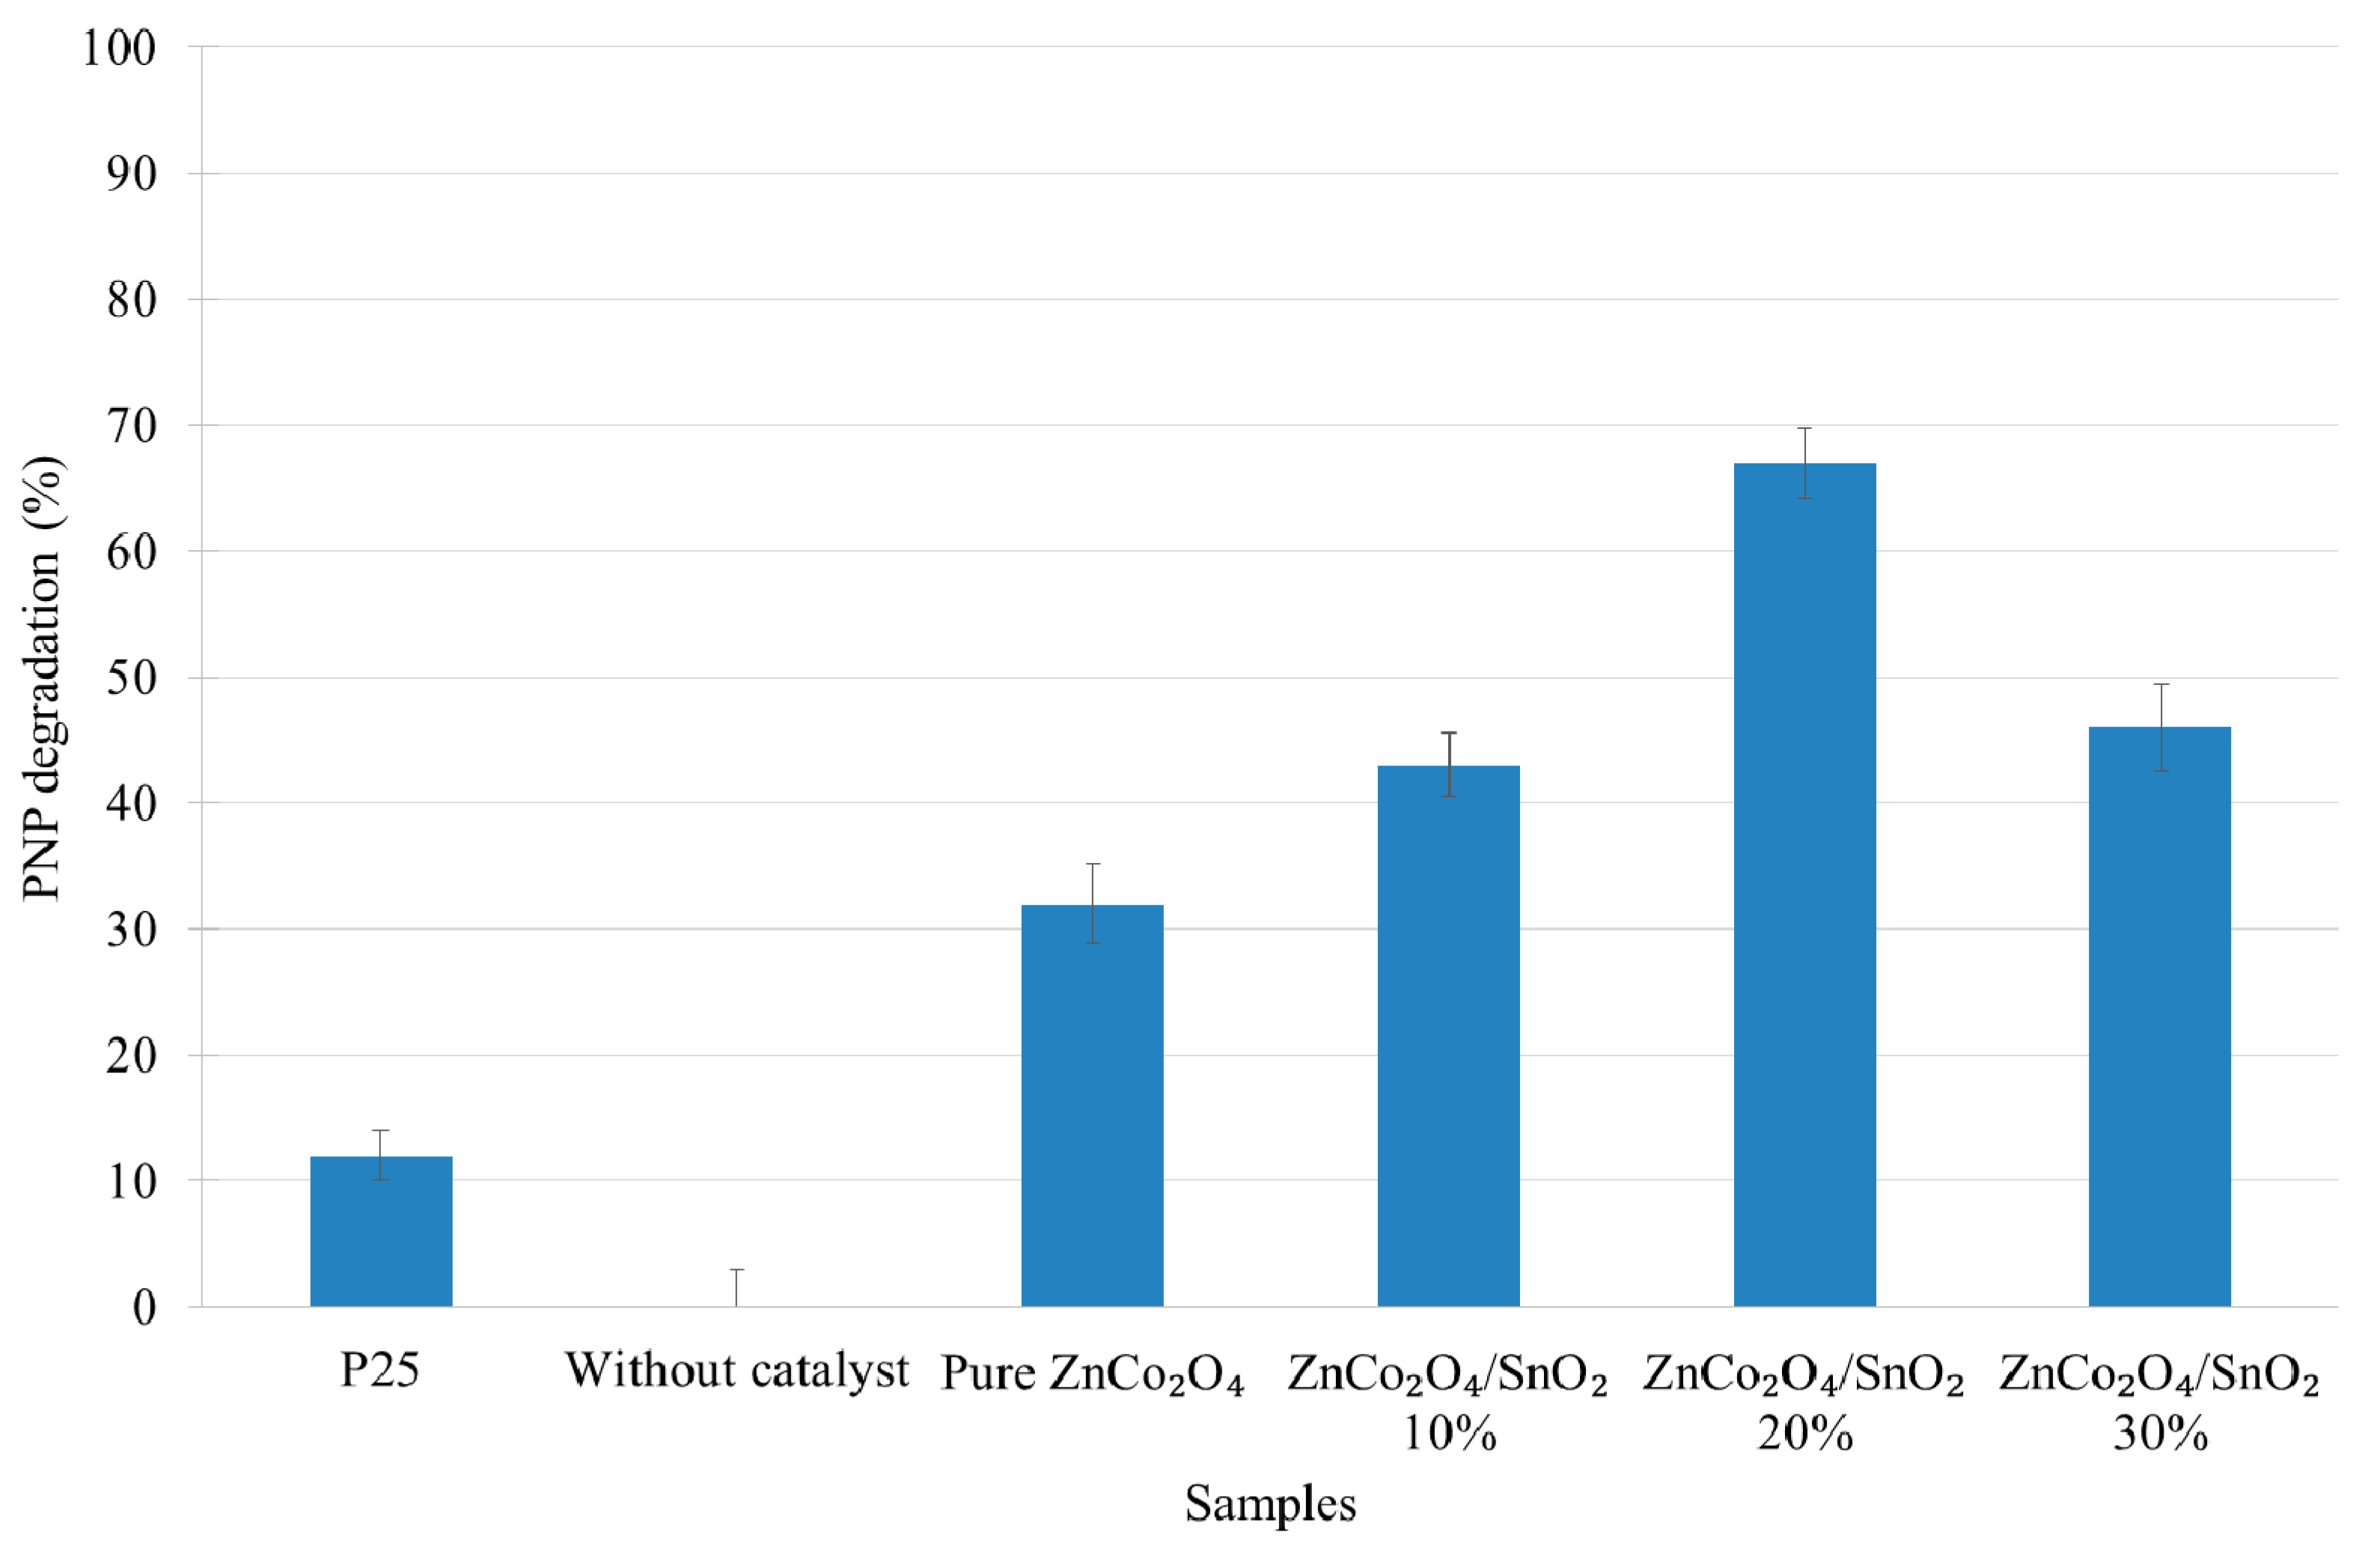
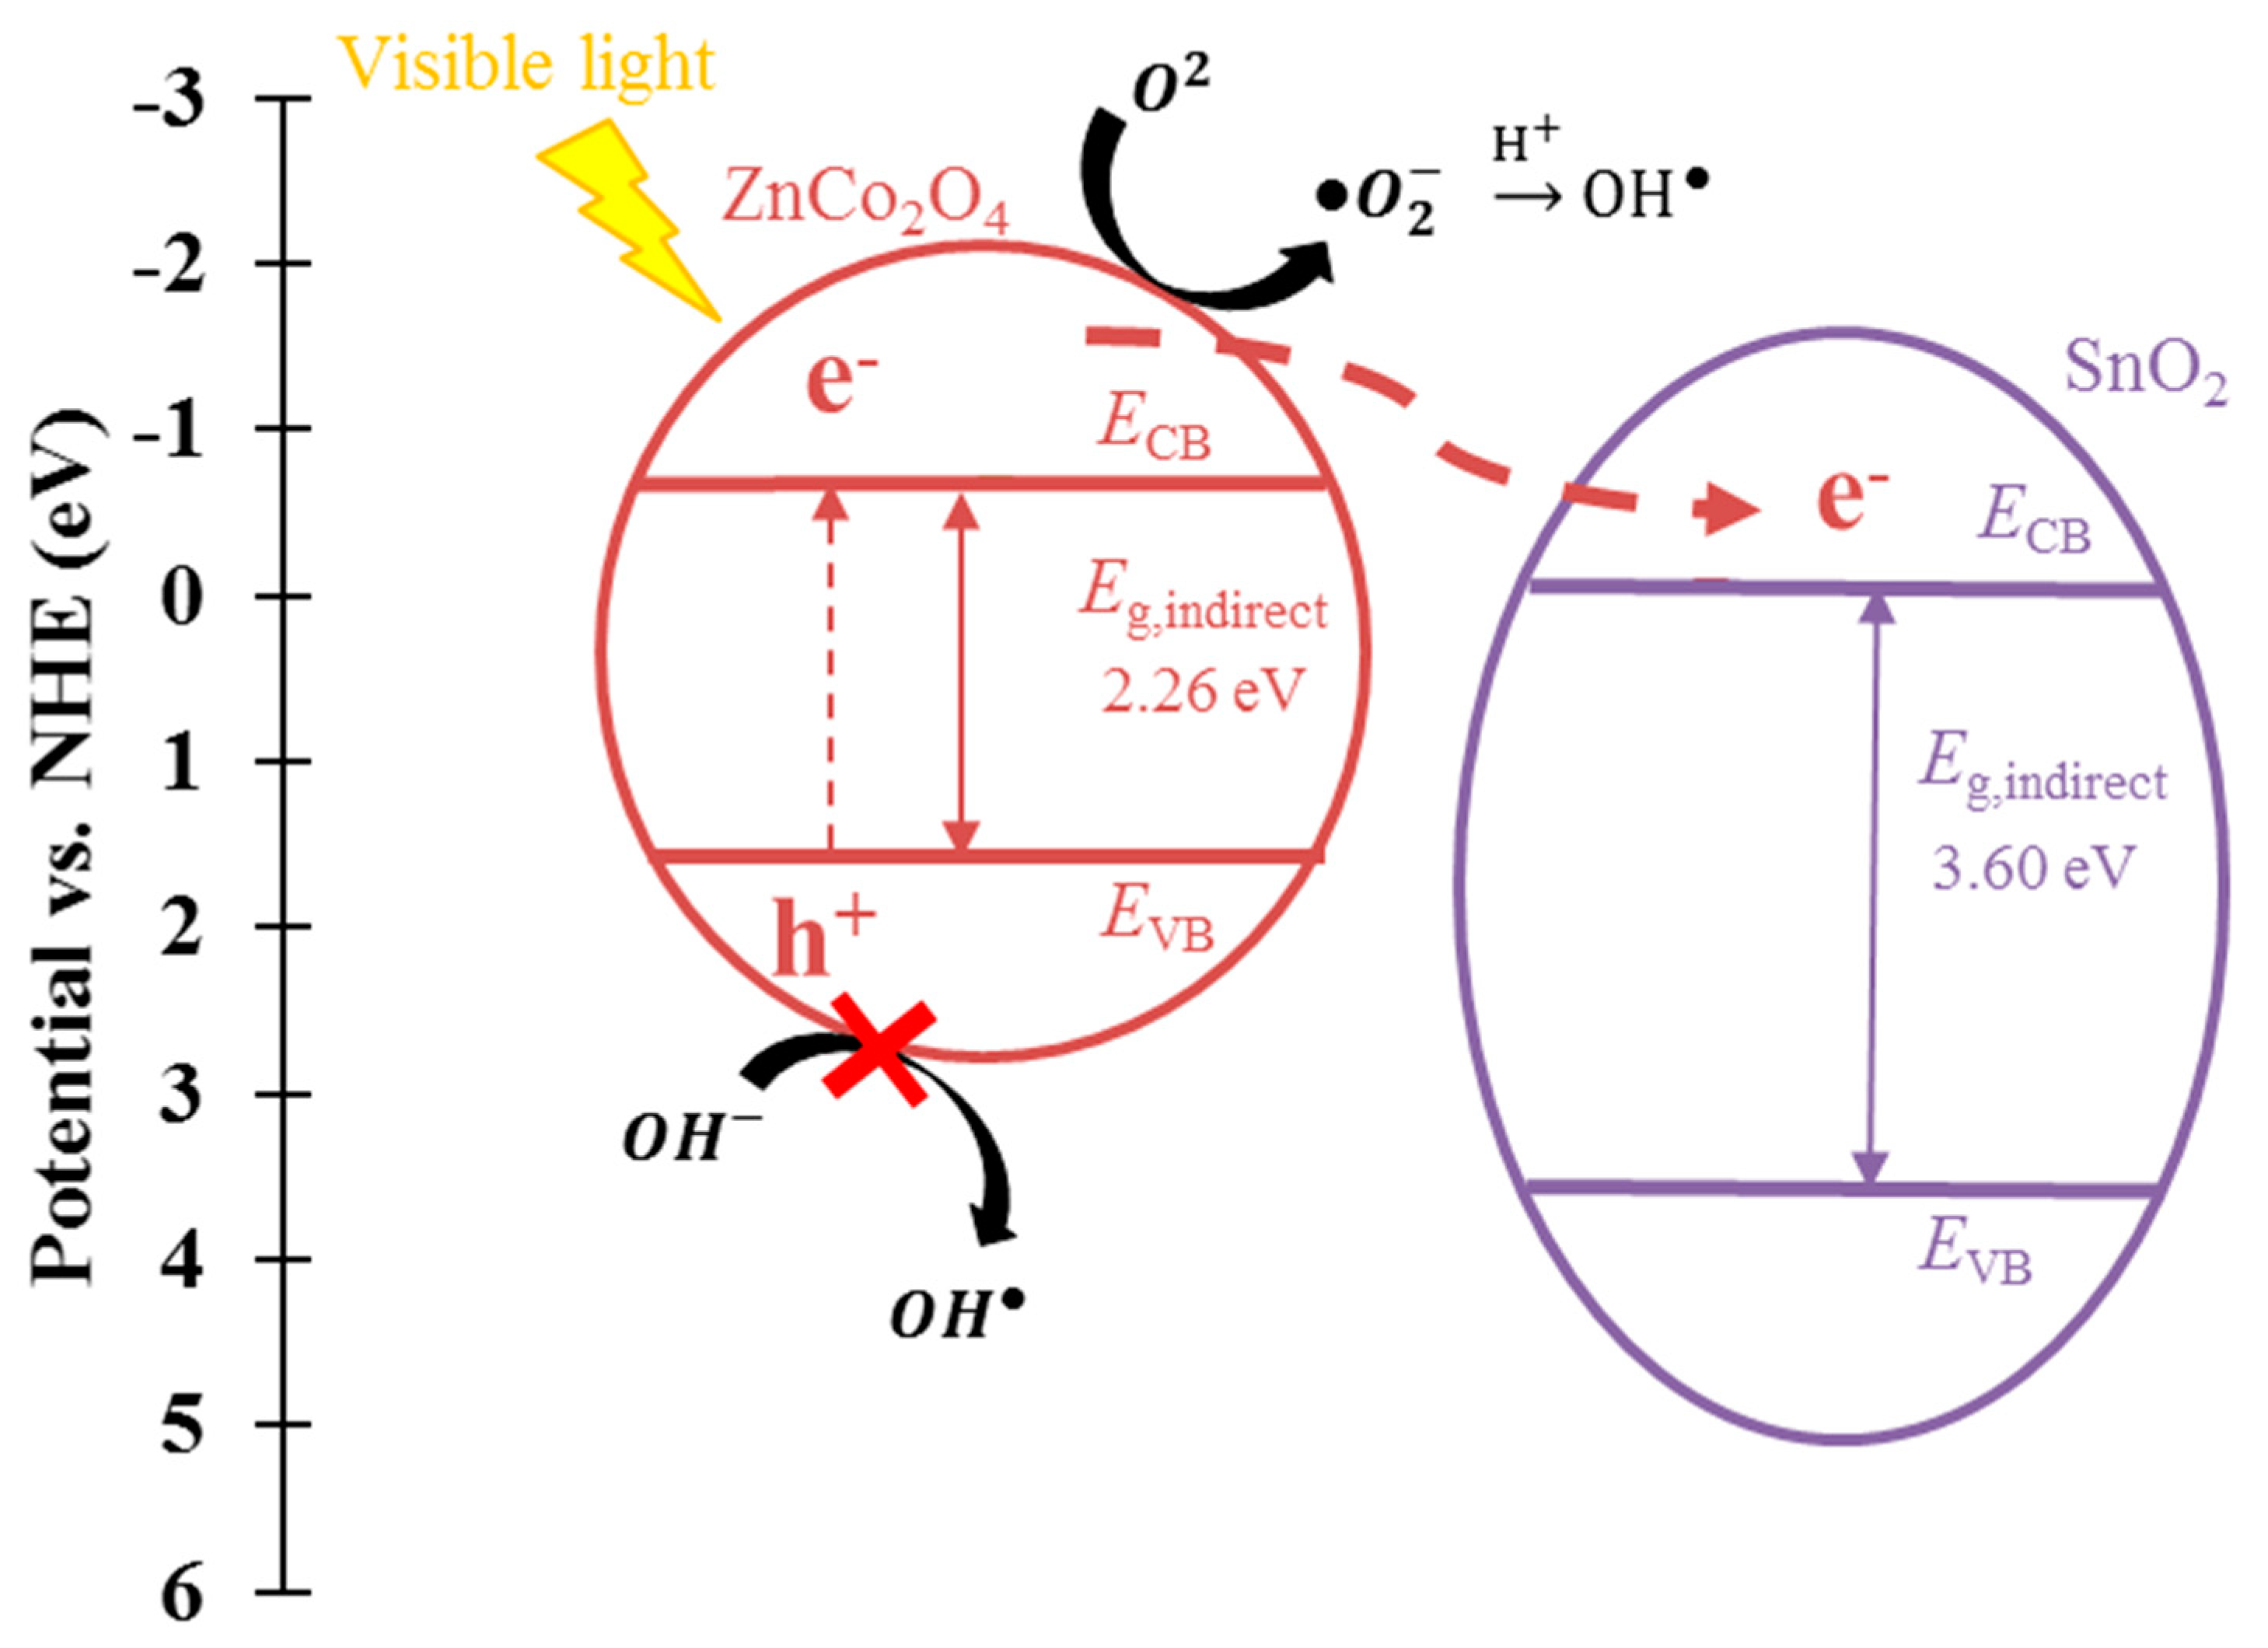
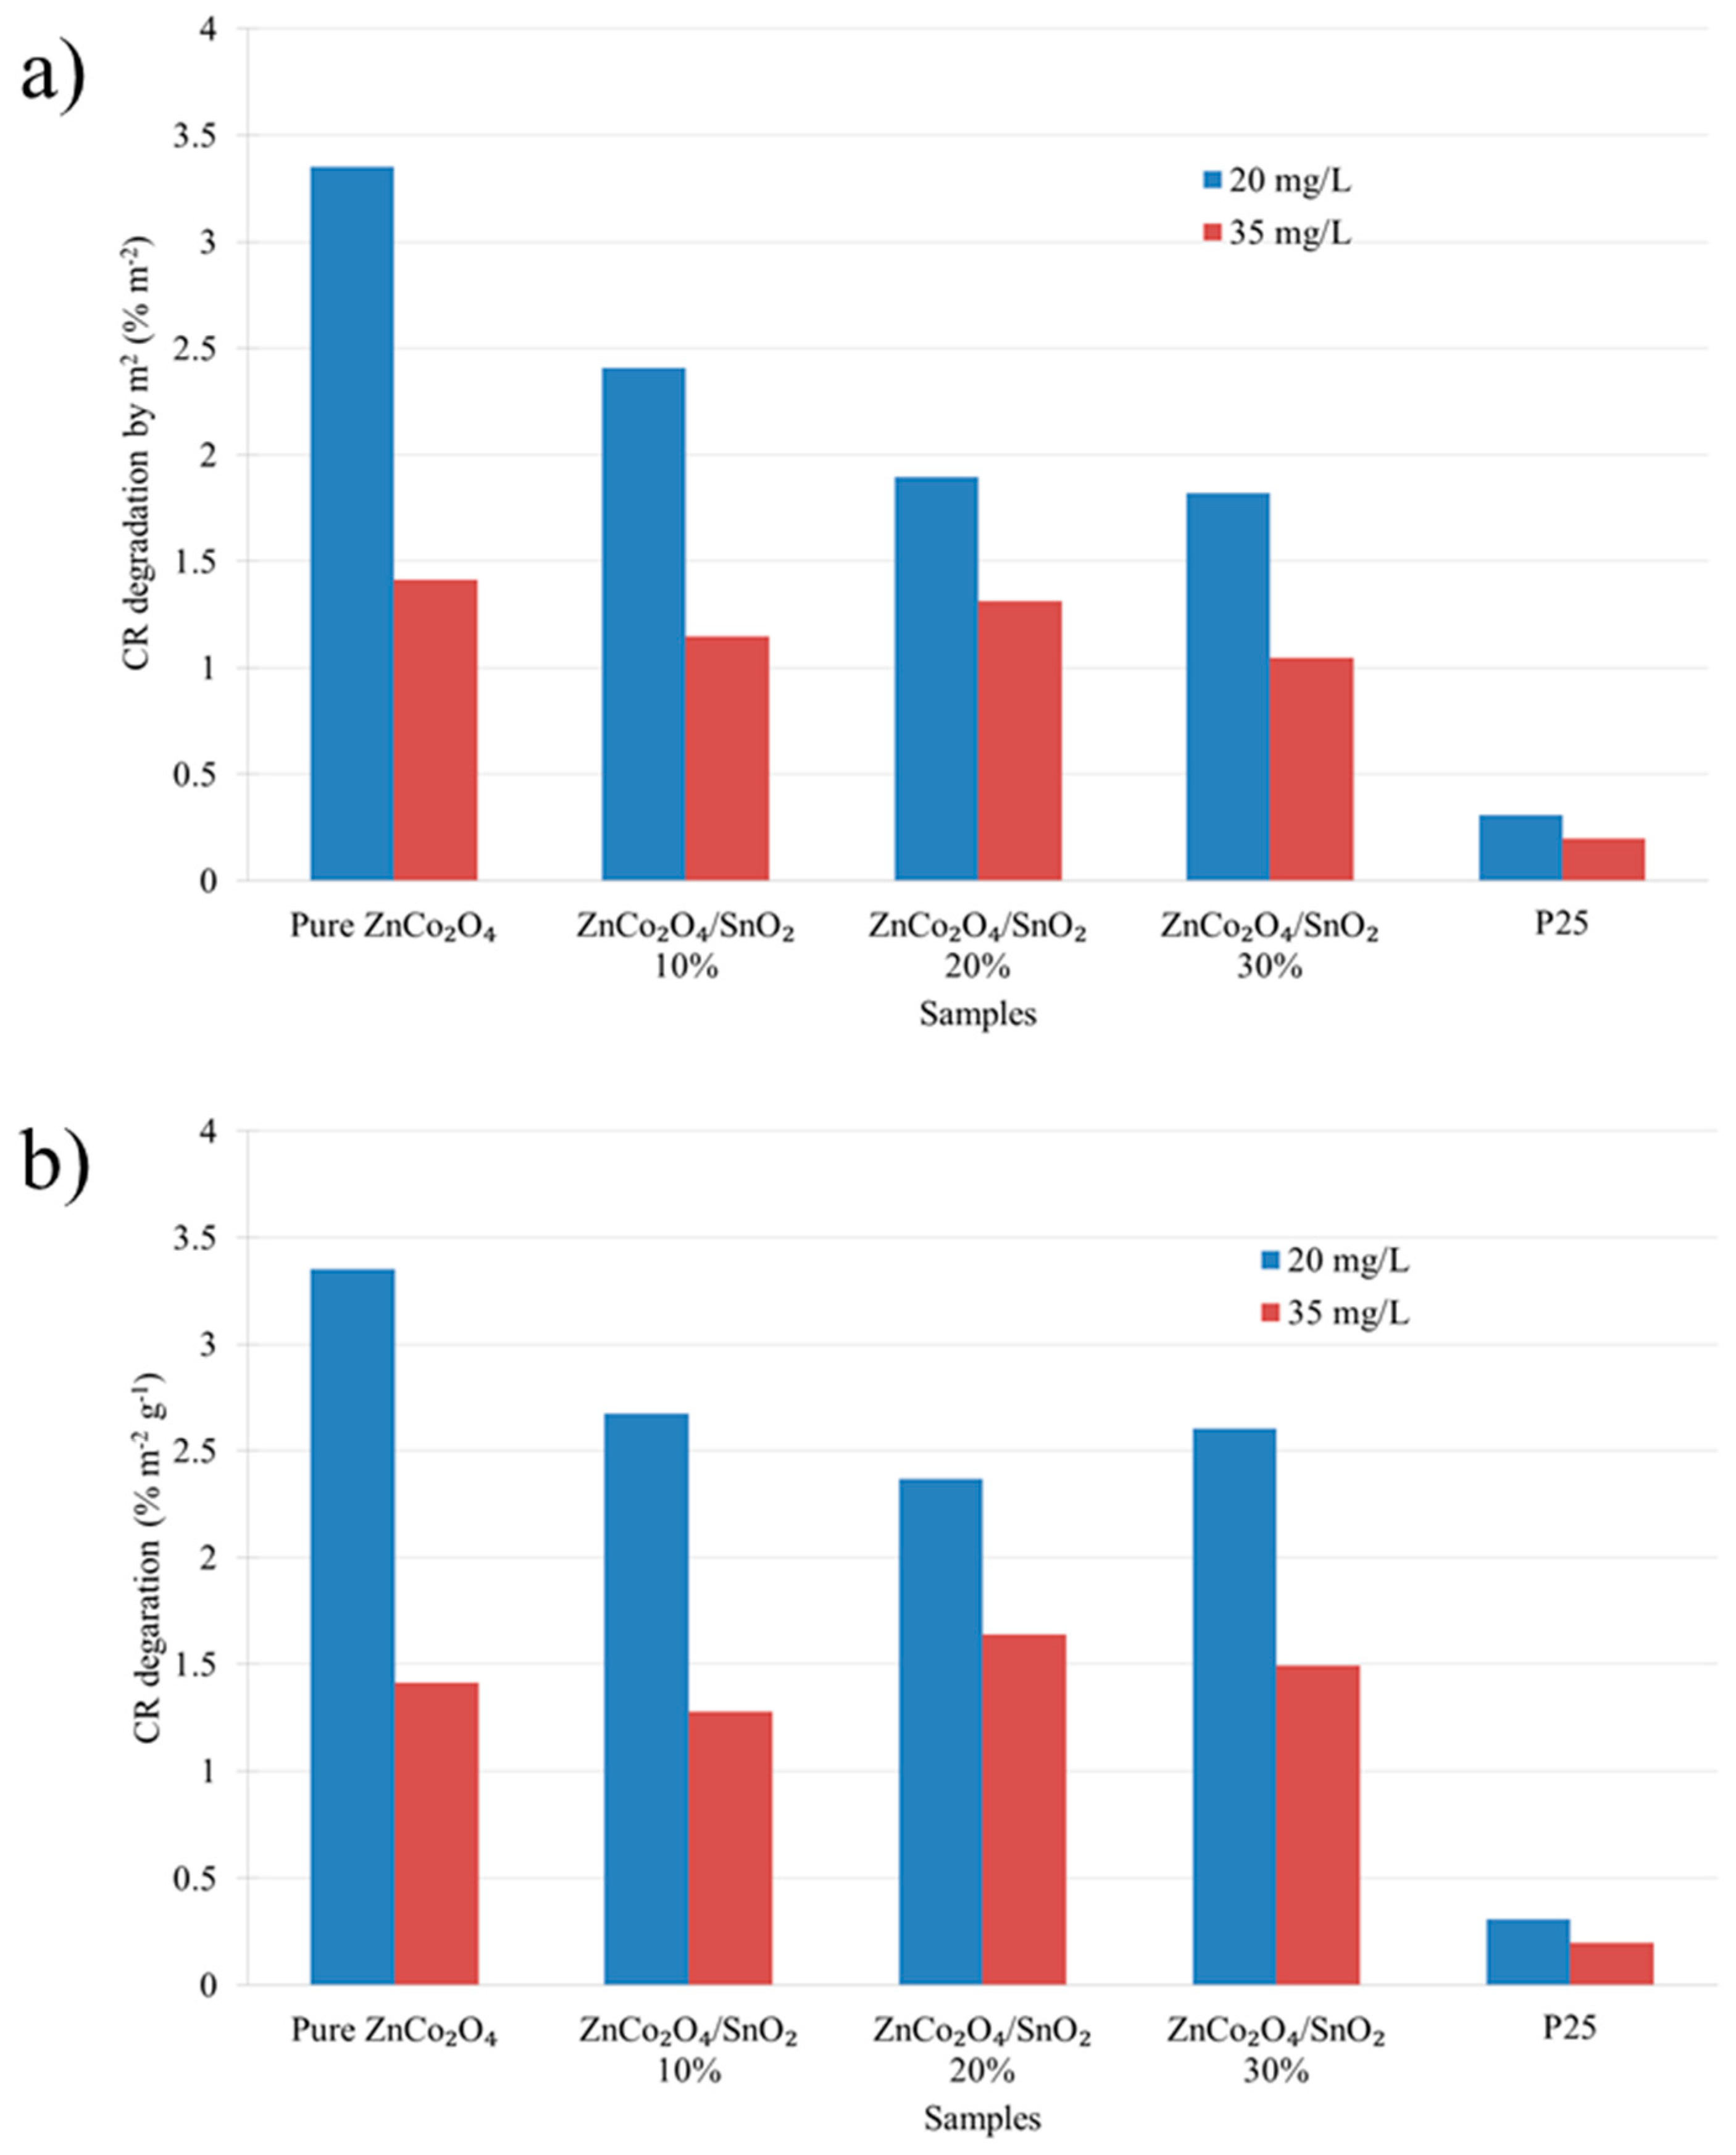
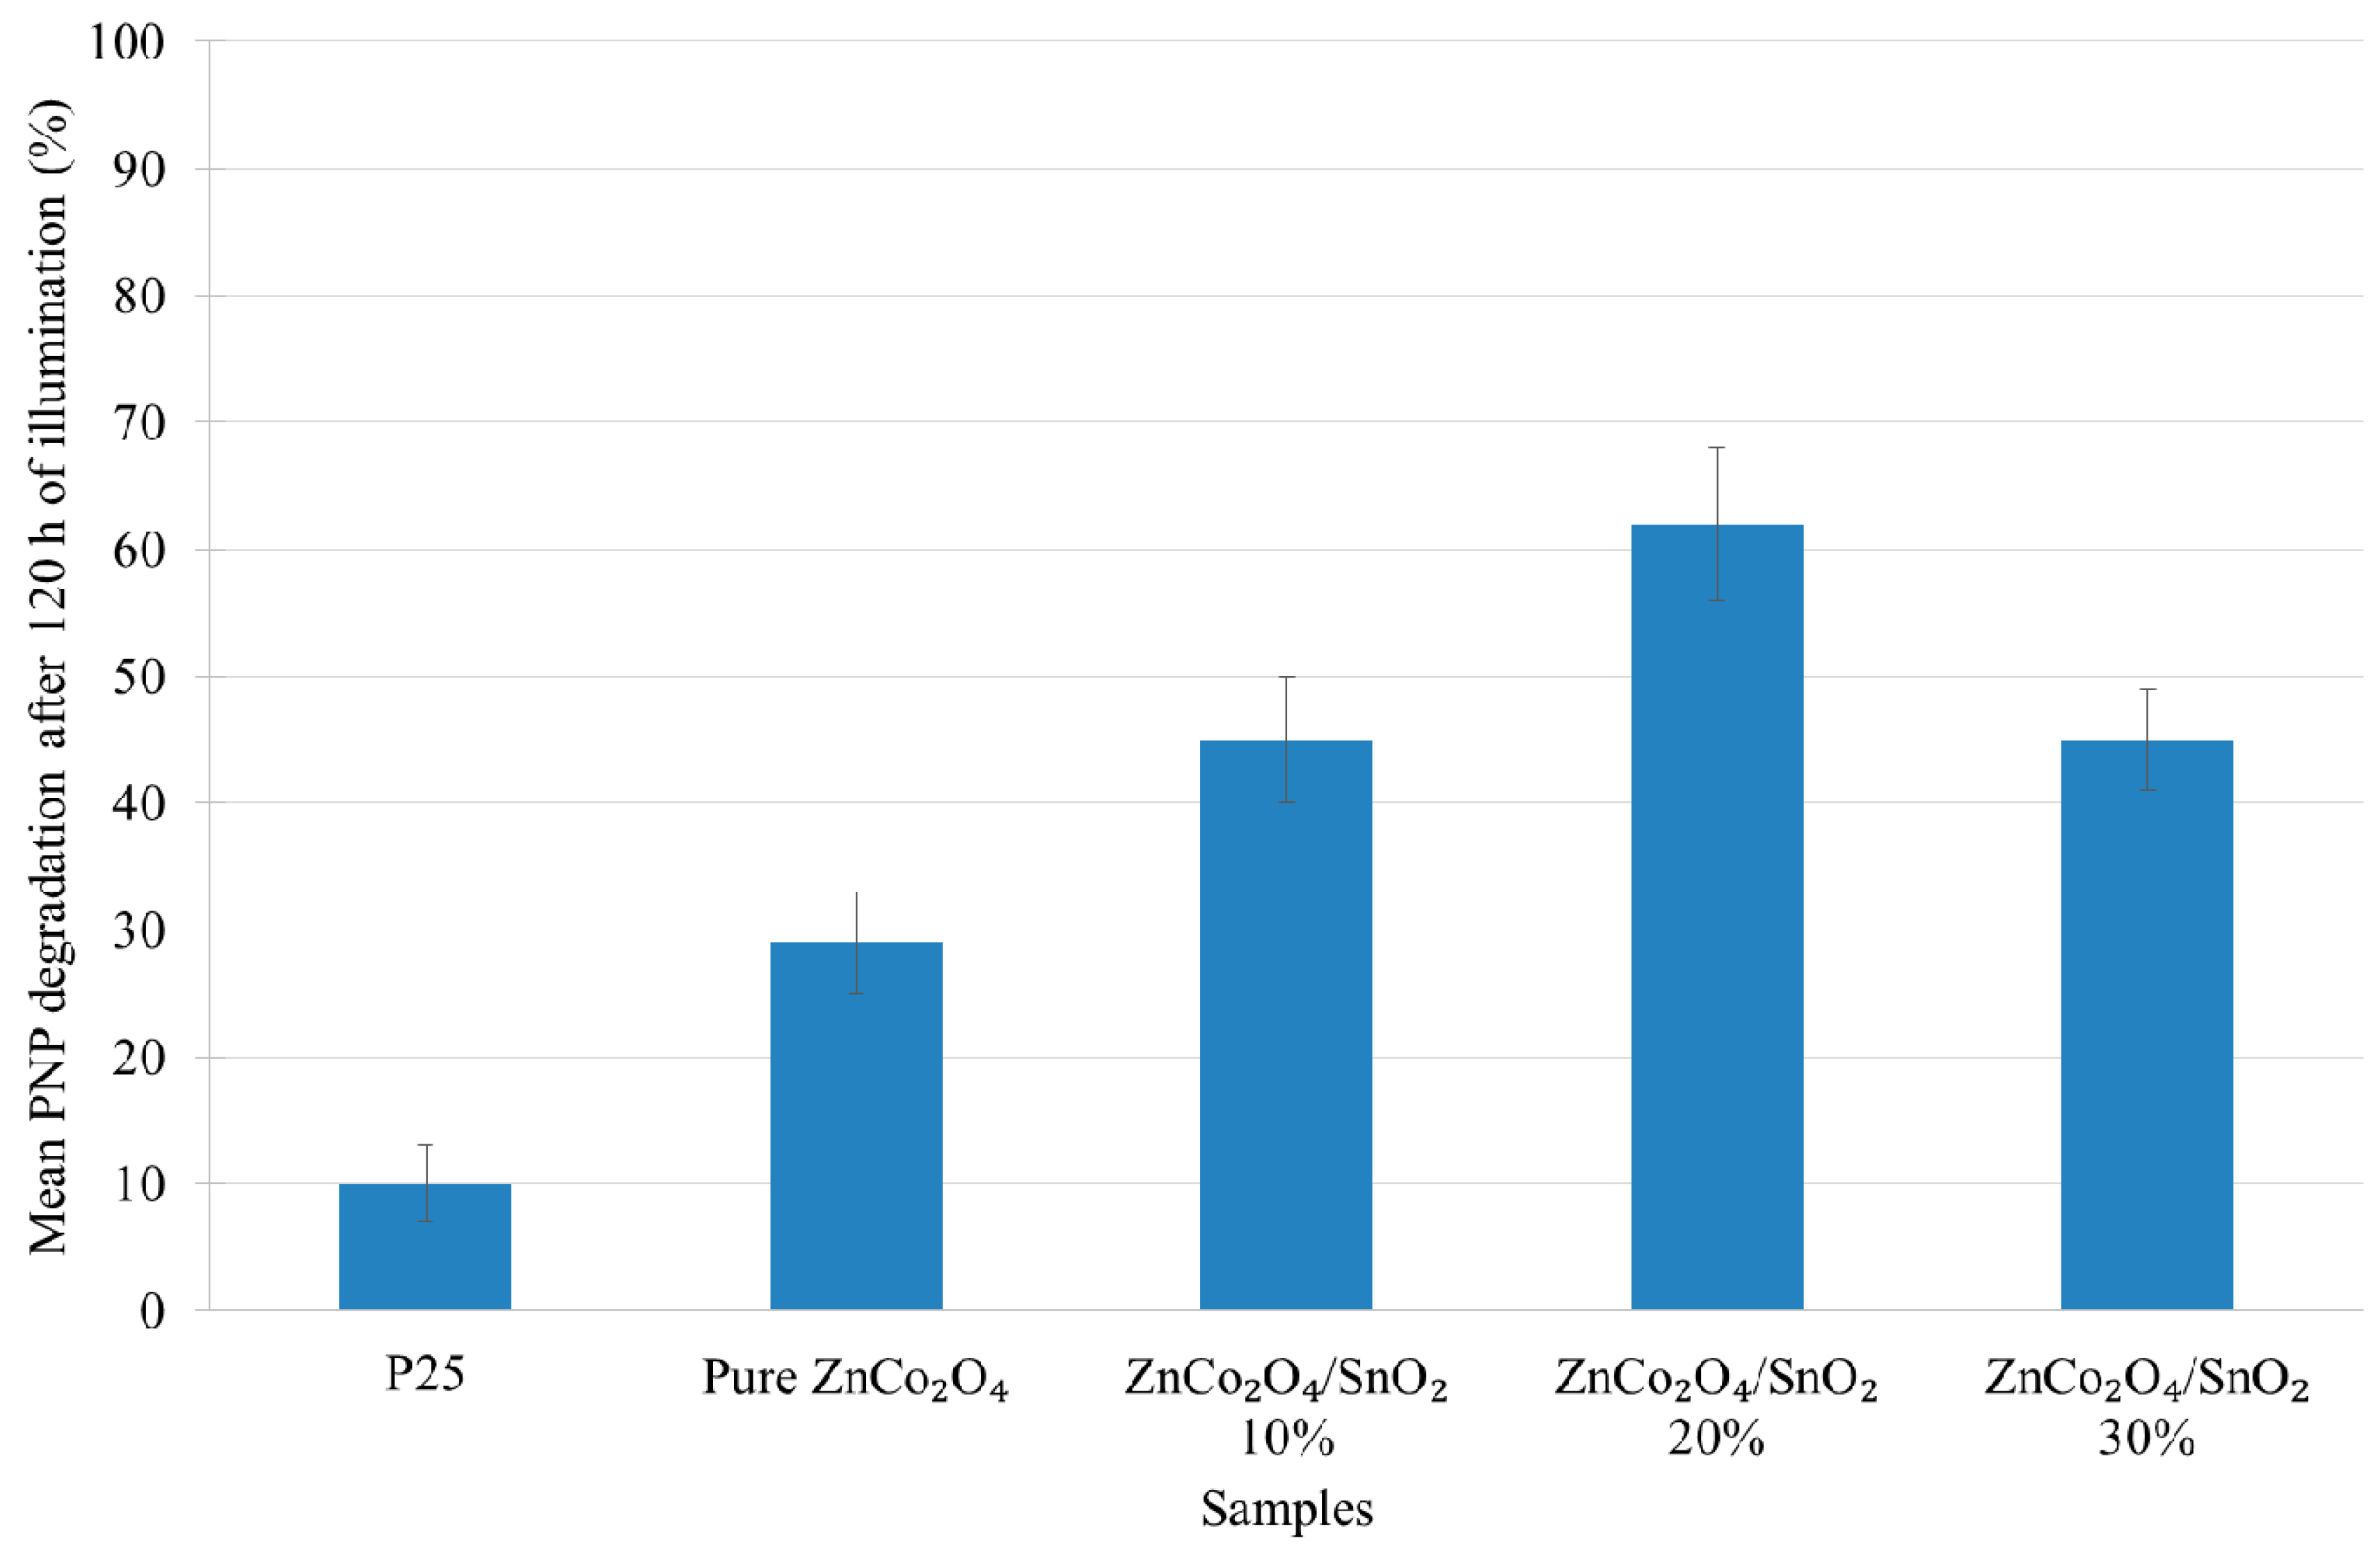
2.3. Photocatalytic Performance

The study of the photocatalytic activity was studied by comparing the photocatalytic activities of the four materials by using PNP solutions at 14 mg/L and confirmed by CR solutions with two different concentrations (20 mg/L and 35 mg/L). The partial order of the reaction relative to the pollutant was determined by comparing both CR degradation experiments. Let us consider the rate r [mol/L/h] as
r = dC dt = kC α kt = C 0 α ( 1 α ) ( 1 ( C C 0 ) 1 α )
where C is the concentration of CR [mol/L], t is the time [h], k is the rate constant (whose unit depends on α ), α is the partial order of the reaction relative to CR, and C0 is the initial concentration of CR. The coefficient of variation was calculated for each set of experiments, where the initial concentration was varied using the same photocatalyst. The average coefficient of variation (across all experiments) was minimized using a GRG nonlinear method and was equal to 0.003. We will consider that the reaction is a zero-order one, since the value of 0.003 is very close to 0. While pseudo-first orders are often reported for photocatalysis, zero orders are not unseen for congo red and could denote a very strong adsorption of CR by the various photocatalysts [50,51]. The values of the constants for PNP and CR are represented in Table 2.
It is difficult to compare our photocatalysts adequately with other reports from the literature, because many parameters are varied, like the nature of the catalyst, the nature of the degraded molecule, concentrations, volumes, intensity and frequency of the spectrum of light, or temperature, amongst the most obvious ones. Typical values are in the range of what we found for CR, with e.g., Shaban et al. [52] finding a 21.5 × 10 7 mol/L/h rate with MCM48/Ni2O3 concentrated at 0.2 g/L.
The results obtained on CR after 6 h of irradiation with visible radiation (λ > 400 nm) at pH = 8 and at room temperature (Figure 8) clearly show that the incorporation of tin dioxide (SnO2) positively improved the photocatalytic activity of zinc cobaltite (ZnCo2O4). Indeed, the degradation percentages increased from 57% with pure ZnCo2O4 to 91% with ZnCo2O4/SnO2-20% samples for a dye concentration of 20 mg/L and from 24% to 63% for a dye concentration of 35 mg/L. The SnO2 addition increases the activity in both cases. When the amount of SnO2 increases to 30 wt %, although the photocatalytic activity remains higher than the pure sample (82–47% versus 57–24% with 20 mg/L and 30 mg/L of dye solution, respectively), the photocatalytic activity decreases compared to ZnCo2O4/SnO2-20% sample. This observation indicates that an optimal loading content is reached for ZnCo2O4/SnO2-20% sample.
For the PNP degradation, similar observations can be made after 24 h of illumination (Figure 9), the PNP degradation increased when the photocatalyst is modified with SnO2. An optimal degradation rate is also observed when the amount of SnO2 is 20%. A comparison with commercial Evonik P25 shows that the ZnCo2O4 based catalysts are more active under visible light with a PNP degradation rate three to six times higher than P25 for all samples (Figure 9). The PNP degradations can be compared to previous modified-TiO2 materials under similar photocatalytic conditions [53,54]: In these works, visible activated TiO2 doped with Fe and N reached 42 and 69% of PNP degradation respectively with the best materials after 24 h of visible illumination. In this work, the highest PNP degradation was obtained with ZnCo2O4/SnO2-20% reaching 67% after 24 h of illumination. As mentioned above, it is difficult to compare our materials with other works as a lot of photocatalytic conditions were different (lamp intensity, illumination time, concentration, etc.).
Concerning the improvement of the photocatalytic activity with the modification with SnO2 addition, two effects can be detailed: A modification of the textural and morphological property and the formation of heterojunction between ZnCo2O4 and SnO2.
Concerning the formation of heterojunction, this mixed oxide can increase the photoactivity by increasing the recombination time between the charges (electrons (e) and holes (h+)). The mechanism is described in Figure 10. Indeed, it is possible to calculate the conduction and valence band potentials [55,56,57] of ZnCo2O4 and SnO2 with their estimated band gap (2.26 [58] and 3.63 [59] eV, respectively). The calculated energy levels for both oxides are represented in Figure 10. The mechanism in the mixed oxide is interpreted as follows: When the samples are illuminated with visible light, the ZnCo2O4 materials are excited producing photogenerated e and h+. Part of the photogenerated electrons can be displaced on the SnO2 conduction band (CB). The photogenerated electron–hole pairs will be separated effectively in the ZnCo2O4/SnO2 mix oxide [60]. So, the recombination of photogenerated species can be restrained. The efficient charge separation could increase the lifetime of the charge carriers and gives enough time to react with the reactants adsorbed onto the photocatalyst surfaces to improve the photocatalytic activity.
Moreover, as the CB of ZnCo2O4 (−0.69 eV) is more negative than that of potential of O2/·O2 (−0.285 V versus NHE) [60], the adsorbed O2 was easily reduced to ·O2 by the ZnCo2O4. But the valence band (VB) potential of ZnCo2O4 (1.57 eV) was insufficient to generate ·OH radicals (·OH/H2O potential, 2.30 eV versus NHE) [60]. Nevertheless, ·OH can be produced from the ·O2 by reacting with a proton in water [16].
On the other hand, the textural properties of ZnCo2O4/SnO2-20% sample could also explain its higher photocatalytic activity. Indeed, the specific surface area is the highest for this sample. Compared to the Evonik P25 catalyst, ZnCo2O4/SnO2-20% sample presents a five to six times increase regarding the degradation percentage (i.e., 17 an 10% of CR degradation regarding Evonik P25 catalyst for 20 mg/L and 30 mg/L of dye solution respectively and 12% of PNP degradation).
For example, with CR, the photocatalytic activity can be divided by the specific surface area to highlight the importance of this parameter (Figure 11a). It is observed that the activity is the highest for the pure sample but the difference between samples decreases when the pollutant concentration increases. Indeed, when the amount of pollutant increases, a lot of active sites are mandatory for reaction and so, an increased specific surface area would favor the degradation activity. If the specific surface area is low, even an efficient catalyst will have its activity limited by its number of active sites. So, the specific surface area becomes a very crucial parameter to obtain an efficient photoactivity with a high concentration of pollutant.
Moreover, the SnO2 addition in the loaded samples seems to present a low crystallinity (Figure 1) as the diffraction peaks are very weak. As this SnO2 fraction probably has a low photocatalytic activity, it can be suggested that the effect of SnO2 is not entirely linked to a photochemical phenomenon but rather to a textural effect. In this optic, the photoactivity per surface area can be linked to the real mass of ZnCo2O4 present in the samples tanks to Equation (2) (Figure 11b).
C R   d e g r a d a t i o n   p e r   m 2   a n d   g Z n C o 2 O 4 1 = C R   d e g r a d a t i o n   ( % ) S BET M ZnCo 2 O 4
where M ZnCo 2 O 4 corresponds to the mass of ZnCo2O4 in the sample and can be calculated with Equation (3).
M ZnCo 2 O 4 =   M photocatalyst   M SnO 2
where M photocatalyst corresponds to the total mass of photocatalyst used for the catalytic experiment and M SnO 2 corresponds to the mass of SnO2 in the sample.
In this case, the CR degradation (with an initial concentration of 35 mg/L) is higher when the sample is loaded with 20% of SnO2 compared to the other samples. From these results, it can be deduced that the SnO2 loading increases the photoactivity of degradation by a modification of the specific surface area and therefore by an increase in the contact surface area between the catalyst and the pollutant. In other words, the photoefficiency of ZnCo2O4 per unit mass increases when the specific surface increases. The SnO2 increase to 30 wt % of SnO2 leads to a small decrease of specific surface area and consequently a loss of activity compared to the 20 wt % sample, this observation can reinforce the fact that the activity is linked to the morphology of the sample.
A comparison with literature shows that CR degradation is widely studied [25,26,27] but the conditions of testing are quite different from a work to another making the comparison difficult. In Srivind et al. [25], the complete degradation of CR appears after about 3 h of illumination by light containing UV parts. However, the catalyst and dye concentrations are different from our study and the catalyst used is a nearly pure SnO2. In Ehsan et al. [26], the used catalysts are ZnO materials. The degradation of CR is obtained after 40 min with a very low initial concentration (75 ppm) and an UV–visible illumination. In Akika et al. [27], CR is degraded is about 3 h with Cu-NiAl2O4 catalyst under solar light containing UV-part. Once again, the CR and catalyst concentrations are very different from our test. Through literature, it is difficult to find exactly the same catalytic tests with similar conditions, especially for the lamp.

2.4. Photocatalytic Stability

The photocatalytic activity stability of the samples were assessed on five consecutive photocatalytic experiments on PNP degradation, for a total duration of 120 h. The mean PNP degradation is represented on Figure 12 for all samples. For all photocatalysts, the activity in maintains on 120 h of illumination, keeping at 90% of their initial activity. These experiments show the great stability of the ZnCo2O4 samples staying far more efficient than Evonik P25 on the PNP degradation.
Moreover, the morphology and the crystallinity after the four recycling cycles for pure ZnCo2O4 and ZnCo2O4/SnO2-20% were also assessed (Figure 13). No modification was observed when comparing the final SEM pictures and XRD diffractograms with initial morphology (Figure 3) and crystallinity (Figure 1).

3. Materials and Methods

3.1. Chemicals

All the reagents used in our experiments were of analytical purity and were used as received: Zinc acetate dehydrates (BIOCHEM, Cosne Cours sur Loire, France), oxalic acid dihydrate (Chemopharma, Cosne Cours sur Loire, France), lithium nitrate, sodium nitrate, potassium nitrate, and ethanol (Sigma-Aldrich, St. Louis, MO, USA).

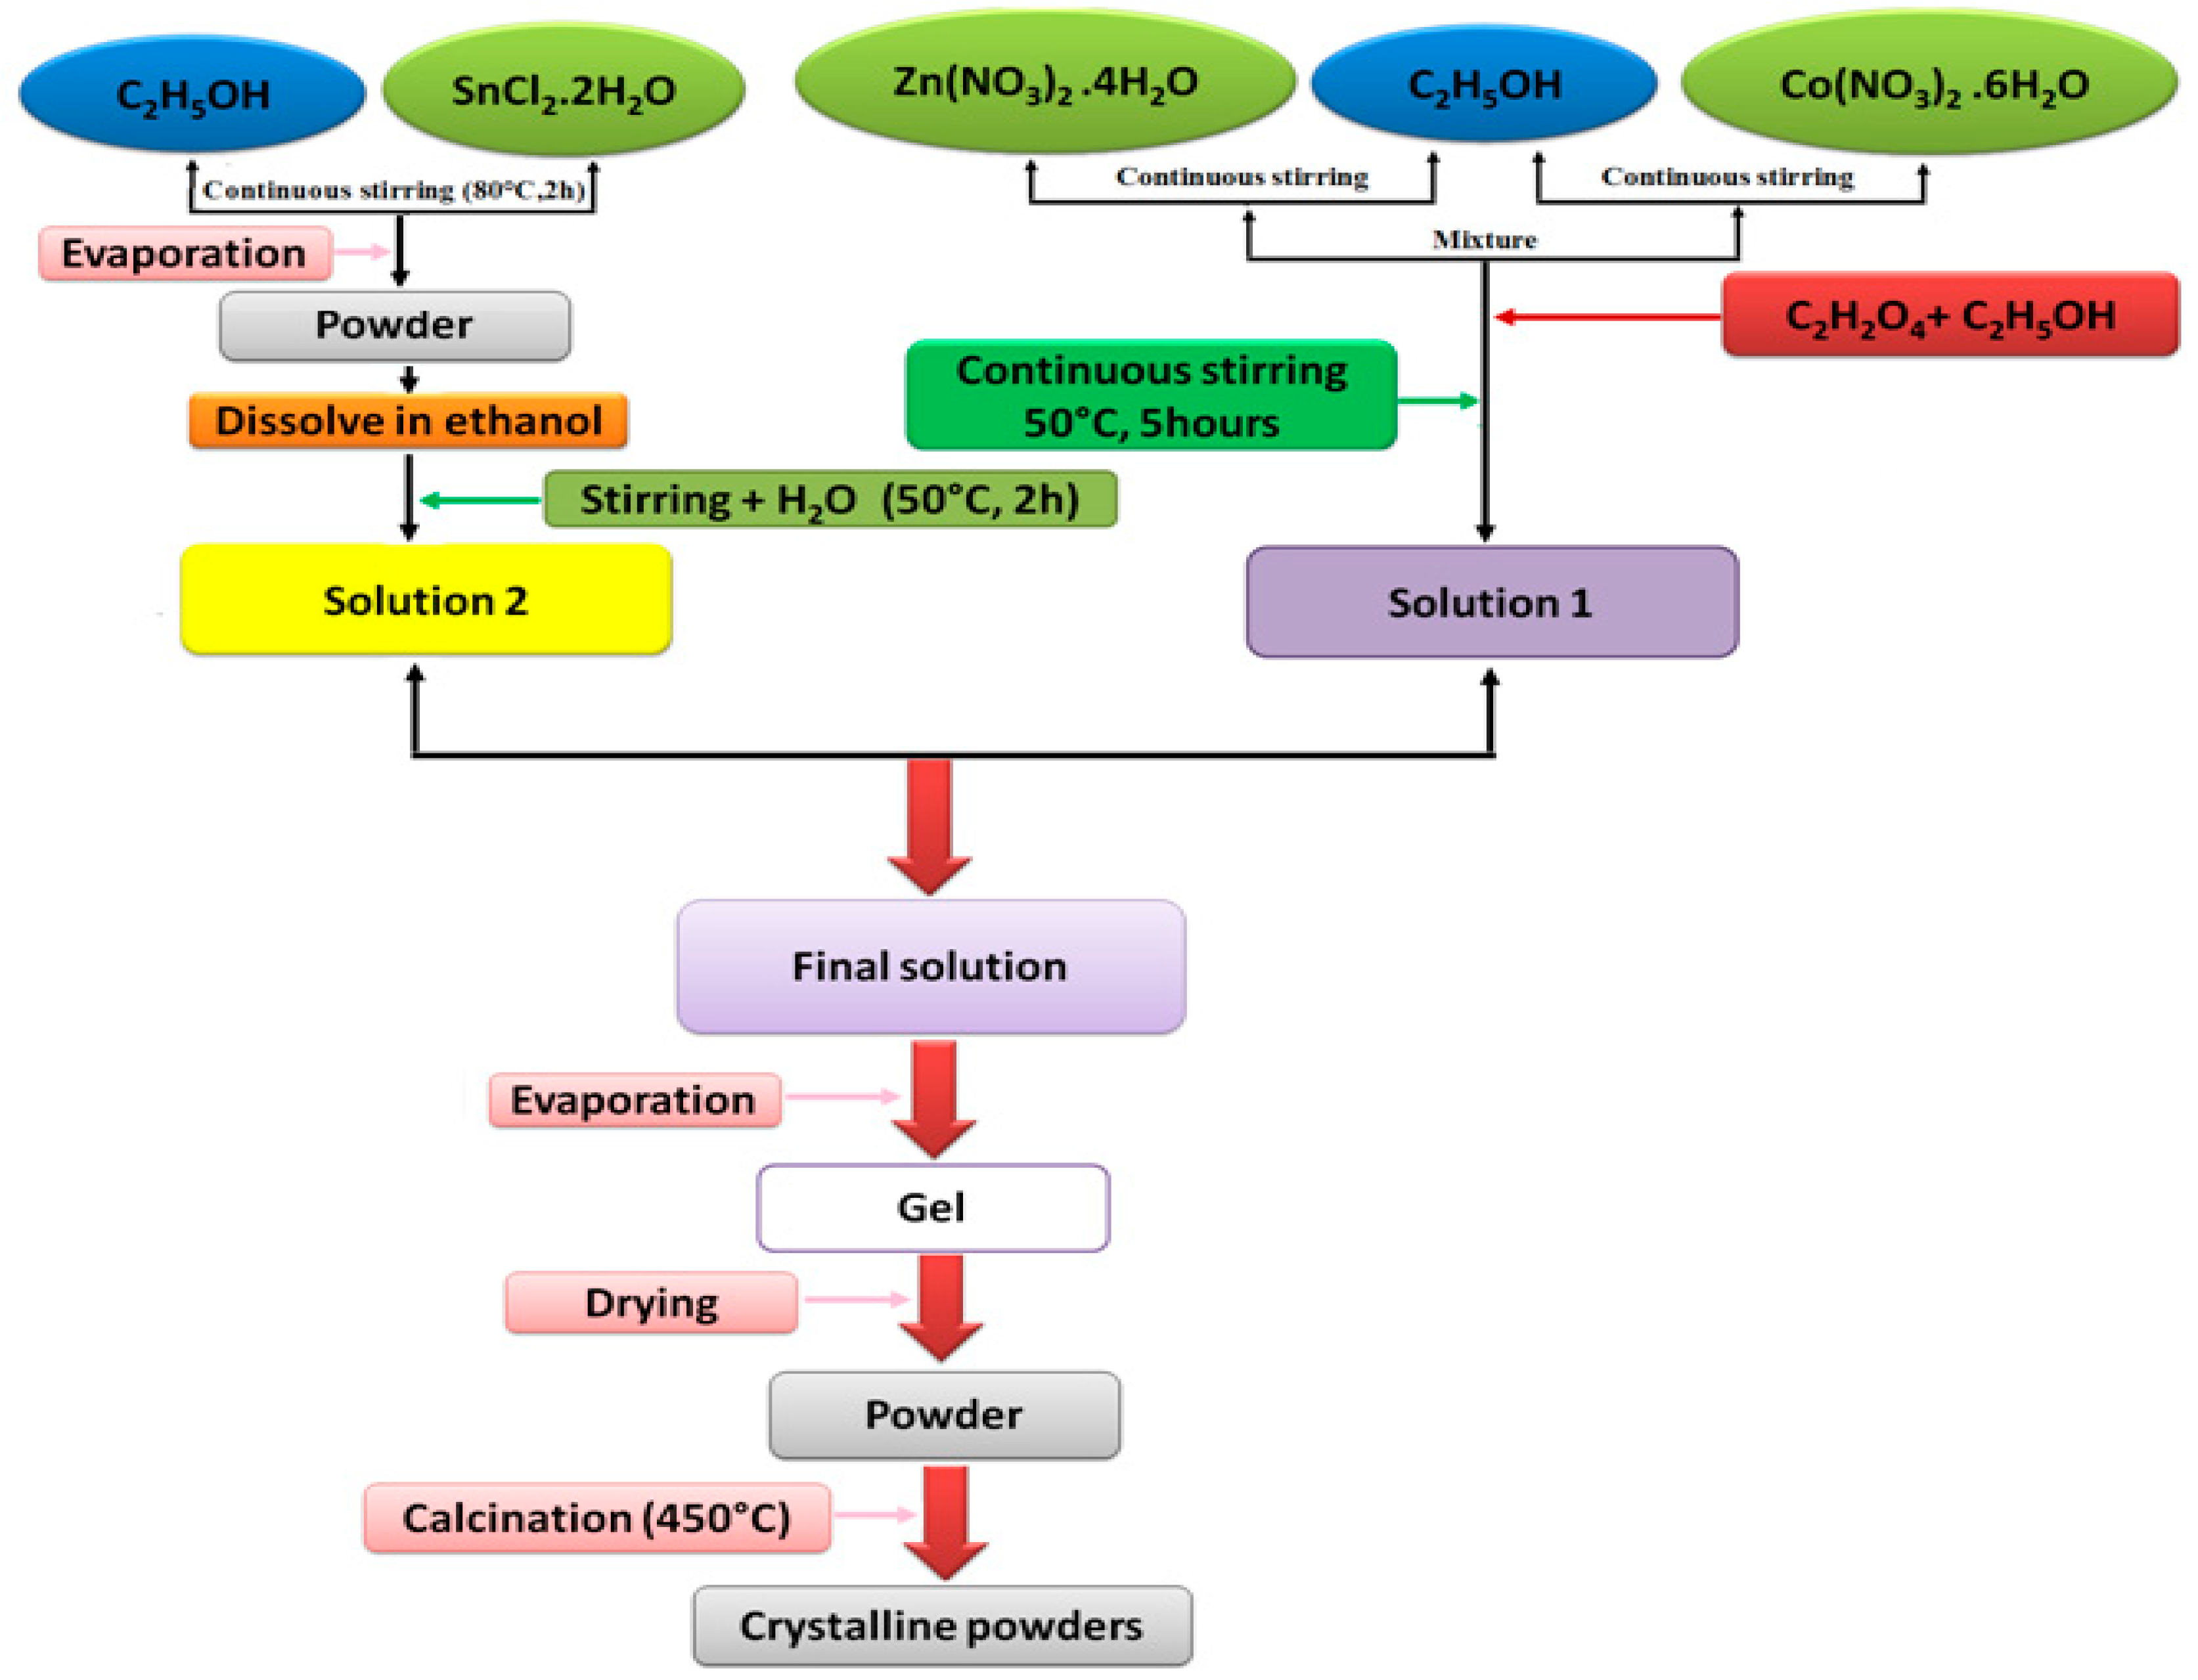
3.2. Material Synthesis

In order to develop the materials by sol-gel process [37,61], two solutions were prepared separately. Solution 1 (ZnCo2O4) was obtained by dissolving cobalt nitrate hexahydrate and zinc nitrate tetrahydrate in ethanol. The compounds were sources of cobalt and zinc, respectively, and produced Solution 1. Solution 2 (SnO2) was prepared from tin chloride dihydrate as precursor and ethanol as solvent. The two solutions were mixed to obtain the SnO2/ZnCo2O4 sample which, after evaporation, turned into a gel. Drying the gel at 110 °C and then calcining it at 450 °C led to a crystallized powder. The detailed synthesis protocol is presented on the flowchart of the Figure 14.
Four materials were produced: Pure ZnCo2O4, ZnCo2O4/SnO2-10%, ZnCo2O4/SnO2-20%, and ZnCo2O4/SnO2-30%.

3.3. Material Characterization

The actual amount of SnO2 in the SnO2-loaded ZnCo2O4 sample was determined by inductively coupled plasma–atomic emission spectroscopy (ICP–AES), equipped with an ICAP 6500 THERMO Scientific device (Thermo Fisher Scientific, Waltham, MA, USA). Solutions for analysis were prepared as follows [62]: (i) 2 g of Na2O2, 1 g of NaOH and 0.1 g of sample were mixed in a vitreous carbon crucible; (ii) the mixture was heated beyond the melting point (up to 950 °C); (iii) after cooling and solidification, the mixture was digested in 30 mL of HNO3 (65%); (iv) the solution was then transferred into a 500 mL calibrated flask that was finally filled with deionized water. The solution was then analyzed using an ICP-AES device.
X-ray powder diffraction analysis was realized using a Bruker D8 Twin-Twin powder diffractometer using Cu Kα radiation (Bruker, Billerica, MA, USA). The XRD pattern was identified by comparison with the JCPD standard. The crystalline size, dXRD, was determined by using the Scherrer equation based on line broadening analysis [63],
d XRD = 0 , 9   λ β   cos   θ
where, λ is the corrected wavelength of the X-radiation, β the full width at half-maximum corrected for instrumental broadening, and θ is the Bragg angle of the diffraction peak.
SEM micrographs were obtained using a Jeol-JSM-6360LV microscope (JEOL, Peabody, MA, USA) under high vacuum at an acceleration voltage of 20 kV. An elemental analysis by EDX was also performed.
FTIR spectra were carried out using an IRAffinity-1S device from Shimadzu in ATR mode (Shimadzu, Kyoto, Japan). The following instrumental settings were used: Absorbance, range from 4000 to 400 cm−1, 30 scans, and resolution 2 cm−1.
The sample textural properties were characterized by nitrogen adsorption-desorption isotherms in an ASAP 2420 multi-sampler adsorption-desorption volumetric device from Micromeritics (Micromeritics, Norcross, GA, USA). From these isotherms, the microporous volume was calculated using Dubinin-Radushkevich theory (VDR). The surface area was evaluated using Brunauer, Emmett, and Teller theory (SBET) [35].
The sample optical properties were evaluated by using diffuse reflectance spectroscopy measurements in the 250–850 nm region with a Lambda 1050 S UV/VIS/NIR spectrophotometer form PerkinElmer, equipped with an integrating sphere (150mm InGaAs Int. Sphere from PerkinElmer Waltham, MA, USA) and using Al2O3 as reference. The absorbance spectra were transformed using the Kubelka–Munk function [10,64,65] to produce a signal, normalized for comparison between samples, and so to calculated the band gaps (Eg,direct and Eg,indirect). The details of this treatment method have been widely described elsewhere [53,54,66].
The chemical states of the elements present in the samples were determined by XPS analysis with an Escalab 250Xi device from Thermo Scientific (Waltham, MA, USA). Spectra were acquired with monochromatic Al Kα source (1486.6 eV) and using a spot size of 500 µm and pass energy of 20 eV (for high resolution spectra). The photoelectrons were collected at an angle of 0° relative to the sample surface normal. A flood gun using combined electron and low energy ions was also used during analysis to prevent surface charging. The binding energies were corrected in order to have the C1s binding energy at 285.0 eV.

3.4. Photocatalytic Activity under Visible Light

The degradation of PNP was studied under visible light (λ > 400 nm) to determine the photocatalytic activity of the synthesized material. The potential of the material was confirmed through the degradation of congo dye (CR). The lamp was a halogen lamp covered by a UV filter (cutoff wavelength = 420 nm, intensity at 395 nm reduced by 95%), the lamp had a continuous spectrum from 400 to 800 nm (300 W, 220 V), as measured with a Mini-Spectrometer TM-UV/vis C10082MD from Hamamatsu (Hamamatsu, Japan).
Photocatalytic experiments were conducted in test tubes closed with a sealing cap. These tubes were placed in a cylindrical glass reactor [67] with the halogen lamp in the center. The reactor was maintained at constant temperature (20 °C) by a cooling system with recirculating water. The lamp was also cooled by a similar system. Aluminum foil covered the outer wall of the reactor to prevent any interaction with the room lighting. For each tested catalyst, three flasks with catalyst were exposed to light to assess the CR and PNP degradation. A blank measurement had been performed to ensure that Congo red did not degrade under illumination alone. For each catalyst, a dark test had also been performed to ensure that the samples did not adsorb the dye significantly. The evolution of the CR and PNP concentrations was measured by UV–Vis spectroscopy (GENESYS 10S UV–Vis from Thermo Scientific, Waltham, MA, USA) between 300 and 800 nm, using a calibration curve performed with different concentrations of CR and PNP to ensure the linearity of the absorbance and pollutant concentration.
The initial concentrations of the Congo red dye were 20 mg/L and 35 mg/L. In each tube, the catalyst concentration was 0.5 g/L. For the PNP, the initial concentration was 14 mg/L with a catalyst concentration of 1 g/L. The commercial Evonik P25 was used as reference material.

3.5. Recycling Study

To test the stability of the photoactivity of samples, photocatalytic recycling tests are made on all samples under visible light for the PNP degradation. The same protocol as explained in the above paragraph (Section 3.4) is performed on all catalysts. After this, the samples are recovered by centrifugation (10,000 rpm for 1 h) followed by drying at 120 °C for 24 h. A total of four photocatalytic tests as described above are applied to the re-used catalysts. So, each tested catalyst undergoes five catalytic tests (120 h of operation), and a mean PNP degradation over the recycling tests is then calculated.
The morphology and the crystallinity after the four recycling cycles are characterized with SEM and XRD on two samples: Pure ZnCo2O4 and ZnCo2O4/SnO2-20%.

4. Conclusions

In this work, pure and SnO2 loaded ZnCo2O4 photocatalysts have been synthesized by the sol-gel process. Three different SnO2 loading ratios were obtained: 10, 20, and 30 wt %. Their photocatalytic activities were assessed on the degradation of two organic pollutants in water under visible illumination.
The physico-chemical characterizations have shown that the materials are composed of crystalline ZnCo2O4 matrix with a crystallite size that decreases with the amount of SnO2. For the loaded samples, weakly crystalline SnO2 is observed. The specific surface area is modified with the loading ratio. Indeed, it increases with the loading content with an optimal value for the sample loaded with 20 wt % of SnO2. The FTIR spectra confirms the existence of the spinel structure in the samples of the prepared photocatalysts. The diffuse reflectance measurements show that all samples had a strong absorption in the 250 and 800 nm range. The XPS measurements show that all elements are in their expected oxidation state and chemical environment.
The evaluation of the photoactivity of the samples under visible light for the degradation of p-nitrophenol shows that all materials are highly photoactive under visible light. They are also able to degrade congo red efficiently. The SnO2 loading increases the activity compared to the pure sample. The main factor of this improvement can be due to the formation of a SnO2/ZnCo2O4 mixed oxide with an increased charge separation.
A second factor could be the addition of SnO2 which also increases of the specific surface area. Indeed, the best sample with 20 wt % of SnO2 has a specific surface area three times higher than the pure samples. The photoactivity has been reported to material surface area and the mass of ZnCo2O4 present in all samples. It appears that, especially at high concentration, the increase of the specific surface area becomes a crucial parameter to improve photoefficiency.
The photocatalyst activity stability has been also assessed under five consecutive photocatalytic experiments (120 h of illumination) showing a constant activity over time. Moreover, the morphology and the crystallinity stayed constant after 120 h of use.
A comparison with commercial Evonik P25 shows that the materials developed in this work have a five to six fold increase in efficiency under visible light, leading to a promising photocatalyst material.

Author Contributions

Conceptualization, H.B., S.K. and J.G.M.; methodology, H.B., S.K., C.W. and J.G.M.; material synthesis, H.B., B.A. and R.B.; material characterization, J.G.M., R.G.T., H.B., S.K., B.A., V.C., A.F., P.L. and R.B.; resources, S.D.L.; writing—original draft preparation, J.G.M. and H.B.; writing—review and editing, J.G.M., R.G.T., C.W., V.C., A.F. and S.D.L.; supervision, S.D.L. and J.G.M.; funding acquisition, S.D.L. and J.G.M.

Funding

This research received no external funding.

Acknowledgments

S.D.L. thanks the Belgian National Funds for Scientific Research (F.R.S.-FNRS) for her Senior Associate Researcher position. R.T. benefits from funding of the Fund for Scientific Research (F.R.S.-FNRS) under a Fund for Research Training in Industry and Agriculture (FRIA) grant. The authors are grateful to Dirk Poelman, from Ghent University, for diffuse reflectance spectroscopy measurements. The authors also thank the Ministère de la Région Wallonne Direction Générale des Technologies, de la Recherche et de l’Energie (DG06) and the Fonds de Recherche Fondamentale Collective.

Conflicts of Interest

The authors declare no conflict of interest.

References

  1. Vosoughifar, M. Preparation, characterization, and morphological control of MnWO4 nanoparticles through novel method and its photocatalyst application. J. Mater. Sci. Mater. Electron. 2017, 28, 2135–2140. [Google Scholar] [CrossRef]
  2. Shah, M.P. Industrial Wastewater Treatment: A Challenging Task in the Industrial. Adv. Recycl. Waste Manag. 2016, 2, 115. [Google Scholar] [CrossRef]
  3. Bhatkhande, D.S.; Pangarkar, V.G.; Beenackers, A.A.C.M. Photocatalytic degradation for environmental applications—A review. J. Chem. Technol. Biotechnol. 2001, 77, 102–106. [Google Scholar] [CrossRef]
  4. Azam, A.; Ahmed, A.S.; Oves, M. Size-dependent antimicrobial properties of CuO nanoparticles against Gram-positive and -negative bacterial strains. Int. J. Nanomed. 2012, 7, 3527–3535. [Google Scholar] [CrossRef] [PubMed] [Green Version]
  5. Léonard, G.L.-M.; Pàez, C.A.; Ramírez, A.E.; Mahy, J.G.; Heinrichs, B. Interactions between Zn2+ or ZnO with TiO2 to produce an efficient photocatalytic, superhydrophilic and aesthetic glass. J. Photochem. Photobiol. A Chem. 2018, 350, 32–43. [Google Scholar] [CrossRef]
  6. Tian, Q.; Wei, W.; Dai, J.; Sun, Q.; Zhuang, J.; Zheng, Y.; Liu, P.; Fan, M.; Chen, L. Porous core-shell TixSn1−xO2 solid solutions with broad-light response: One-pot synthesis and ultrahigh photooxidation performance. Appl. Catal. B Environ. 2019, 244, 45–55. [Google Scholar] [CrossRef]
  7. Wu, M.; Leung, D.Y.C.; Zhang, Y.; Huang, H.; Xie, R.; Szeto, W.; Li, F. Toluene degradation over Mn-TiO2/CeO2 composite catalyst under vacuum ultraviolet (VUV) irradiation. Chem. Eng. Sci. 2019, 195, 985–994. [Google Scholar] [CrossRef]
  8. Pelaez, M.; Nolan, N.T.; Pillai, S.C.; Seery, M.K.; Falaras, P.; Kontos, A.G.; Dunlop, P.S.M.; Hamilton, J.W.J.; Byrne, J.A.; O’Shea, K.; et al. A review on the visible light active titanium dioxide photocatalysts for environmental applications. Appl. Catal. B Environ. 2012, 125, 331–349. [Google Scholar] [CrossRef] [Green Version]
  9. Linsebigler, A.L.; Lu, G.; Yates, J.T. Photocatalysis on TiO2 Surfaces: Principles, Mechanisms, and Selected Results. Chem. Rev. 1995, 95, 735–758. [Google Scholar] [CrossRef]
  10. Malengreaux, C.M.; Douven, S.; Poelman, D.; Heinrichs, B.; Bartlett, J.R. An ambient temperature aqueous sol-gel processing of efficient nanocrystalline doped TiO2-based photocatalysts for the degradation of organic pollutants. J. Sol-Gel Sci. Technol. 2014, 71, 557–570. [Google Scholar] [CrossRef]
  11. Lee, A.; Libera, J.A.; Waldman, R.Z.; Ahmed, A.; Avila, J.R.; Elam, J.W.; Darling, S.B. Conformal Nitrogen-Doped TiO2 Photocatalytic Coatings for Sunlight-Activated Membranes. Adv. Sustain. Syst. 2017, 1, 1600041. [Google Scholar] [CrossRef]
  12. Li, J.; Wang, J.; Wexler, D.; Shi, D.; Liang, J.; Liu, H.; Xiong, S.; Qian, Y. Simple synthesis of yolk-shelled ZnCo2O4 microspheres towards enhancing the electrochemical performance of lithium-ion batteries in conjunction with a sodium carboxymethyl cellulose binder. J. Mater. Chem. A 2013, 1, 15292–15299. [Google Scholar] [CrossRef]
  13. Chen, J.; Zhan, J.; Lu, E.; Wan, Y.; Jin, Z.; Qi, H. Facile template-free fabrication of mesoporous ZnCo2O4 fibers with enhanced photocatalytic activity under visible-light irradiation. Mater. Lett. 2018, 220, 66–69. [Google Scholar] [CrossRef]
  14. Liu, B.; Liu, H.; Liang, M.; Liu, L.; Lv, Z.; Zhou, H.; Guo, H. Controlled synthesis of hollow octahedral ZnCo2O4 nanocages assembled by untrathin 2D nanosheets for enhanced lithium storage. Nanoscale 2017, 9, 17174–17180. [Google Scholar] [CrossRef] [PubMed]
  15. Kim, T.W.; Woo, M.A.; Regis, M.; Choi, K. Electrochemical Synthesis of Spinel Type ZnCo2O4 Electrodes for Use as Oxygen Evolution Reaction Catalysts. J. Phys. Chem. Lett. 2014, 5, 2370–2374. [Google Scholar] [CrossRef] [PubMed]
  16. Goswami, K.; Ananthakrishnan, R.; Mandal, S. Facile synthesis of cation doped ZnO-ZnCo2O4 hetero-nanocomposites for photocatalytic decomposition of aqueous organics under visible light. Mater. Chem. Phys. 2018, 206, 174–185. [Google Scholar] [CrossRef]
  17. Sarkar, A.; Karmakar, K.; Khan, G.G. Designing Co-Pi Modified One-Dimensional np TiO2/ZnCo2O4 Nanoheterostructure Photoanode with Reduced Electron—Hole Pair Recombination and Excellent Photoconversion Efficiency (>3%). J. Phys. Chem. C 2017, 121, 25705–25717. [Google Scholar] [CrossRef]
  18. Rashid, J.; Barakat, M.A.; Mohamed, R.M.; Ibrahim, I.A. Enhancement of photocatalytic activity of zinc/cobalt spinel oxides by doping with ZrO2 for visible light photocatalytic degradation of 2-chlorophenol in wastewater. J. Photochem. Photobiol. A Chem. 2014, 284, 1–7. [Google Scholar] [CrossRef]
  19. Valverde Aguilar, G.; Jaime Fonseca, M.R.; Mantilla Ramirez, A.; Juarez Gracia, A.G. Photoluminescence Studies on ZnO Thin Films Obtained by Sol-Gel Method. In Recent Applications in Sol-Gel Synthesis; Intechopen: London, UK, 2017; pp. 197–212. [Google Scholar]
  20. Bodson, C.J.; Heinrichs, B.; Tasseroul, L.; Bied, C.; Mahy, J.G.; Wong Chi Man, M.; Lambert, S.D. Efficient P- and Ag-doped titania for the photocatalytic degradation of waste water organic pollutants. J. Alloys Compd. 2016, 682, 144–153. [Google Scholar] [CrossRef]
  21. Bischoff, B.; Anderson, M. Peptization Process in the Sol-Gel Preparation of Porous Anatase (TiO2). Chem. Mater. 1995, 7, 1772–1778. [Google Scholar] [CrossRef]
  22. Gratzel, M. Sol-gel processed TiO2 films for photovoltaic applications. J. Sol-Gel Sci. Technol. 2001, 22, 7–13. [Google Scholar] [CrossRef]
  23. Mahy, J.G.; Deschamps, F.; Collard, V.; Jérôme, C.; Bartlett, J.; Lambert, S.D.; Heinrichs, B. Acid acting as redispersing agent to form stable colloids from photoactive crystalline aqueous sol–gel TiO2 powder. J. Sol-Gel Sci. Technol. 2018, 87, 568–583. [Google Scholar] [CrossRef]
  24. Belet, A.; Wolfs, C.; Mahy, J.G.; Poelman, D.; Vreuls, C. Sol-gel Syntheses of Photocatalysts for the Removal of Pharmaceutical Products in Water. Nanomaterials 2019, 9, 126. [Google Scholar] [CrossRef] [PubMed]
  25. Balamurugan, J.S.S.; Prabha, K.U.D.; Nagarethinam, M.S.V.S. Visible light irradiated photocatalytic and magnetic properties of Fe-doped SnS2 nanopowders. J. Mater. Sci. Mater. Electron. 2018, 29, 9016–9024. [Google Scholar]
  26. Ehsan, M.F.; Bashir, S.; Hamid, S.; Zia, A.; Abbas, Y.; Umbreen, K.; Naeem, M.; Shah, A. One-pot facile synthesis of the ZnO/ZnSe heterostructures for e ffi cient photocatalytic degradation of azo dye. Appl. Surf. Sci. 2018, 459, 194–200. [Google Scholar] [CrossRef]
  27. Akika, F.Z.; Benamira, M.; Lahmar, H.; Tibera, A.; Chabi, R.; Avramova, I.; Suzer, Ş.; Trari, M. Structural and optical properties of Cu-substitution of NiAl2O4 and their photocatalytic activity towards Congo red under solar light irradiation. J. Photochem. Photobiol. A Chem. 2018, 364, 542–550. [Google Scholar] [CrossRef]
  28. Mahy, J.G.; Paez, C.A.; Carcel, C.; Bied, C.; Tatton, A.S.; Damblon, C.; Heinrichs, B.; Wong Chi Man, M.; Lambert, S.D. Porphyrin-based hybrid silica-titania as a visible-light photocatalyst. J. Photochem. Photobiol. A Chem. 2019, 373, 66–76. [Google Scholar] [CrossRef]
  29. Rochkind, M.; Pasternak, S.; Paz, Y. Using dyes for evaluating photocatalytic properties: A critical review. Molecules 2015, 20, 88–110. [Google Scholar] [CrossRef]
  30. Zhu, Y.; Cao, C.; Zhang, J.; Xu, X. Two-dimensional ultrathin ZnCo2O4 nanosheets: General formation and lithium storage application. J. Mater. Chem. A 2015, 3, 9556–9564. [Google Scholar] [CrossRef]
  31. Qiu, Y.; Yang, S.; Deng, H.; Li, W. A novel nanostructured spinel ZnCo2O4 electrode material: Morphology conserved transformation from a hexagonal shaped nanodisk precursor and application in lithium ion batteries. J. Mater. Chem. 2010, 20, 4439–4444. [Google Scholar] [CrossRef]
  32. Léonard, G.L.-M.; Malengreaux, C.M.; Mélotte, Q.; Lambert, S.D.; Bruneel, E.; Van Driessche, I.; Heinrichs, B. Doped sol–gel films vs. powders TiO2: On the positive effect induced by the presence of a substrate. J. Environ. Chem. Eng. 2016, 4, 449–459. [Google Scholar] [CrossRef]
  33. Bhagwat, A.D.; Sawant, S.S.; Ankamwar, B.G.; Mahajan, C.M. Synthesis of Nanostructured Tin Oxide (SnO2) Powders and Thin Films Prepared by Sol-Gel Method. J. Nano- Electron. Phys. 2015, 7, 04037. [Google Scholar]
  34. Singh, R.P.P.; Hudiara, I.S.; Panday, S.; Rana, S.B. Effect of Ni Doping on Structural, Optical, and Magnetic Properties of Fe-Doped ZnO Nanoparticles. J. Supercond. Nov. Magn. 2015, 28, 3685–3691. [Google Scholar] [CrossRef]
  35. Lecloux, A. Exploitation des isothermes d’adsorption et de désorption d’azote pour l’étude de la texture des solides poreux. Mémoires Société des Sciences de Liege Belgium 1971, 1, 169–209. [Google Scholar]
  36. Kustova, G.N.; Burgina, E.B.; Volkova, G.G.; Yurieva, T.M.; Plyasova, L.M. IR spectroscopic investigation of cation distribution in Zn–Co oxide catalysts with spinel type structure. J. Mol. Catal. A Chem. 2000, 158, 293–296. [Google Scholar] [CrossRef]
  37. Wei, X.; Chen, D.; Tang, W. Preparation and characterization of the spinel oxide ZnCo2O4 obtained by sol-gel method. Mater. Chem. Phys. 2007, 103, 54–58. [Google Scholar] [CrossRef]
  38. Barakat, N.A.M.; Khil, M.S.; Sheikh, F.A.; Kim, H.Y. Synthesis and Optical Properties of Two Cobalt Oxides (CoO and Co3O4) Nanofibers Produced by Electrospinning Process. J. Phys. Chem. C 2008, 112, 12225–12233. [Google Scholar] [CrossRef]
  39. Paramarta, V.; Taufik, A.; Saleh, R. Better adsorption capacity of SnO2 nanoparticles with different graphene addition. J. Phys. Conf. Ser. 2016, 776, 012039. [Google Scholar] [CrossRef]
  40. Druska, P.; Steinike, U.; Šepelák, V. Surface structure of mechanically activated and of mechanosynthesized zinc ferrite. J. Solid State Chem. 1999, 146, 13–21. [Google Scholar] [CrossRef]
  41. Biesinger, M.C.; Lau, L.W.M.; Grosvenor, A.P.; Smart, R.S.C. Resolving surface chemical states in XPS analysis of first row transition metals, oxides and hydroxides: Sc, Ti, V, Cu and Zn. Appl. Surf. Sci. 2010, 257, 887–898. [Google Scholar] [CrossRef]
  42. Chuang, T.J.; Brundle, C.R.; Rice, D.W. Interpretation of the x-ray photoemission spectra of cobalt oxides and cobalt oxide surfaces. Surf. Sci. 1976, 59, 413–429. [Google Scholar] [CrossRef]
  43. Biesinger, M.C.; Payne, B.P.; Grosvenor, A.P.; Lau, L.W.M.; Gerson, A.R.; Smart, R.S.C. Resolving surface chemical states in XPS analysis of first row transition metals, oxides and hydroxides: Cr, Mn, Fe, Co and Ni. Appl. Surf. Sci. 2011, 257, 2717–2730. [Google Scholar] [CrossRef]
  44. Oku, M.; Hirokawa, K. X-ray photoelectron spectroscopy of Co3O4, Fe3O4, Mn3O4, and related compounds. J. Electron Spectros. Relat. Phenom. 1976, 8, 475–481. [Google Scholar] [CrossRef]
  45. Yuan, C.; Li, J.; Hou, L.; Lin, J.; Zhang, X.; Xiong, S. Polymer-assisted synthesis of a 3D hierarchical porous network-like spinel NiCo2O4 framework towards high-performance electrochemical capacitors. J. Mater. Chem. A 2013, 1, 11145–11151. [Google Scholar] [CrossRef]
  46. Lu, Y.; Lin, Y.; Wang, D.; Wang, L.; Xie, T.; Jiang, T. A high performance cobalt-doped ZnO visible light photocatalyst and its photogenerated charge transfer properties. Nano Res. 2011, 4, 1144–1152. [Google Scholar] [CrossRef]
  47. Moses, P.R.; Wier, L.M.; Lennox, J.C.; Finklea, H.O.; Lenhard, J.R.; Murray, R.W. X-ray photoelectron spectroscopy of alkylaminesilanes bound to metal oxide electrodes. Anal. Chem. 1978, 50, 576–585. [Google Scholar] [CrossRef]
  48. Ben Haj Othmen, W.; Hamdi, A.; Addad, A.; Sieber, B.; Elhouichet, H.; Szunerits, S.; Boukherroub, R. Fe-doped SnO2 decorated reduced graphene oxide nanocomposite with enhanced visible light photocatalytic activity. J. Photochem. Photobiol. A Chem. 2018, 367, 145–155. [Google Scholar] [CrossRef]
  49. Janus, M.; Morawski, A.W. New method of improving photocatalytic activity of commercial Degussa P25 for azo dyes decomposition. Appl. Catal. B Environ. 2007, 75, 118–123. [Google Scholar] [CrossRef]
  50. Hachem, C.; Bocquillon, F.; Zahraa, O.; Bouchy, M. Decolourization of textile industry wastewater by the photocatalytic degradation process. Dyes Pigments 2001, 49, 117–125. [Google Scholar] [CrossRef]
  51. Devi, L.G.; Kumar, S.G.; Reddy, K.M. Photo fenton like process Fe3+/(NH4)2 S2O8/UV for the degradation of Di azo dye congo red using low iron concentration. Cent. Eur. J. Chem. 2009, 7, 468–477. [Google Scholar]
  52. Shaban, M.; Abukhadra, M.R.; Hamd, A.; Amin, R.R.; Abdel Khalek, A. Photocatalytic removal of Congo red dye using MCM-48/Ni2O3 composite synthesized based on silica gel extracted from rice husk ash; fabrication and application. J. Environ. Manag. 2017, 204, 189–199. [Google Scholar] [CrossRef] [PubMed]
  53. Mahy, J.G.; Lambert, S.D.; Léonard, G.L.-M.; Zubiaur, A.; Olu, P.-Y.; Mahmoud, A.; Boschini, F.; Heinrichs, B. Towards a large scale aqueous sol-gel synthesis of doped TiO2: Study of various metallic dopings for the photocatalytic degradation of p-nitrophenol. J. Photochem. Photobiol. A Chem. 2016, 329, 189–202. [Google Scholar] [CrossRef]
  54. Mahy, J.G.; Cerfontaine, V.; Poelman, D.; Devred, F.; Gaigneaux, E.M.; Heinrichs, B.; Lambert, S.D. Highly efficient low-temperature N-doped TiO2 catalysts for visible light photocatalytic applications. Materials 2018, 11, 584. [Google Scholar] [CrossRef] [PubMed]
  55. Tian, J.; Shao, Q.; Zhao, J.; Pan, D.; Dong, M.; Jia, C.; Ding, T. Microwave solvothermal carboxymethyl chitosan templated synthesis of TiO2/ZrO2 composites toward enhanced photocatalytic degradation of Rhodamine B. J. Colloid Interface Sci. 2019, 541, 18–29. [Google Scholar] [CrossRef] [PubMed]
  56. Renuka, L.; Anantharaju, K.S.; Vidya, Y.S.; Nagaswarupa, H.P.; Prashantha, S.C. A simple combustion method for the synthesis of multi-functional ZrO2/CuO nanocomposites: Excellent performance as Sunlight photocatalysts and enhanced latent fingerprint detection. Appl. Catal. B Environ. 2017, 210, 97–115. [Google Scholar] [CrossRef]
  57. Xu, Y.; Schoonen, M.A.A. The absolute energy positions of conduction and valence bands of selected semiconducting minerals. Am. Mineral. 2000, 85, 543–556. [Google Scholar] [CrossRef]
  58. Amini, M.N.; Dixit, H.; Saniz, R.; Lamoen, D.; Partoens, B. The origin of p-type conductivity in ZnM2O4 (M = Co, Rh, Ir) spinels. Phys. Chem. Chem. Phys. 2014, 16, 2588–2596. [Google Scholar] [CrossRef]
  59. Benhebal, H.; Chaib, M.; Léonard, A.; Lambert, S.D.; Crine, M. Synthesis, characterization and photocatalytic properties of alkali metals doped tin dioxide. J. Mol. Struct. 2011, 1004, 222–226. [Google Scholar] [CrossRef]
  60. Yi, S.; Yue, X.; Xu, D.; Liu, Z.; Zhao, F.; Wang, D.; Lin, Y. Study on photogenerated charge transfer properties and enhanced visible-light photocatalytic activity of p-type Bi2O3/n-type ZnO heterojunctions. New J. Chem. 2015, 39, 2917–2924. [Google Scholar] [CrossRef]
  61. Novinrooz, A.; Sarabadani, P.; Garouse, J. Characterization of Pure and Antimony Doped SnO2 Thin Films Prepared by the Sol-Gel Technique. Iran. J. Chem. Chem. Eng. 2006, 25, 31–38. [Google Scholar]
  62. Mahy, J.G.; Tasseroul, L.; Zubiaur, A.; Geens, J.; Brisbois, M.; Herlitschke, M.; Hermann, R.; Heinrichs, B.; Lambert, S.D. Highly dispersed iron xerogel catalysts for p-nitrophenol degradation by photo-Fenton effects. Microporous Mesoporous Mater. 2014, 197, 164–173. [Google Scholar] [CrossRef]
  63. Reenu, J.; Harikrishnan, N.; Jayakumari, I. Structural and Morphological Studies of Nano-crystalline Ceramic BaSr0.9Fe0.1TiO4. Int. Lett. Chem. Phys. Astron. 2015, 41, 100–117. [Google Scholar]
  64. Kubelka, P.; Munk, F. Ein Beitrag zur Optik der Farban striche. Z. Tech. Phys. 1931, 12, 593–603. [Google Scholar]
  65. Kubelka, P. New contributions to the optics of intensely light-scattering materials. J. Opt. Soc. Am. 1948, 38, 448–457. [Google Scholar] [CrossRef] [PubMed]
  66. Malengreaux, C.M.; Pirard, S.L.; Léonard, G.; Mahy, J.G.; Herlitschke, M.; Klobes, B.; Hermann, R.; Heinrichs, B.; Bartlett, J.R. Study of the photocatalytic activity of Fe3+, Cr3+, La3+ and Eu3+ single-doped and co-doped TiO2 catalysts produced by aqueous sol-gel processing. J. Alloys Compd. 2017, 691, 726–738. [Google Scholar] [CrossRef]
  67. Páez, C.A.; Liquet, D.Y.; Calberg, C.; Lambert, S.D.; Willems, I.; Germeau, A.; Pirard, J.P.; Heinrichs, B. Study of photocatalytic decomposition of hydrogen peroxide over ramsdellite-MnO2 by O2-pressure monitoring. Catal. Commun. 2011, 15, 132–136. [Google Scholar] [CrossRef]
Figure 1. X-ray diffraction (XRD) patterns of samples: (●) Pure ZnCo2O4, (■) ZnCo2O4/SnO2-10%, (▲) ZnCo2O4/SnO2-20% and (♦) ZnCo2O4/SnO2-30%. (Z) Reference pattern of cubic spinel ZnCo2O4 and (S) reference pattern of tetragonal rutile SnO2.
Inorganics 07 00077 g001
Figure 2. Nitrogen adsorption-desorption isotherms of samples: (●) pure ZnCo2O4, (■) ZnCo2O4/SnO2-10%, (▲) ZnCo2O4/SnO2-20% and (♦) ZnCo2O4/SnO2-30%.
Inorganics 07 00077 g002
Figure 3. Scanning electron microscopy (SEM) images of as-synthesized pure ZnCo2O4 (a) and ZnCo2O4/SnO2-20% (b) samples. The center of each picture corresponds to the place where the energy dispersive X-ray (EDX) analysis was carried out (see Figure 4).
Inorganics 07 00077 g003
Figure 4. EDX of pure ZnCo2O4 (a) and ZnCo2O4/SnO2-20% (b) nanoparticles.
Inorganics 07 00077 g004
Figure 5. Fourier-transformed infrared spectroscopy (FTIR) spectra of (●) pure ZnCo2O4, (■) ZnCo2O4/SnO2-10%, (▲) ZnCo2O4/SnO2-20% and (♦) ZnCo2O4/SnO2-30%.
Inorganics 07 00077 g005
Figure 6. X-ray photoelectron spectroscopy (XPS) spectra of (●) pure ZnCo2O4 and (▲) ZnCo2O4/SnO2-20%: (a) Zn 2p region, (b) Co 2p region, (c) O 1s region and (d) Sn 3d region.
Inorganics 07 00077 g006
Figure 7. UV–Visible absorption spectra of (●) pure ZnCo2O4, (■) ZnCo2O4/SnO2-10%, (▲) ZnCo2O4/SnO2-20%, (♦) ZnCo2O4/SnO2-30% and (×) Evonik P25.
Inorganics 07 00077 g007
Figure 8. CR degradation (%) without catalyst and for all the samples under visible light (λ > 400 nm) after 6 h of illumination.
Inorganics 07 00077 g008
Figure 9. p-Nitrophenol (PNP) degradation (%) without catalyst and for all the samples under visible light after 24 h of illumination.
Inorganics 07 00077 g009
Figure 10. Mechanism of charge transfer in mixed SnO2-ZnCo2O4 sample. Electrons (e) and holes (h+) correspond to the photogenerated electron and hole, ECB and ECV stand for potentials of conduction and valence band, Eg,indirect corresponds to the indirect band gap.
Inorganics 07 00077 g010
Figure 11. (a) CR degradation per m2 (% m−2) for all the samples under visible light (λ > 400 nm) after 6 h of illumination; and (b) CR degradation per m2 and per g of ZnCo2O4 (% m−2·g−1) for all the samples under visible light (λ > 400 nm) after 6 h of illumination. For the Evonik P25, the photoactivity is reported to the mass of TiO2.
Inorganics 07 00077 g011
Figure 12. Mean PNP degradation (%) under visible light for all samples after the four recycling cycles (corresponding to five catalytic tests of 24 h each, with isolation of the sample and drying stages in between).
Inorganics 07 00077 g012
Figure 13. SEM images of pure ZnCo2O4 (a) and ZnCo2O4/SnO2-20% (b) samples after the four recycling cycles. (c) XRD patterns of (○) pure ZnCo2O4 and (∆) ZnCo2O4/SnO2-20% after the four recycling cycles. (Z) Reference pattern of cubic spinel ZnCo2O4 and (S) reference pattern of tetragonal rutile SnO2.
Inorganics 07 00077 g013
Figure 14. Process for sol-gel synthesis of ZnCo2O4 and SnO2 loaded ZnCo2O4.
Inorganics 07 00077 g014
Table 1. Sample composition and textural properties.
SamplesSnO2 Theoretical Content (wt %)SnO2 Actual Content (wt %)SBET
(m2·g−1)
±5
VDR
(cm3·g−1)
±0.01
dXRD
(nm)
±1
Pure ZnCo2O4--170.0130
ZnCo2O4/SnO2-10%1011270.0224
ZnCo2O4/SnO2-20%2020480.0316
ZnCo2O4/SnO2-30%3032450.0316
SBET: Specific surface area determined by the BET method; VDR: Specific micropore volume determined by Dubinin–Raduskevitch theory; dXRD: Mean diameter of TiO2 crystallites measured by the Scherrer method.
Table 2. Zero-order rate constants for the degradation of p-nitrophenol and congo red.
Sample k PNP
(10−7 mol/L/h)
k ¯ CR
(10−7 mol/L/h)
No catalyst00
P2552.1
Pure ZnCo2O413.35.9
ZnCo2O4/SnO2-10%17.97.1
ZnCo2O4/SnO2-20%27.912.0
ZnCo2O4/SnO2-30%19.29.8

