Abstract
In this paper, the nonlinear absorption properties of two complexes consisting of Ru(C≡CPh)(C≡C)(dppe)2 (dppe = Ph2PCH2CH2PPh2) as electron donor (D) and 4,7-di(2-thienyl)benzo[c][1,2,5]thiadiazole as electron acceptor (A) units in two different arrangement, i.e., A–D–A and D–A–D, are presented. They were measured in solution by the femtosecond open-aperture Z-scan method. The complexes show moderate two-photon absorption cross-sections σ(2) of several hundred to one thousand GM (here 1 GM = 10−50 cm4 s molecule−1 photon−1). Although they are formed by the same building units, it was found that the two-photon absorption values of the D–A–D arrangement are six times higher than that of the A–D–A one. This difference can be explained by the number of metal cores (one or two ruthenium centers), the geometrical configurations of the complexes (more or less planar), and the resonance enhancement by lowering the intermediate state.
1. Introduction
Two-photon absorption (TPA), one of the nonlinear absorption (NLA) processes, has attracted considerable attention in the last few years because of its applications in various fields, such as 3D fluorescence imaging and control of biological systems, 3D-microfabrication, optical limiting, and so on [1,2]. A large number of compounds have been investigated and extensive efforts were devoted to clarifying the structure-property relationship. Among the various compounds reported, ruthenium (II) σ-acetylide complexes, well-known for their second- and third-order optical nonlinearities [3,4,5,6,7], are of great interest because they tend to have very large two-photon absorption cross-sections [8,9,10,11].
While the excellent TPA properties of ruthenium dendrimers have been extensively studied, in particular by Humphrey and co-workers [8,9,10,11], there are only a few examples of mononuclear and dinuclear ruthenium complexes for TPA applications [12,13]. Recently, two new ruthenium (II) σ-acetylide complexes (Ru-1 and Ru-2, Figure 1) were synthesized [4,5,14]. In these complexes, the metal centers act as donor (D) groups of a donor–acceptor (D/A) system, where the acceptor (A) is the organic fragment 4,7-di(2-thienyl)benzo[c][1,2,5]thiadiazole. In complex Ru-1 two di(thienyl)benzothiadiazole units are linked by a Ru(II) σ-acetylide bridge, forming a A–D–A type arrangement, while in Ru-2, the two Ru(II) σ-acetylide units are linked through a di(thienyl)benzothiadiazole unit, resulting in a D–A–D arrangement. The almost linear metal–alkynyl structure allows a good coupling between the π system of the σ-acetylides and the d-orbitals of the metal. Furthermore, the phenylalkynyl ancillary ligands are known to increase the donor properties of the ruthenium center [9]. Interestingly, complex Ru-2 is characterized by a good quadratic hyperpolarizability response and it is an efficient building block for polymeric films, characterized by a significant second harmonic generation (SHG) [4]. However, its two-photon absorption properties have never been investigated.
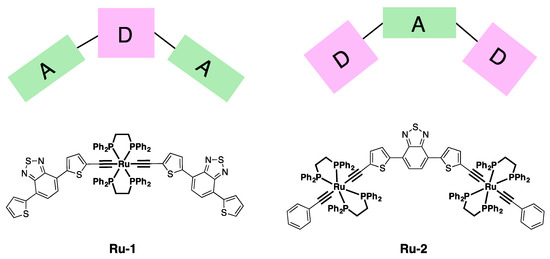
Figure 1.
The chemical structures of the Ru(II) complexes studied and the design motif with electron donor (D) and acceptor (A) moieties.
Here we present the TPA spectral properties of complexes Ru-1 and Ru-2, which consist of three units of the same components but in different arrangements (A–D–A and D–A–D, respectively). The TPA spectral properties were characterized by the femtosecond Z-scan method. TPA of the complexes were found to induce photochemical transients, which cause measurement artifacts leading to an overestimation of the TPA activity. However, removal of the artifact allows the true TPA spectra to be obtained, the origin of which is discussed. Ab initio molecular orbital (MO) calculations were carried out to provide theoretical insights towards a better understanding of the origin of the one- and two-photon transitions.
2. Results
2.1. Linear Optical Properties
In Figure 2 the one-photon absorption (OPA) spectra of the ruthenium complexes in dichloromethane solution (10−6 M) are shown. The molar absorption coefficients are similar for the two complexes, even though the maxima are at different wavelengths: three distinguishable peaks were observed at 320, 455, and 600 nm for Ru-1, while two peaks were at 395 and 635 nm for Ru-2. The 320-nm and 455-nm peaks are similar to the absorption peaks of di(thienyl)benzothiadiazole, reported to be at 310 nm and 445 nm in dichloromethane [15] and 450 nm for a compound bearing the same unit [16]. The 395-nm peak of Ru-2 is probably the result of the blue shift of the 445-nm peak of the acceptor unit. On the other hand, the peaks at 600 nm of Ru-1 and 635 nm of Ru-2 are related to metal-to-ligand charge transfer, the magnitude being double for the Ru-2 having two metal centers.

Figure 2.
Linear absorption spectra (curve) of (a) Ru-1 and (b) Ru-2 in dichloromethane and the oscillator strength (f, bar with dot) obtained from molecular orbital calculation at the B3LYP/6-31G(d) (lanl2DZ for Ru) level in a vacuum.
2.2. Molecular Orbital Calculation
For a deeper understanding of the observed one-photon absorption bands and the structure of the excited states of the complexes, we performed ab initio MO calculation based on the density functional theory (DFT). Geometry optimization and time-dependent calculation at the B3LYP/6-31G(d) (lanl2DZ for Ru) level for isolated Ru-1 and Ru-2 were performed on Gaussian09 software package. The B3LYP method was chosen because it was previously used for similar complexes [5]. For di(thienyl)benzothiadiazole, three rotational conformers of thiophene rings were previously reported [15,17]. The conformer that has both S atoms of the thiophene ring in trans position to the N–S–N moiety (tt-conformer) can be slightly more stable than others [15]. Here, we consider only tt-conformer as a representative (as shown in Figure 3).
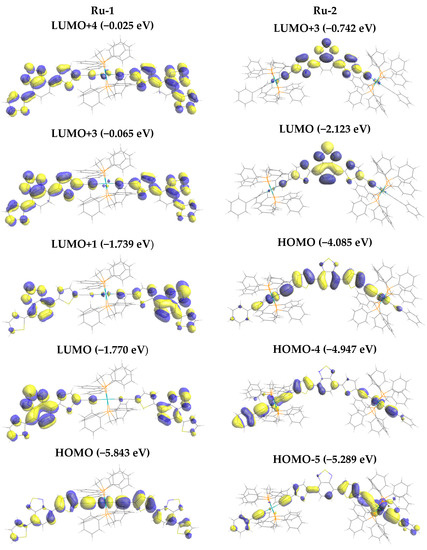

Figure 3.
Molecular orbital (MO) pattern of the MO’s related to the major one-photon absorption (OPA) transitions of Ru-1. Calculated at the B3LYP/6-31G(d) (lanl2DZ for Ru) level in the vacuum.
In the case of Ru-1, the optimized structure showed that each di(thienyl)benzothiadiazole unit is planar, but the two planes are twisted (dihedral angle of 44.4°). Transitions to excited states S1, S4, and S11 have significant oscillator strengths f (Figure 2a). The dominant contribution to S1 is highest occupied molecular orbital (HOMO) → lowest unoccupied molecular orbital (LUMO) (93.9%, Table 1), where HOMO is more localized over the –thienyl–C≡C–Ru–C≡C–thienyl– moiety, while LUMO is more localized on both di(thienyl)benzothiadiazole moieties (Figure 3), leading symmetric charge transfer (from inner to outer), supporting the A–D–A structure as expected. The d-orbital of Ru atom contributes to HOMO but not to LUMO, so it can be classified as metal-to-ligand charge transfer (MLCT). The dominant configuration of S4 is HOMO-1 → LUMO+1 (89.6%) followed by HOMO-1 → LUMO (6.1%), where LUMO and LUMO+1 are nearly degenerated with the same orbital pattern, except the phase, while HOMO and HOMO-1 are the same except for the orthogonal orientation of orbital lobes of the –C≡C–Ru–C≡C– moiety with the d-orbital. For S11 the dominant configuration is HOMO → LUMO+3 (87.8%) followed by HOMO-1 → LUMO+4 (5.0%). Again, LUMO+3 and LUMO+4 are nearly degenerate and have the same orbital pattern, except the symmetry. In this case, orbitals also localized somehow at the –thienyl–C≡C–Ru–C≡C–thienyl– moiety, thus the better orbital overlaps cause the large oscillator strength of S11.

Table 1.
Transition energy (wavelength), oscillator strength f, and the dominant electronic configuration (orbital contribution) of selected excited states of Ru-1 and Ru-2 calculated at the B3LYP/6-31G(d) (lanl2DZ for Ru) level in vacuum. The information including the other excited states are summarized in Table S1 in Supplementary Materials.
For Ru-2, the di(thienyl)benzothiadiazole unit and the two metal centers are in the plane in the optimized geometry. S1 and S10 are major OPA transitions. The dominant configuration of S1 is HOMO → LUMO (99.0%) and that of S10 is HOMO → LUMO+3 (84.8%) followed by HOMO-5 → LUMO (8.2%), as shown in Table 1. HOMO → LUMO is the transition from two –thienyl–C≡C–Ru–C≡C–thienyl– moieties to the central benzothiadiazole moiety, in agreement with the D–A–D arrangement with the large orbital overlap. HOMO → LUMO+3 has similar overlap as HOMO → LUMO, while HOMO-5 → LUMO has larger change of localization from the outer to the inner (Figure 3). Like Ru-1, d-orbital contributes to occupied molecular orbitals.
2.3. Nonlinear Absorption Properties
The nonlinear absorption of the complexes was measured by the open-aperture Z-scan method. The complexes were dissolved in dichloromethane and placed in 2-mm cuvettes. The concentration was 1.5 mM for Ru-1 and 0.8 mM for Ru-2. It was found that stirring the sample solution had a drastic effect on the measurement. The sample solution of Ru-2 showed enormous depression asymmetry against the focal point without stirring the sample (Figure 4a). The shape of the trace was inverted when the scanning direction was inverted (filled and open symbols in Figure 4a). On the other hand, the trace was symmetric when the sample was stirred (Figure 4b), with a large (almost a factor of 1/6) decrease of the NLA signal intensity (i.e., depth of the dip in Figure 4c). The open-aperture Z-scan should be symmetric when the signal originates only from TPA (Figure 4d) because of the symmetricity of the optical intensity function against the focal point. The asymmetric trace means that other processes rather than TPA are involved. These results show that TPA induced the formation of an intermediate that strongly absorbs the laser pulse and lasts much longer than 1 ms (interval of the laser pulses). Stirring the sample (see Section 4) removed the intermediate from the monitored optical path and provides the NLA signal originating from the TPA process only. The symmetric shape and the width of the dip (defined by the Rayleigh range) of the stirred sample were the same for the reference sample, therefore only the TPA process is observed when the sample is stirred. Therefore, stirring is of crucial importance to avoid overestimation of the TPA cross-section of these ruthenium complexes. This phenomenon is probably similar to the previously reported difficulties in the measurement of the TPA response of some ruthenium dendrimers [10].
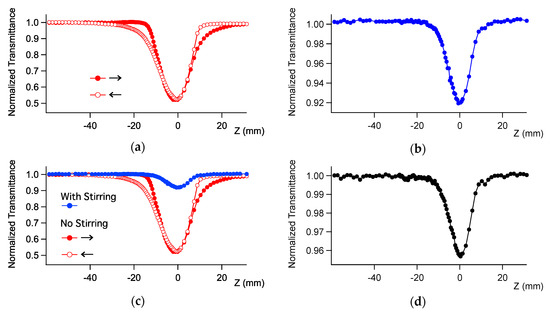
Figure 4.
Open aperture Z-scan traces of Ru-2 in dichloromethane at 960 nm (a) without and (b) with stirring sample, and (c) the comparison of the same data. The arrows in Panels (a) and (c) show the scanning directions. (d) The trace of the known sample that only shows two-photon absorption (MPPBT/DMSO, see Section 4). The incident power was 0.4 mW.
This phenomenon was observed also for complex Ru-1 and other wavelengths. Without stirring, the measurements carried out with Ru-1 and Ru-2 gave very intense apparent TPA spectra (Figure 5), which included the artifact caused by the TPA-induced transients, or products as mentioned above. By stirring the sample, the magnitude of the spectra significantly dropped. Thus, the true TPA spectra, obtained with stirring, have much smaller magnitudes than the corresponding spectra without stirring.
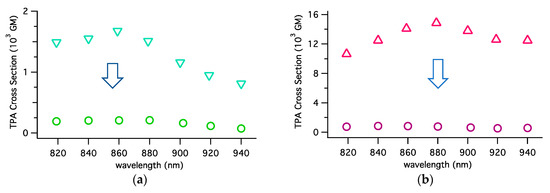
Figure 5.
Comparison of the TPA spectra of (a) Ru-1 and (b) Ru-2 complexes with (circle) or without (triangle) stirring the solution.
In Figure 6, the TPA spectrum obtained by stirring overlaps with the one-photon absorption spectrum. The TPA cross-section was measured by the following two different procedures: by changing the excitation power (power-scan procedure, filled circles with error bars in Figure 6) and by changing the excitation wavelength at a constant excitation power (WL-scan procedure, open circles), as described in Section 4. Here, is expressed in the Göppert-Mayer (GM) unit, where 1 GM (Göppert-Mayer) = 10−50 cm4 molecule−1 photon−1. The values measured by the power-scan procedure are listed in Table 2 and the corresponding open-aperture Z-scan traces with the theoretical fits are shown in Figures S1–S8 of Supplementary Materials. The observed TPA bands have transition energy corresponding to the MLCT bands located at 400–450 nm for OPA, and the TPA spectra are almost superimposable with the OPA spectra. It was not possible to measure the TPA response at wavelengths shorter than 800 nm because of overlapping with the tail of the linear absorption.
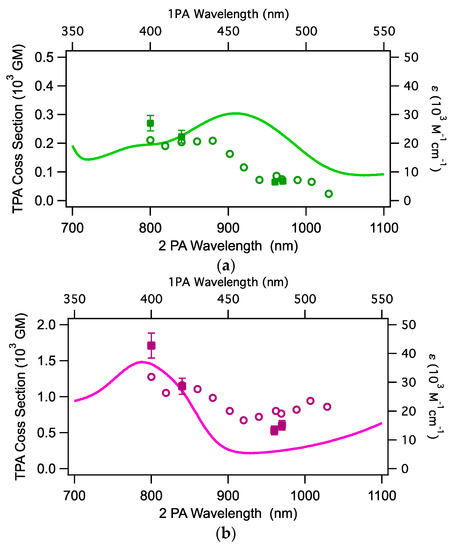
Figure 6.
One-photon (plain line) and two-photon absorption spectra of (a) Ru-1 and (b) Ru-2 in dichloromethane. The open circles are the values obtained with the WL-scan procedure and filled squares with error bars are those with the power-scan procedure (see text). For the data at 860 nm or shorter, saturable absorption (SA) of OPA was significantly observed and the analysis considering SA was employed for Ru-2.

Table 2.
TPA cross-section values obtained with the power-scan procedure.
3. Discussion
Both complexes showed moderately large TPA cross-sections at the shortest excitation wavelength, with maxima of 1700 GM for Ru-2 (D–A–D) and 280 GM for Ru-1 (A–D–A). Complex Ru-2 showed a signature of saturable absorption (SA) overlapping the dip caused by TPA (Figures S5 and S6 in Supplementary Materials). Thus, at the wavelengths where SA is significant, the values were obtained by the analysis with the SA process taken into account. It is interesting to note that the values of the binuclear complex Ru-2 at 800 nm are almost 6-times larger than those of the mononuclear complex Ru-1. This is a large enhancement if we consider that they consist of the same components. This trend lasted for the other measured wavelengths.
The enhancement of the TPA activity of Ru-2, with respect to Ru-1, can be explained by the following reasons. First, the presence of two metal centers is expected to naturally increase the TPA properties of the molecule because of the major number of highly polarizable d-electrons in the metal orbitals. These electrons are numerous and less-strictly bound to the atomic nucleus, which means that they are more mobile within the molecule when excitation occurs. In a previous paper on Ru-2, it was shown, from voltammetric results, that the two Ru atoms do not electronically communicate through the di(thienyl)benzothiadiazole bridge [14].
Besides, the structure of Ru-2 is almost flat, as shown in the optimized structure (Figure 3). The di(thienyl)benzothiadiazoles, electron acceptor units, contribute to the planarity of the branches and extend the conjugation length and the delocalization of π-electrons, as already discussed for other acceptor-core compounds [18]. On the other hand, the optimized structure shows that the structure of Ru-1 is twisted around the –C≡C–Ru–C≡C– axis, making di(thienyl)benzothiadiazole units more independent, and consequently, with less electronic communication between them. This is also supported by the similarity of the OPA peaks at 320 nm and 455 nm of Ru-1 with those of the independent di(thienyl)benzothiadiazole molecule. This difference in electronic communication between the peripheral groups for Ru-1 and Ru-2 causes the red shift of the absorption of Ru-2 (peak at 635 nm) with respect to Ru-1 (peak at 600 nm). The red shift of Ru-2 suggests resonance enhancement [19] as a possible mechanism for the enhancement of the TPA activity. Thus, we estimated the magnitude of the influence of the resonance enhancement in the following manner.
The complexes are roughly symmetric; thus, we assume the three-state model [20]
where , , are transition dipole moment, transition energy, relaxation constant between state a and state b, respectively; is reduced Planck constant, c is speed of light, and n is refractive index. The factor in the denominator is a detuning factor. Here, f, k, and g mean the final, intermediate, and ground states of the TPA transition. If the transition energy of the intermediate state approaches the halfway point of the TPA transition, is enhanced by decreasing and causes resonance enhancement. From the overlap of the TPA band and the second lowest-energy OPA peak (Figure 6) and distorted symmetry of the complexes, we assume that f is the excited state of the second lowest-energy OPA peak and k is that of the lowest-energy OPA peak. In the same manner, for the results of the MO calculation, f is taken as S4 (for Ru-1) and S11 (for Ru-2) and k is taken as S1 for both. The calculated with these transition energies and the enhancement factor, i.e. are summarized in Table 3. From the experimental values, a 4.5 times enhancement can be expected from the decrease in detuning factor . The same trend was found for the values from the MO calculations, but the values seem overestimated. As shown by Equation (1), the resonance enhancement by is not the only factor to govern the value but also the transition dipole moments, particularly [20,21], play an important role. However, this analysis suggests that the resonance enhancement caused by lowering the intermediate excited state is one of the contributing mechanisms for the large of Ru-2. Further studies, such as the analysis on the transition dipole moments, are needed to fully understand the mechanisms.

Table 3.
Estimation of the detuning factor () and enhancement factor () from the transition energies taken from the experimental and calculated results. (DCM = dichroromethane).
4. Materials and Methods
4.1. General
UV-visible absorption spectra of the samples were measured with a spectrophotometer (Shimadzu UV3150, Kyoto, Japan), using 1-cm quartz cells. Spectroscopic grade dichloromethane was used as solvent. Ru-1 and Ru-2 were synthesized as previously reported [4,5,14].
4.2. Nonlinear Absorption Measurements
Nonlinear optical measurements were performed by the Z-scan method [22] with a femtosecond optical parametric amplifier (Spectra-Physics TOPAS Prime, operating at 1 kHz, Santa Clara, CA, USA) as the light source. The home-made setup reported elsewhere [23] was used to obtain the spectrum. Pulse width of the laser (95–130 fs, depending on the wavelength, in full width at half maximum in Gaussian fit) was measured at each wavelength and used for the calculation of the TPA cross-section. The sample solution was held in a quartz cell with a path length of 2 mm, which is shorter than the Rayleigh rang used (4–5 mm), and filled the thin sample condition [22]. A micro magnetic stirring bar (1.5 mm in diameter and 8 mm in length), whose polytetrafluoroethylene coating was thinned with a knife, was used for stirring the sample solution. The thinned stirring bar, placed in the 2-mm cell, can rotate vertically, driven by a small magnetic stirrer head placed under the cell. As for nonlinear absorption (NLA) data, the open-aperture configuration was employed to record the transmittance of the whole beam passed through the sample, which was plotted against the position of the sample scanned along the propagating direction of the laser beam. The NLA appeared as depression of transmittance around the focal point. The obtained open-aperture traces were analyzed with the theoretical equation for the transmittance T of the spatial and temporal Gaussian pulses, assuming only TPA as the NLA process involved [23]
where and are the normalized sample positions, is the focal position, is the Rayleigh range, is the linear transmittance of the sample, R is the Fresnel reflectance at the cell wall. The on-axis peak two-photon absorbance at the focal point () is
and it is proportional to the TPA coefficient , the on-axis peak intensity of the laser pulse at the focal point , and the effective path length . Here, is the linear (one-photon) absorption coefficient and is the physical pathlength. Thus, . TPA cross-section was calculated based on the convention
where N is number density of molecules and Eph is the photon energy of the incident light.
Saturable absorption (SA) is the phenomenon, where decrease of absorption (and thus, increase in transmittance) occurs as the excitation intensity increases, because of population depression in the initial state of the transition. The above-mentioned analysis is modified for the case that the SA of one photon absorption was observed, by phenomenologically introducing the intensity-dependent absorption coefficient as [24]:
where is the saturation intensity at which and is the intensity-independent absorption coefficient. Open-aperture Z-scan trace of the M-letter-like shape, i.e., the dip at the focal point and positive peaks both side of it, can be analyzed by replacing in the previous equations with in Equation (5).
The transmittance change can occur not only by the process of interest (here, TPA) but also by any other trivial processes. We have changed excitation power (for 0.07–0.4 mW, corresponding to of 25–160 GW/cm2) at some wavelengths (called the power-scan procedure). With this procedure, we confirmed both that the observed open-aperture Z-scan trace is reproduced by Equation (2) and that the power dependence of the obtained is proportional to the excitation power as predicted in Equation (3), which is reliable evidence to show that the observed NLA is ascribed to the TPA process. Moreover, the TPA spectra were obtained by changing the wavelength with a small step while keeping the excitation power (called as WL-scan procedure). The excitation power was 0.4 mW and corresponded to of 160–250 GW/cm2 depending on the wavelength. The agreement between the data obtained by WL-scan with that by power-scan procedures ensured that the obtained spectra are ascribed to the TPA process. In-house standard compound (1,4-bis(2,5-dimethoxy-4-{2-[4-(N-methyl)pyridin-1-iumyl]ethenyl}-phenyl)butadiyne triflate (MPPBT) [20] in dimethyl sulfoxide) was measured at the same time for all samples and used for the spectral correction of the TPA cross-section.
5. Conclusions
In this work, the TPA cross-sections of one mononuclear complex and one dinuclear Ru(II) complex were investigated. During the measurements, a large artifact was found due to the formation, by TPA-induced photochemical reaction, of an intermediate that absorbs more of the incident laser light. This artifact, which causes overestimation of values by at least ten times, was removed by stirring the solution with a magnetic stirrer, thus allowing the measurement of the TPA cross-section of these complexes with good reproducibility and small uncertainty.
The values of these ruthenium complexes are moderately large: 1700 GM for Ru-2 and 280 GM for Ru-1, even though they are somehow lower than those of recently reported Ru(II) alkynyl complexes [25,26]. Interestingly, the dinuclear complex Ru-2 showed a significant enhancement (~6 times) of with respect to the mononuclear complex Ru-1, though the magnitudes of the OPA spectra were almost the same. As expected by the presence of two metal units, the binuclear complex Ru-2 displays better nonlinear absorption, but the enhancement is more than the Ru number effect. The DFT calculations put in evidence the difference of planarity for the complexes and the red-shift of the absorption band on going from Ru-1 to Ru-2. The lowering of the excited state further supports the difference in the detuning factor for the three-state model of . This suggests that the small detuning energy of Ru-2 is one of the probable reasons for the enhancement. The difference in the configurational arrangement of the subunits causes a difference in planarity and in the number of metal cores, directly linked to the magnitude of . Although our results do not provide a clear understanding of the origin of the TPA response, they give some key insights, suggesting that a suitable arrangement of Ru(II) σ-acetylide, as the donor unit, and di(thienyl)benzothiadiazole, as the acceptor unit, is a novel route for the preparation of promising TPA materials.
Supplementary Materials
The following are available online at https://www.mdpi.com/2304-6740/7/5/67/s1. Figures S1–S4: Open-aperture Z-scan traces at different incident powers of Ru-1 at different wavelengths with theoretical curve fits. Figures S5–S8: Open-aperture Z-scan traces at different incident powers of Ru-2 at different wavelengths with theoretical curve fits. Table S1: Results of the TD-DFT calculations of transition energy, wavelength, oscillator strength, electronic configuration and the contribution of the 12 lowest excited states of Ru-1 and Ru-2.
Author Contributions
Preparation of Ru-1 and Ru-2 was performed by C.D. and A.C.; measurements, analysis, and preparation of the manuscript draft was performed by E.G.; the project was conceived, designed, and supervised by K.K. and D.R.; the final revision of the manuscript was made by all the authors.
Funding
This work was supported by MIUR and National Interuniversity Consortium of Materials Science and Technology (Project INSTMMI012) in Italy, and by a Grant-in-Aid for Scientific Research on Innovative Areas ‘‘Photosynergetics’’ (no. JP26107004, K.K.) from MEXT and a Grant-in-Aid for Scientific Research (no. JP25248007 and 18H01943, K.K.) from JSPS, Japan.
Acknowledgments
We deeply thank Professor Renato Ugo for his excellent guidance in the field of nonlinear optics.
Conflicts of Interest
The authors declare no conflict of interest.
References
- He, G.S.; Tan, L.-S.; Zheng, Q.; Prasad, P.N. Multiphoton absorbing materials: Molecular designs, characterizations, and applications. Chem. Rev. 2008, 108, 1245–1330. [Google Scholar] [CrossRef] [PubMed]
- Pawlicki, M.; Collins, H.A.; Denning, R.G.; Anderson, H.L. Two-photon absorption and the design of two-photon dyes. Angew. Chem. Int. Ed. 2009, 48, 3244–3266. [Google Scholar] [CrossRef]
- Fillaut, J.L. Design of ruthenium–alkynyl complexes as nonlinear optical chromophores. Display Imaging 2016, 2, 115–134. [Google Scholar]
- Colombo, A.; Nisic, F.; Dragonetti, C.; Marinotto, D.; Oliveri, I.P.; Righetto, S.; Lobello, M.G.; De Angelis, F. Unexpectedly high second-order nonlinear optical properties of simple Ru and Pt alkynyl complexes as an analytical springboard for NLO-active polymer films. Chem. Commun. 2014, 50, 7986–7989. [Google Scholar] [CrossRef] [PubMed]
- Nisic, F.; Colombo, A.; Dragonetti, C.; Garoni, E.; Marinotto, D.; Righetto, S.; De Angelis, F.; Lobello, M.G.; Salvatori, P.; Biagini, P.; et al. Functionalized ruthenium dialkynyl complexes with high second-order nonlinear optical properties and good potential as dye sensitizers for solar cells. Organometallics 2015, 34, 94–104. [Google Scholar] [CrossRef]
- Colombo, A.; Dragonetti, C.; Marinotto, D.; Righetto, S.; Griffini, G.; Turri, S.; Akdas-Kilig, H.; Fillaut, J.L.; Amar, A.; Boucekkine, A.; et al. Nonlinear optical properties of intriguing Ru σ-acetylide complexes and the use of a photocrosslinked polymer as a springboard to obtain SHG active thin films. Dalton Trans. 2016, 45, 11052–11060. [Google Scholar] [CrossRef]
- Durand, R.J.; Gauthier, S.; Achelle, S.; Groizard, T.; Kahlal, S.; Saillard, J.Y.; Barsella, A.; Le Poul, N.; Robin Le Guen, F. Push–pull D–π–Ru–π–A chromophores: Synthesis and electrochemical, photophysical and second-order nonlinear optical properties. Dalton Trans. 2018, 47, 3965–3975. [Google Scholar] [CrossRef]
- McDonagh, A.M.; Humphrey, M.G.; Samoc, M.; Luther-Davies, B. Organometallic complexes for nonlinear optics. 17. Synthesis, third-order optical nonlinearities, and two-photon absorption cross section of an alkynylruthenium dendrimer. Organometallics 1999, 18, 5195–5197. [Google Scholar] [CrossRef]
- McDonagh, A.M.; Powell, C.E.; Morrall, J.P.; Cifuentes, M.P.; Humphrey, M.G. Convergent synthesis of alkynylbis(bidentatephosphine)ruthenium dendrimers. Organometallics 2003, 22, 1402–1413. [Google Scholar] [CrossRef]
- Roberts, R.L.; Schwich, T.; Corkery, T.C.; Cifuentes, M.P.; Green, K.A.; Farmer, J.D.; Low, P.J.; Marder, T.B.; Samoc, M.; Humphrey, M.G. Organometallic Complexes for Nonlinear Optics. 45. Dispersion of the Third-Order Nonlinear Optical Properties of Triphenylamine-Cored Alkynylruthenium Dendrimers. Adv. Mater. 2009, 21, 2318–2322. [Google Scholar] [CrossRef]
- Simpson, P.V.; Watson, L.A.; Barlow, A.; Wang, G.; Cifuentes, M.P.; Humphrey, M.G. Record Multiphoton Absorption Cross-Sections by Dendrimer Organometalation. Angew. Chem. Int. Ed. Engl. 2016, 55, 2387–2391. [Google Scholar] [CrossRef]
- Girardot, C.; Lemercier, G.; Mulatier, J.-C.; Chauvin, J.; Baldeck, P.L.; Andraud, C. Novel ruthenium(II) and zinc(II) complexes for two-photon absorption related applications. Dalton Trans. 2007, 3421–3426. [Google Scholar] [CrossRef] [PubMed]
- Akl, J.; Sasaki, I.; Lacroix, P.G.; Hugues, V.; Vicendo, P.; Bocé, M.; Mallet-Ladeira, S.; Blanchard-Desce, M.; Malfant, I. trans- and cis-(Cl,Cl)-[RuII(FT)Cl2(NO)](PF6): promising candidates for NO release in the NIR region. Photochem. Photobiol. Sci. 2016, 15, 1484–1491. [Google Scholar] [CrossRef]
- Colombo, A.; Dragonetti, C.; Roberto, D.; Ugo, R.; Falciola, L.; Luzzati, S.; Kotowski, D. A Novel Diruthenium Acetylide Donor Complex as an Unusual Active Material for Bulk Heterojunction Solar Cells. Organometallics 2011, 30, 1279–1282. [Google Scholar] [CrossRef]
- Canola, S.; Mardegan, L.; Bergamini, G.; Villa, M.; Acocella, A.; Zangoli, M.; Ravotto, L.; Vinogradov, S.A.; Di Maria, F.; Ceroni, P.; et al. One- and two-photon absorption properties of quadrupolar thiophene-based dyes with acceptors of varying strengths. Photochem. Photobiol. Sci. 2019. [Google Scholar] [CrossRef] [PubMed]
- Garoni, E.; Nisic, F.; Colombo, A.; Fantacci, S.; Griffini, G.; Kamada, K.; Roberto, D.; Dragonetti, C. Perylenetetracarboxy-3,4:9,10-diimide derivatives with large two-photon absorption activity. New J. Chem. 2019, 43, 1885–1893. [Google Scholar] [CrossRef]
- Iagatti, A.; Patrizi, B.; Basagni, A.; Marcelli, A.; Alessi, A.; Zanardi, S.; Fusco, R.; Salvalaggio, M.; Bussotti, L.; Foggi, P. Photophysical properties and excited state dynamics of 4,7-dithien-2-yl-2,1,3-benzothiadiazole. Phys. Chem. Chem. Phys. 2017, 19, 13604–13613. [Google Scholar] [CrossRef] [PubMed]
- Liu, X.T.; Zhao, Y.; Ren, A.M.; Feng, J.K. A comparative study of one- and two-photon absorption properties of pyrene and perylene diimide derivatives. J. Mol. Model. 2011, 17, 1413–1425. [Google Scholar] [CrossRef]
- Kamada, K.; Ohta, K.; Yoichiro, I.; Kondo, K. Two-photon absorption properties of symmetric substituted diacetylene: Drastic enhancement of the cross section near the one-photon absorption peak. Chem. Phys. Lett. 2003, 372, 386–393. [Google Scholar] [CrossRef]
- Kamada, K.; Iwase, Y.; Sakai, K.; Kondo, K.; Ohta, K. Cationic two-photon absorption chromophores with double- and triple-bond cores in symmetric/asymmetric arrangements. J. Phys. Chem. C 2009, 113, 11469–11474. [Google Scholar] [CrossRef]
- Albota, M.; Beljonne, D.; Brédas, J.-L.; Ehrlich, J.E.; Fu, J.-Y.; Heikal, A.A.; Hess, S.E.; Kogej, T.; Levin, M.D.; Marder, S.R.; et al. Design of Organic Molecules with Large Two-Photon Absorption Cross Sections. Science 1998, 281, 1653–1656. [Google Scholar] [CrossRef] [PubMed]
- Sheik-Bahae, M.; Said, A.A.; Wei, T.H.; Hagan, D.J.; Van Stryland, E.W. Sensitive measurement of optical nonlinearities using a single beam. IEEE J. Quantum Electron. 1990, 26, 760–769. [Google Scholar] [CrossRef]
- Kamada, K.; Matsunaga, K.; Yoshino, A.; Ohta, K. Two-photon-absorption-induced accumulated thermal effect on femtosecond Z-scan experiments studied with time-resolved thermal-lens spectrometry and its simulation. J. Opt. Soc. Am. B 2002, 20, 529–537. [Google Scholar] [CrossRef]
- Kamada, K.; Ohta, K.; Kubo, T.; Shimizu, A.; Morita, Y.; Nakasuji, K.; Kishi, R.; Ohta, S.; Furukawa, S.; Takahashi, H.; et al. Strong two-photon absorption of singlet diradical hydrocarbons. Angew. Chem. Int. Ed. 2007, 46, 3544–3546. [Google Scholar] [CrossRef] [PubMed]
- Triadon, A.; Grelaud, G.; Richy, N.; Mongin, O.; Moxey, G.J.; Dixon, I.M.; Yang, X.; Wang, G.; Barlow, A.; Rault-Berthelot, J.; et al. Linear and Third-Order Nonlinear Optical Properties of Fe(η5-C5Me5)(κ2-dppe)- and trans-Ru(κ2-dppe)2-Alkynyl Complexes Containing 2-Fluorenyl End Groups. Organometallics 2018, 37, 2245–2262. [Google Scholar] [CrossRef]
- Chen, Z.; Jeffery, C.J.; Morshedi, M.; Moxey, G.J.; Barlow, A.; Yang, X.; Babgi, B.A.; Dalton, G.T.; Randles, M.D.; Smith, M.K.; et al. Syntheses, Electrochemical, Linear Optical, and Cubic Nonlinear Optical Properties of Ruthenium–Alkynyl-Functionalized Oligo(phenylenevinylene) Stars. ChemPlusChem 2015, 80, 1329–1340. [Google Scholar] [CrossRef]
© 2019 by the authors. Licensee MDPI, Basel, Switzerland. This article is an open access article distributed under the terms and conditions of the Creative Commons Attribution (CC BY) license (http://creativecommons.org/licenses/by/4.0/).