Investigation of the Reduction of a Molybdenum/Iron Molecular Nanocluster Single Source Precursor


Abstract
:
1. Introduction
2. Materials and Methods
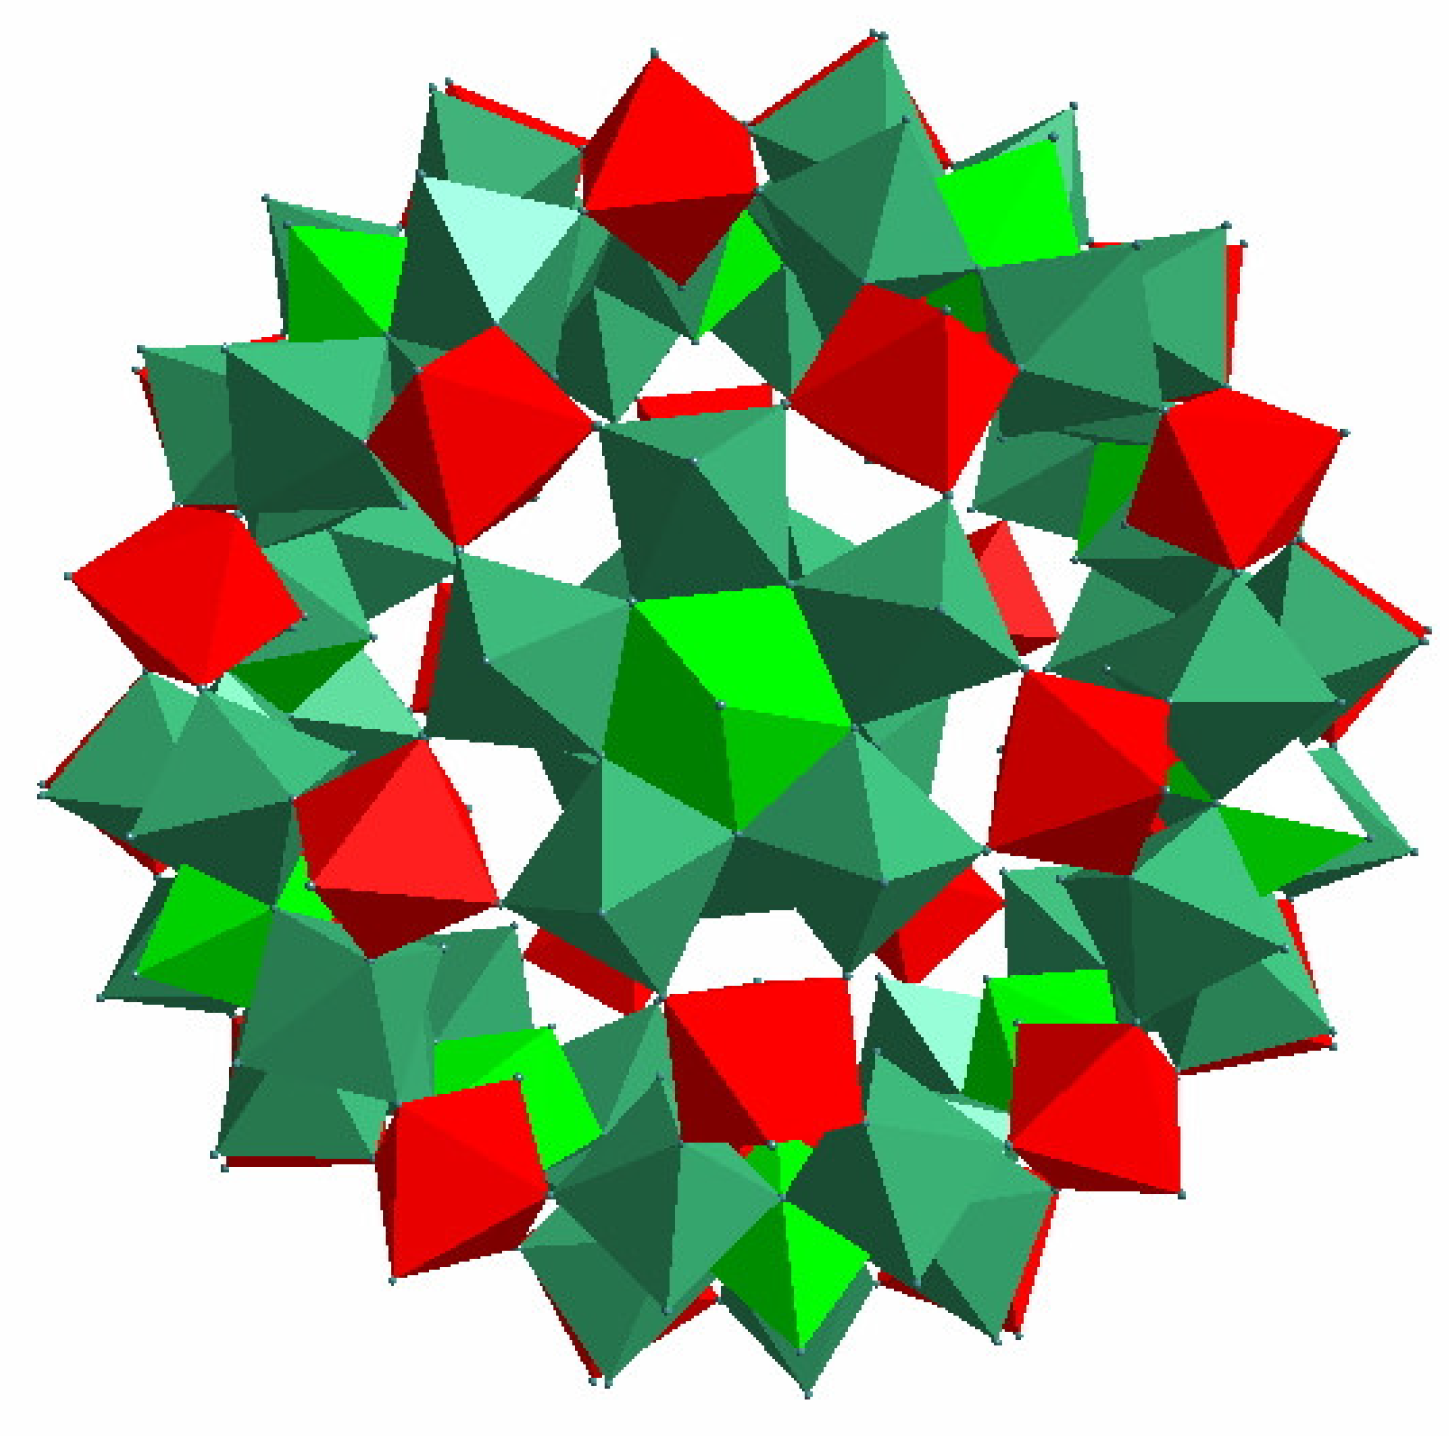
2.1. [HxPMo12O40⊂H4Mo72Fe30(O2CMe)15O254(H2O)90−y(EtOH)y] (1) Synthesis
2.2. Reduction Experiments
2.3. Characterization
3. Results and Discussion
Synthesis and Characterization of [HxPMo12O40⊂H4Mo72Fe30(O2CMe)15O254(H2O)90−y(EtOH)y] (1)
4. Conclusions
Author Contributions
Funding
Conflicts of Interest
References
- Bochmann, M. Metal chalcogenide materials: Chalcogenolato complexes as “single-source” precursors. Chem. Vap. Depos. 1996, 2, 85–96. [Google Scholar] [CrossRef]
- Maury, F. Organometallic molecular precursors for low-temperature MOCVD of III–V semiconductors. Adv. Mater. 1991, 3, 542–548. [Google Scholar] [CrossRef]
- Barron, A.R.; Rees, W.S., Jr. Group 2 compounds as CVD-precursors for electronic materials. Adv. Mater. Opt. Electron. 1993, 2, 271–288. [Google Scholar] [CrossRef]
- Cowley, A.H.; Jones, R.A. Single-source III/V precursors: a new approach to gallium arsenide and related semiconductors. Angew. Chem. Int. Ed. Engl. 1989, 28, 1208–1215. [Google Scholar] [CrossRef]
- MacInnes, A.N.; Power, M.B.; Barron, A.R. Chemical vapor deposition of cubic gallium sulfide thin films: A new meta-stable phase. Chem. Mater. 1992, 4, 11–14. [Google Scholar] [CrossRef]
- Keys, A.; Bott, S.G.; Barron, A.R. MOCVD growth of gallium sulfide using di-tert-butyl gallium dithocarbamate precursors: formation of a metastable phase of GaS. Chem. Mater. 1999, 11, 3578–3587. [Google Scholar] [CrossRef]
- Shields, J.A. Applications of Molybdenum Metal and Its Alloys; International Molybdenum Association (IMOA): London, UK, 2013. [Google Scholar]
- Horn, T.J.; Harrysson, O.L.A. Overview of current additive manufacturing technologies and selected applications. Sci. Prog. 2012, 95, 255–282. [Google Scholar] [CrossRef] [PubMed]
- Belitskus, D. Aluminothermic production of metals and alloys. JOM 1972, 24, 30–34. [Google Scholar] [CrossRef]
- Kim, B.-S.; Kim, S.-B.; Lee, H.-I.; Choi, Y.-Y. A novel process for producing ferromolybdenum powder master alloy without generating secondary pollutants through a two-step hydrogen reduction process. Mater. Trans. 2011, 52, 1288–1293. [Google Scholar] [CrossRef]
- Morales, R. Kinetics of reduction of FeO–Fe2MoO4–MoO2 mixtures toward the production of Fe–Mo alloys. Scand. J. Metall. 2003, 32, 263–272. [Google Scholar] [CrossRef]
- Rajabi, J.; Muhamad, N.; Sulong, A.B.; Fayyaz, A.; Wahi, A. Advantages and limitations of using nano sized powders for powder injection molding process: A review. J. Teknol. 2012, 59, 137–140. [Google Scholar]
- Wanjala, B.N.; Fang, B.; Shan, S.; Petkov, V.; Zhu, P.; Loukrakpam, R.; Chen, Y.; Luo, J.; Yin, J.; Yang, L.; et al. Design of ternary nanoalloy catalysts: effect of nanoscale alloying and structural perfection on electrocatalytic enhancement. Chem. Mater. 2012, 24, 4283–4293. [Google Scholar] [CrossRef]
- Mandal, M.; Kundu, S.; Sau, T.K.; Yusuf, S.M.; Pal, T. Synthesis and characterization of superparamagnetic Ni−Pt nanoalloy. Chem. Mater. 2003, 15, 3710–3715. [Google Scholar] [CrossRef]
- Reetz, M.T.; Helbig, W. Size-selective synthesis of nanostructured transition metal clusters. J. Am. Chem. Soc. 1994, 116, 7401–7402. [Google Scholar] [CrossRef]
- Abdelsayed, V.; Aljarash, A.; El-Shall, M.S.; Al Othman, Z.A.; Alghamdi, A.H. Microwave synthesis of bimetallic nanoalloys and co oxidation on ceria-supported nanoalloys. Chem. Mater. 2009, 21, 2825–2834. [Google Scholar] [CrossRef]
- Mizukoshi, Y.; Fujimoto, T.; Nagata, Y.; Oshima, R.; Maeda, Y. Characterization and catalytic activity of core−shell structured gold/palladium bimetallic nanoparticles synthesized by the sonochemical method. J. Phys. Chem. B 2000, 104, 6028–6032. [Google Scholar] [CrossRef]
- Choi, C.J.; Tolochko, O.; Kim, B.K. Preparation of iron nanoparticles by chemical vapor condensation. Mater. Lett. 2002, 56, 289–294. [Google Scholar] [CrossRef]
- Fecht, H.J.; Hellstern, E.; Fu, Z.; Johnson, W.L. Nanocrystalline metals prepared by high-energy ball milling. Metall. Trans. A 1990, 21, 2333–2337. [Google Scholar] [CrossRef]
- Müller, A.; Das, S.K.; Kögerler, P.; Bögge, H.; Schmidtmann, M.; Trautwein, A.X.; Schunemann, V.; Krickemeyer, E.; Preetz, W. A new type of supramolecular compound: Molybdenum-oxide-based composites consisting of magnetic nanocapsules with encapsulated keggin-ion electron reservoirs cross-linked to a two-dimensional network. Angew. Chem. Int. Ed. 2000, 39, 3413–3417. [Google Scholar] [CrossRef]
- Anderson, R.E.; Colorado, R., Jr.; Crouse, C.; Ogrin, D.; Maruyama, B.; Pender, M.J.; Edwards, C.L.; Whitsitt, E.; Moore, V.C.; Koveal, D.; et al. A study of the formation, purification, and application as a SWNT growth catalyst of the nanocluster [HxPMo12O40⊂H4Mo72Fe30(O2CMe)15O254(H2O)98]. Dalton Trans. 2006, 3097–3107. [Google Scholar] [CrossRef] [PubMed]
- Ogrin, D.; Anderson, R.E.; Colorado, R., Jr.; Maruyama, B.; Pender, M.J.; Moore, V.C.; Pheasant, S.T.; McJilton, L.; Schmidt, H.K.; Hauge, R.H.; et al. Amplification of single walled carbon nanotubes from designed seeds: separation of nucleation and growth. J. Phys. Chem. C 2007, 111, 17804–17806. [Google Scholar] [CrossRef]
- Ogrin, D.; Barron, A.R. Coordination chemistry of the nanocluster [HxPMo12O40⊂H4Mo72Fe30(O2CMe)15O254(H2O)98]. J. Clust. Sci. 2007, 18, 113–120. [Google Scholar] [CrossRef]
- Esquenazi, G.L.; Barron, A.R. Understanding the “activation” of the nanocluster [HxPMo12O40⊂H4Mo72Fe30(O2CMe)15O254(H2O)98−y(EtOH)y] for low temperature growth of carbon nanotubes. J. Clust. Sci. 2018, 29, 431–441. [Google Scholar] [CrossRef]
- Esquenazi, G.L.; Brinson, B.; Barron, A.R. Catalytic growth of carbon nanotubes by direct liquid injection CVD using the nanocluster [HxPMo12O40⊂H4Mo72Fe30(O2CMe)15O254(H2O)98−y(EtOH)y]. C 2018, 4, 17. [Google Scholar] [CrossRef]
- Esquenazi, G.L.; Barron, A.R. Reduction kinetics of the nanocluster [HxPMo12O40⊂H4Mo72Fe30(O2CMe)15O254(H2O)98−y(EtOH)y]. J. Clust. Sci. 2018, 29, 325–335. [Google Scholar] [CrossRef]
- Gulbransen, E.A.; Andrew, K.F.; Brassart, F.A. Oxidation of molybdenum 550 °C to 1700 °C. J. Electrochem. Soc. 1963, 110, 952–959. [Google Scholar] [CrossRef]
- Gonzalez, F.J.; Halloran, J.W. Reaction of orthophosphoric acid with several forms of aluminum oxide. Am. Ceram. Soc. Bull. 1980, 59, 727–731. [Google Scholar]
- Fahlman, B.D.; Bott, S.G.; Barron, A.R. An accuracy assessment of the refinement of partial metal disorder in solid solutions of Al(acac)3 and Cr(acac)3. J. Chem. Soc. Dalton Trans. 2001, 2148–2152. [Google Scholar] [CrossRef]
- Zakeri, M.; Rahimipour, M.R.; Khanmohammadian, A. Mechanically activated synthesis of nanocrystalline ternary carbide Fe3Mo3C. Mater. Sci. Eng. A 2008, 492, 311–316. [Google Scholar] [CrossRef]
- Morales, R.; Arvanitidis, I.; Sichen, D.; Seetharaman, S. Reduction of Fe2MoO4 by hydrogen gas. Metall. Mater. Trans. B 2002, 33, 589–594. [Google Scholar] [CrossRef]


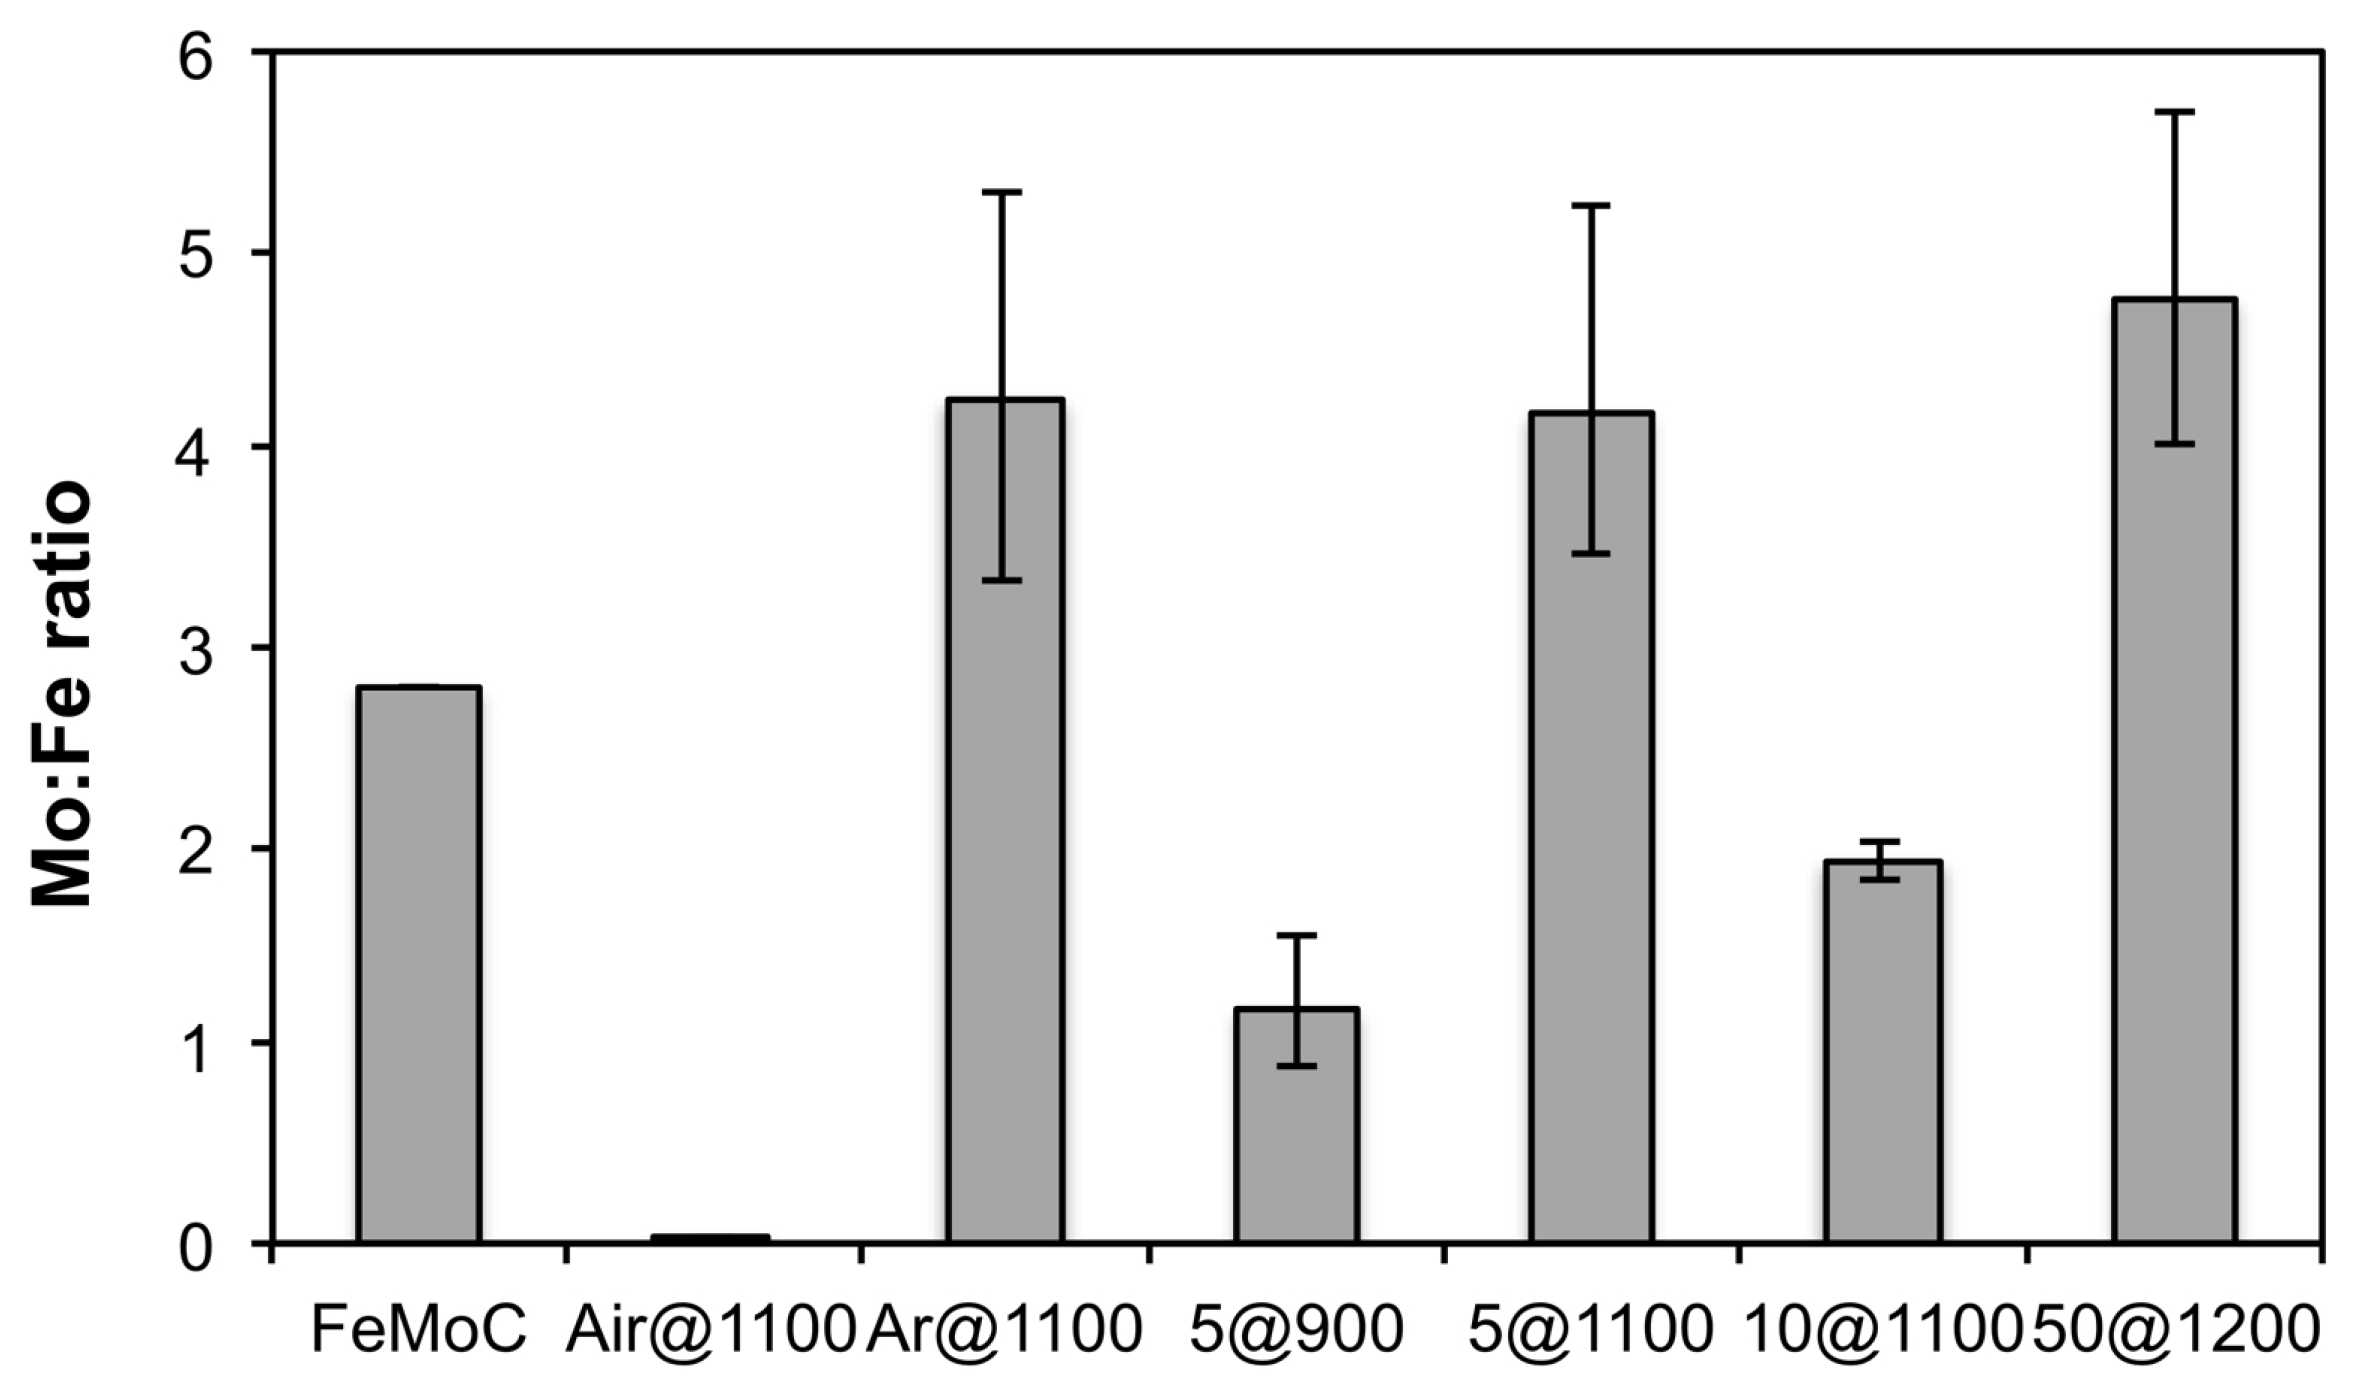
| Experiment | Atmosphere | Temperature (°C) | Acronym |
|---|---|---|---|
| 1 | Air | 1100 | Air@1100 |
| 2 | Ar | 1100 | Ar@1100 |
| 3 | 5% H2 (Ar balance) | 900 | 5@900 |
| 4 | 5% H2 (Ar balance) | 1100 | 5@1100 |
| 5 | 10% H2 (Ar balance) | 1100 | 10@1100 |
| 6 | 50% H2 (Ar balance) | 1200 | 50@1200 |
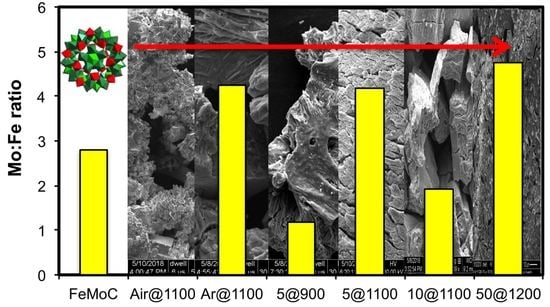
| Sample | Mo (at %) | Fe (at %) | O (at %) | C (at %) | P (at %) |
|---|---|---|---|---|---|
| Air@1100 | 0.80 ± 0.36 | 38.98 ± 4.31 | 47.81 ± 3.89 | 8.26 ± 0.83 | 4.15 ± 0.64 |
| Ar@1100 | 38.42 ± 6.63 | 9.03 ± 0.51 | 50.54 ± 6.79 | 1.24 ± 0.76 | 0.77 ± 0.12 |
| 5@900 | 31.18 ± 4.28 | 26.40 ± 3.75 | 18.17 ± 2.24 | 20.27 ± 6.21 | 3.95 ± 1.06 |
| 5@1100 | 64.64 ± 2.65 | 15.43 ± 2.51 | 18.50 ± 4.11 | 0.36 ± 0.35 | 18.50 ± 4.11 |
| 10@1100 | 65.59 ± 1.54 | 34.41 ± 1.54 | b | b | b |
| 50@1200 | 76.18 ± 3.75 | 16.27 ± 2.79 | 6.42 ± 3.35 | b | 0.84 ± 0.75 |
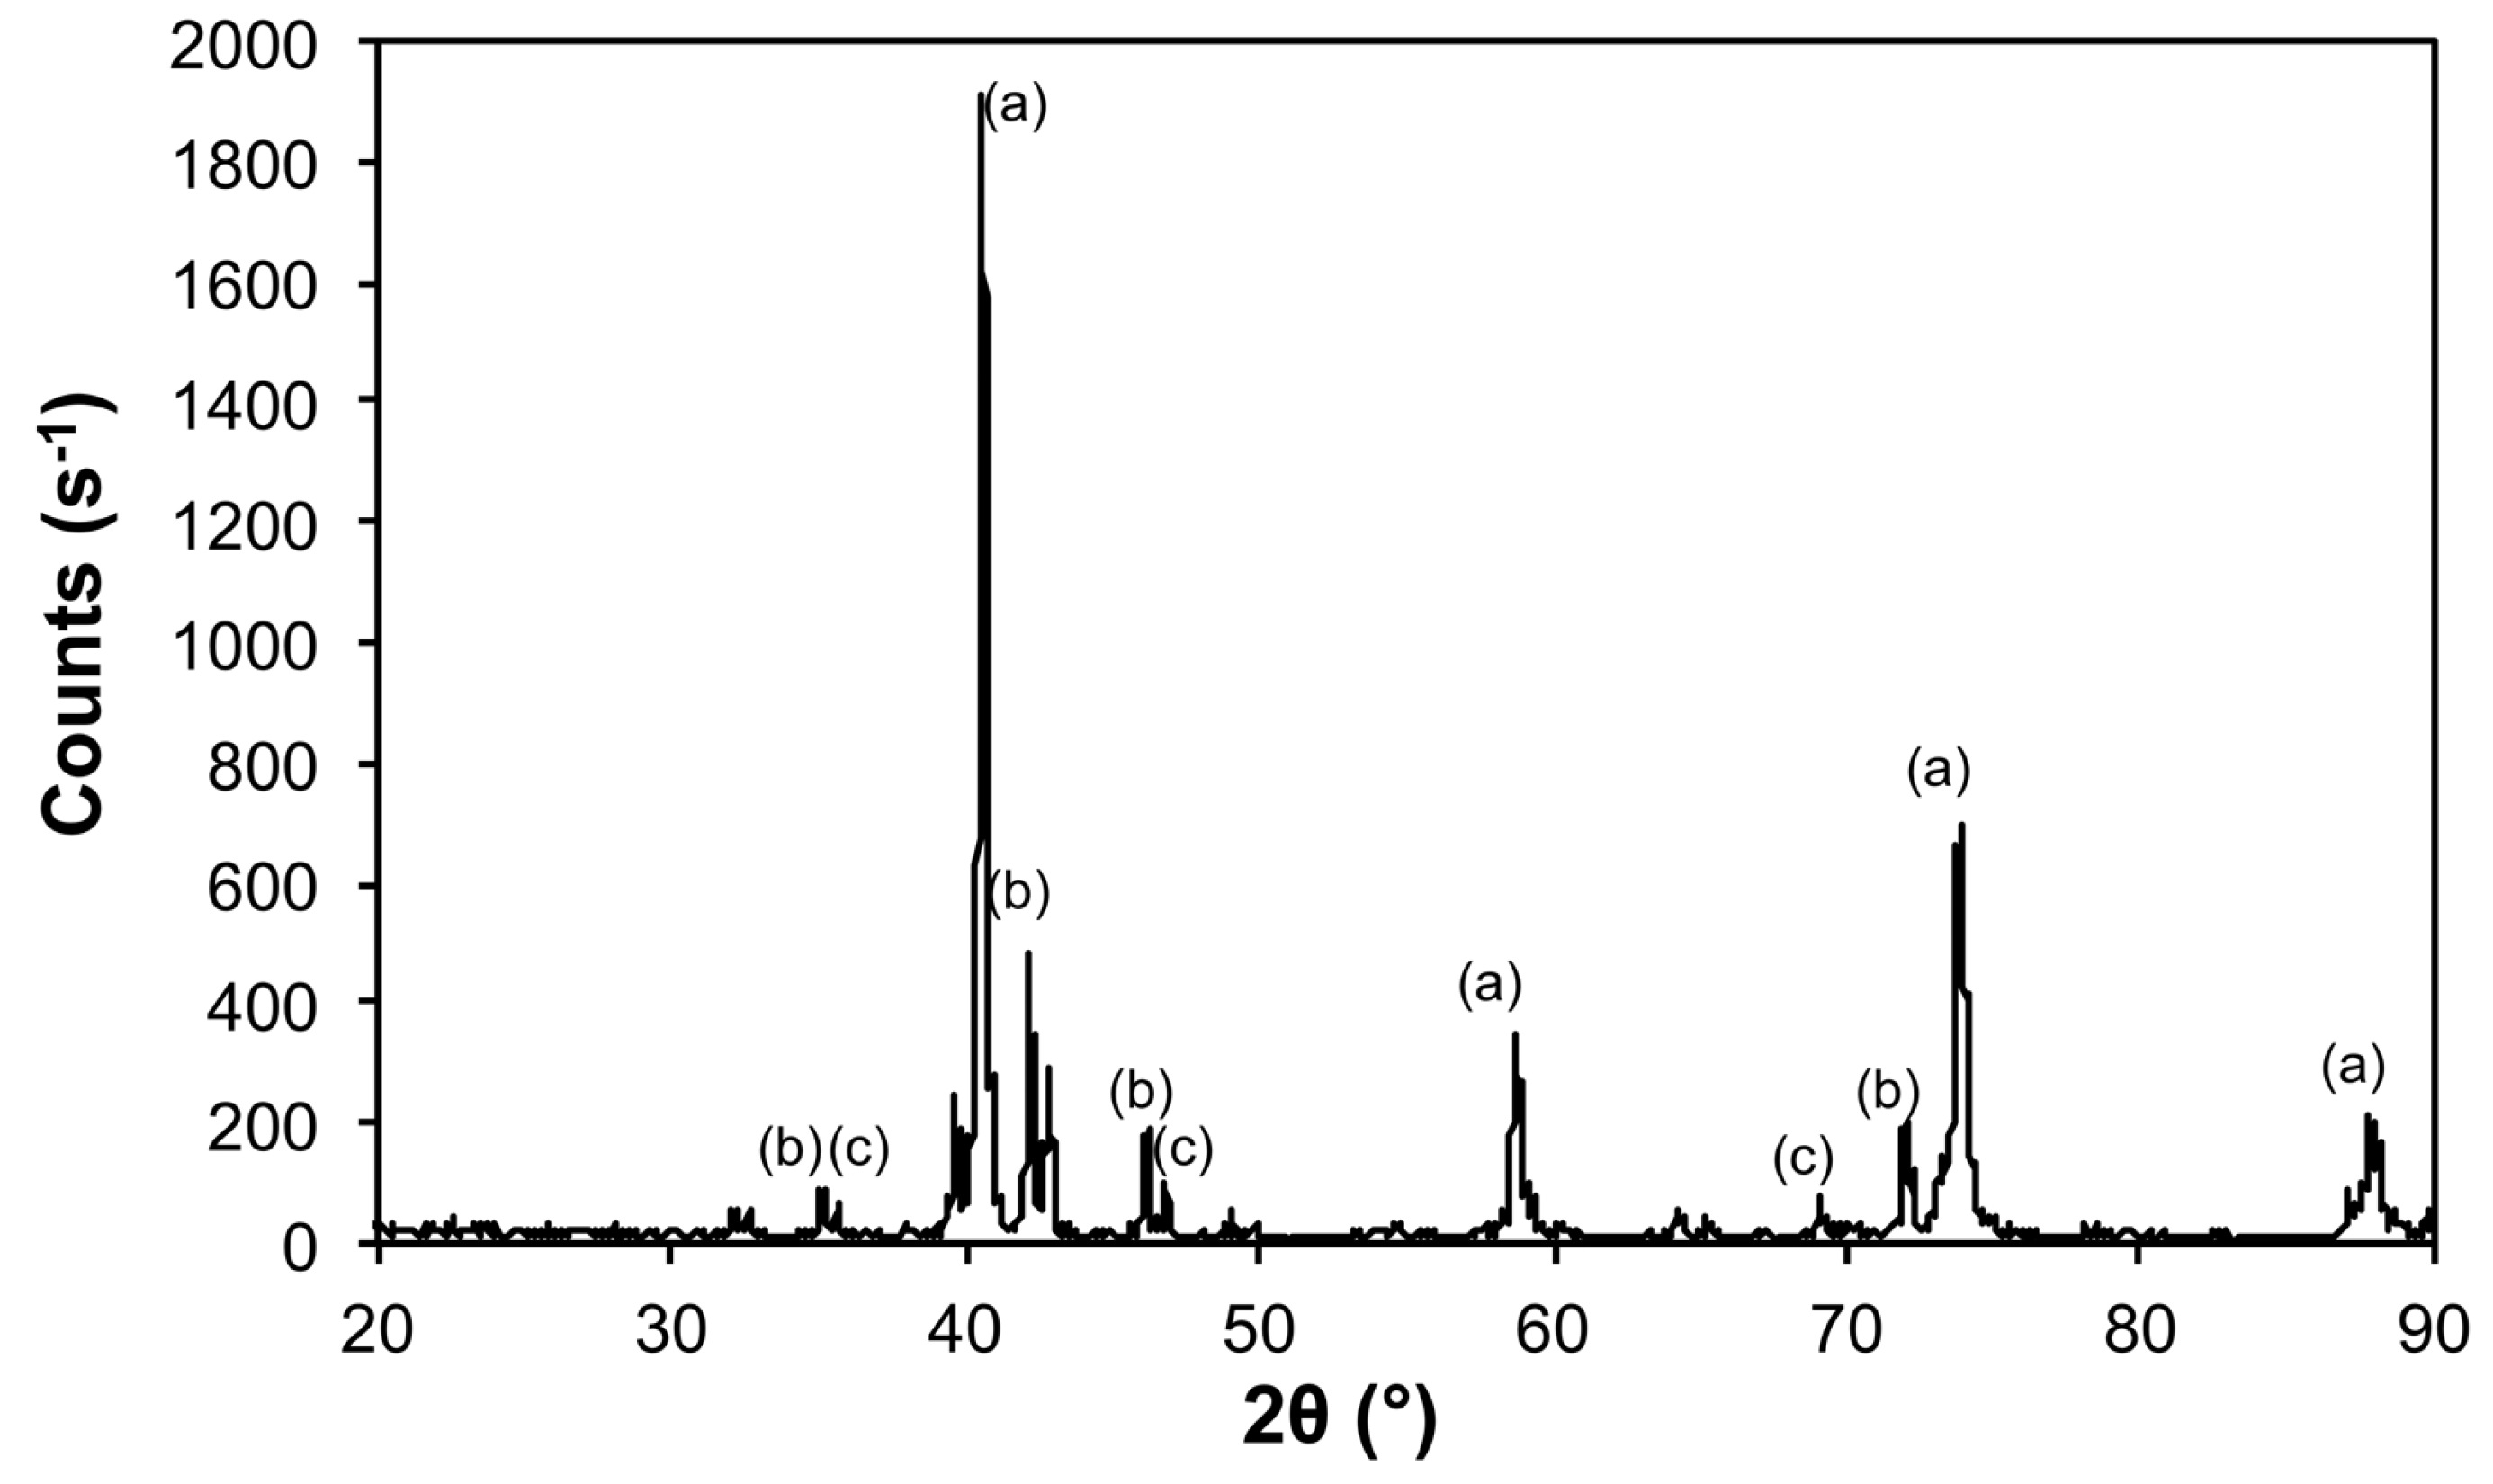
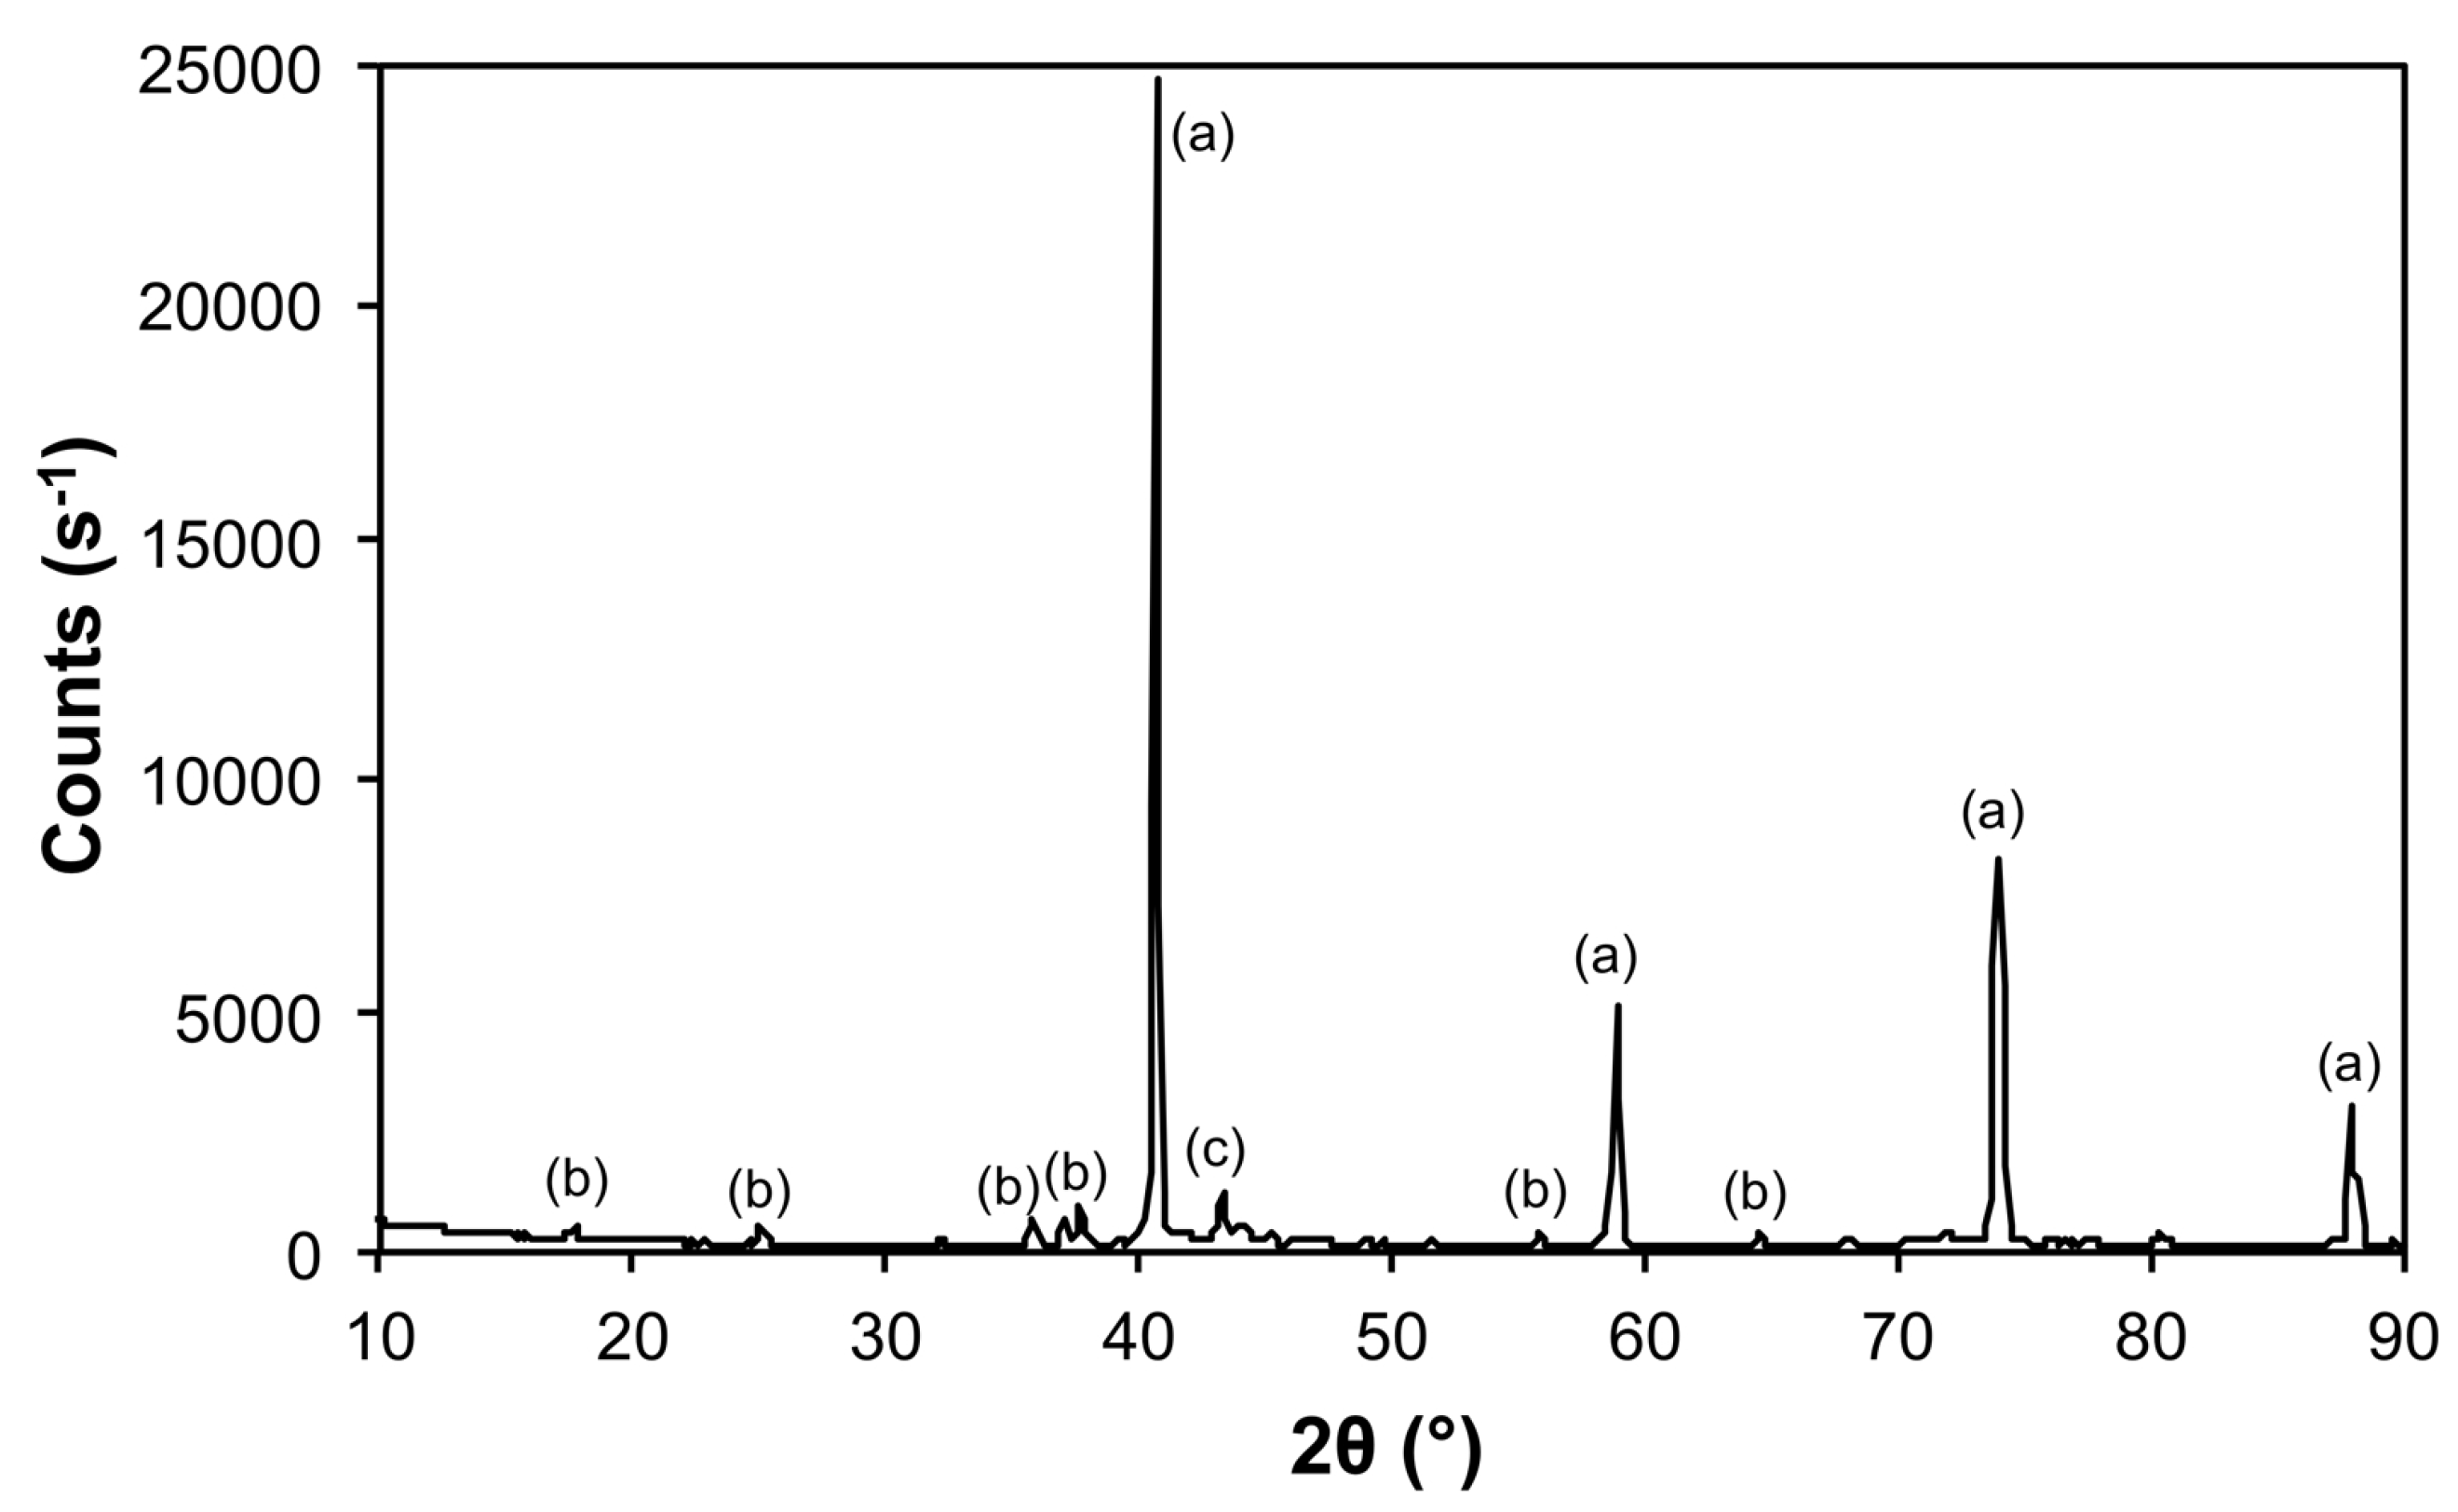
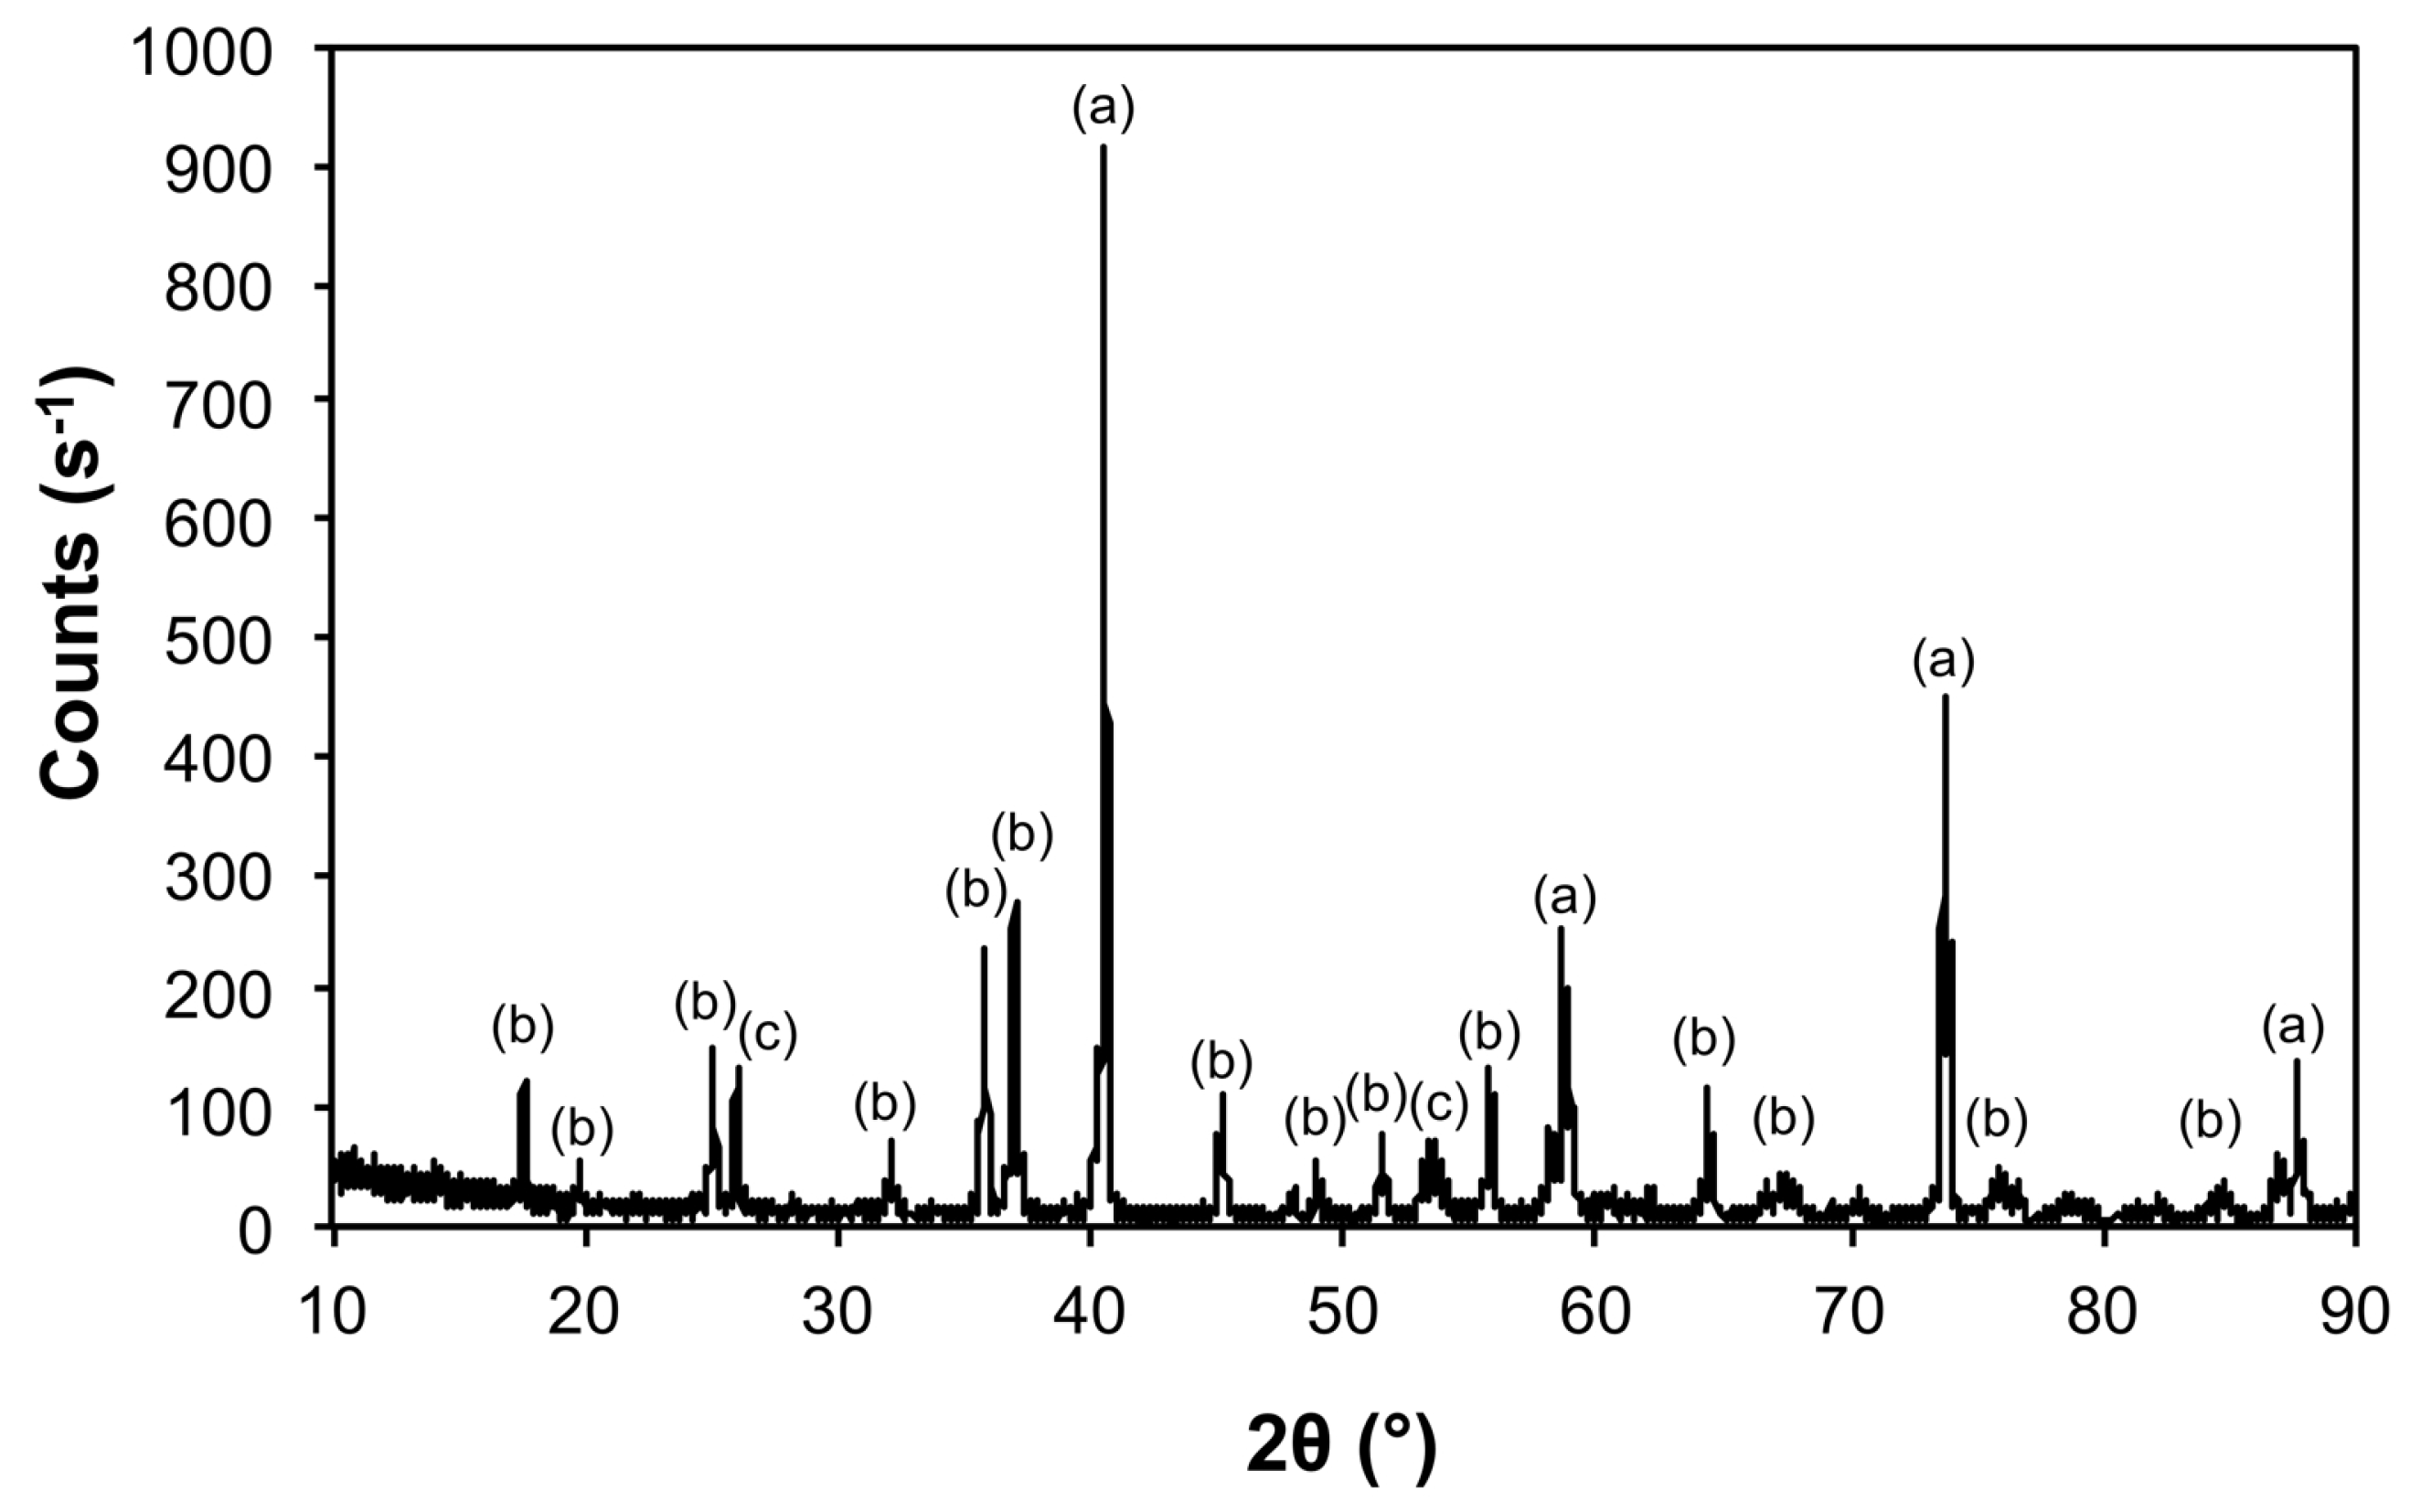
| Sample | Phase | ICDD | Crystallite Size (Å) |
|---|---|---|---|
| Air@1100 | Fe2O3 | 04-008-7624 | 963 ± 240 |
| Al(PO4) | 04-015-7505 | 746 ± 545 | |
| Al2O3 | 01-073-5928 | 326 ± 45 | |
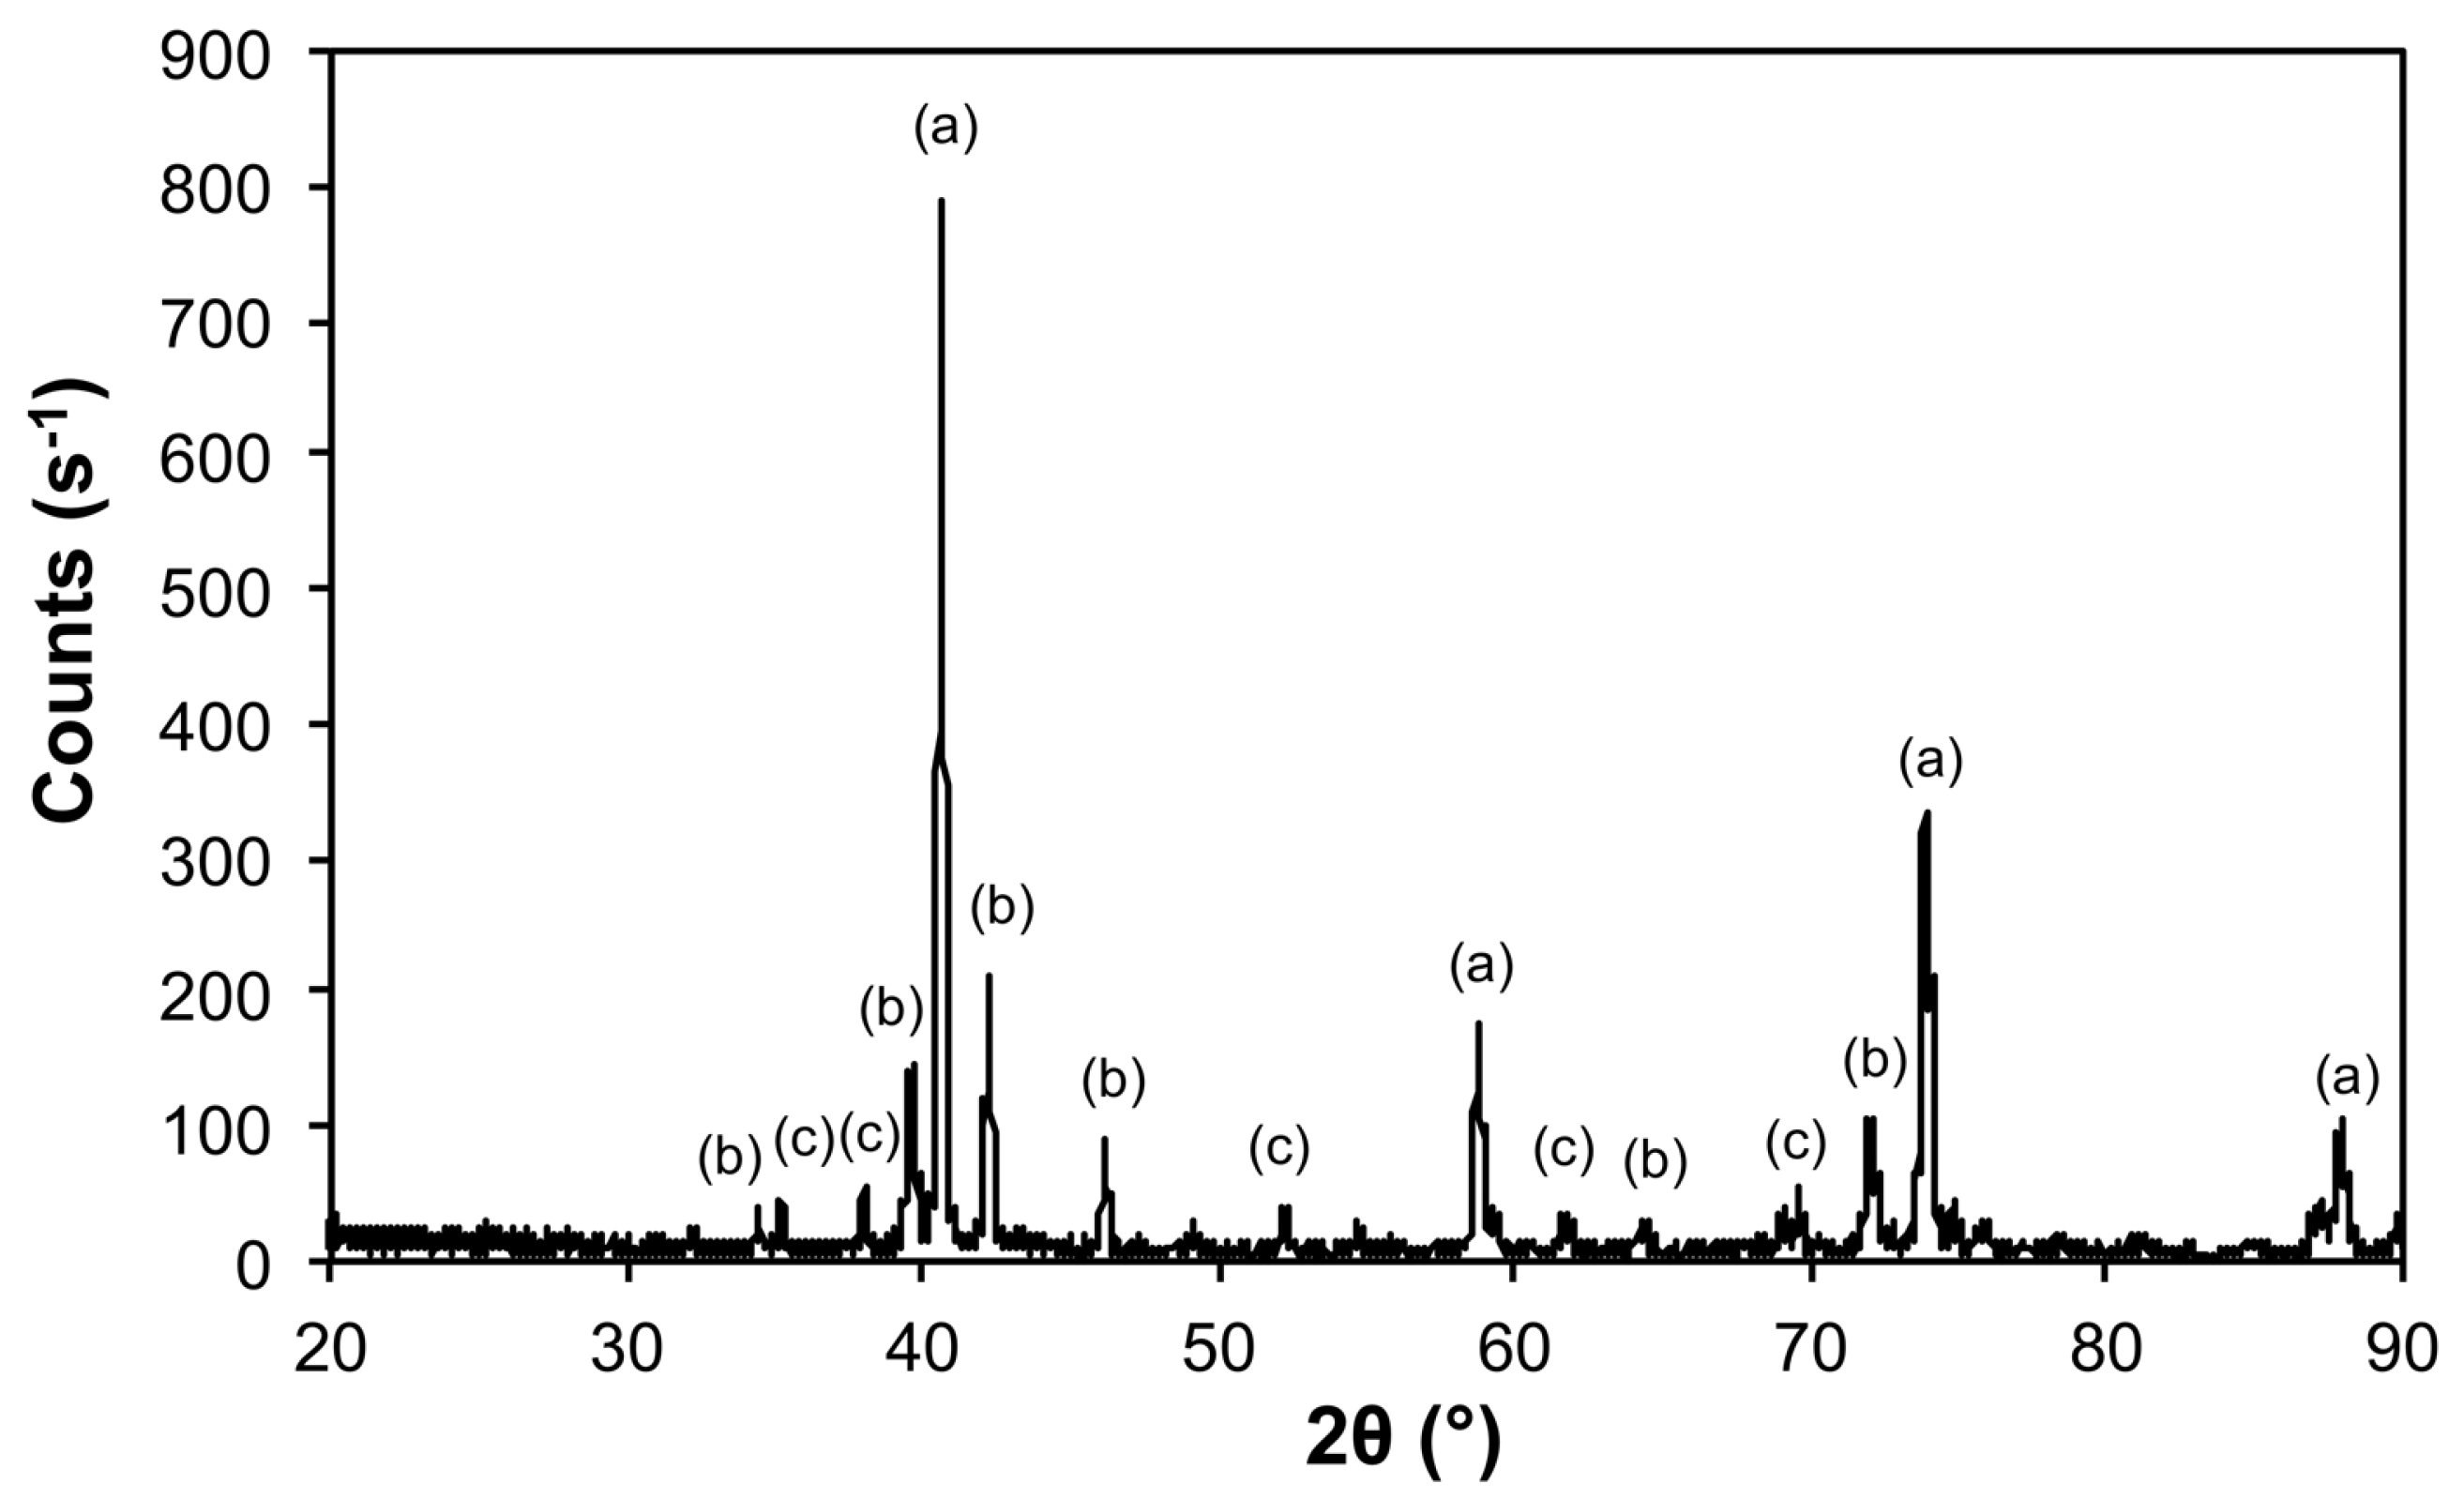
| Ar@1100 | Mo | 00-004-0809 | 1160 ± 78 |
| Fe3Mo3O8 | 04-007-6813 | 489 ± 99 | |
| MoO2 | 01-086-0135 | 541 ± 104 | |
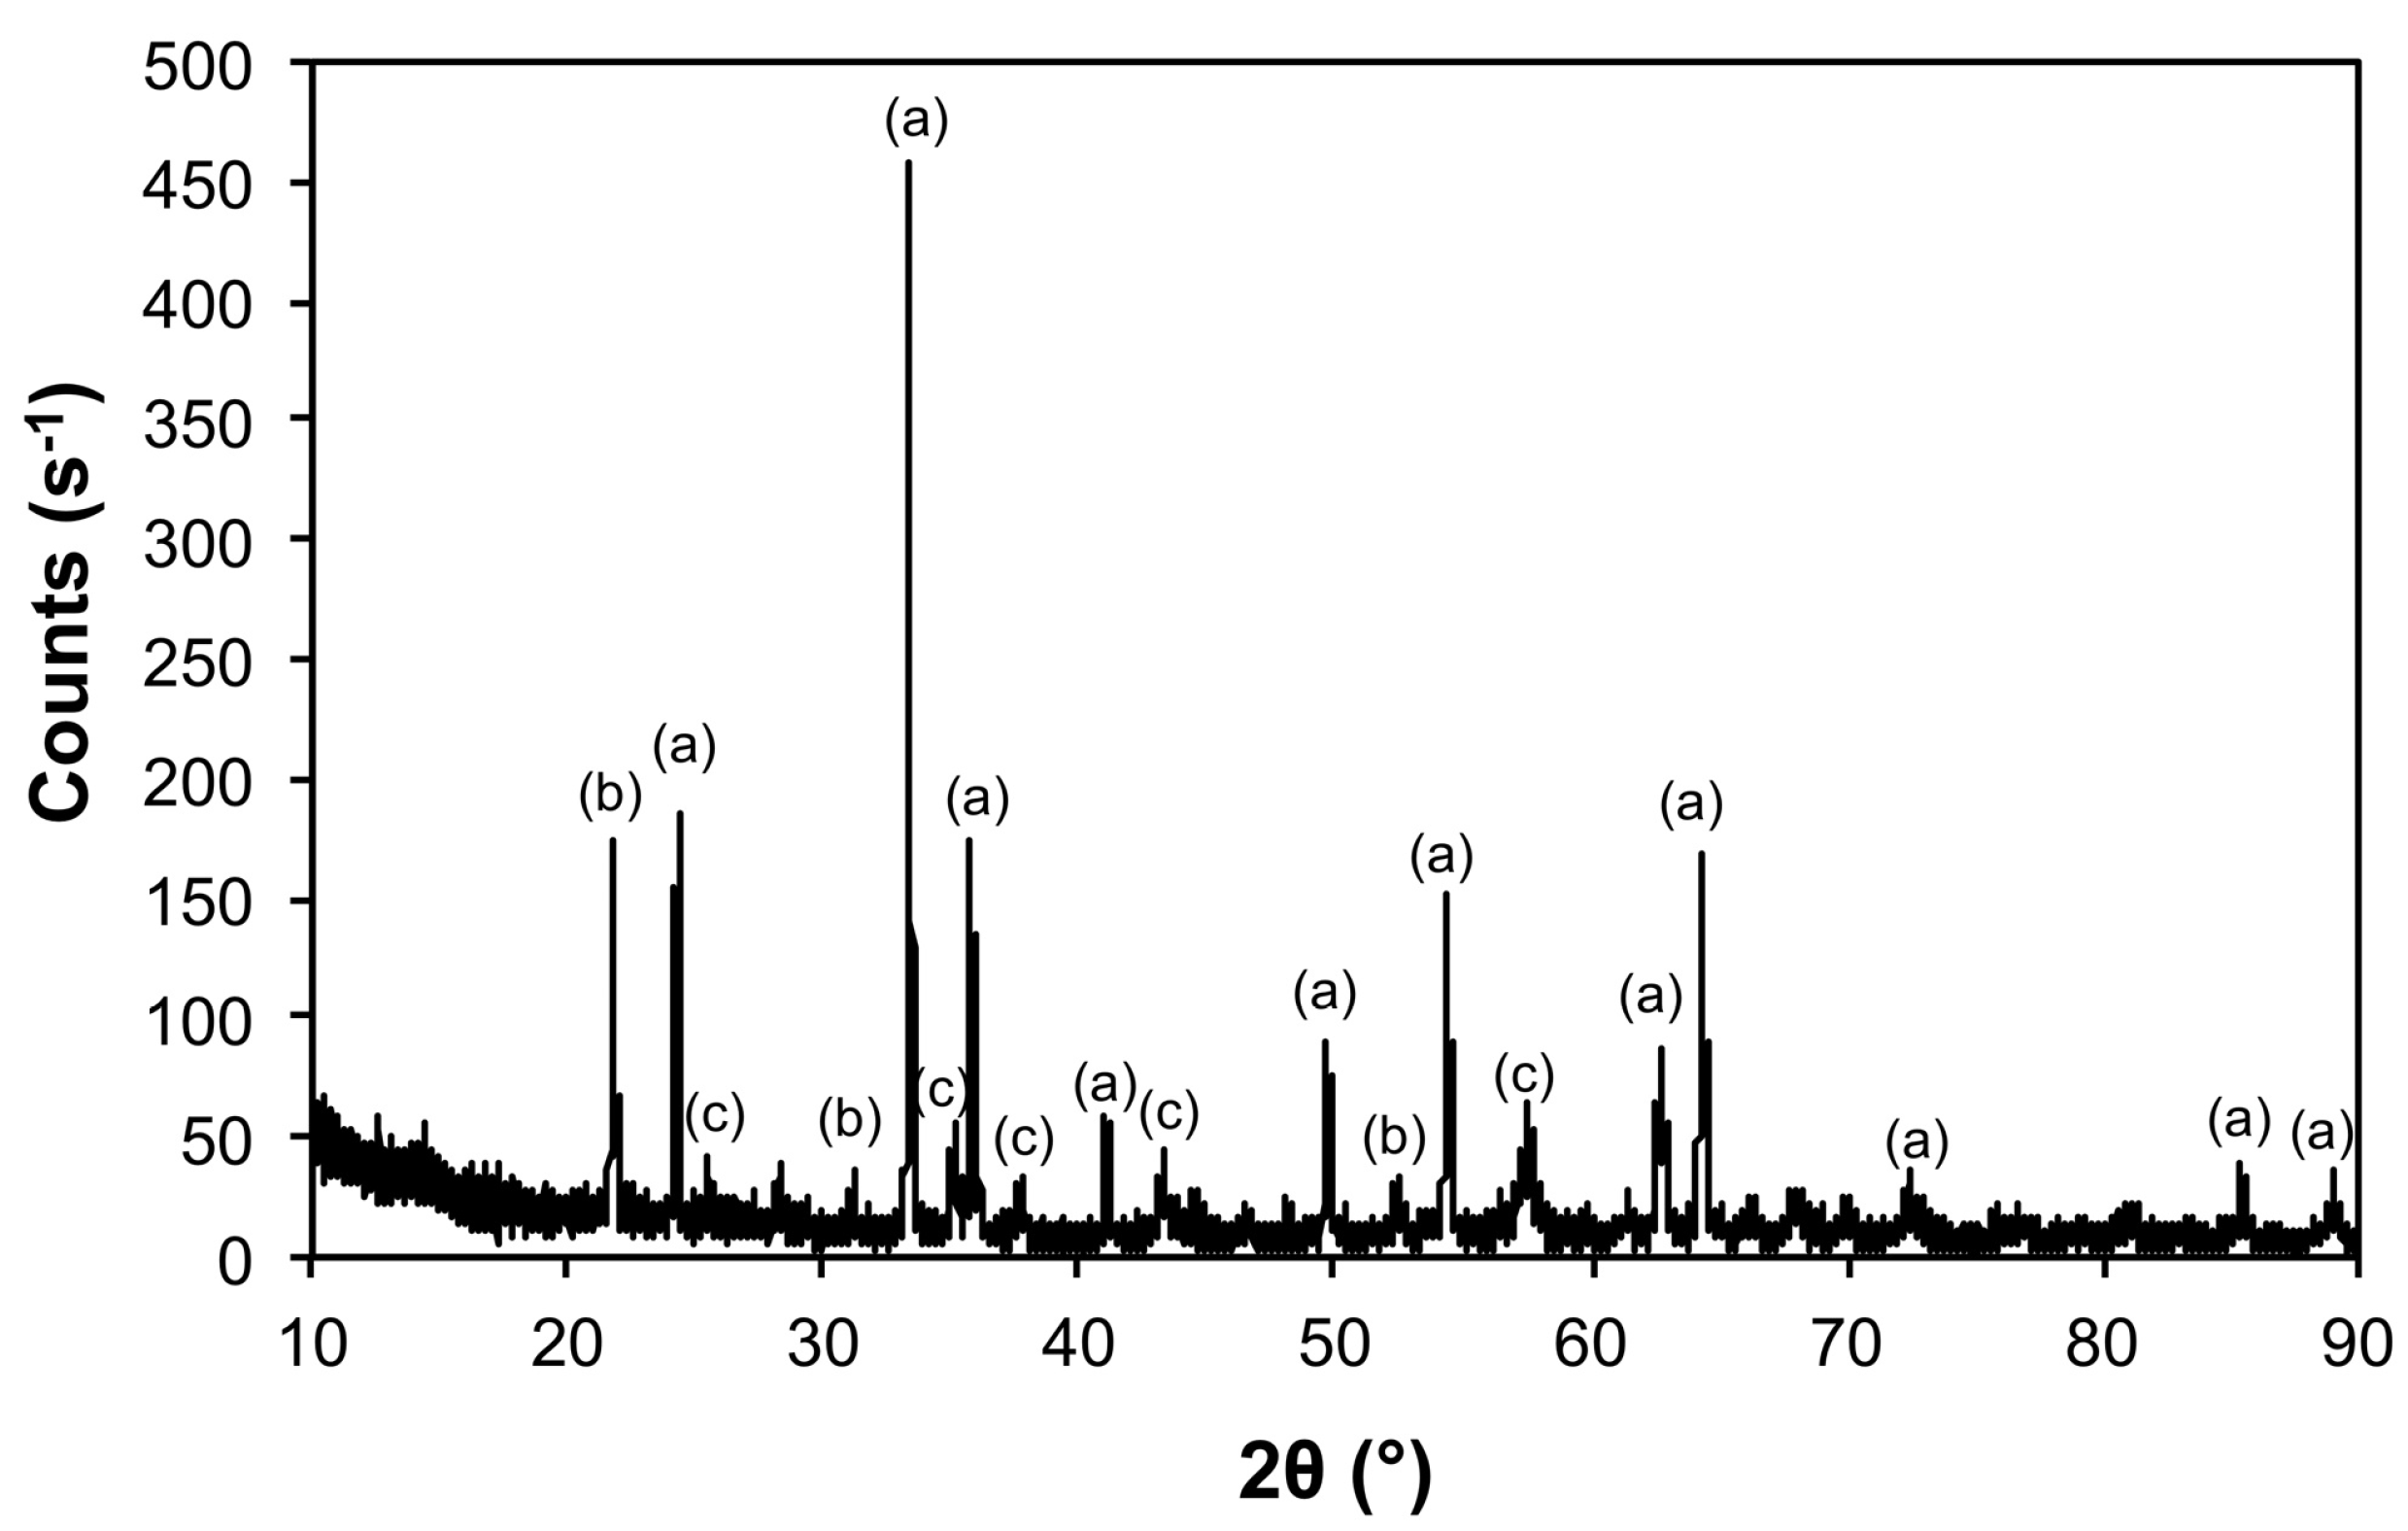
| 5@900 | Mo | 00-004-0809 | 347 ± 8 |
| Fe2Mo3O | 04-005-2530 | 525 ± 60 | |
| Fe2Mo3C | 01-083-3017 | 357 ± 53 | |
| 5@1100 | Mo | 00-004-0809 | 460 ± 21 |
| Fe2Mo3O8 | 01-070-1726 | 271 ± 161 | |
| Fe2Mo3 | 00-041-1000 | 365 ± 166 | |
| 10@1100 | Mo | 00-004-0809 | 533 ± 20 |
| Fe3Mo3C | 04-005-3925 | 605 ± 164 | |
| Mo2C | 04-016-3694 | 521 ± 141 | |
| 50@1200 | Mo | 00-004-0809 | 620 ± 20 |
| Mo5.08Fe7.92 | 04-003-7152 | 333 ± 147 |
© 2018 by the authors. Licensee MDPI, Basel, Switzerland. This article is an open access article distributed under the terms and conditions of the Creative Commons Attribution (CC BY) license (http://creativecommons.org/licenses/by/4.0/).
Share and Cite
Esquenazi, G.L.; Barron, A.R. Investigation of the Reduction of a Molybdenum/Iron Molecular Nanocluster Single Source Precursor. Inorganics 2018, 6, 104. https://doi.org/10.3390/inorganics6040104
Esquenazi GL, Barron AR. Investigation of the Reduction of a Molybdenum/Iron Molecular Nanocluster Single Source Precursor. Inorganics. 2018; 6(4):104. https://doi.org/10.3390/inorganics6040104
Chicago/Turabian StyleEsquenazi, Gibran L., and Andrew R. Barron. 2018. "Investigation of the Reduction of a Molybdenum/Iron Molecular Nanocluster Single Source Precursor" Inorganics 6, no. 4: 104. https://doi.org/10.3390/inorganics6040104
APA StyleEsquenazi, G. L., & Barron, A. R. (2018). Investigation of the Reduction of a Molybdenum/Iron Molecular Nanocluster Single Source Precursor. Inorganics, 6(4), 104. https://doi.org/10.3390/inorganics6040104