
Hydrothermal Treatment of Tannin: A Route to Porous Metal Oxides and Metal/Carbon Hybrid Materials


 , ,
, , 
Abstract
:1. Introduction
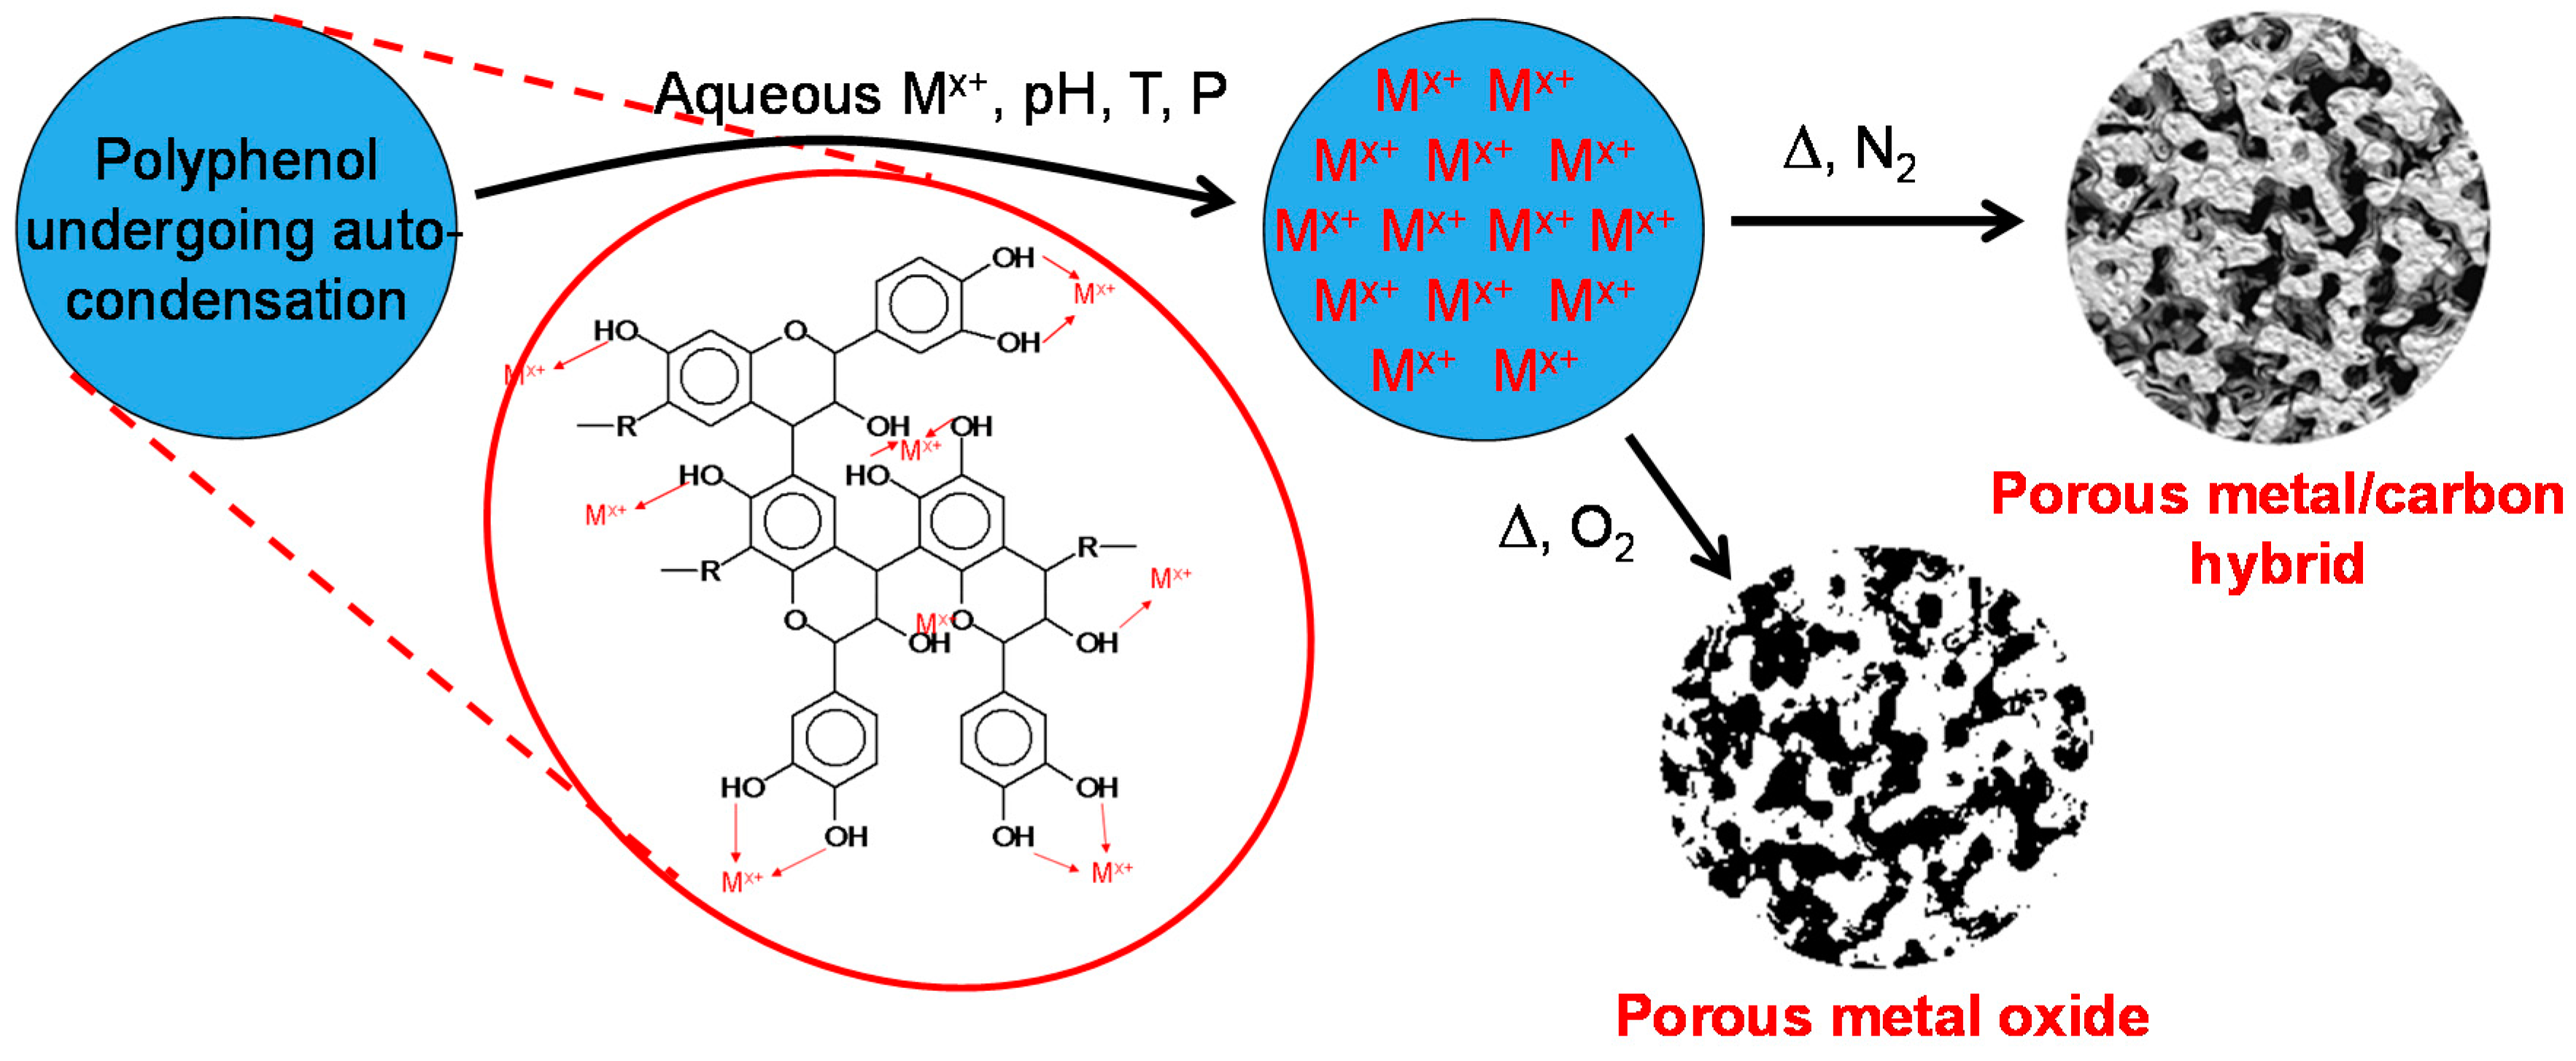
2. Results and Discussion
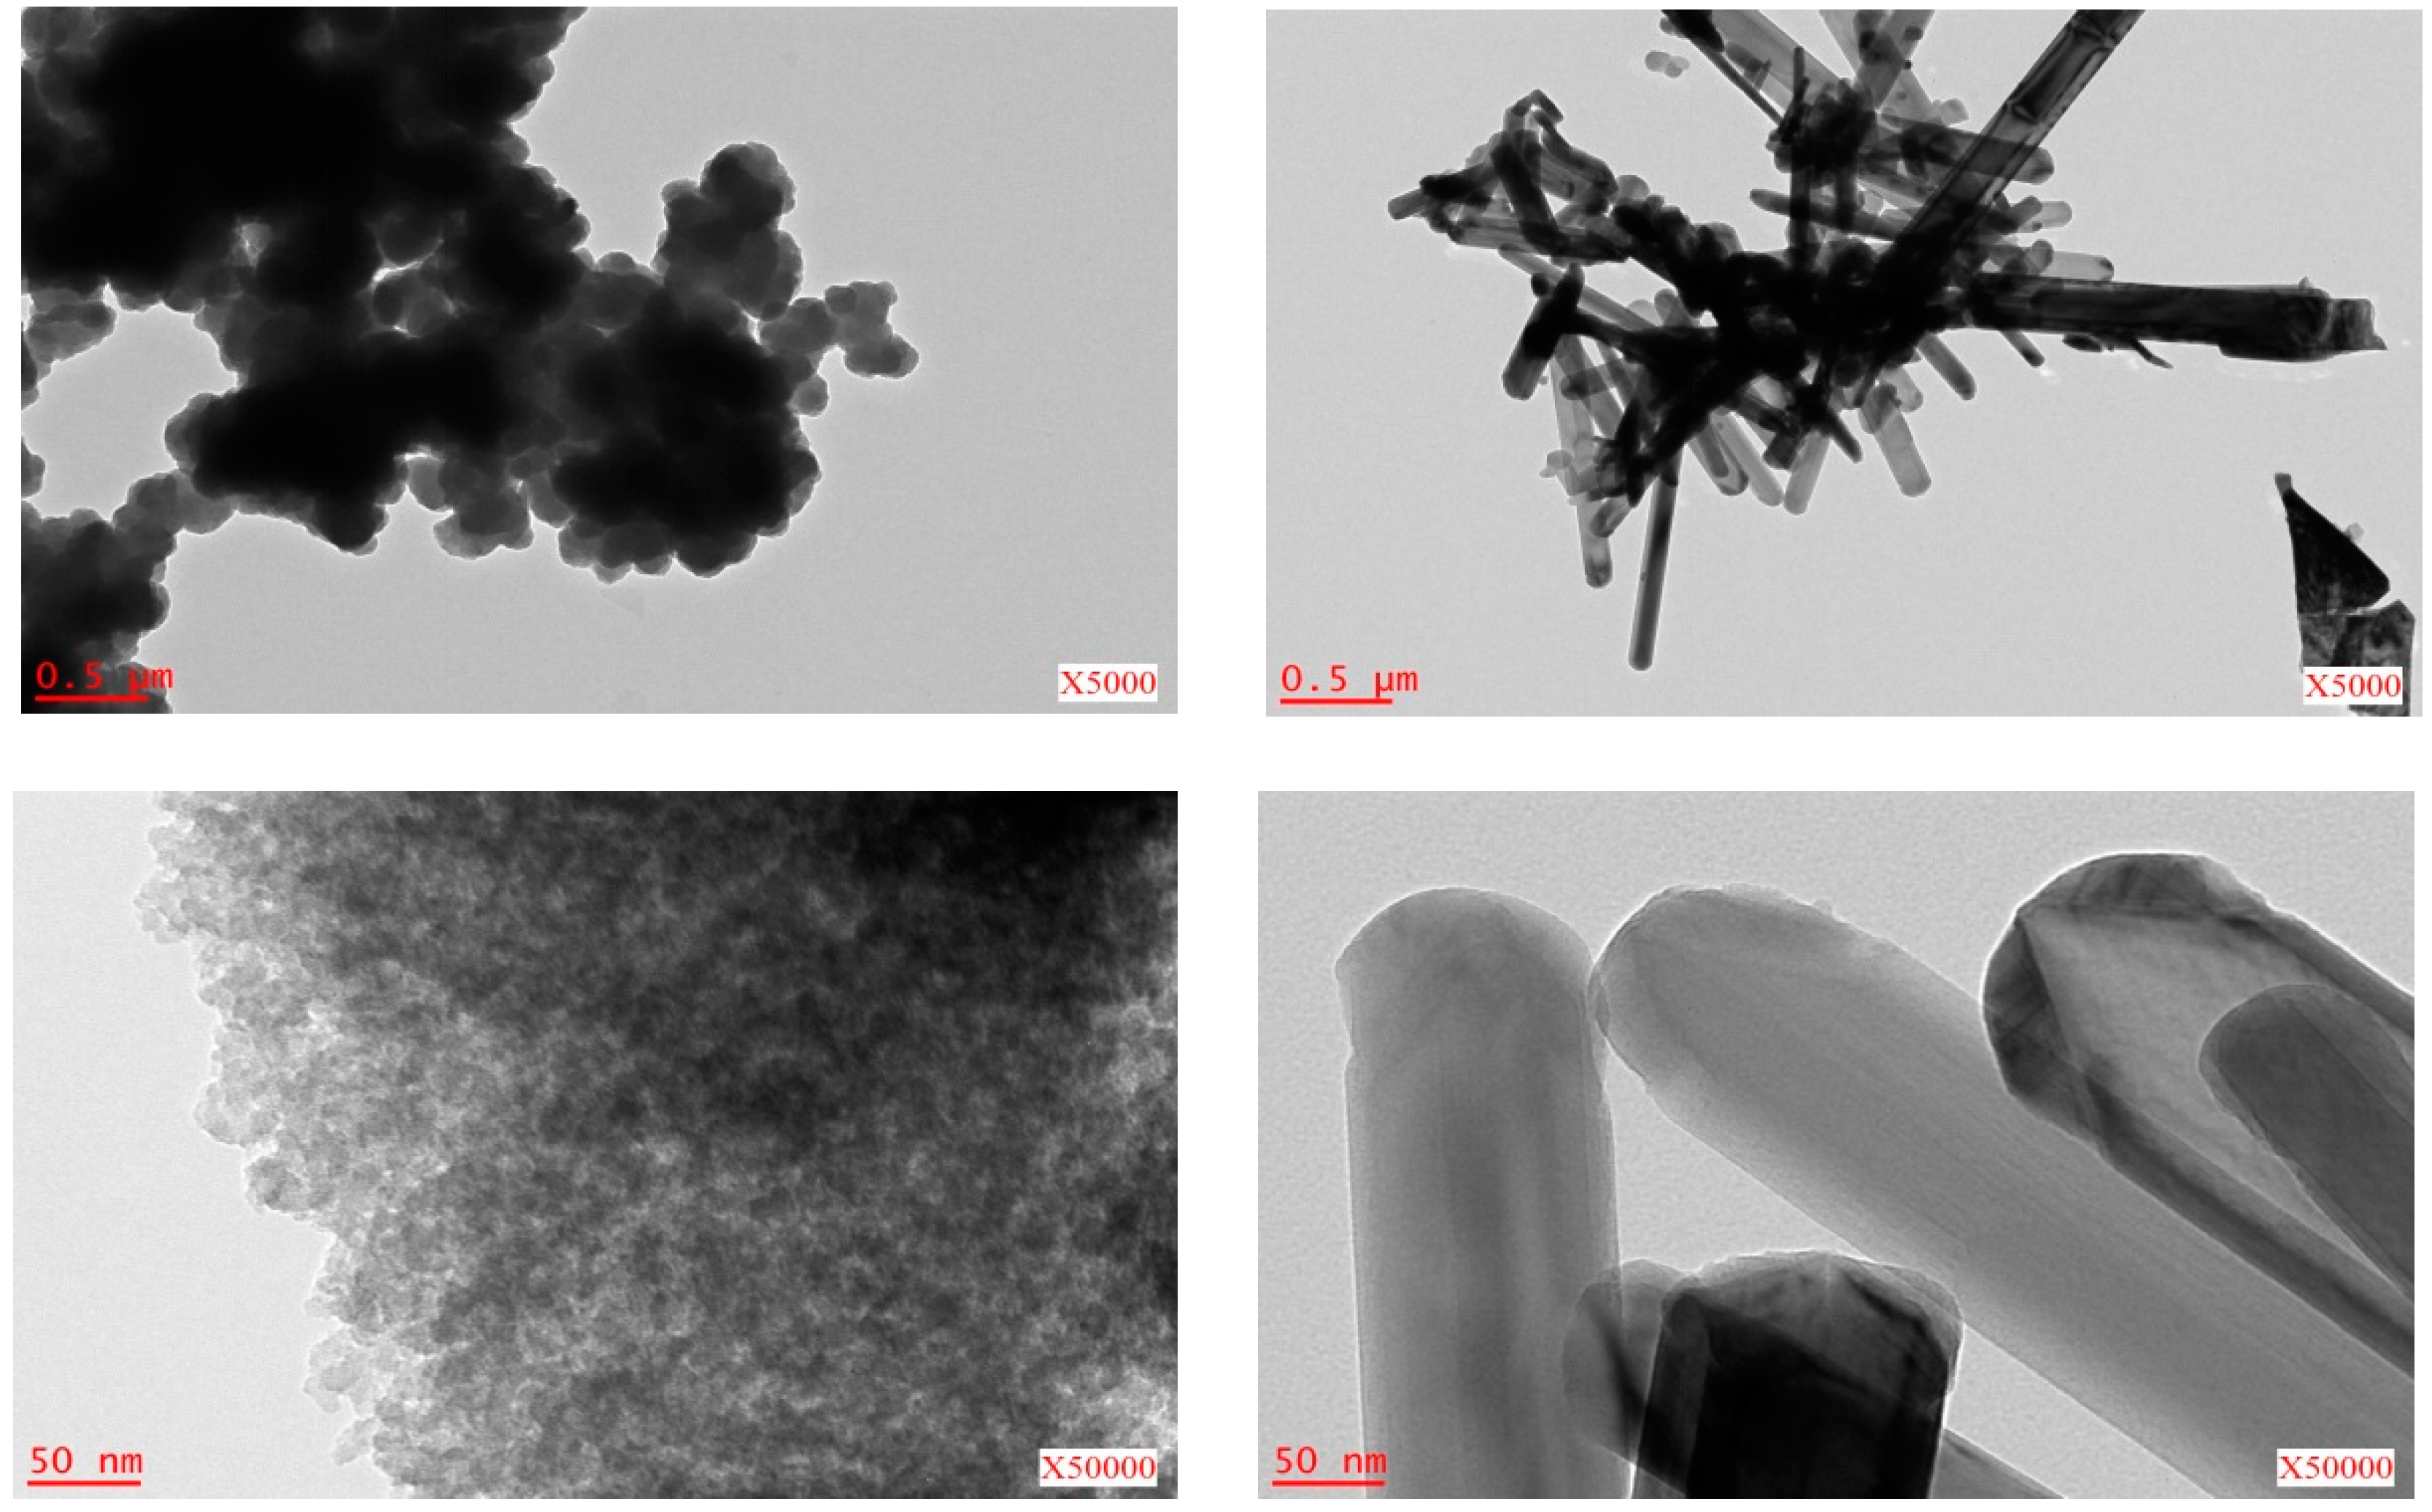
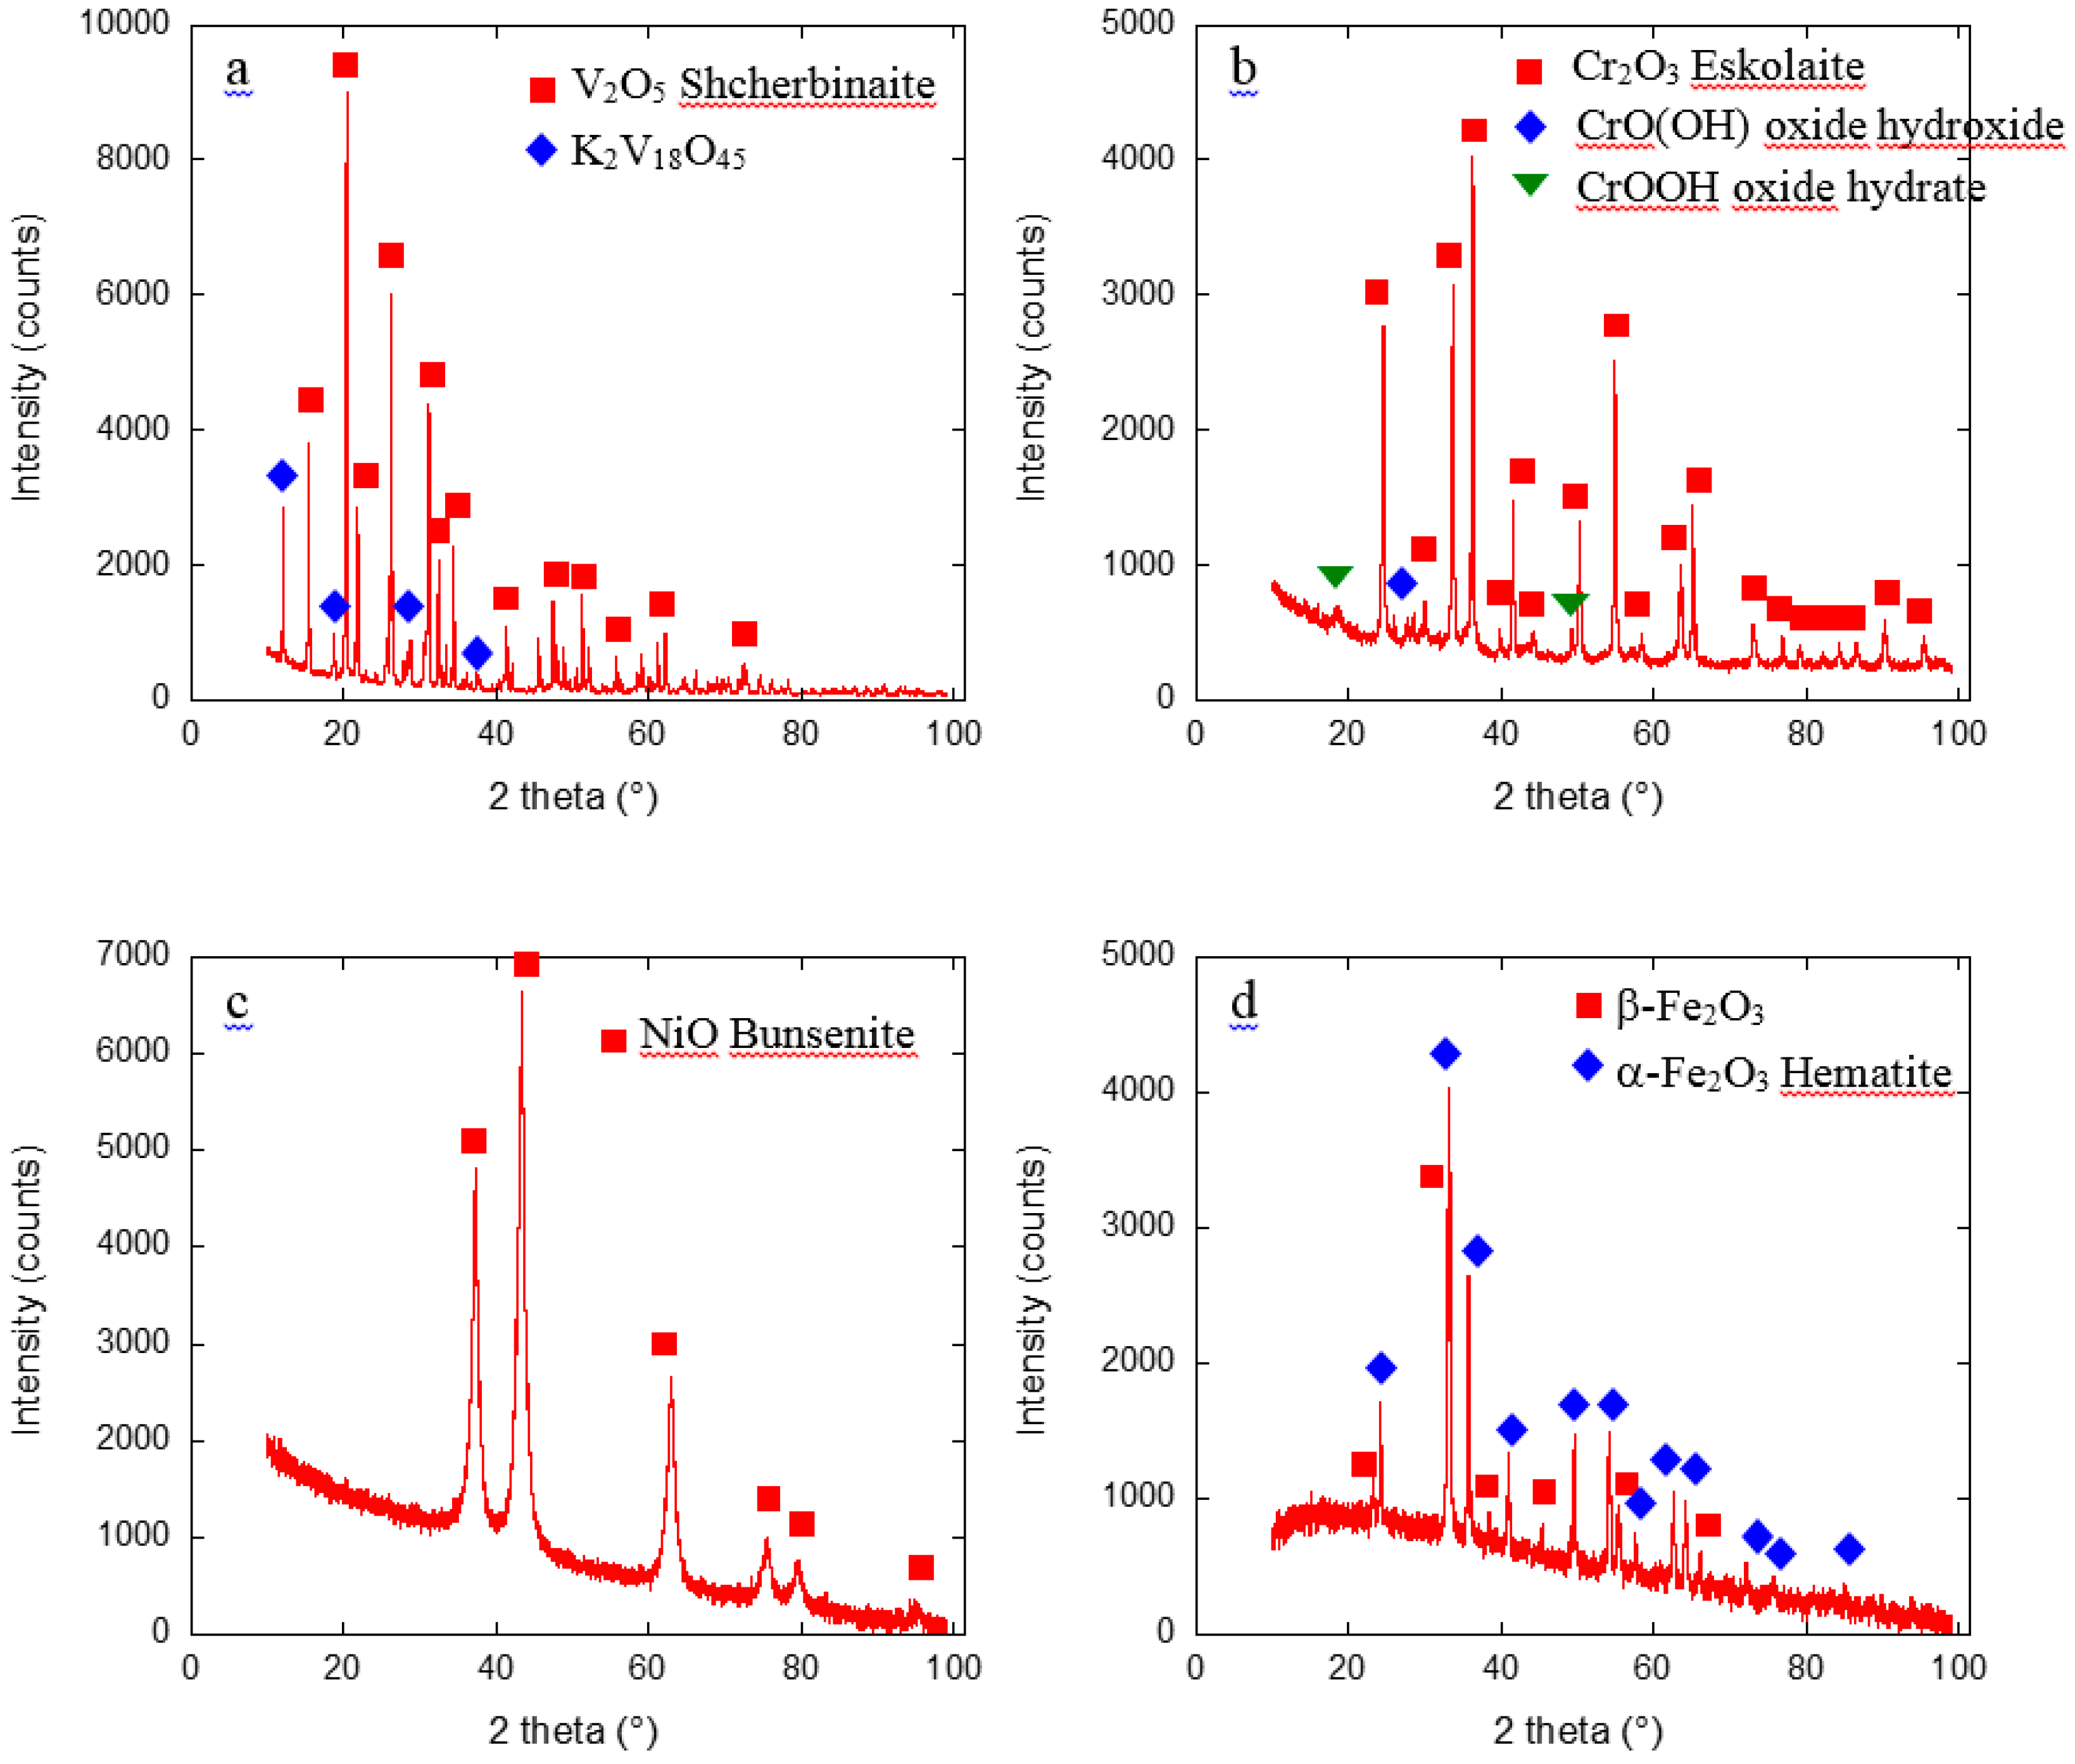
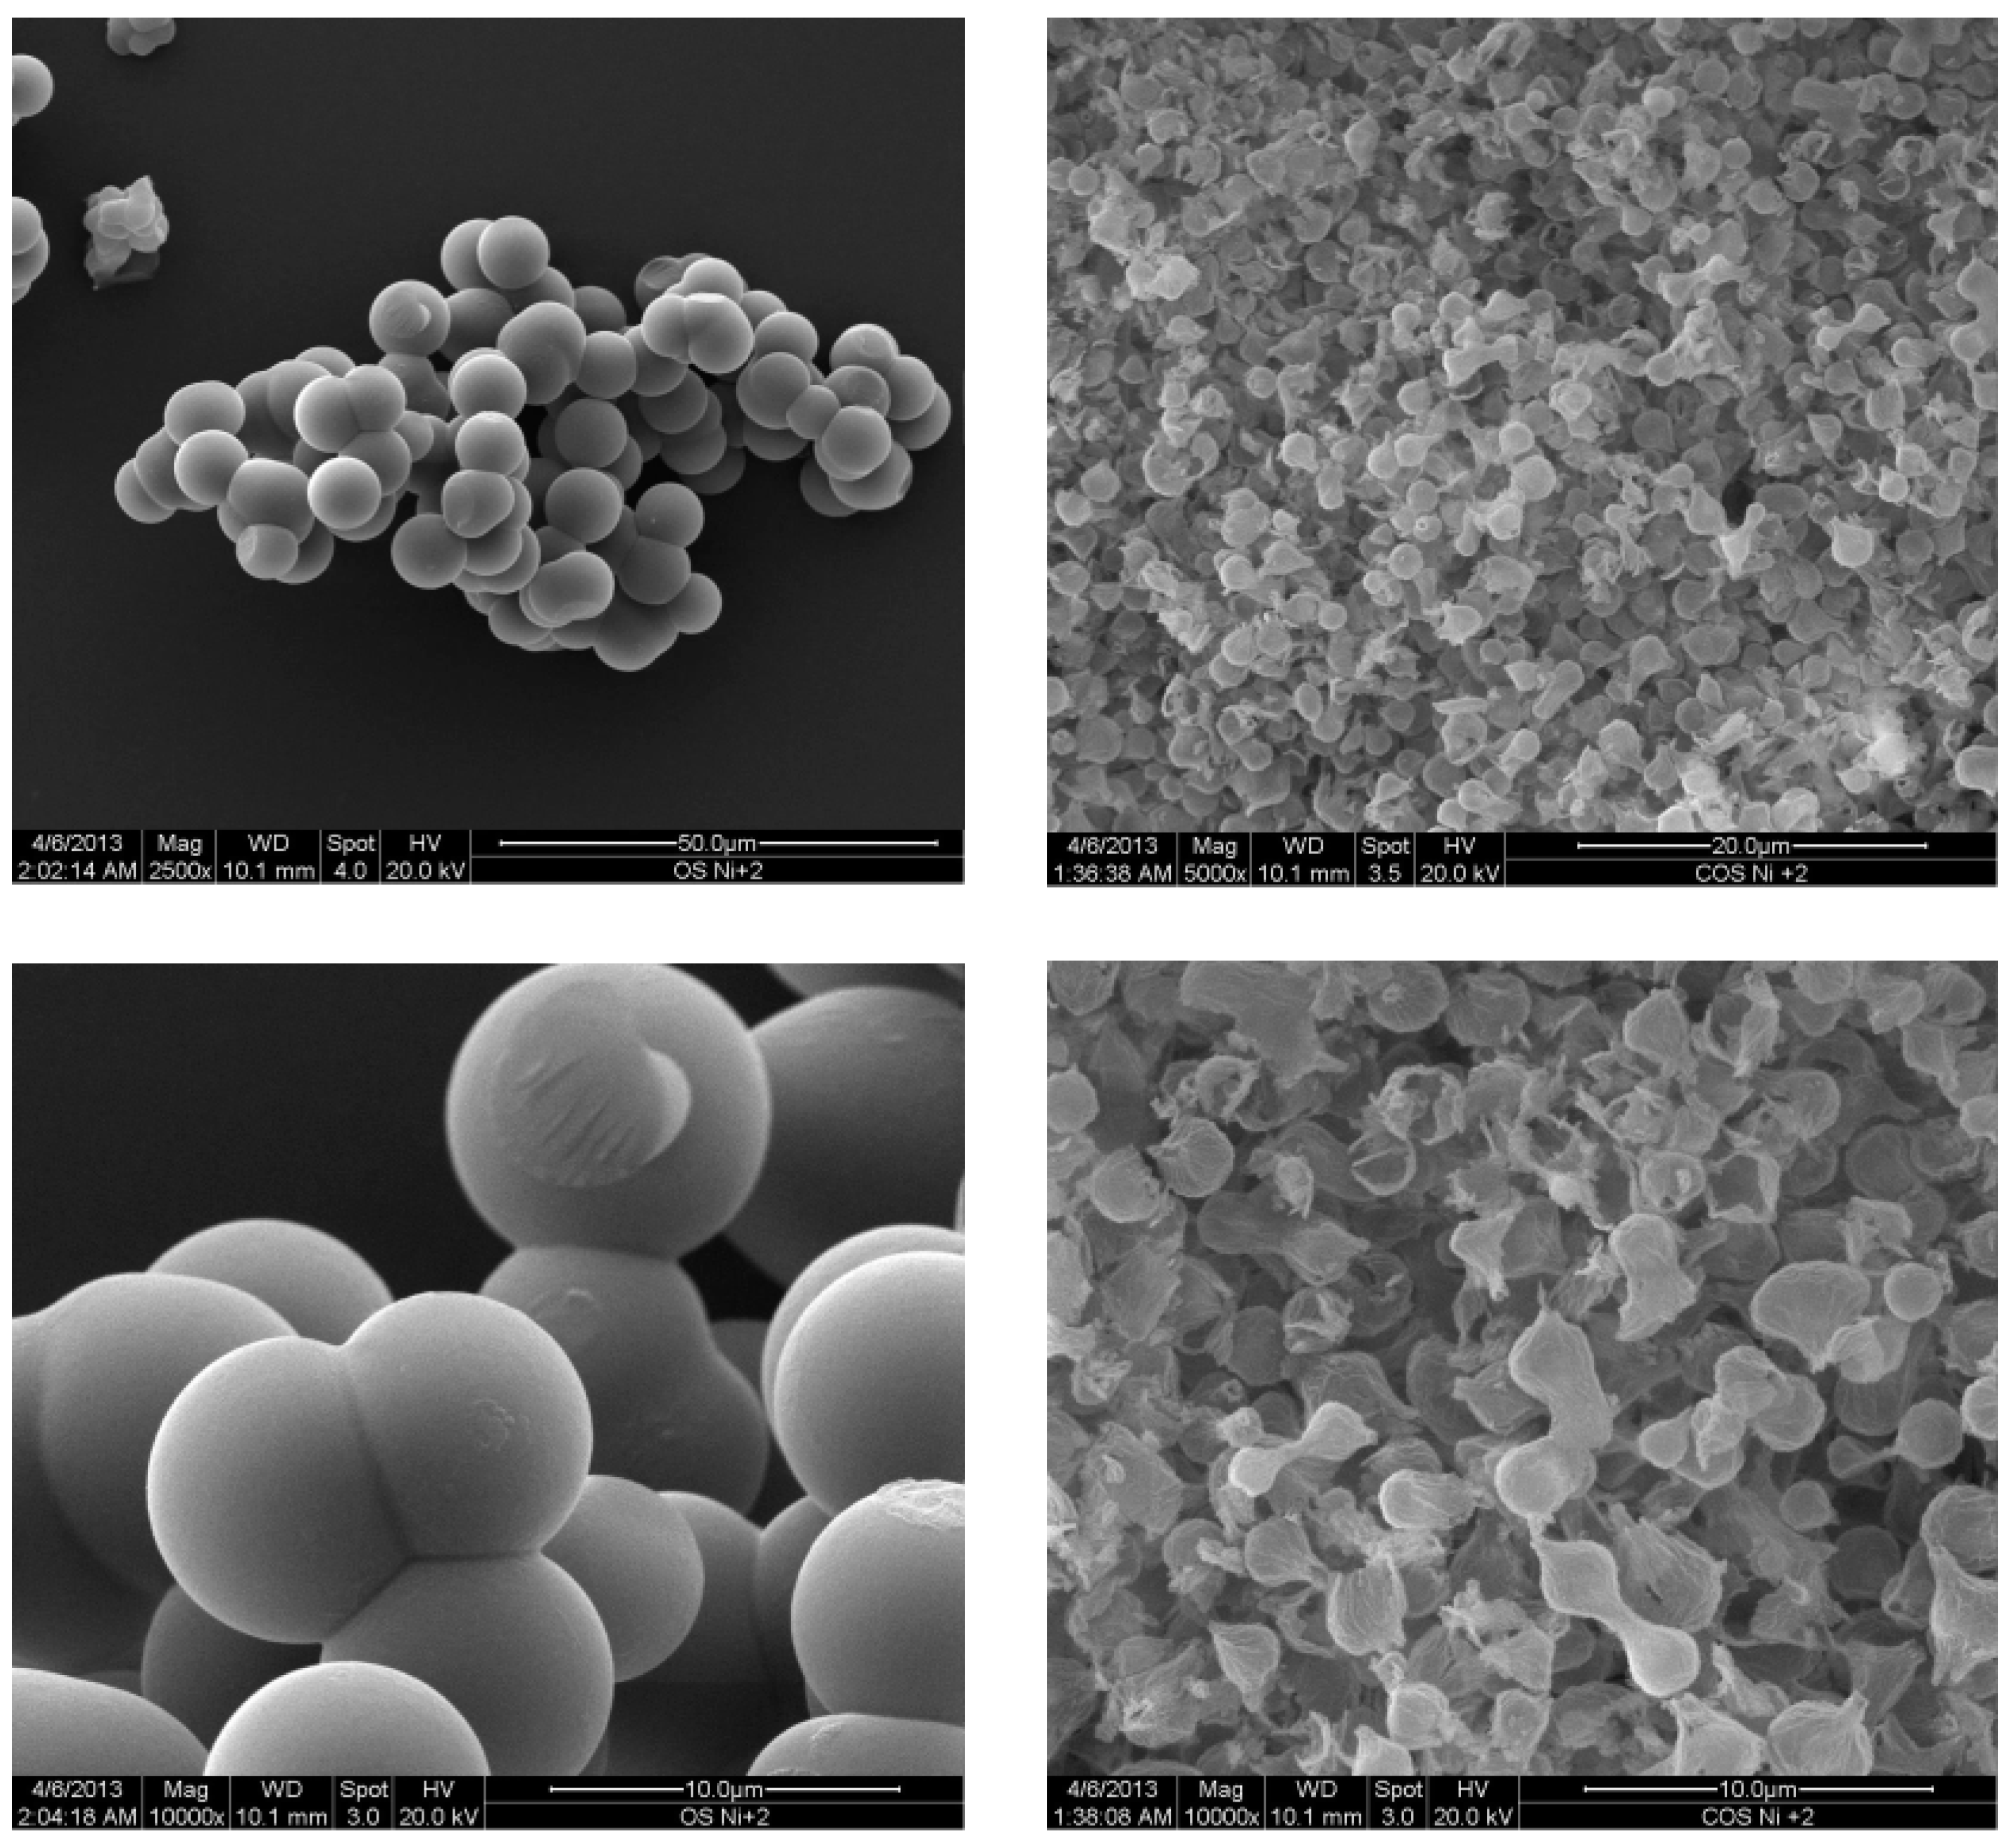
2.1. Metal Nano/Micro-Oxides
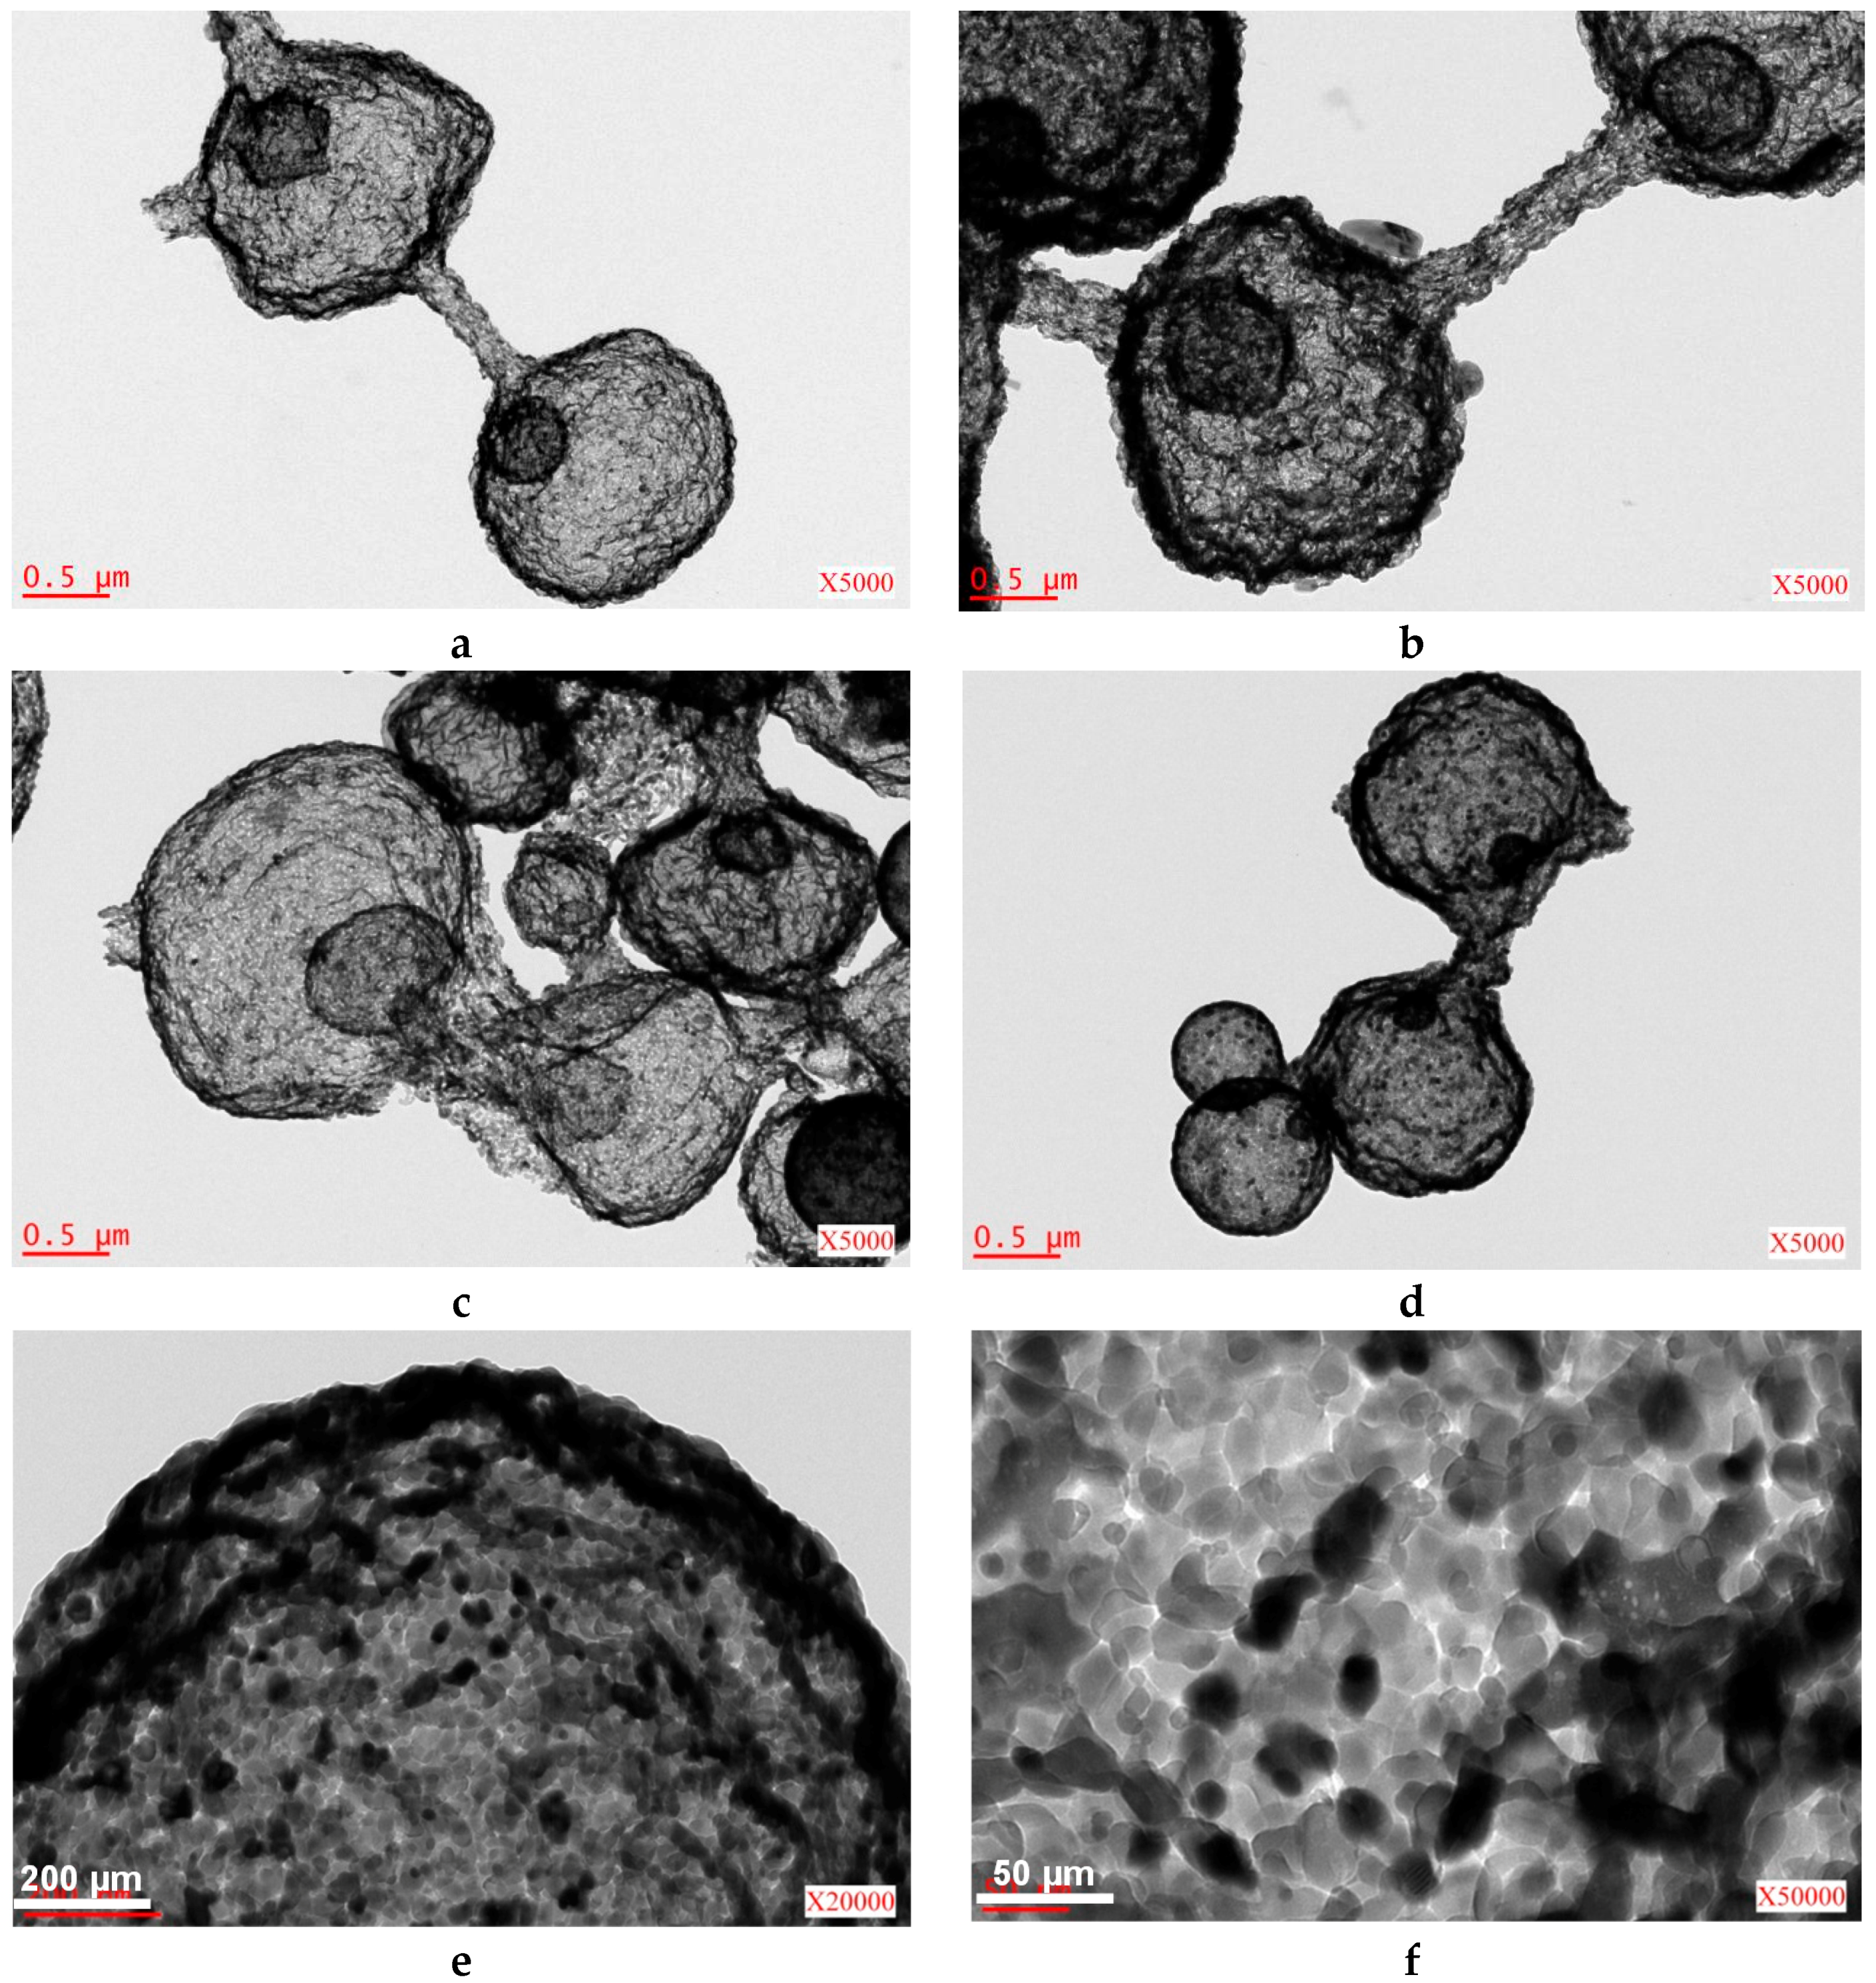
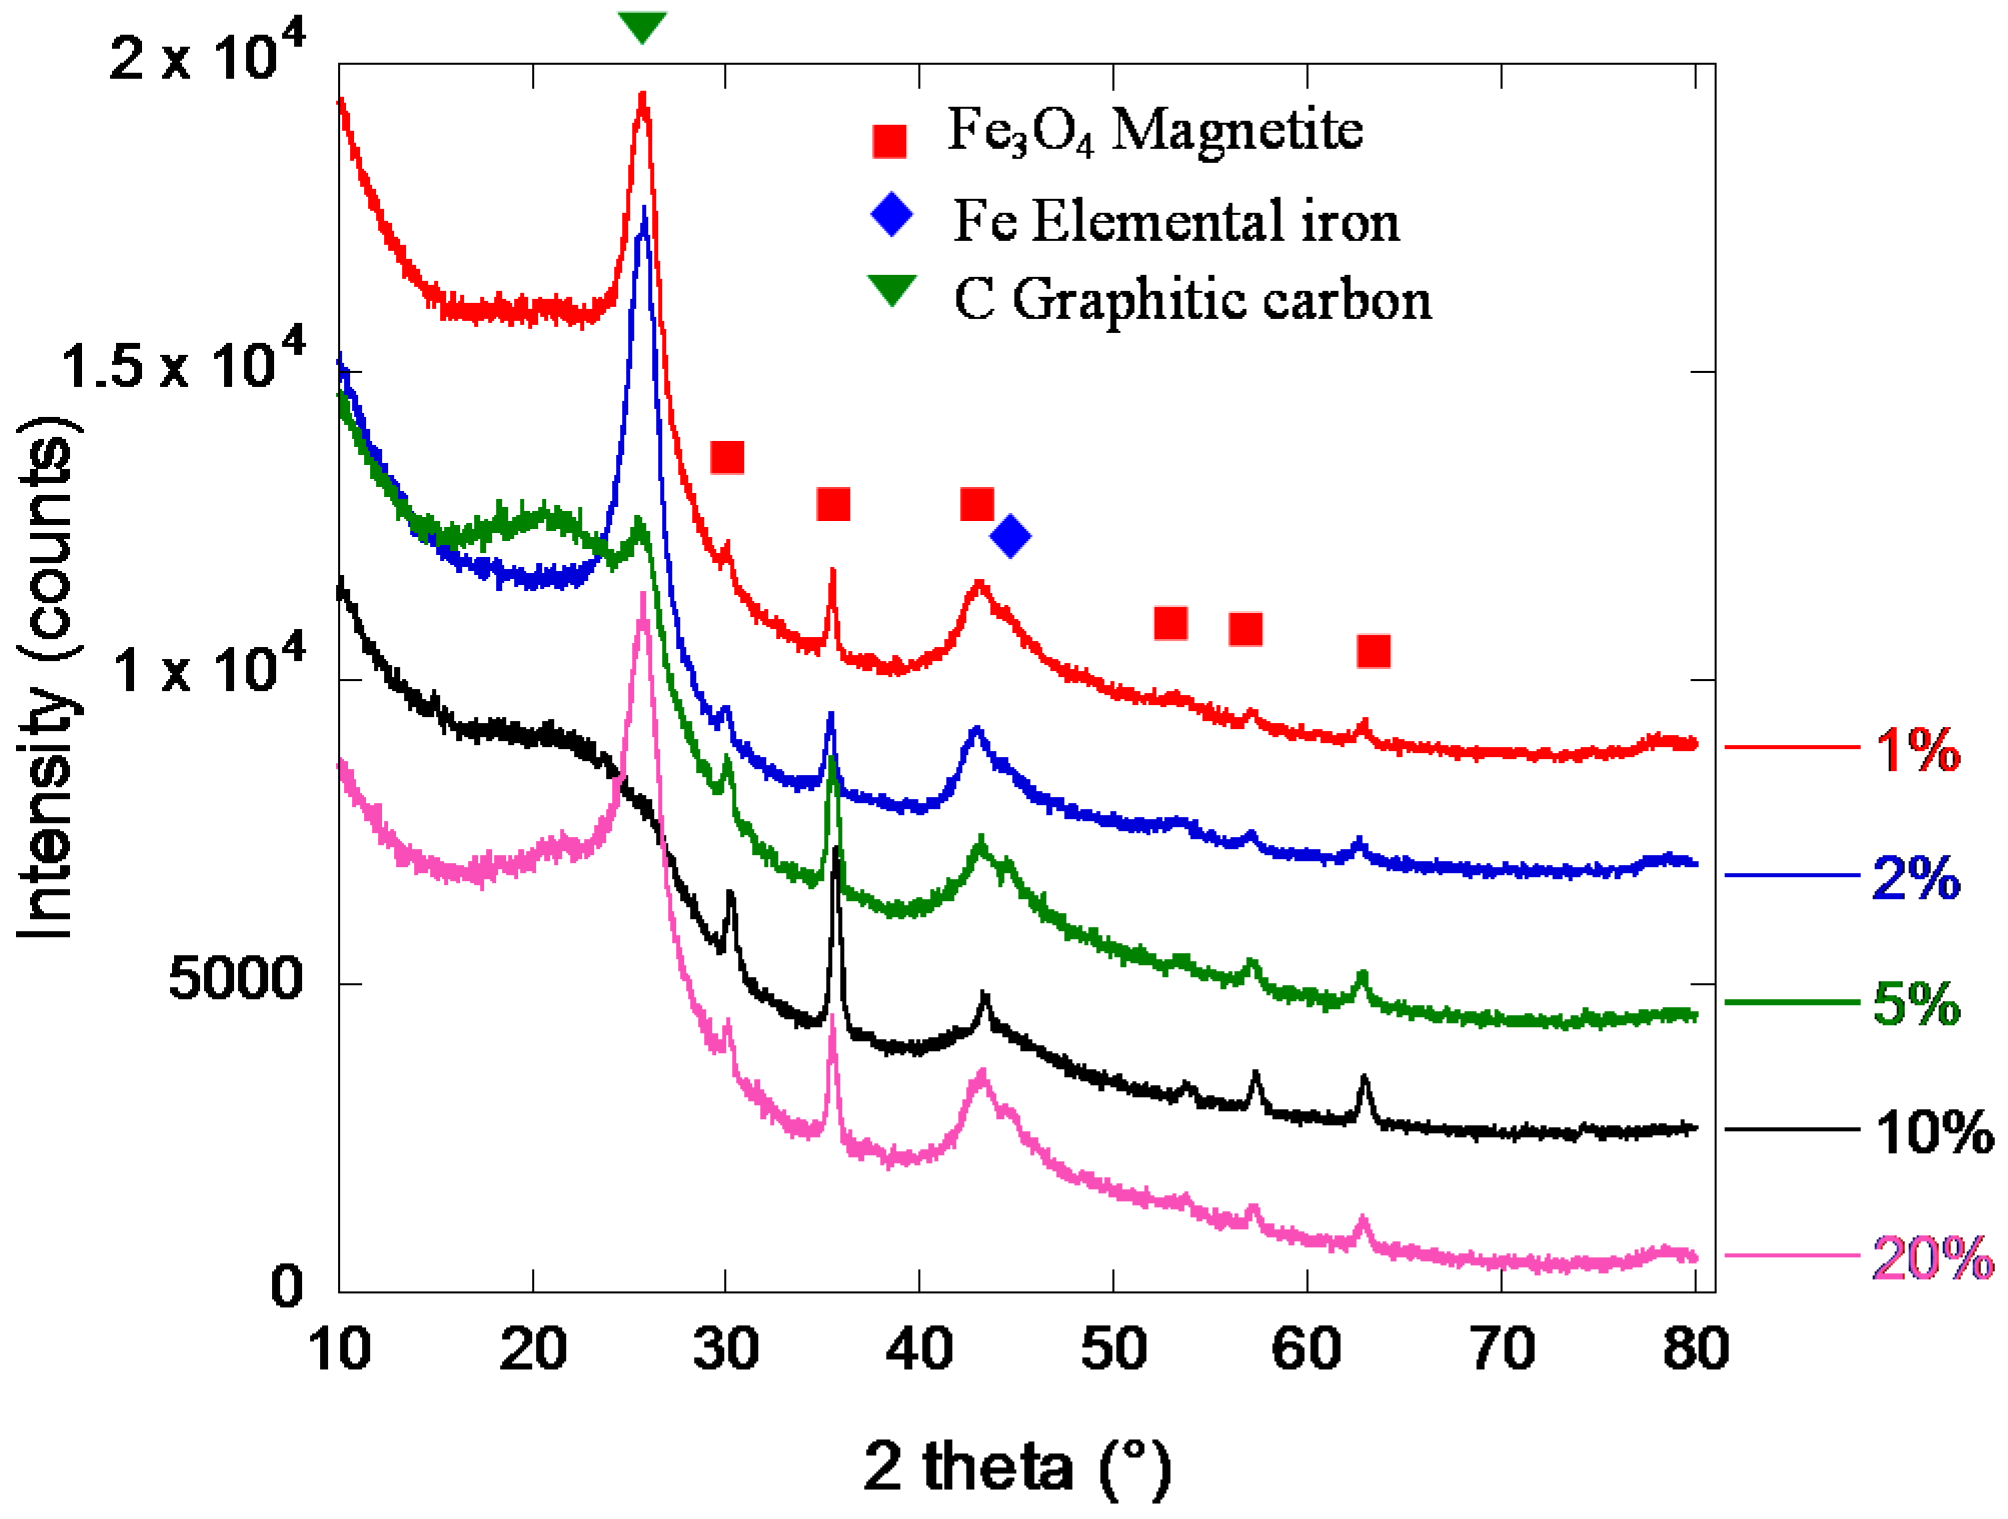
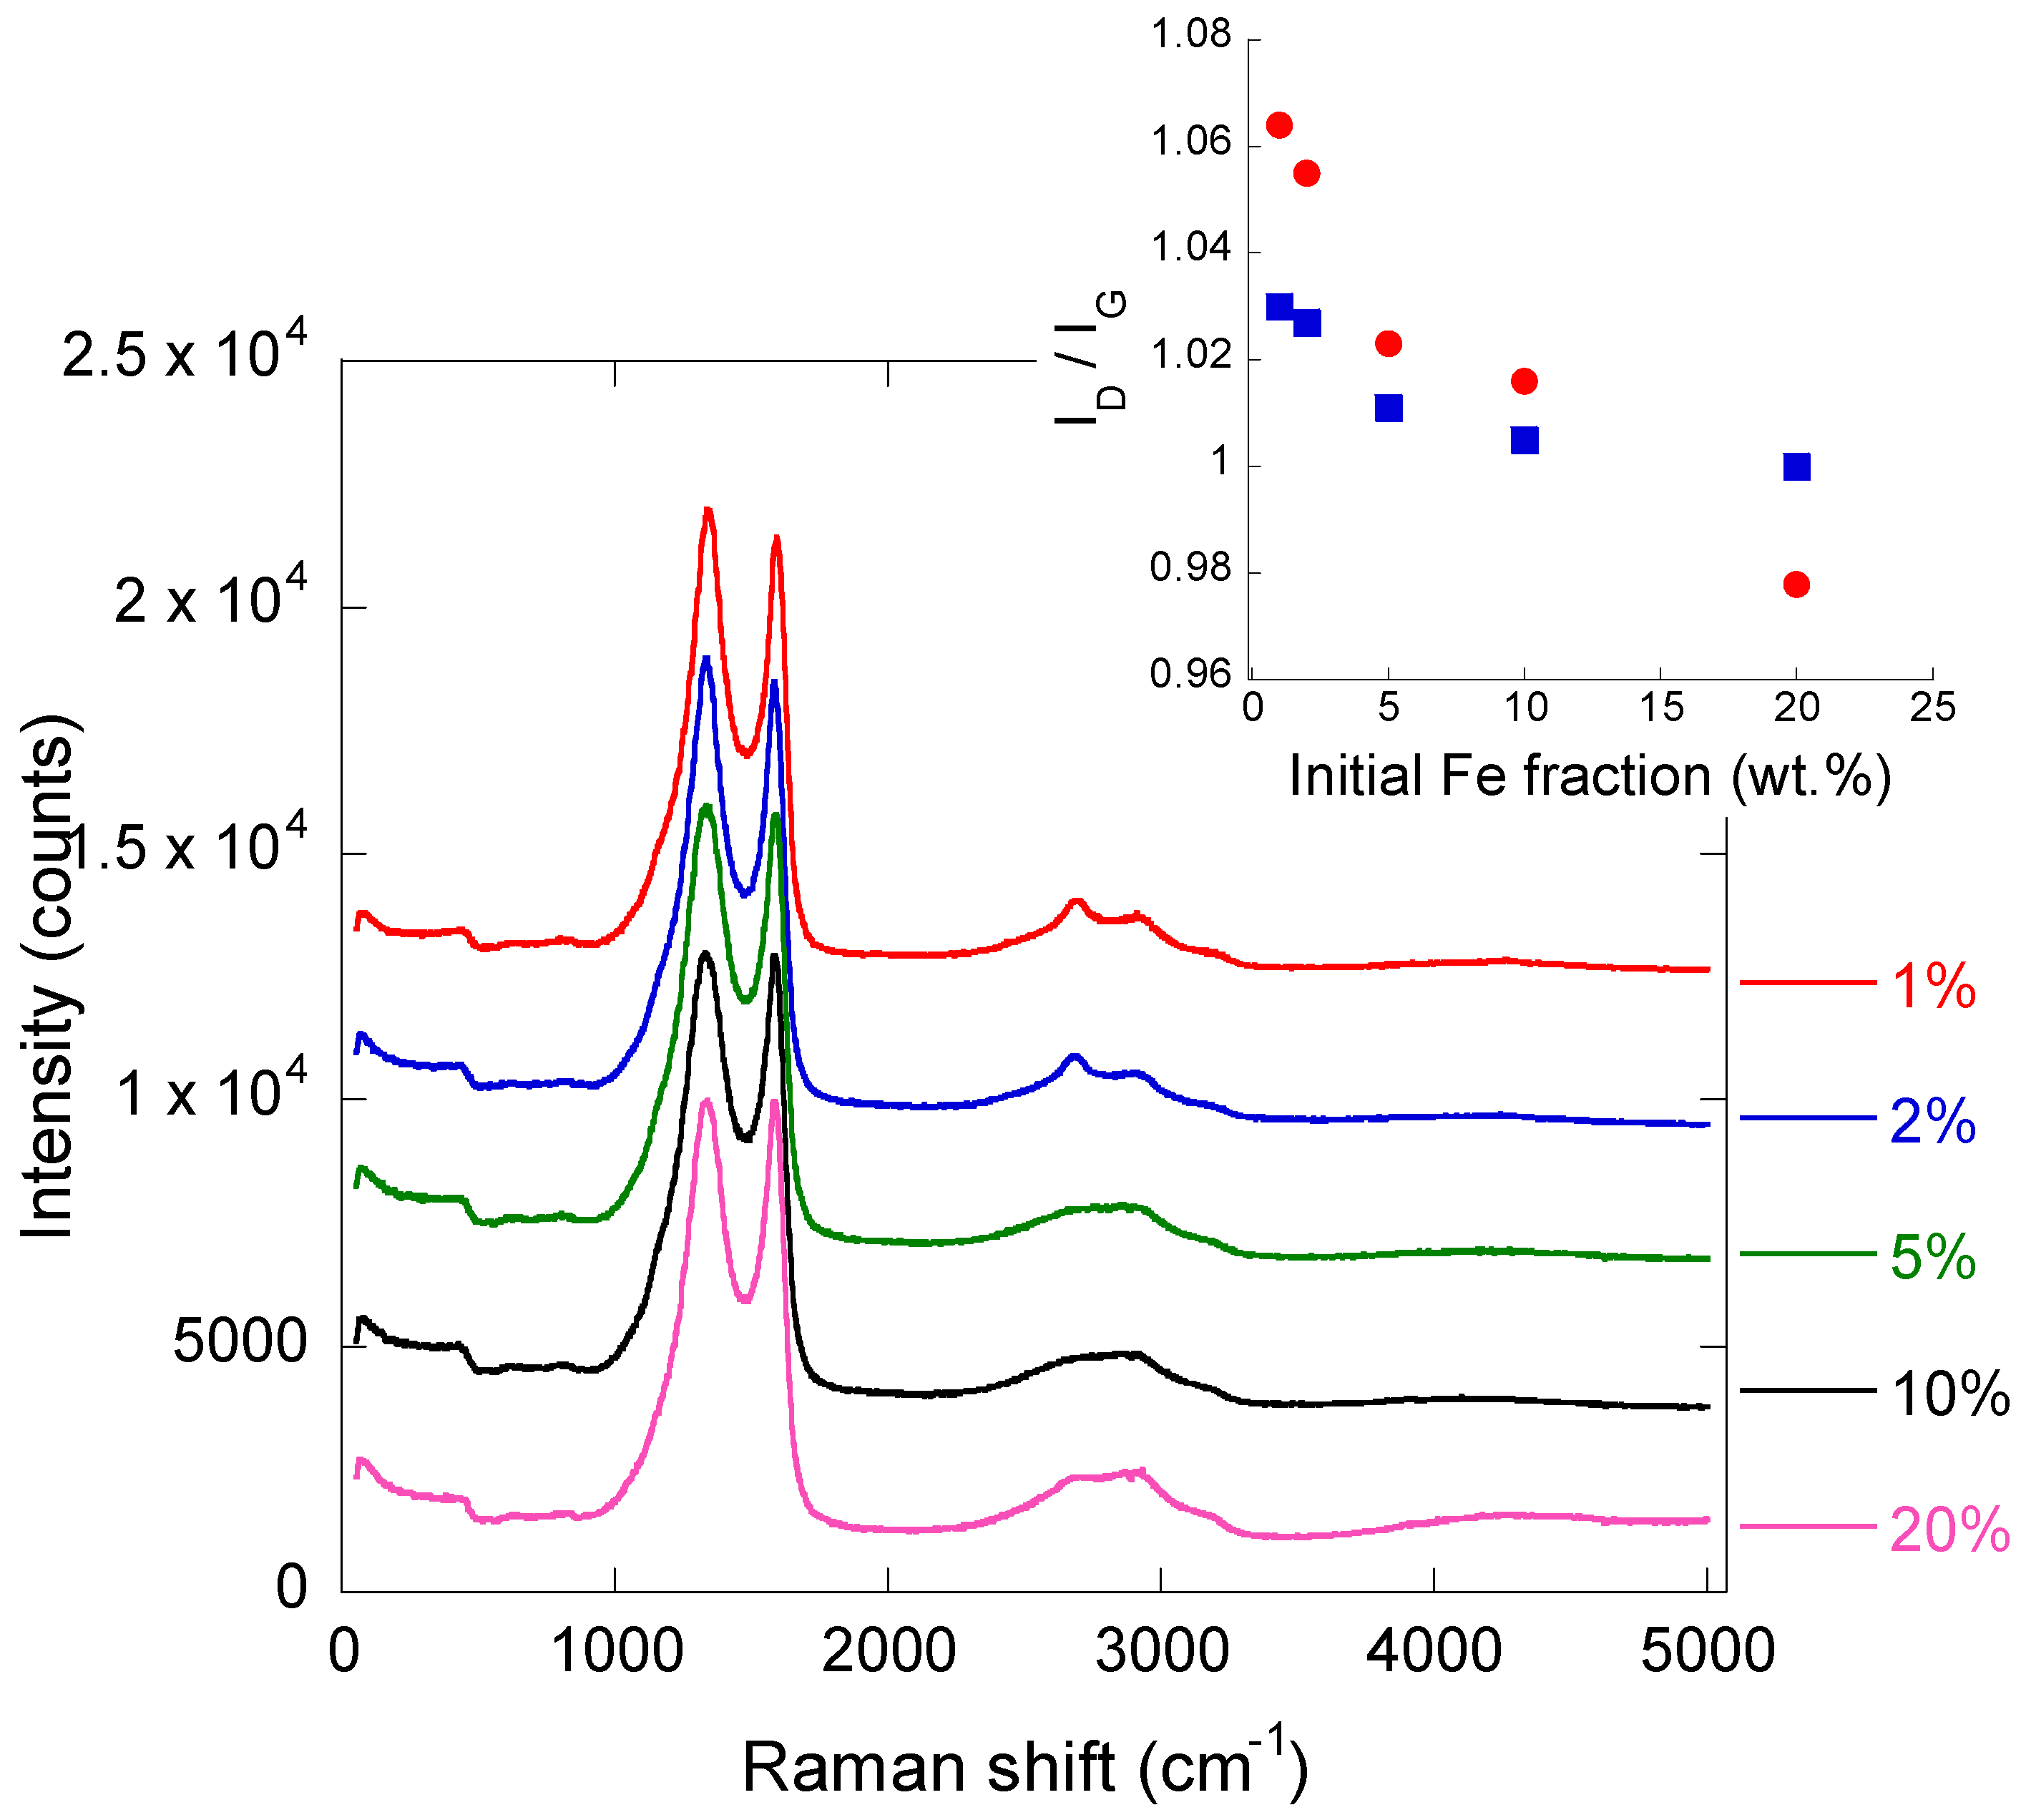
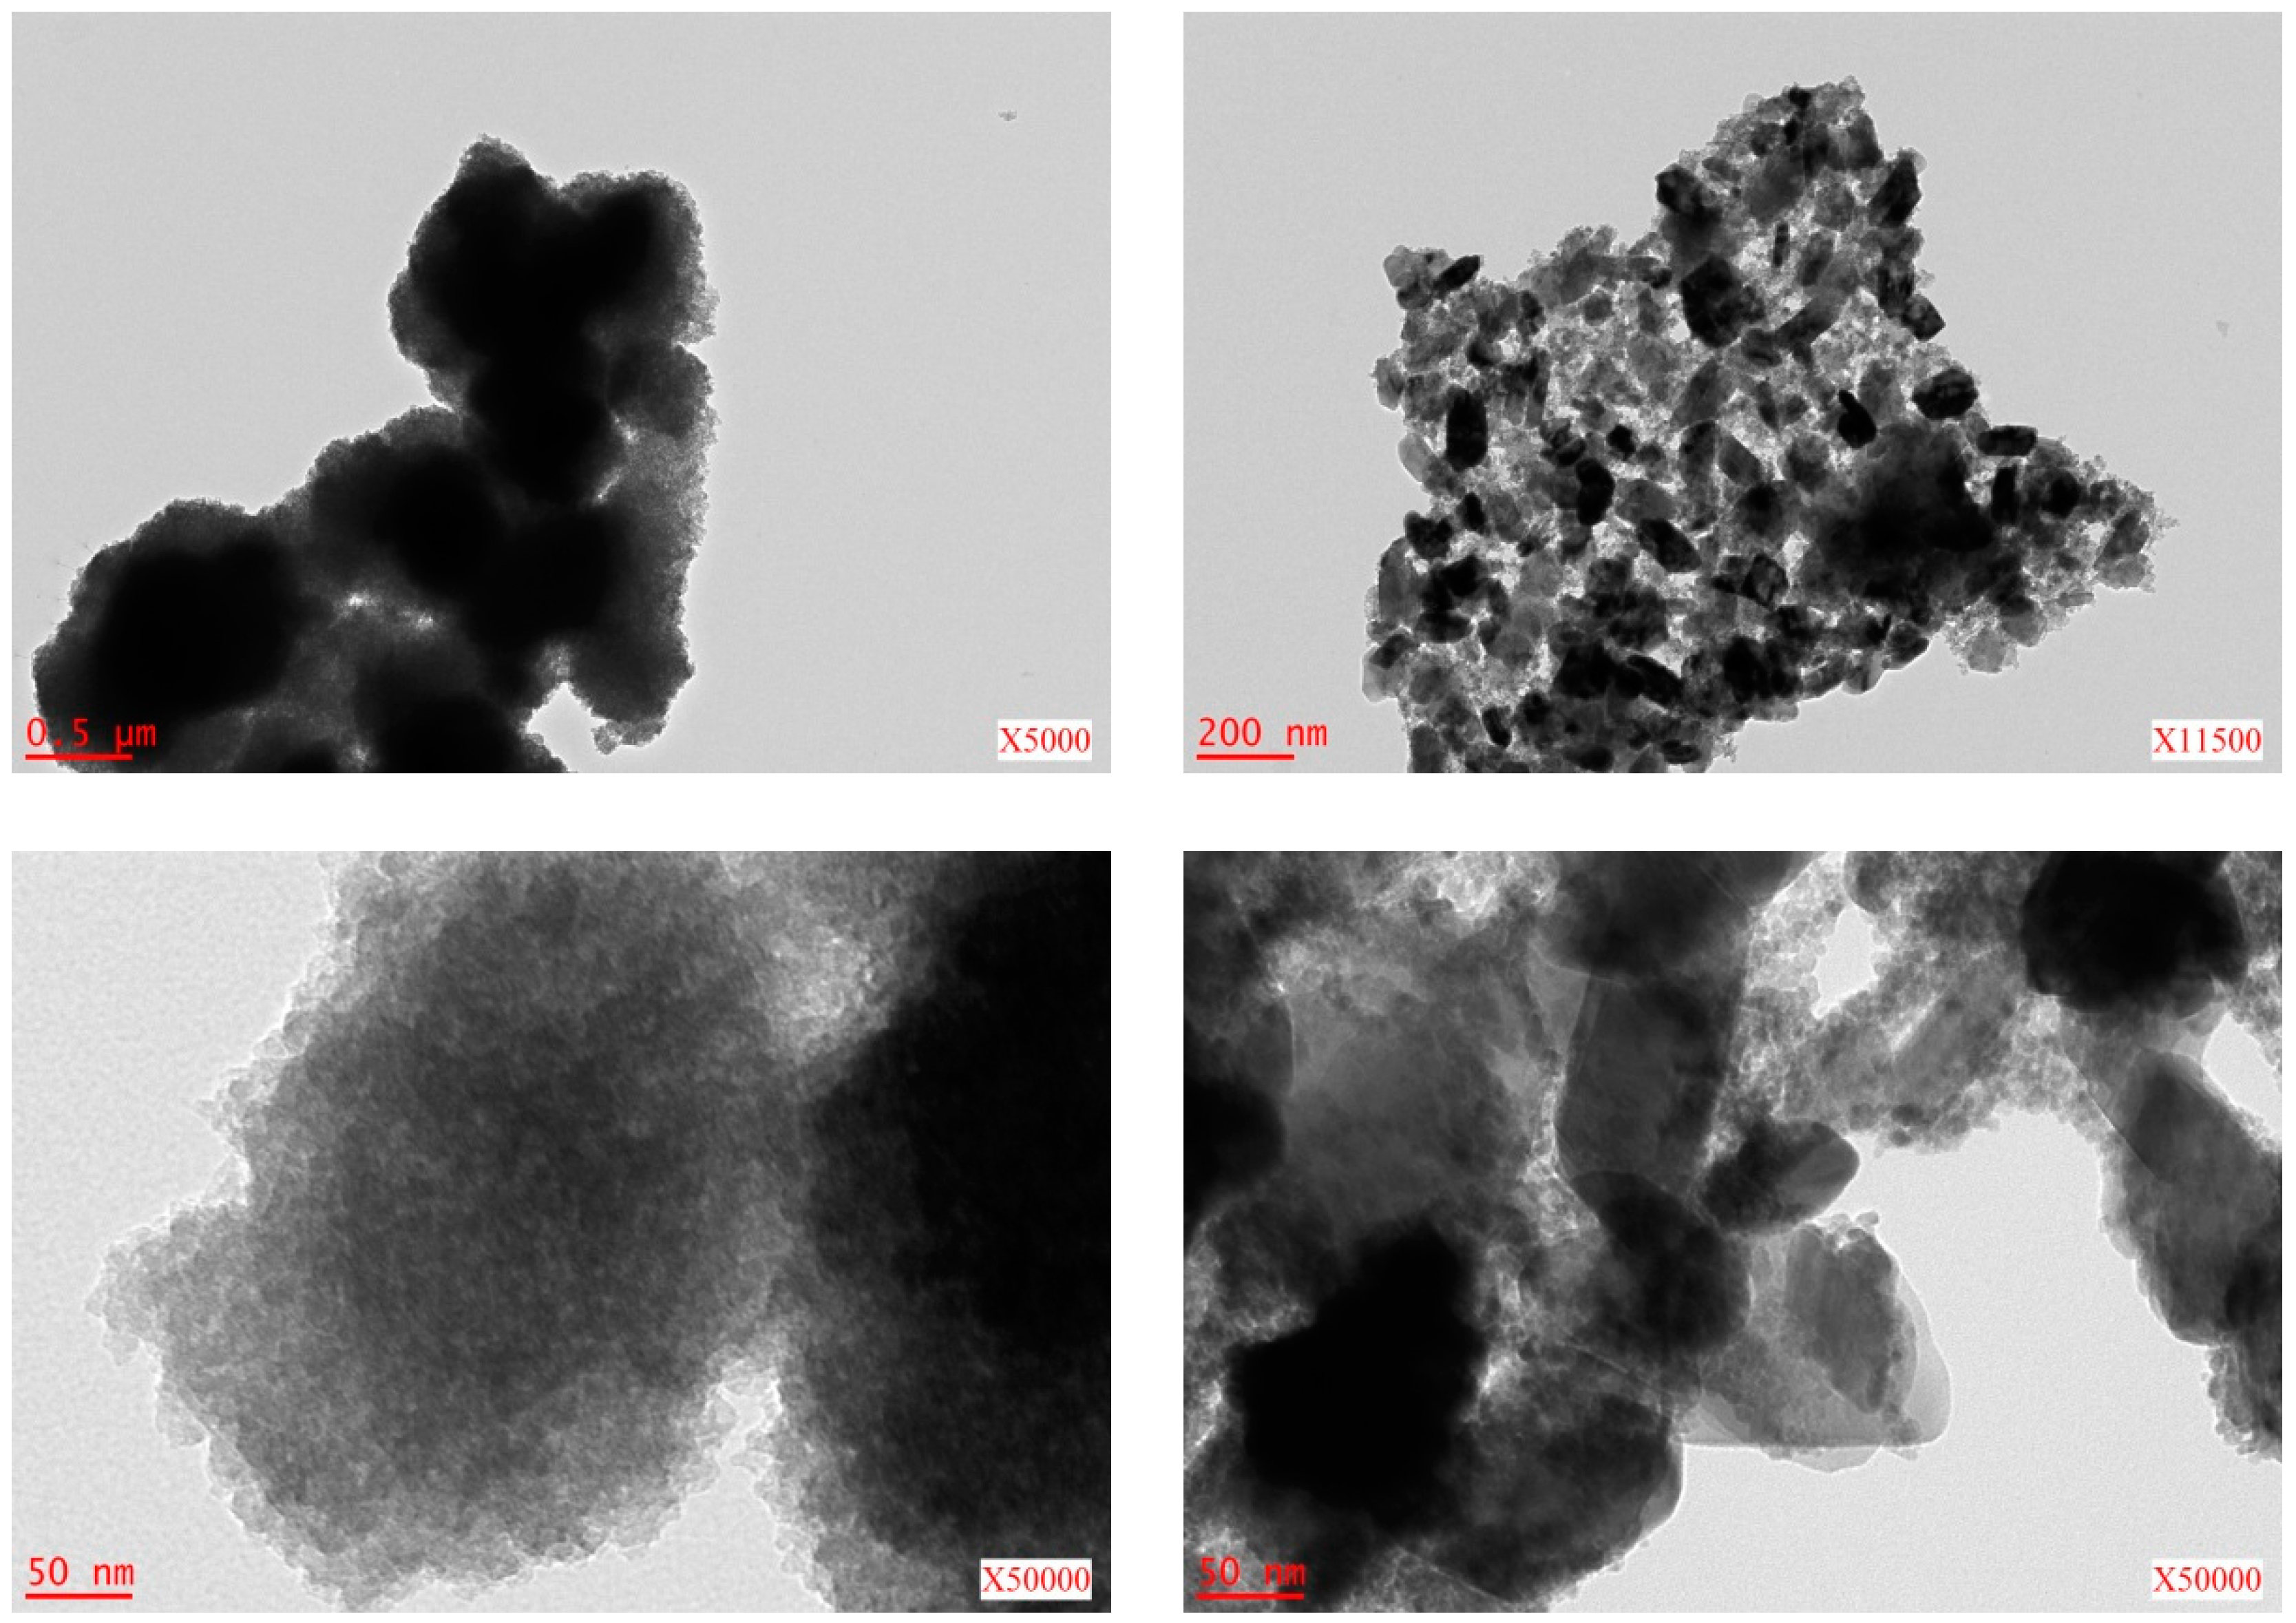
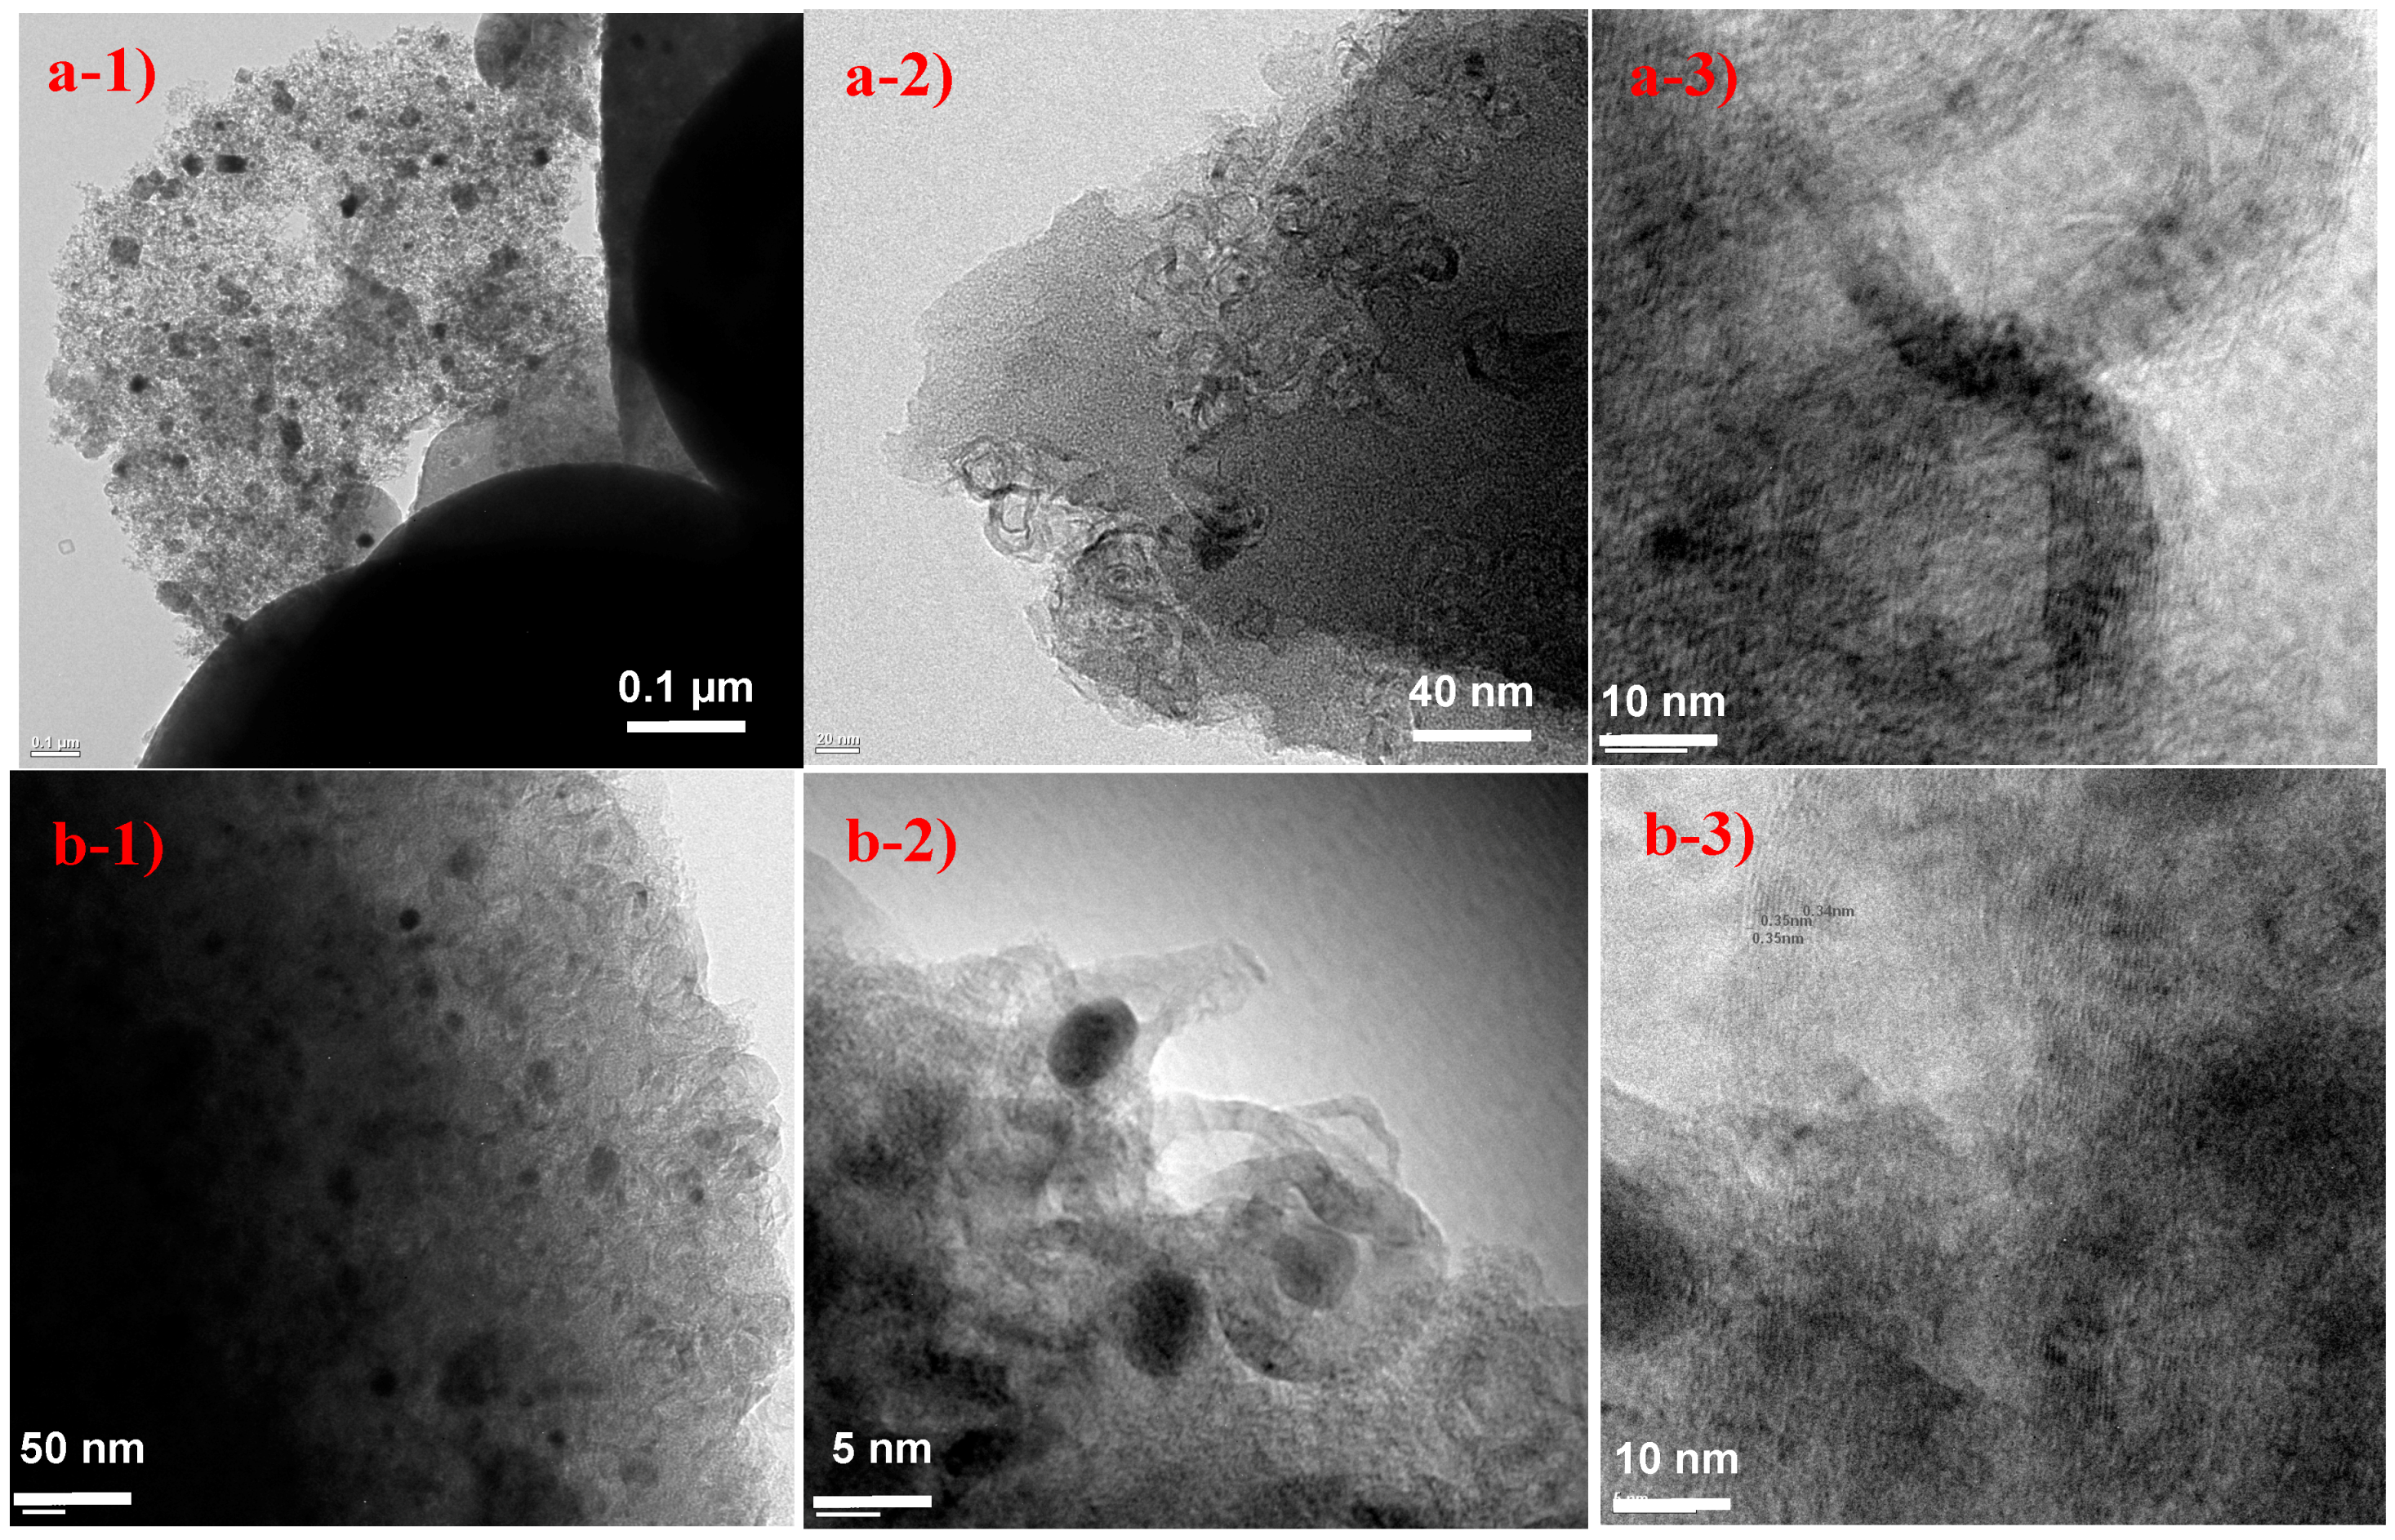
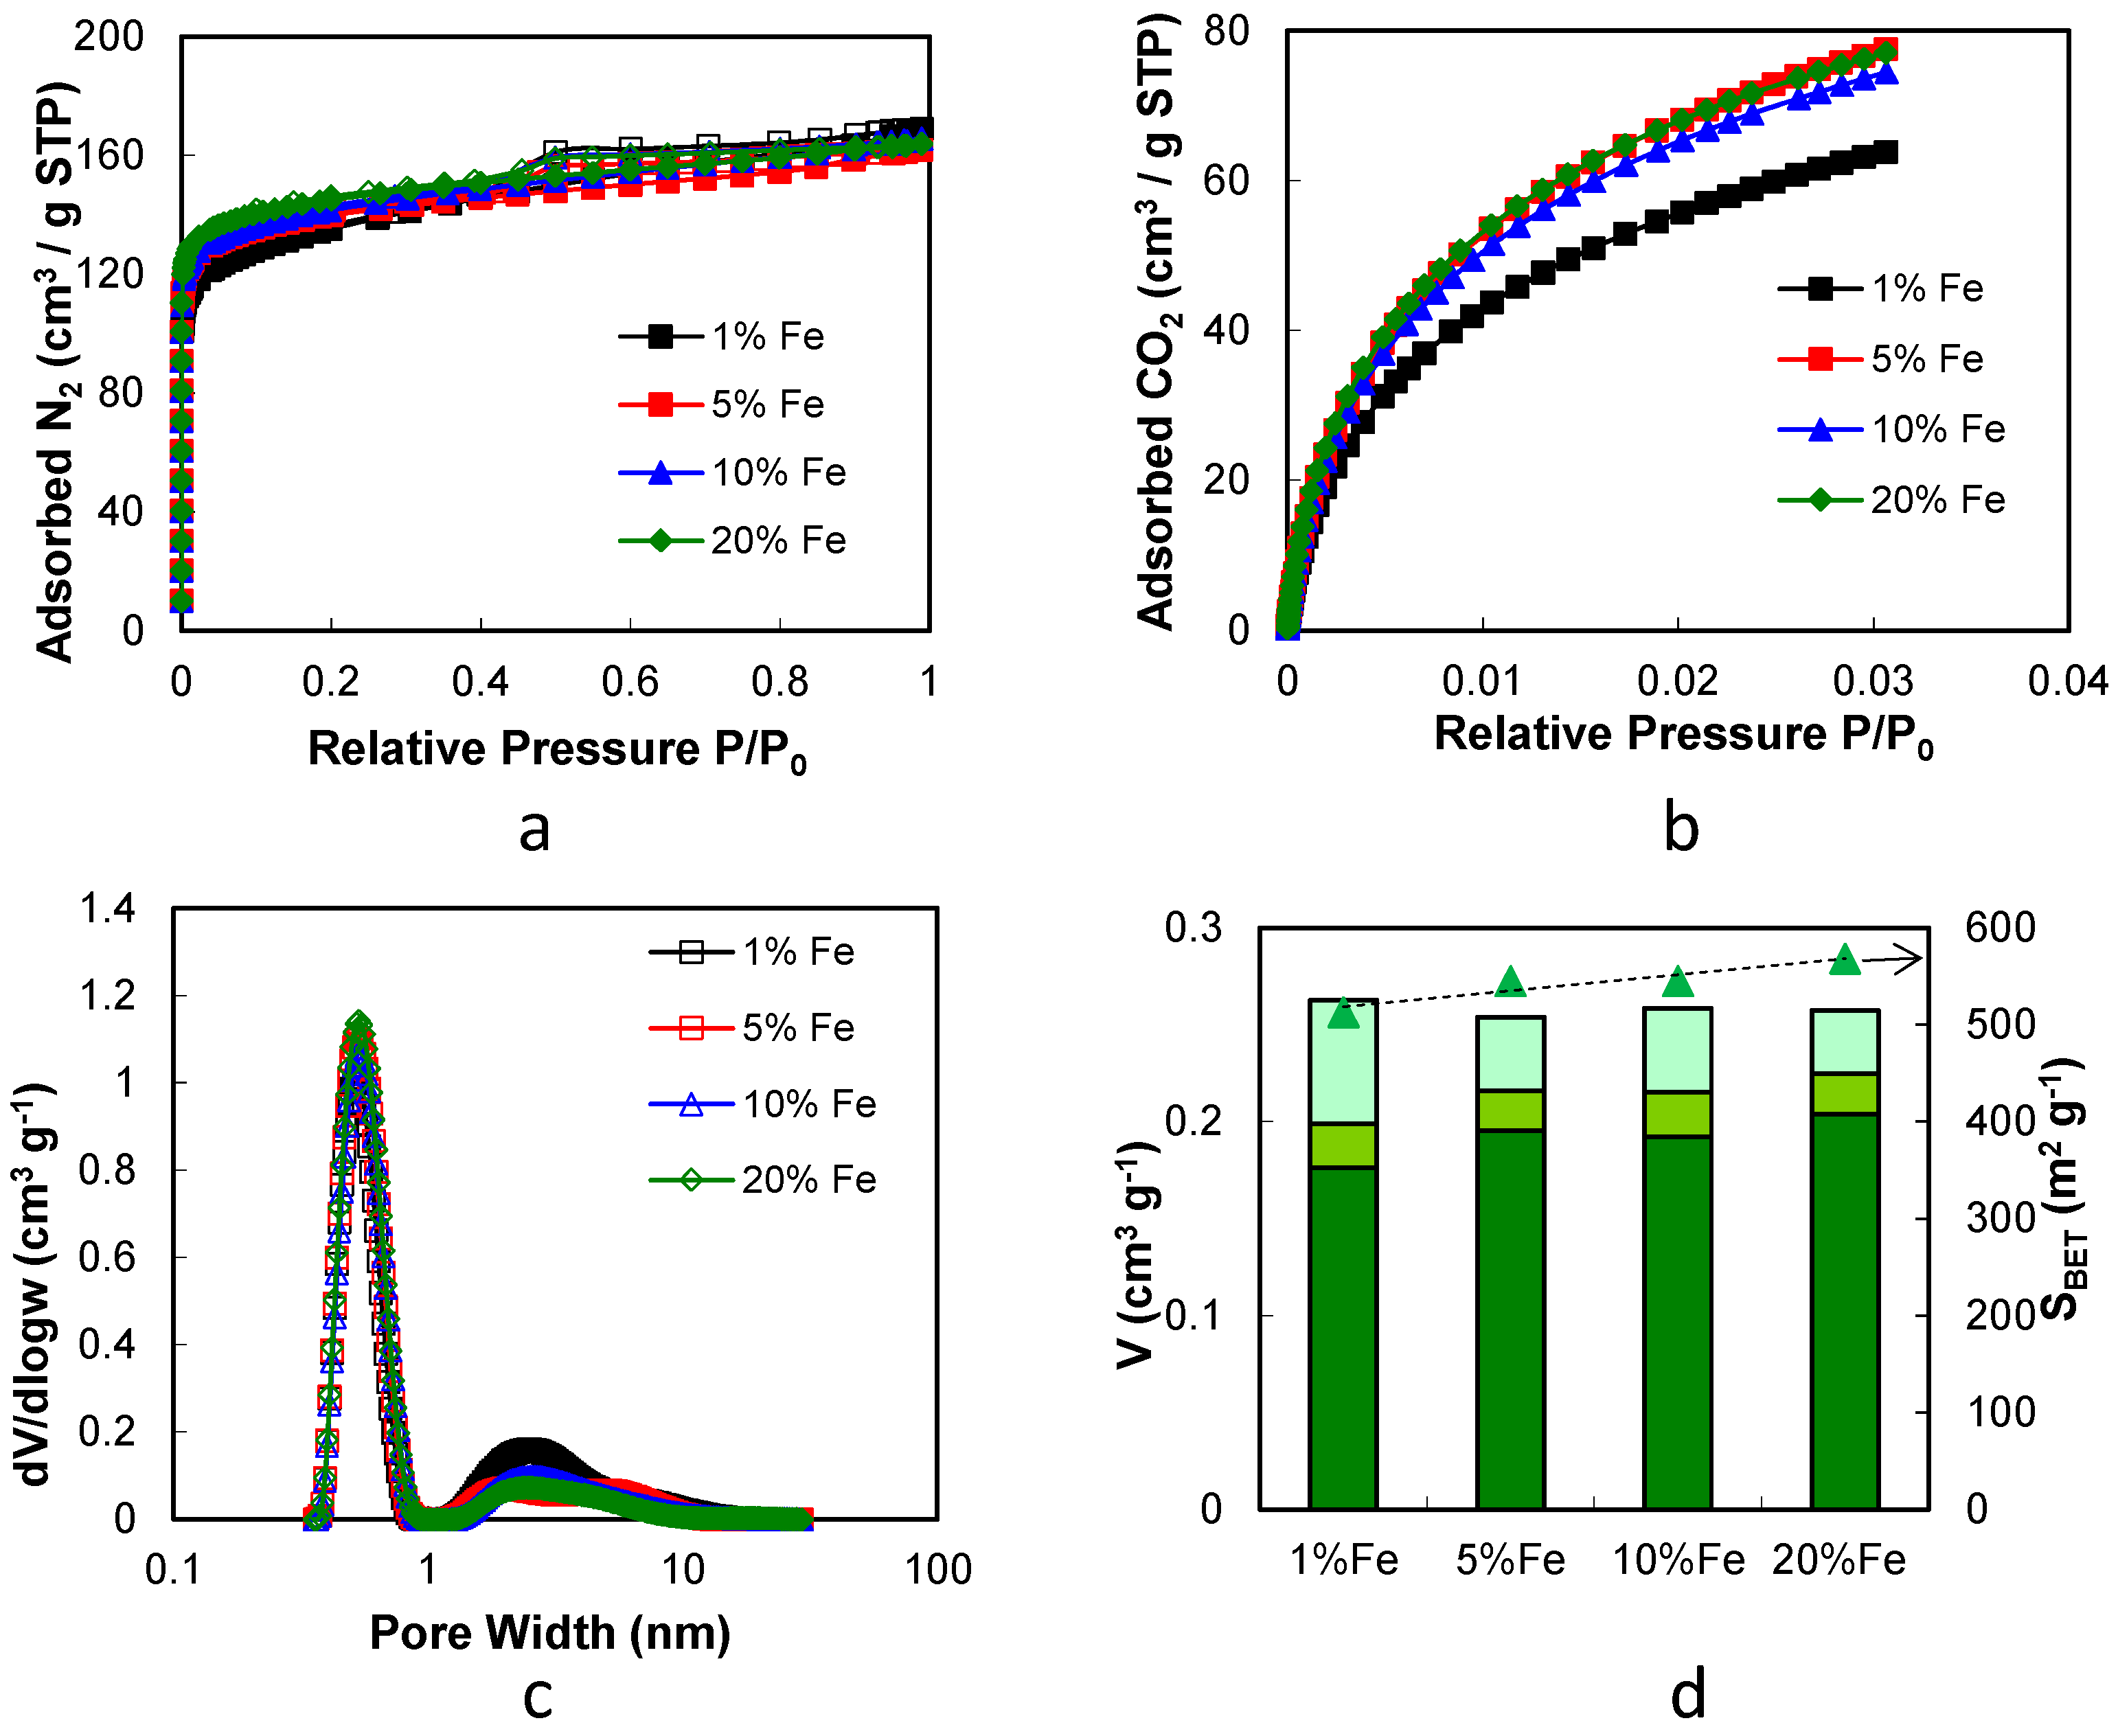
2.2. Iron/Carbon Hybrid Materials
3. Experimental section
3.1. Materials
3.1.1. Tannin
3.1.2. Synthesis of Metal Nano/Micro Oxides and Iron/Carbon Hybrid Materials
- One vanadium salt: vanadyl sulphate pentahydrate VOSO4·5H2O, supplied by VWR (Radnor, PA, USA);
- One chromium salt: ammonium chromate (NH4)2Cr2O7, supplied by Sigma-Aldrich (Saint-Louis, MO, USA);
- One nickel salt: ammonium nickel sulphate hexahydrate Ni(NH4)2(SO4)2·6H2O, supplied by Sigma-Aldrich;
- One iron salt: ammonium iron(II) sulphate hexahydrate (NH4)2Fe(SO4)2·6H2O, supplied by Merck (Darmstadt, Germany).
3.2. Materials Characterisation
3.2.1. SEM and TEM Observations
3.2.2. Pore Texture Analysis
3.2.3. X-Ray Diffraction
3.2.4. Raman Spectroscopy
4. Conclusions
Acknowledgements
Author Contributions
Conflicts of Interest
References
- Terris, B.D.; Thomson, T. Nanofabricated and self-assembled magnetic structures as data storage media. J. Phys. Appl. Phys. 2005, 38, R199. [Google Scholar] [CrossRef]
- Sun, S.; Murray, C.B.; Weller, D.; Folks, L.; Moser, A. Monodisperse FePt nanoparticles and ferromagnetic FePt nanocrystal superlattices. Science 2000, 287, 1989–1992. [Google Scholar] [CrossRef] [PubMed]
- Wang, Y.; Wei, W.; Maspoch, D.; Wu, J.; Dravid, V.P.; Mirkin, C.A. Superparamagnetic Sub-5 nm Fe@C Nanoparticles: Isolation, Structure, Magnetic Properties, and Directed Assembly. Nano Lett. 2008, 8, 3761–3765. [Google Scholar] [CrossRef] [PubMed]
- Li, G.; Joshi, V.; White, R.L.; Wang, S.X.; Kemp, J.T.; Webb, C.; Davis, R.W.; Sun, S. Detection of single micron-sized magnetic bead and magnetic nanoparticles using spin valve sensors for biological applications. J. Appl. Phys. 2003, 93, 7557–7559. [Google Scholar] [CrossRef]
- Ren, X.; Meng, X.; Chen, D.; Tang, F.; Jiao, J. Using silver nanoparticle to enhance current response of biosensor. Biosens Bioelectron. 2005, 21, 433–437. [Google Scholar] [CrossRef] [PubMed]
- Moreno-Mañas, M.; Pleixats, R. Formation of Carbon–Carbon Bonds under Catalysis by Transition-Metal Nanoparticles. Acc. Chem. Res. 2003, 36, 638–643. [Google Scholar] [CrossRef] [PubMed]
- Wang, C.-B.; Zhang, W. Synthesizing Nanoscale Iron Particles for Rapid and Complete Dechlorination of TCE and PCBs. Environ. Sci. Technol. 1997, 31, 2154–2156. [Google Scholar] [CrossRef]
- Lin, Y.-T.; Weng, C.-H.; Chen, F.-Y. Effective removal of AB24 dye by nano/micro-size zero-valent iron. Sep. Purif. Technol. 2008, 64, 26–30. [Google Scholar] [CrossRef]
- Ban, Z.; Barnakov, Y.A.; Li, F.; Golub, V.O.; O’Connor, C.J. The synthesis of core–shell iron@gold nanoparticles and their characterization. J. Mater. Chem. 2005, 15, 4660–4662. [Google Scholar] [CrossRef]
- Gupta, A.K.; Gupta, M. Synthesis and surface engineering of iron oxide nanoparticles for biomedical applications. Biomaterials 2005, 26, 3995–4021. [Google Scholar] [CrossRef] [PubMed]
- Lee, J.-H.; Huh, Y.-M.; Jun, Y.; Seo, J.; Jang, J.; Song, H.-T.; Kim, S.; Cho, E.-J.; Yoon, H.-G.; Suh, J.-S.; et al. Artificially engineered magnetic nanoparticles for ultra-sensitive molecular imaging. Nat. Med. 2007, 13, 95–99. [Google Scholar] [CrossRef] [PubMed]
- Tang, N.J.; Chen, W.; Zhong, W.; Jiang, H.Y.; Huang, S.L.; Du, Y.W. Highly stable carbon-coated Fe/SiO2 composites: Synthesis, structure and magnetic properties. Carbon 2006, 44, 423–427. [Google Scholar] [CrossRef]
- Ma, C.; Luo, B.; Song, H.; Zhi, L. Preparation of carbon-encapsulated metal magnetic nanoparticles by an instant pyrolysis method. New Carbon Mater. 2010, 25, 199–204. [Google Scholar] [CrossRef]
- Zhang, D.; Wei, S.; Kaila, C.; Su, X.; Wu, J.; Karki, A.B.; Young, D.P.; Guo, Z. Carbon-stabilized iron nanoparticles for environmental remediation. Nanoscale 2010, 2, 917–919. [Google Scholar] [CrossRef] [PubMed]
- Fung, K.K.; Qin, B.; Zhang, X.X. Passivation of α-Fe nanoparticle by epitaxial γ-Fe2O3 shell. Mater. Sci. Eng. A 2000, 286, 135–138. [Google Scholar] [CrossRef]
- Zhang, X.F.; Dong, X.L.; Huang, H.; Lv, B.; Zhu, X.G.; Lei, J.P.; Ma, S.; Liu, W.; Zhang, Z.D. Synthesis, growth mechanism and magnetic properties of SiO2-coated Co nanocapsules. Acta Materialia 2007, 55, 3727–3733. [Google Scholar] [CrossRef]
- Tokoro, H.; Nakabayashi, T.; Fujii, S.; Zhao, H.; Häfeli, U.O. Magnetic iron particles with high magnetization useful for immunoassay. J. Mag. Mag. Mater. 2009, 321, 1676–1678. [Google Scholar] [CrossRef]
- Wilson, J.L.; Poddar, P.; Frey, N.A.; Srikanth, H.; Mohomed, K.; Harmon, J.P.; Kotha, S.; Wachsmuth, J. Synthesis and magnetic properties of polymer nanocomposites with embedded iron nanoparticles. J. Appl. Phys. 2004, 95, 1439–1443. [Google Scholar] [CrossRef]
- Zhu, L.; Ma, J.; Jia, N.; Zhao, Y.; Shen, H. Chitosan-coated magnetic nanoparticles as carriers of 5-fluorouracil: Preparation, characterization and cytotoxicity studies. Colloids Surf. B Biointerfaces 2009, 68, 1–6. [Google Scholar] [CrossRef] [PubMed]
- Leslie-Pelecky, D.L.; Rieke, R.D. Magnetic Properties of Nanostructured Materials. Chem. Mater. 1996, 8, 1770–1783. [Google Scholar] [CrossRef]
- Xu, Z.P.; Zeng, Q.H.; Lu, G.Q.; Yu, A.B. Inorganic nanoparticles as carriers for efficient cellular delivery. Chem. Eng. Sci. 2006, 61, 1027–1040. [Google Scholar] [CrossRef]
- Fernández-García, M.; Martínez-Arias, A.; Hanson, J.C.; Rodriguez, J.A. Nanostructured Oxides in Chemistry: Characterization and Properties. Chem. Rev. 2004, 104, 4063–4104. [Google Scholar] [CrossRef] [PubMed]
- Wu, J.H.; Ko, S.P.; Liu, H.L.; Jung, M.H.; Lee, J.H.; Ju, J.S.; Kim, Y.K. Sub 5 nm Fe3O4 nanocrystals via coprecipitation method. Colloids Surf. Physicochem. Eng. Asp. 2008, 313–314, 268–272. [Google Scholar] [CrossRef]
- Meng, H.; Zhang, Z.; Zhao, F.; Qiu, T.; Yang, J. Orthogonal optimization design for preparation of Fe3O4 nanoparticles via chemical coprecipitation. Appl. Surf. Sci. 2013, 280, 679–685. [Google Scholar] [CrossRef]
- Zhang, X.; Jiang, W.; Gong, X.; Zhang, Z. Sonochemical synthesis and characterization of magnetic separable Fe3O4/Ag composites and its catalytic properties. J. Alloys Comp. 2010, 508, 400–405. [Google Scholar] [CrossRef]
- Feng, J.; Mao, J.; Wen, X.; Tu, M. Ultrasonic-assisted in situ synthesis and characterization of superparamagnetic Fe3O4 nanoparticles. J. Alloys Comp. 2011, 509, 9093–9097. [Google Scholar] [CrossRef]
- Lemine, O.M.; Omri, K.; Zhang, B.; Mir, L.E.; Sajieddine, M.; Alyamani, A.; Bououdina, M. Sol–gel synthesis of 8 nm magnetite (Fe3O4) nanoparticles and their magnetic properties. Superlattices Microstruct. 2012, 52, 793–799. [Google Scholar] [CrossRef]
- Cui, H.; Liu, Y.; Ren, W. Structure switch between α-Fe2O3, γ-Fe2O3 and Fe3O4 during the large scale and low temperature sol–gel synthesis of nearly monodispersed iron oxide nanoparticles. Adv. Powder Technol. 2013, 24, 93–97. [Google Scholar] [CrossRef]
- Peng, D.; Beysen, S.; Li, Q.; Jian, J.; Sun, Y.; Jiwuer, J. Hydrothermal growth of octahedral Fe3O4 crystals. Particuology 2009, 7, 35–38. [Google Scholar] [CrossRef]
- Cheng, Z.; Chu, X.; Yin, J.; Zhong, H.; Xu, J. Surfactantless synthesis of Fe3O4 magnetic nanobelts by a simple hydrothermal process. Mater. Lett. 2012, 75, 172–174. [Google Scholar] [CrossRef]
- Gao, G.; Qiu, P.; Qian, Q.; Zhou, N.; Wang, K.; Song, H.; Fu, H.; Cui, D. PEG-200-assisted hydrothermal method for the controlled-synthesis of highly dispersed hollow Fe3O4 nanoparticles. J. Alloys Comp. 2013, 574, 340–344. [Google Scholar] [CrossRef]
- Daou, T.J.; Pourroy, G.; Bégin-Colin, S.; Grenèche, J.M.; Ulhaq-Bouillet, C.; Legaré, P.; Bernhardt, P.; Leuvrey, C.; Rogez, G. Hydrothermal Synthesis of Monodisperse Magnetite Nanoparticles. Chem. Mater. 2006, 18, 4399–4404. [Google Scholar] [CrossRef]
- Hayashi, H.; Hakuta, Y. Hydrothermal Synthesis of Metal Oxide Nanoparticles in Supercritical Water. Materials 2010, 3, 3794–3817. [Google Scholar] [CrossRef]
- Mitchell, E.; De Souza, F.; Gupta, R.K.; Kahol, P.K.; Kumar, D.; Dong, L.; Gupta, B.K. Probing on the hydrothermally synthesized iron oxide nanoparticles for ultra-capacitor applications. Powder Technol. 2015, 272, 295–299. [Google Scholar] [CrossRef]
- Yu, S.H.; Cui, X.J.; Li, L.L.; Li, K.; Yu, B.; Antonietti, M.; Cölfen, H. From Starch to Metal/Carbon Hybrid Nanostructures: Hydrothermal Metal-Catalyzed Carbonization. Adv. Mater. 2004, 16, 1636–1640. [Google Scholar] [CrossRef]
- Cui, X.; Antonietti, M.; Yu, S.-H. Structural Effects of Iron Oxide Nanoparticles and Iron Ions on the Hydrothermal Carbonization of Starch and Rice Carbohydrates. Small 2006, 2, 756–759. [Google Scholar] [CrossRef] [PubMed]
- Luo, L.-B.; Yu, S.-H.; Qian, H.-S.; Gong, J.-Y. Large scale synthesis of uniform silver@carbon rich composite (carbon and cross-linked PVA) sub-microcables by a facile green chemistry carbonization approach. Chem. Commun. 2006, 793–795. [Google Scholar] [CrossRef] [PubMed]
- Titirici, M.-M. (Ed.) Sustainable Carbon Materials from Hydrothermal Processes; Wiley: Chichester, West Sussex, UK, 2013.
- Braghiroli, F.L.; Fierro, V.; Parmentier, J.; Vidal, L.; Gadonneix, P.; Celzard, A. Hydrothermal carbons produced from tannin by modification of the reaction medium: Addition of H+ and Ag+. Ind. Crops Prod. 2015, 77, 364–374. [Google Scholar] [CrossRef]
- Braghiroli, F.L.; Fierro, V.; Izquierdo, M.T.; Parmentier, J.; Pizzi, A.; Celzard, A. Nitrogen-doped carbon materials produced from hydrothermally treated tannin. Carbon 2012, 50, 5411–5420. [Google Scholar] [CrossRef]
- Braghiroli, F.L.; Fierro, V.; Szczurek, A.; Stein, N.; Parmentier, J.; Celzard, A. Electrochemical performances of hydrothermal tannin-based carbons doped with nitrogen. Ind. Crops Prod. 2015, 70, 332–340. [Google Scholar] [CrossRef]
- Braghiroli, F.L.; Fierro, V.; Szczurek, A.; Stein, N.; Parmentier, J.; Celzard, A. Hydrothermally treated aminated tannin as precursor of N-doped carbon gels for supercapacitors. Carbon 2015, 90, 63–74. [Google Scholar] [CrossRef]
- Hagerman, A.E.; Riedl, K.M.; Jones, G.A.; Sovik, K.N.; Ritchard, N.T.; Hartzfeld, P.W.; Riechel, T.L. High Molecular Weight Plant Polyphenolics (Tannins) as Biological Antioxidants. J. Agric. Food Chem. 1998, 46, 1887–1892. [Google Scholar] [CrossRef]
- Yokozawa, T.; Chen, C.P.; Dong, E.; Tanaka, T.; Nonaka, G.I.; Nishioka, I. Study on the inhibitory effect of tannins and flavonoids against the 1,1-diphenyl-2 picrylhydrazyl radical. Biochem. Pharmacol. 1998, 56, 213–222. [Google Scholar] [CrossRef]
- Amarowicz, R.; Troszyńska, A.; Shahidi, F. Antioxidant Activity of Almond Seed Extract and Its Fractions. J. Food Lipids 2005, 12, 344–358. [Google Scholar] [CrossRef]
- Saint-Cricq de Gaulejac, N.; Provost, C.; Vivas, N. Comparative Study of Polyphenol Scavenging Activities Assessed by Different Methods. J. Agric. Food Chem. 1999, 47, 425–431. [Google Scholar] [CrossRef] [PubMed]
- Karamać, M. In-vitro study on the efficacy of tannin fractions of edible nuts as antioxidants. Eur. J. Lipid Sci. Technol. 2009, 111, 1063–1071. [Google Scholar] [CrossRef]
- Szczurek, A.; Fierro, V.; Pizzi, A.; Stauber, M.; Celzard, A. A new method for preparing tannin-based foams. Ind. Crops Prod. 2014, 54, 40–53. [Google Scholar] [CrossRef]
- Szczurek, A.; Martinez de Yuso, A.; Fierro, V.; Pizzi, A.; Celzard, A. Tannin-based monoliths from emulsion-templating. Mater. Design 2015, 79, 115–126. [Google Scholar] [CrossRef]
- Braghiroli, F.L.; Fierro, V.; Izquierdo, M.T.; Parmentier, J.; Pizzi, A.; Celzard, A. Kinetics of the hydrothermal treatment of tannin for producing carbonaceous microspheres. Bioresour. Technol. 2014, 151, 271–277. [Google Scholar] [CrossRef] [PubMed]
- Titirici, M.-M.; Antonietti, M.; Thomas, A. A Generalized Synthesis of Metal Oxide Hollow Spheres Using a Hydrothermal Approach. Chem. Mater. 2006, 18, 3808–3812. [Google Scholar] [CrossRef]
- Yudin, A.; Shatrova, N.; Khaydarov, B.; Kuznetsov, D.; Dzidziguri, E.; Issi, J.-P. Synthesis of hollow nanostructured nickel oxide microspheres by ultrasonic spray atomization. J. Aerosol Sci. 2016, 98, 30–40. [Google Scholar] [CrossRef]
- Sevilla, M.; Fuertes, A.B. Catalytic graphitization of templated mesoporous carbons. Carbon 2006, 44, 468–474. [Google Scholar] [CrossRef]
- Jana, P.; Palomo del Barrio, E.; Fierro, V.; Medjahdi, G.; Celzard, A. Design of carbon foams for seasonal solar thermal energy storage. Carbon 2016, 109, 771–787. [Google Scholar] [CrossRef]
- Glatzel, S.; Schnepp, Z.; Giordano, C. From Paper to Structured Carbon Electrodes by Inkjet Printing. Angew. Chem. Int. Ed. 2013, 52, 2355–2358. [Google Scholar] [CrossRef] [PubMed]
- Sing, K.S.W. Reporting physisorption data for gas/solid systems with special reference to the determination of surface area and porosity (Recommendations 1984). Pure Appl. Chem. 1985, 57, 603–619. [Google Scholar] [CrossRef]
- Elliott, D.C. Catalytic hydrothermal gasification of biomass. Biofuels Bioprod. Biorefining 2008, 2, 254–265. [Google Scholar] [CrossRef]
- Devi, L.; Craje, M.; Thüne, P.; Ptasinski, K.J.; Janssen, F.J.J.G. Olivine as tar removal catalyst for biomass gasifiers: Catalyst characterization. Appl. Catal. Gen. 2005, 294, 68–79. [Google Scholar] [CrossRef]
- Courson, C.; Petit, C.; Kiennemann, A.; Foscolo, P.U.; Rapagnà, S.; Matera, M. Catalyseur pour la gazèification de la biomasse en lit fluidisé, procédé d’obtention et utilisations d’un tel catalyseur. European Patent PCT/FR01/01547, 18 May 2001. [Google Scholar]
- Kruse, A.; Funke, A.; Titirici, M.-M. Hydrothermal conversion of biomass to fuels and energetic materials. Curr. Opin. Chem. Biol. 2013, 17, 515–521. [Google Scholar] [CrossRef] [PubMed]
- Oliveira, L.C. A.; Rios, R.V. R.A.; Fabris, J.D.; Garg, V.; Sapag, K.; Lago, R.M. Activated carbon/iron oxide magnetic composites for the adsorption of contaminants in water. Carbon 2002, 40, 2177–2183. [Google Scholar] [CrossRef]
- Yang, N.; Zhu, S.; Zhang, D.; Xu, S. Synthesis and properties of magnetic Fe3O4-activated carbon nanocomposite particles for dye removal. Mater. Lett. 2008, 62, 645–647. [Google Scholar] [CrossRef]
- Zhou, L.; Shao, Y.; Liu, J.; Ye, Z.; Zhang, H.; Ma, J.; Jia, Y.; Gao, W.; Li, Y. Preparation and Characterization of Magnetic Porous Carbon Microspheres for Removal of Methylene Blue by a Heterogeneous Fenton Reaction. ACS Appl. Mater. Interfaces 2014, 6, 7275–7285. [Google Scholar] [CrossRef] [PubMed]
- Brunauer, S.; Emmett, P.H.; Teller, E. Adsorption of Gases in Multimolecular Layers. J. Am. Chem. Soc. 1938, 60, 309–319. [Google Scholar] [CrossRef]
- Lippens, B. Studies on pore systems in catalysts V. The t method. J. Catal. 1965, 4, 319–323. [Google Scholar] [CrossRef]
- Gregg, S.J.; Sing, K.S.W. Adsorption, Surface Area, and Porosity; Academic Press: London, UK, 1991. [Google Scholar]
- Tarazona, P. Solid-fluid transition and interfaces with density functional approaches. Proc. 14th Eur. Conf. Surf. Sci. 1995, 331, 989–994. [Google Scholar] [CrossRef]
- Pawlyta, M.; Rouzaud, J.-N.; Duber, S. Raman microspectroscopy characterization of carbon blacks: Spectral analysis and structural information. Carbon 2015, 84, 479–490. [Google Scholar] [CrossRef]


| Metal Salt | Specific Weight (g·cm−3) a | BET Surface Area (m2·g−1) | Pore Volume (cm3·g−1) | Particle Size (nm) d | Cystallite Size (nm) e |
|---|---|---|---|---|---|
| VOSO4·5H2O | 3.27 | 6.5 c | 0.002 c | 280 | 170 |
| (NH4)2Cr2O7 | 4.27 | 20.7 c | 0.006 c | 70 | 55 |
| Ni(NH4)2(SO4)2·6H2O | 6.10 | 161 b | 0.412 b | 6 | 40 |
| (NH4)2Fe(SO4)2·6H2O | 5.24 | 29.2 c | 0.008 c | 40 | 9 |
| Fe–Carbon Hybrid Materials Containing: | SBET (m2·g−1) | SDFT (m2·g−1) | V0.97 (cm3·g−1) | Vµ,N2 (cm3·g−1) | Vµ,CO2 (cm3·g−1) | Vµ,NLDFT (cm3·g−1) | Vm (cm3·g−1) | ρ (cm3·g−1) |
|---|---|---|---|---|---|---|---|---|
| 1% Fe | 513 | 756 | 0.26 | 0.19 | 0.21 | 0.20 | 0.06 | 2.25 |
| 5% Fe | 545 | 808 | 0.26 | 0.21 | 0.26 | 0.22 | 0.04 | 2.32 |
| 10% Fe | 545 | 805 | 0.26 | 0.21 | 0.25 | 0.22 | 0.04 | 2.42 |
| 20% Fe | 568 | 841 | 0.25 | 0.21 | 0.25 | 0.22 | 0.03 | 2.67 |
© 2017 by the authors. Licensee MDPI, Basel, Switzerland. This article is an open access article distributed under the terms and conditions of the Creative Commons Attribution (CC BY) license ( http://creativecommons.org/licenses/by/4.0/).
Share and Cite
Braghiroli, F.L.; Fierro, V.; Szczurek, A.; Gadonneix, P.; Ghanbaja, J.; Parmentier, J.; Medjahdi, G.; Celzard, A. Hydrothermal Treatment of Tannin: A Route to Porous Metal Oxides and Metal/Carbon Hybrid Materials. Inorganics 2017, 5, 7. https://doi.org/10.3390/inorganics5010007
Braghiroli FL, Fierro V, Szczurek A, Gadonneix P, Ghanbaja J, Parmentier J, Medjahdi G, Celzard A. Hydrothermal Treatment of Tannin: A Route to Porous Metal Oxides and Metal/Carbon Hybrid Materials. Inorganics. 2017; 5(1):7. https://doi.org/10.3390/inorganics5010007
Chicago/Turabian StyleBraghiroli, Flavia L., Vanessa Fierro, Andrzej Szczurek, Philippe Gadonneix, Jaafar Ghanbaja, Julien Parmentier, Ghouti Medjahdi, and Alain Celzard. 2017. "Hydrothermal Treatment of Tannin: A Route to Porous Metal Oxides and Metal/Carbon Hybrid Materials" Inorganics 5, no. 1: 7. https://doi.org/10.3390/inorganics5010007
APA StyleBraghiroli, F. L., Fierro, V., Szczurek, A., Gadonneix, P., Ghanbaja, J., Parmentier, J., Medjahdi, G., & Celzard, A. (2017). Hydrothermal Treatment of Tannin: A Route to Porous Metal Oxides and Metal/Carbon Hybrid Materials. Inorganics, 5(1), 7. https://doi.org/10.3390/inorganics5010007