Article

Facile Synthesis and Characterization of Novel Fe0.65Mg0.35Cr2O4@C Nanocomposite for Efficient Removal of Cd(II) Ions from Aqueous Media

1
Department of Chemistry, College of Science, Imam Mohammad Ibn Saud Islamic University (IMSIU), Riyadh 11623, Saudi Arabia
2
Department of Chemistry, Faculty of Science, Umm Al-Qura University, Makkah 21955, Saudi Arabia
*
Author to whom correspondence should be addressed.
Inorganics 2025, 13(3), 82; https://doi.org/10.3390/inorganics13030082
Submission received: 13 February 2025 / Revised: 6 March 2025 / Accepted: 10 March 2025 / Published: 12 March 2025

Abstract

:
Cd(II) ions pose significant environmental and health threats due to their extreme toxicity, persistence, and bioaccumulation in ecosystems. They are associated with severe health disorders such as bone damage, kidney failure, and carcinogenic effects and disrupt aquatic life by impairing enzymatic and reproductive processes. In this research, novel Fe0.65Mg0.35Cr2O4@C nanocomposites, synthesized using the Pechini sol–gel method at 600 °C (F600) and 800 °C (F800), were investigated for their efficacy in removing Cd(II) ions from aqueous media. FE-SEM analysis showed that F600 had agglomerated spherical nanoparticles with an average grain size of 45.71 nm and a relatively porous structure, while F800 displayed denser and more compact spherical nanoparticles with an average grain size of 73.65 nm. HR-TEM images confirmed these findings, showing that F600 nanoparticles were loosely arranged with an average particle diameter of 14.72 nm, whereas F800 exhibited larger, more aggregated particles with an average diameter of 59.22 nm, reflecting enhanced particle coalescence at higher temperatures. EDX analysis confirmed the elemental composition of both samples, with F600 containing higher carbon content (7.0%) compared to F800 (3.4%), attributed to the more complete combustion of organic precursors during F800’s synthesis. This difference in composition, along with the structural variations, influenced their adsorption performance. F600 demonstrated superior adsorption with a maximum capacity of 295.86 mg/g compared to F800’s 185.19 mg/g. Thermodynamic and kinetic analyses confirmed that the adsorption was exothermic, spontaneous, and governed by a physical mechanism following the pseudo-second-order model and Langmuir isotherm. The superior performance of F600 is attributed to its higher surface area, porosity, and smaller particle size, which enhance the availability of active adsorption sites.

1. Introduction

Water contamination with heavy metals is a pervasive and pressing global issue stemming from both natural and anthropogenic sources. Naturally, heavy metals can leach into water bodies through the weathering of rocks, volcanic activities, and soil erosion [1,2,3]. However, human-induced factors dominate the current crisis. Industrial discharges from mining, metal plating, battery manufacturing, and chemical production release significant quantities of heavy metals into rivers, lakes, and groundwater systems. Agricultural activities also contribute via the excessive use of fertilizers and pesticides containing metals such as cadmium (Cd), arsenic (As), and lead (Pb). Additionally, improper waste disposal and wastewater treatment failures exacerbate the accumulation of toxic metals in aquatic environments [4,5,6]. Understanding these sources is crucial for mitigating their adverse impact and developing sustainable remediation strategies. Heavy metals pose severe threats to ecosystems and human health due to their toxicity, persistence, and bioaccumulative nature. In aquatic systems, they disrupt biodiversity by affecting the growth and reproduction of aquatic organisms. Metals such as mercury (Hg), lead (Pb), and cadmium (Cd) interfere with aquatic food chains leading to bioaccumulation and biomagnification [7,8]. In humans, exposure to heavy metals causes serious health risks including neurological, developmental, cardiovascular, and renal damage. For instance, lead exposure is linked to cognitive impairments in children while chronic cadmium ingestion can result in bone damage and kidney dysfunction [9]. Environmentally, heavy metals can alter soil quality, hinder plant growth, and reduce agricultural productivity. Their long-term persistence in the environment underscores the importance of effective management and treatment solutions [10]. Cadmium (Cd) is classified as a priority pollutant due to its extreme toxicity and widespread occurrence. The divalent cadmium ion (Cd(II)) is particularly harmful, easily dissolving in water and becoming bioavailable in aquatic systems. Once ingested through contaminated water or food, Cd(II) accumulates in the liver, kidneys, and bones, leading to conditions such as Itai-Itai disease characterized by severe bone pain and fractures [11,12]. Cd(II) exposure is also associated with carcinogenic effects, lung damage, and kidney failure [13]. Environmentally, Cd(II) negatively affects aquatic life by impairing enzymatic processes and reproductive systems. Its mobility through soil and sediment complicates remediation efforts necessitating innovative, cost-effective solutions to address this persistent threat [14,15]. Several techniques have been developed to remove heavy metals from contaminated water, each offering distinct mechanisms and effectiveness levels. Adsorption is a widely used method that involves binding heavy metal ions onto solid adsorbents, offering high efficiency and flexibility [16]. Chemical precipitation depends on the addition of precipitating agents, where heavy metals form insoluble compounds that can be separated from the water [17]. Techniques like reverse osmosis and nanofiltration effectively remove dissolved heavy metals by physically separating them [18,19]. Electrocoagulation utilizes electrical current to precipitate and collect heavy metals [20]. Biological processes use microorganisms or plants to degrade, immobilize, or extract heavy metals from water [21,22]. Adsorption is widely regarded as one of the most promising techniques for heavy metal removal due to its simplicity, cost-effectiveness, and high removal efficiency [23]. Unlike chemical precipitation and membrane filtration, adsorption typically requires minimal operational costs and is less sensitive to variations in water quality such as pH and ionic strength. Adsorbents, particularly those derived from natural or low-cost materials, can be regenerated and reused, enhancing their sustainability. Moreover, adsorption avoids the production of secondary pollutants, a common drawback in chemical treatments. Its adaptability to a wide range of heavy metals, coupled with the ability to scale up for industrial applications, makes adsorption an ideal solution for large-scale water treatment. Metal oxide nanoparticles and their composites have garnered significant attention in water treatment applications due to their unique structural, electronic, and surface properties. Their high surface area, enhanced reactivity, and tunable surface functionalities enable efficient adsorption of heavy metals from aqueous solutions [24,25]. However, the adsorption capacity of conventional adsorbents remains a limiting factor in large-scale applications. For instance, modified biochar [26], Fe3O4/g-C3N4 composite [27], and FAU-type zeolite [28] have demonstrated maximum Cd(II) adsorption capacities of 108.54 mg/g, 102.00 mg/g, and 74.07 mg/g, respectively, indicating moderate efficiency. In this study, we report the facile synthesis of a novel Fe0.65Mg0.35Cr2O4@C nanocomposites via the Pechini sol–gel method at 600 °C (F600) and 800 °C (F800), and then evaluate its performance for the efficient removal of Cd(II) ions from aqueous media. The synthesized nanocomposites were subjected to systematic characterization, including XRD, FE-SEM, HR-TEM, and EDX, to assess their structural and morphological properties. The optimized synthesis at 600 °C resulted in a smaller crystallite size, higher porosity, and enhanced surface area, contributing to superior adsorption efficiency compared to F800. The F600 nanocomposite exhibited an exceptionally high Cd(II) adsorption capacity, surpassing many previously reported adsorbents. Hence, this study provides valuable insights into the design and optimization of novel metal oxide–carbon nanocomposites for water purification applications. The findings emphasize the synergistic effects of Fe, Mg, and Cr oxides with carbon, paving the way for future advancements in nanostructured adsorbents for heavy metal remediation.

2. Results and Discussion

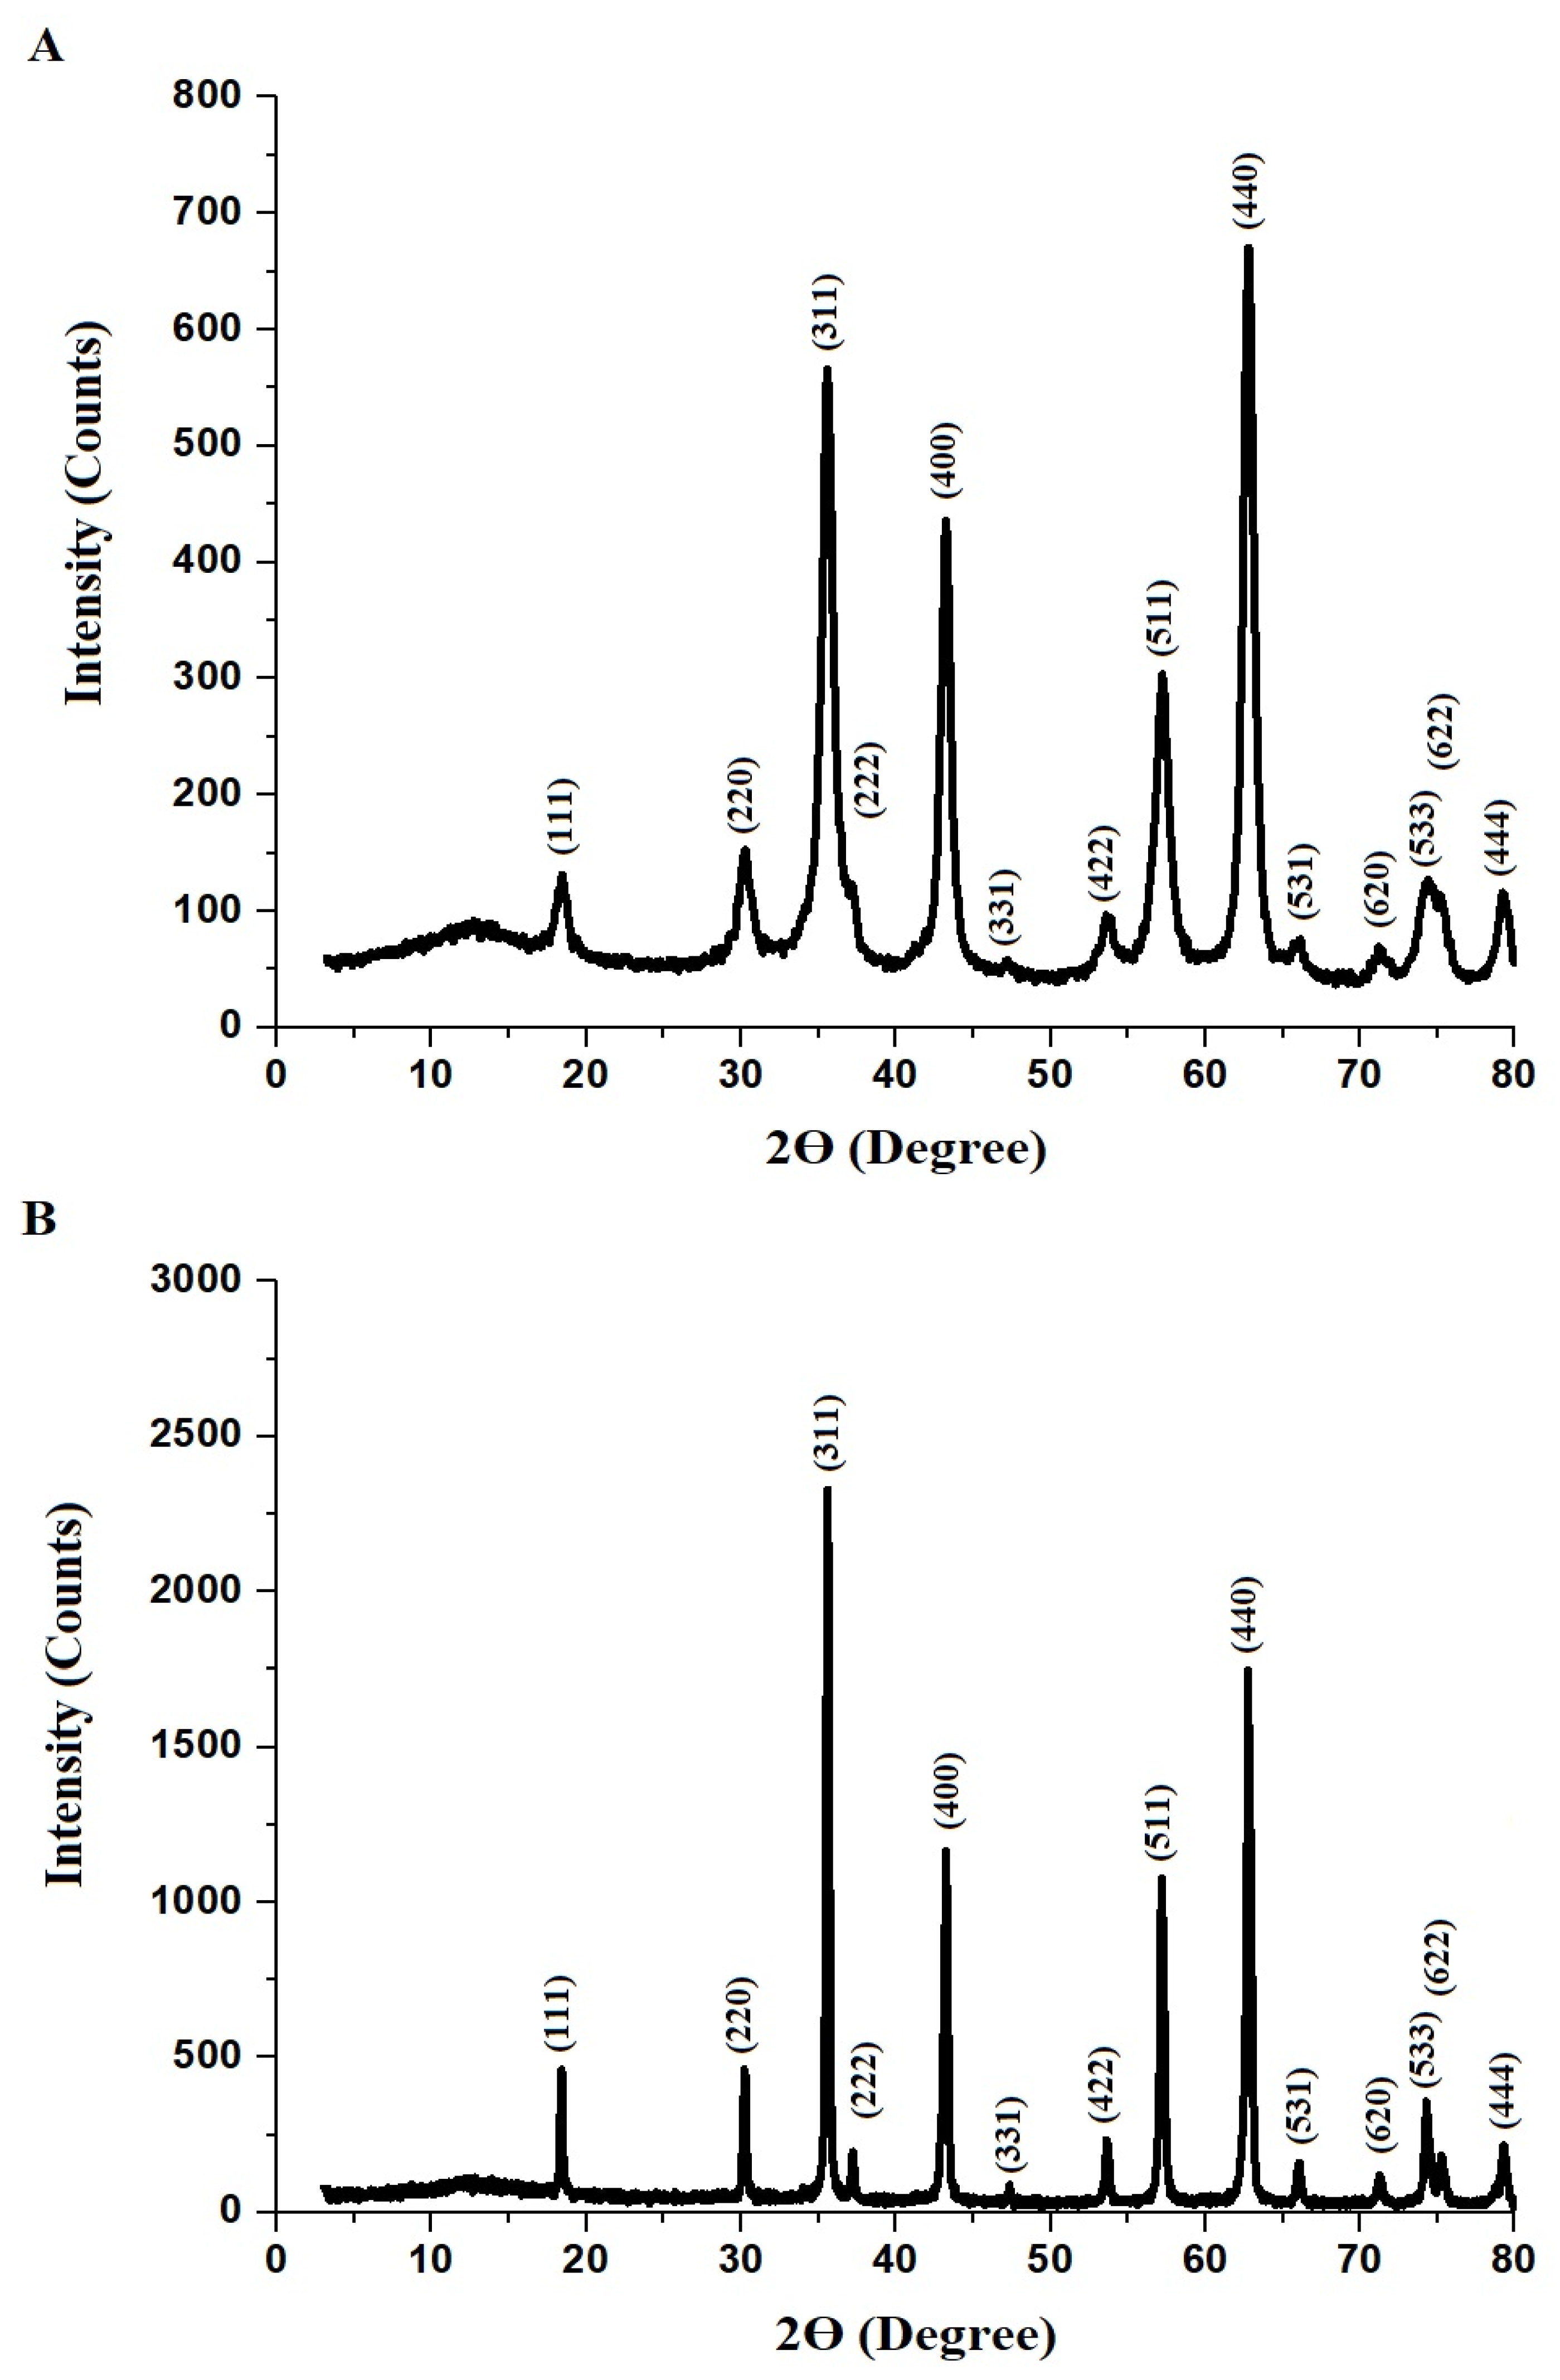
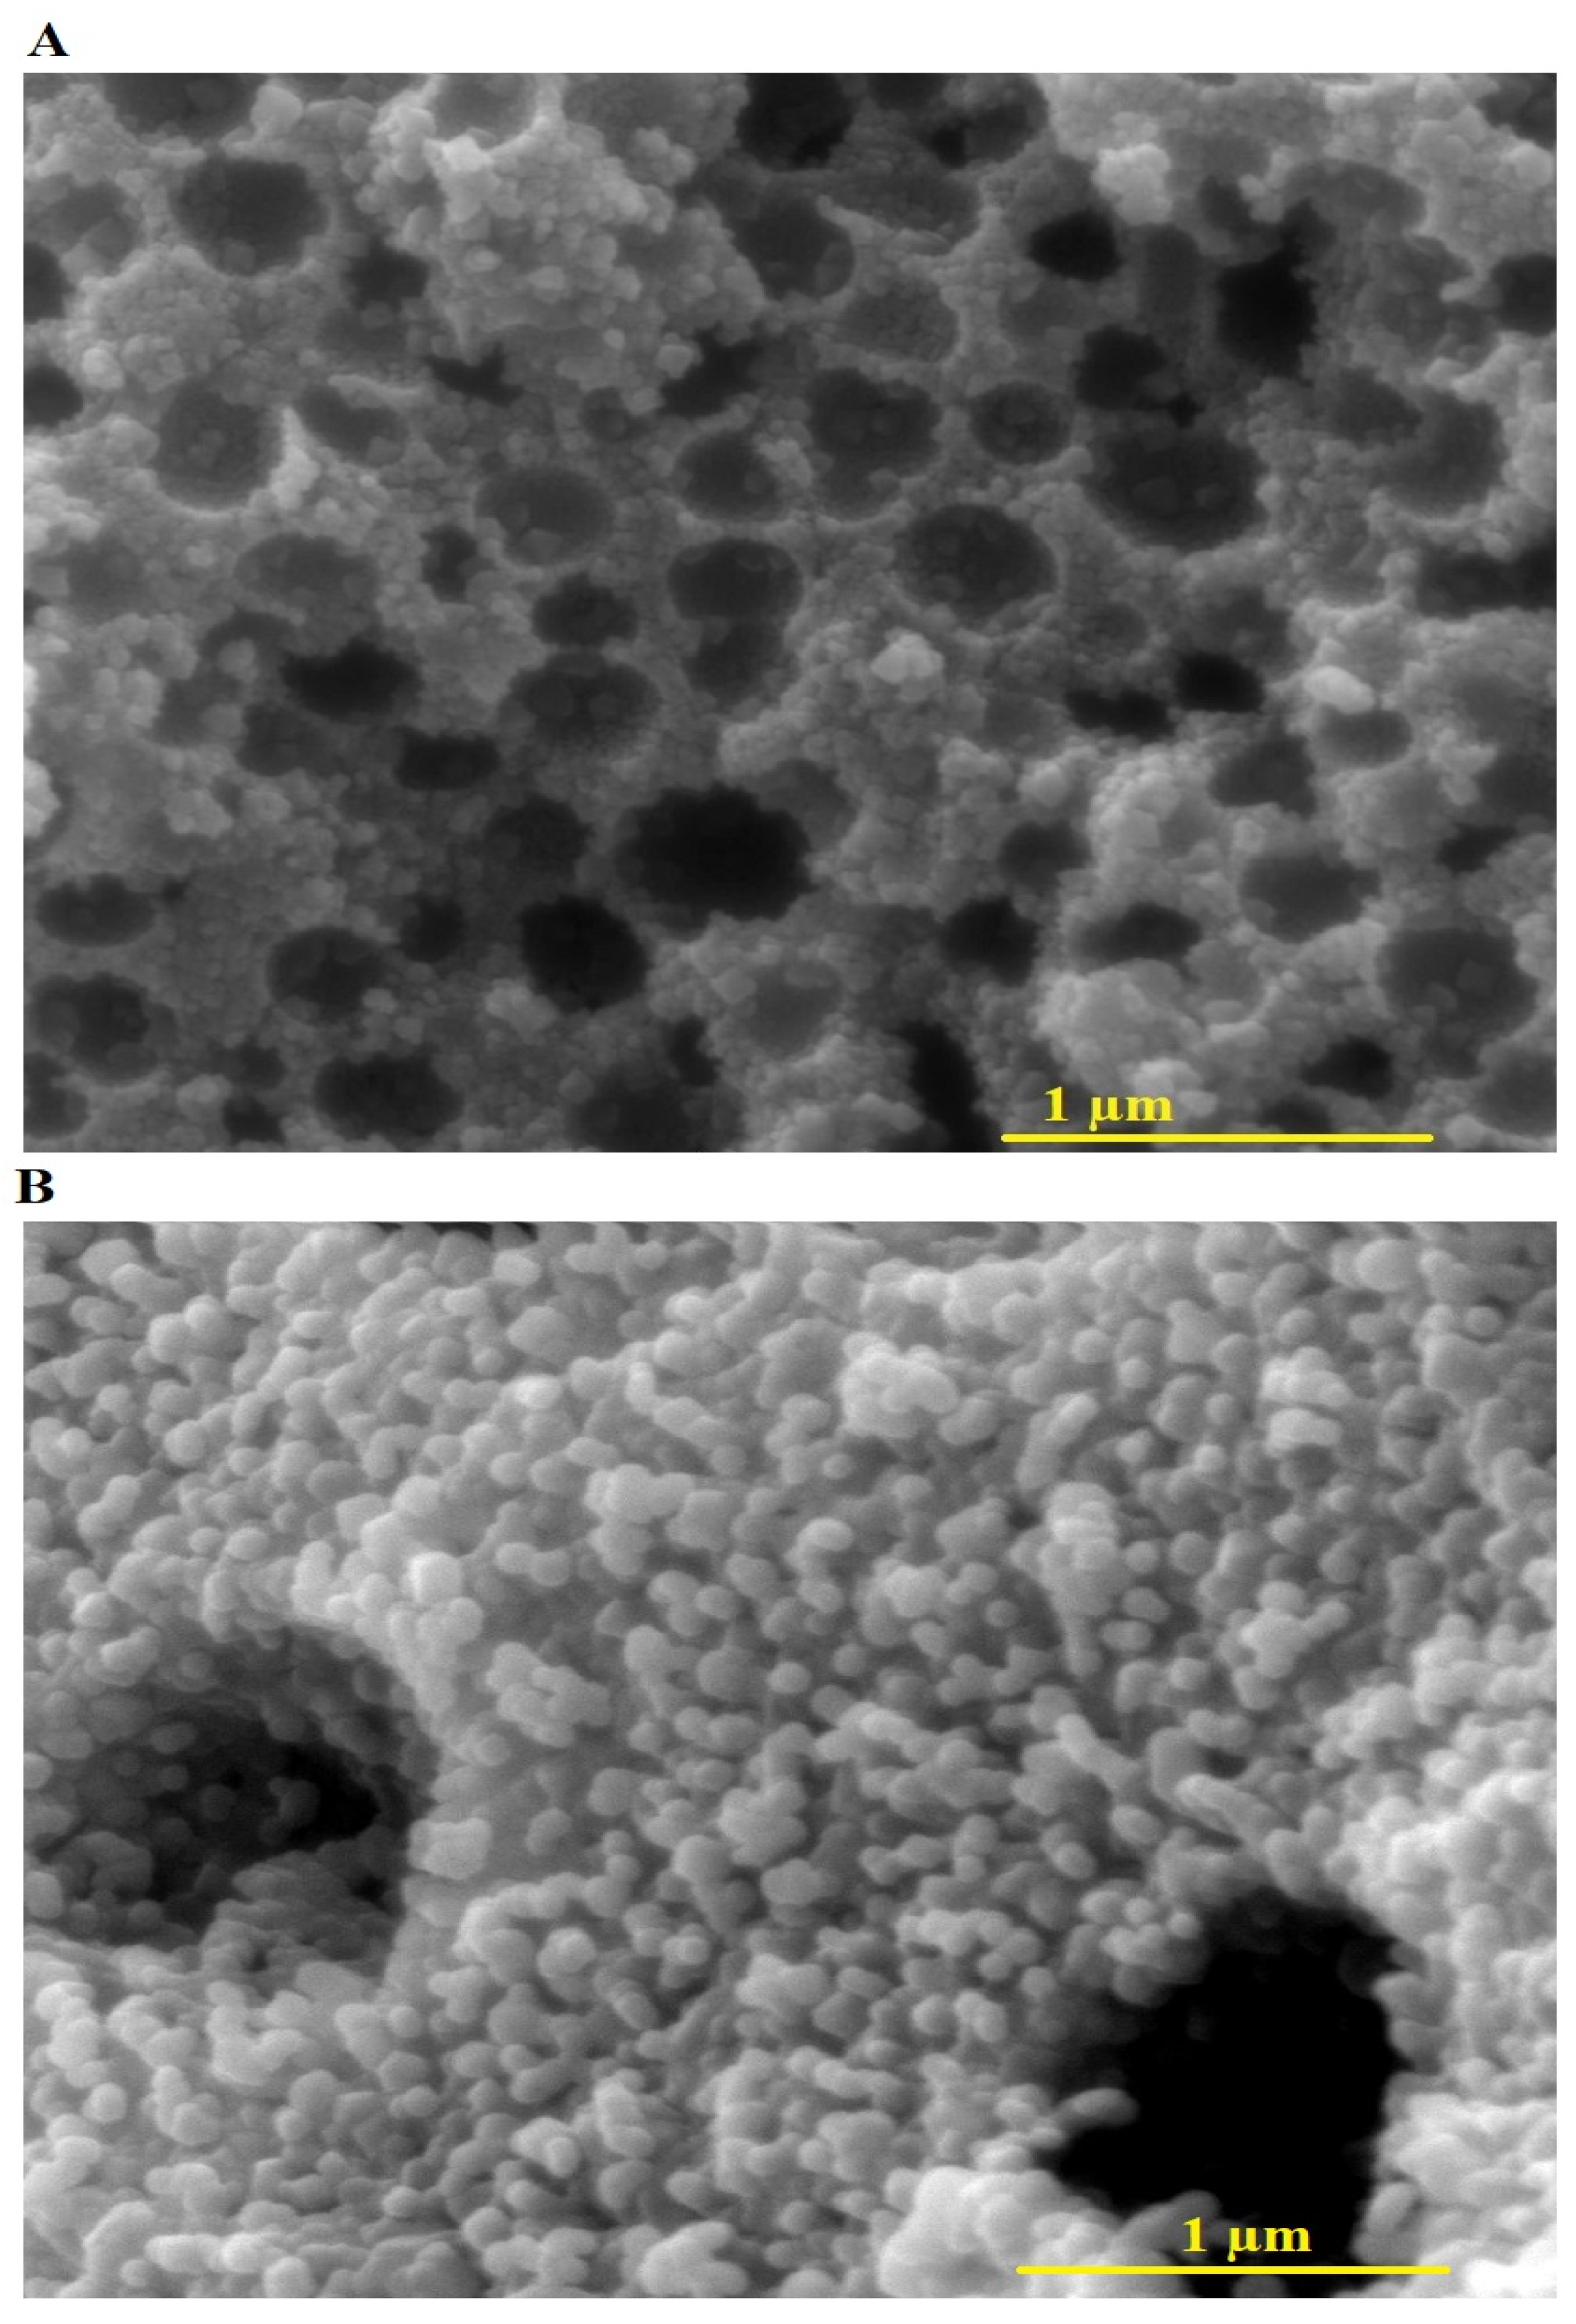
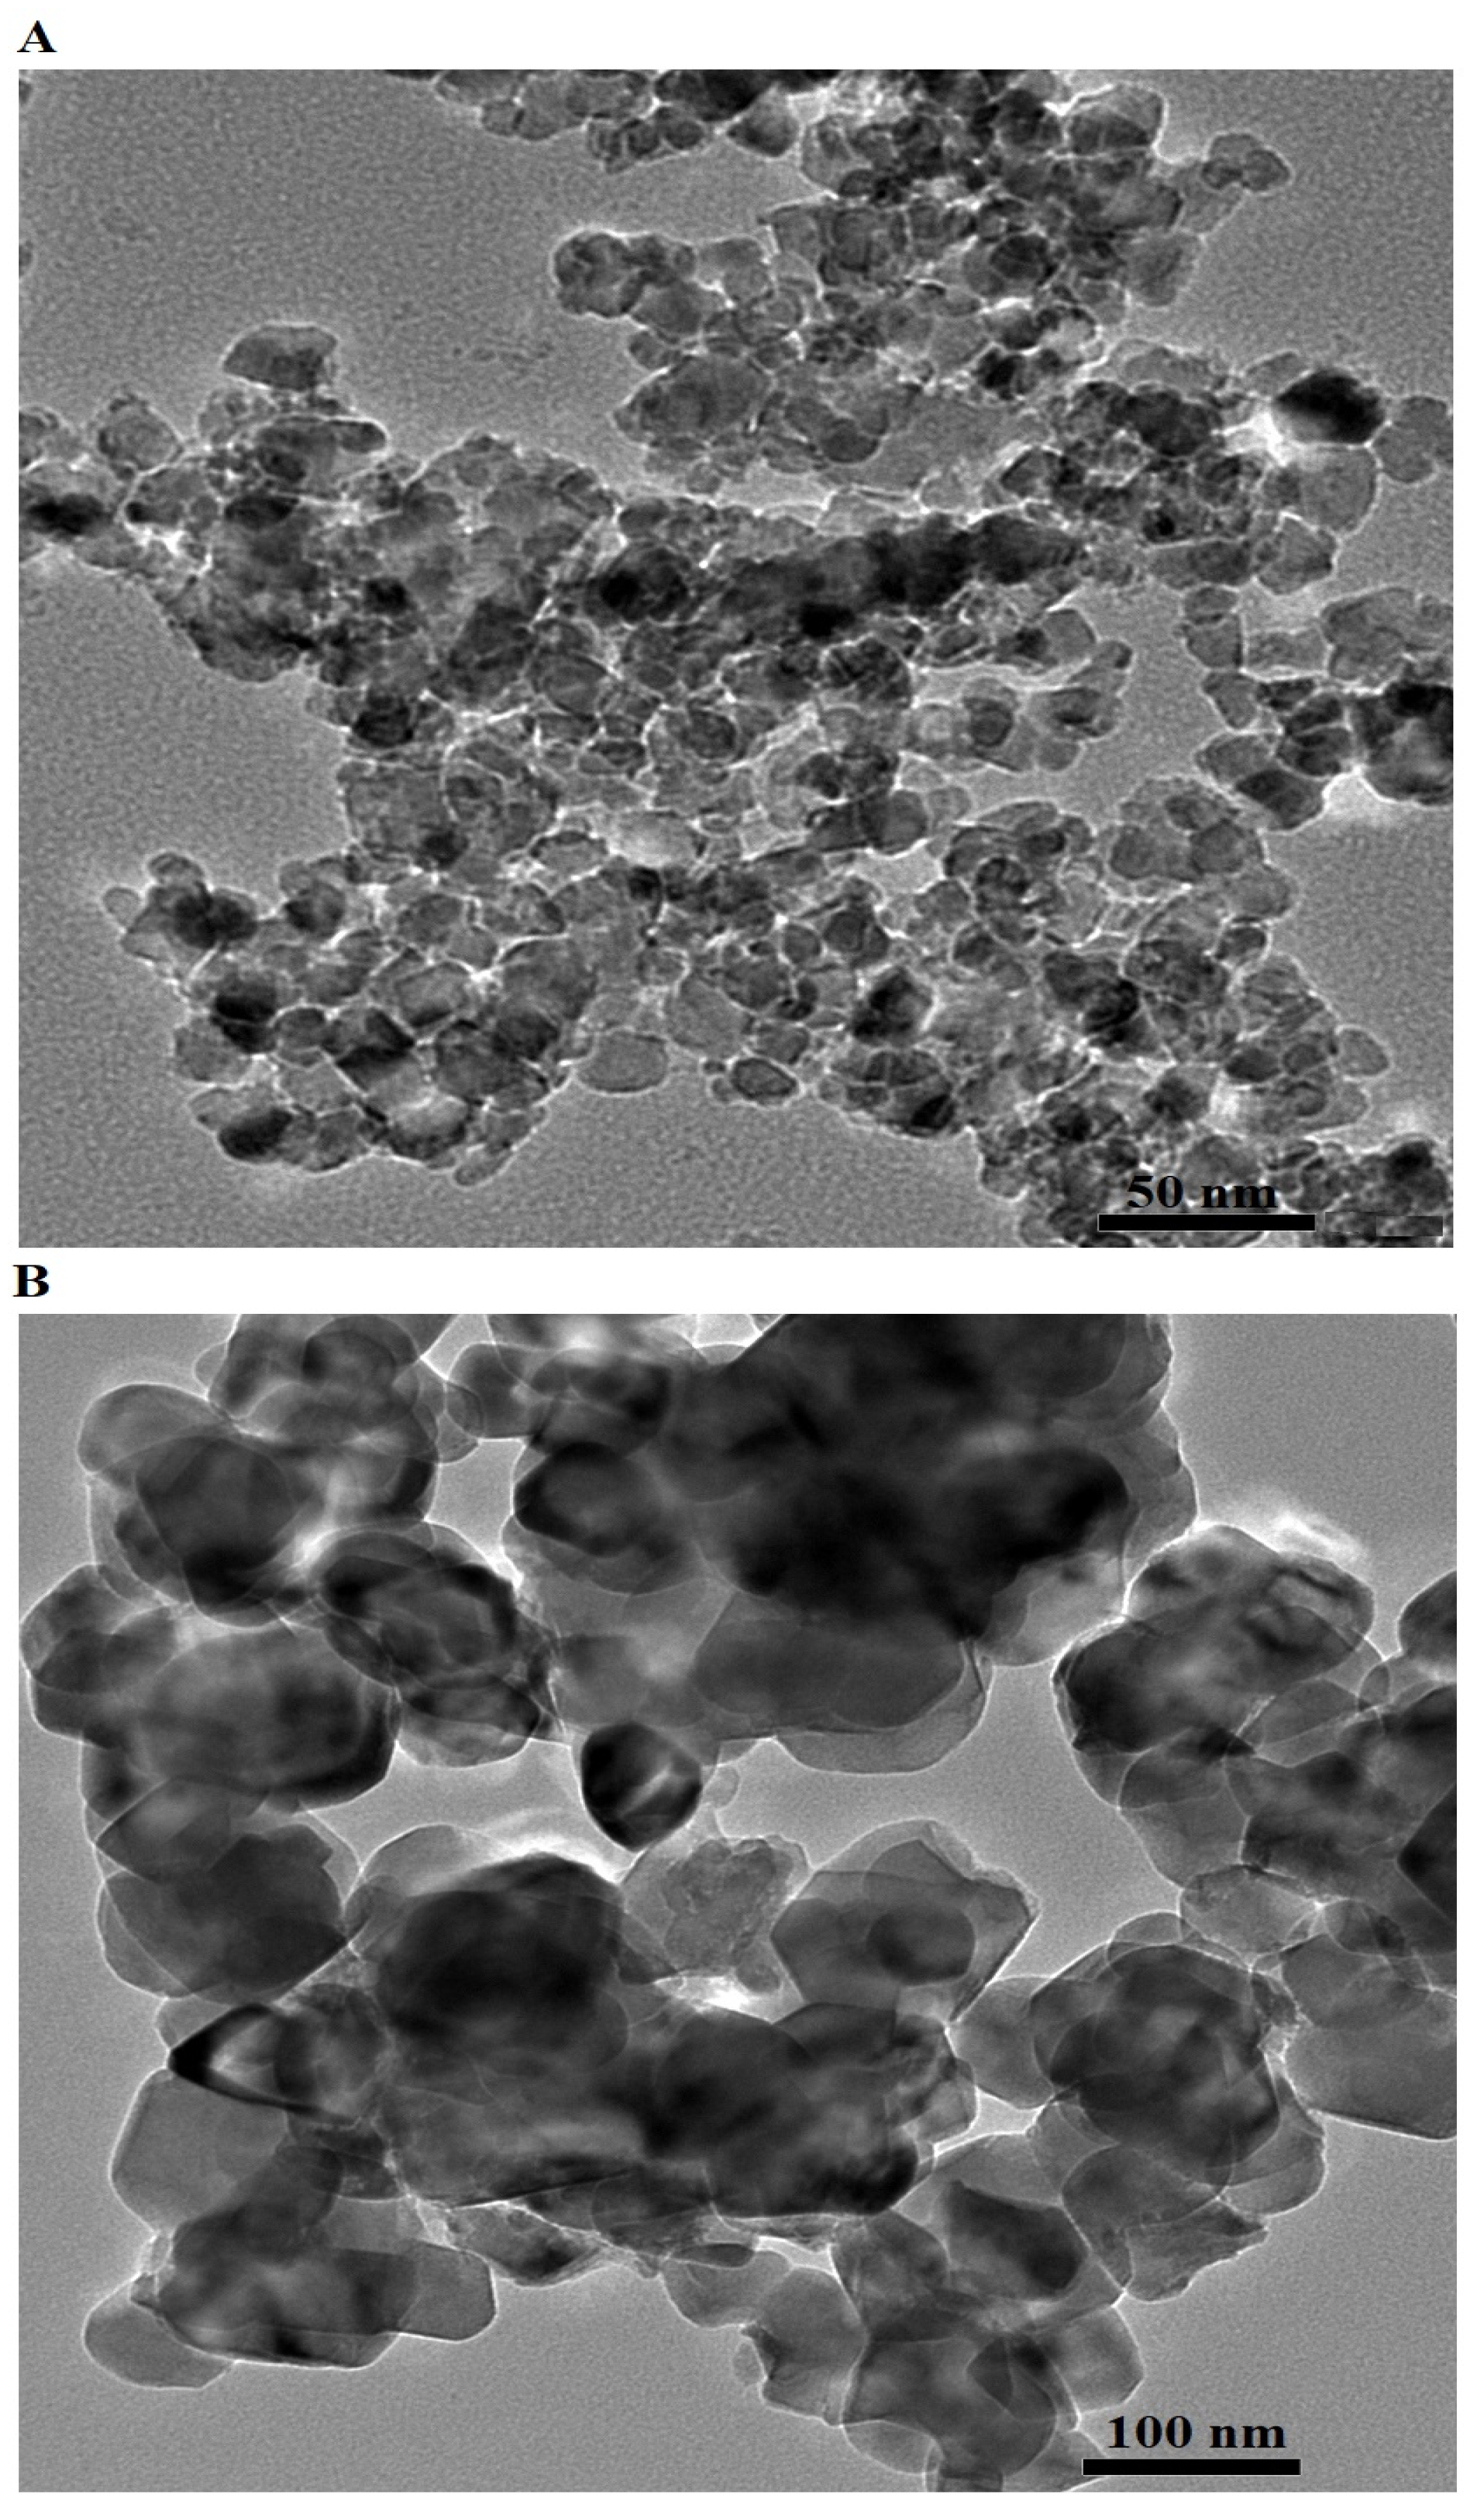
2.1. Synthesis and Characterization

The Pechini sol–gel method was employed in the field of nanotechnology due to its ability to produce homogeneous nanocomposites with controlled morphology and high crystallinity [29]. In this method, tartaric acid acts as a chelating agent, forming stable metal–organic complexes with the precursor metal nitrates (Mg(NO3)2·6H2O, Fe(NO3)3·9H2O, and Cr(NO3)3·9H2O). Furthermore, the tartaric acid solution was slowly introduced into the metal nitrate solution to prevent premature precipitation, ensuring uniform metal distribution in the sol–gel matrix. To improve polymerization and enhance the dispersion of metal ions, polyethylene glycol 400 (PEG) was added to the mixture. PEG acts as a polymerizing agent, facilitating the formation of a three-dimensional network that aids in the controlled growth of nanoparticles upon calcination. The resulting solution was stirred vigorously at 250 °C until the complete evaporation of the solvents occurred, yielding a polymeric gel precursor. The dried precursor was subjected to calcination at 600 °C (F600) and 800 °C (F800) for 3 h to promote crystallization and remove residual organic matter. The selection of these temperatures was based on previous studies indicating that lower calcination temperatures (e.g., 600 °C) result in smaller crystallite sizes and higher surface areas, which are beneficial for adsorption applications, while higher temperatures (e.g., 800 °C) enhance crystallinity but may lead to reduced surface area due to particle growth and agglomeration [29].
The XRD patterns of the Fe0.65Mg0.35Cr2O4 samples synthesized via the Pechini sol–gel method at 600 °C (F600) and 800 °C (F800) were analyzed to determine their crystallographic structure and phase purity, as shown in Figure 1A,B, respectively. Both the F600 and F800 samples exhibited diffraction peaks corresponding to the cubic crystal system, consistent with the JCPDS Card No. 01-075-3307 for iron magnesium chromium oxide (Fe0.65Mg0.35Cr2O4). The characteristic diffraction peaks were observed at 2Ɵ angles of 18.46°, 30.22°, 35.57°, 37.14°, 43.23°, 47.42°, 53.72°, 57.18°, 62.64°, 65.99°, 71.24°, 74.40°, 75.13°, and 79.33°, corresponding to the Miller indices (111), (220), (311), (222), (400), (331), (422), (511), (440), (531), (620), (533), (622), and (444), respectively.
The EDX spectra of the F600 and F800 samples, synthesized via the Pechini sol–gel method, are presented in Figure 2A,B, respectively. The spectra confirm the presence of carbon, oxygen, magnesium, chromium, and iron in both samples, consistent with their expected composition. The atomic percentages of these elements, shown in Table 1, reveal that the F600 sample contains 7.0% C, 48.4% O, 19.0% Mg, 13.5% Cr, and 12.1% Fe, while the F800 sample contains 3.4% C, 42.7% O, 17.6% Mg, 19.0% Cr, and 17.3% Fe. The elemental composition in Table 1 was determined using EDX spectroscopy, with an associated error margin of ±0.2% to account for instrumental precision. The decrease in carbon content from F600 to F800 can be attributed to the thermal decomposition of organic precursors, including tartaric acid and polyethylene glycol 400, which were used as chelating and polymerizing agents during synthesis. As the synthesis temperature increased to 800 °C, carbonaceous residues were further eliminated, resulting in a lower carbon content in the F800 sample. This indicates that the higher calcination temperature promotes more complete combustion and removal of organic components, contributing to improved crystallinity and reduced impurity levels in the final product.
The FE-SEM images of the F600 and F800 samples, shown in Figure 3B, respectively, reveal significant differences in their morphological characteristics. The F600 sample displays agglomerated spherical nanoparticles with an average grain size of 45.71 nm, interspersed with visible pores and void-like regions, indicating a relatively loose and porous structure. This morphology is attributed to the limited crystal growth at the lower calcination temperature of 600 °C. In contrast, the F800 sample exhibits a denser and more compact arrangement of spherical nanoparticles with an average grain size of 73.65 nm, reflecting enhanced particle coalescence and growth due to the increased thermal energy at 800 °C. The reduction in porosity and the larger grain size in the F800 sample suggest that higher calcination temperatures promote more extensive crystal growth and densification, which are consistent with the XRD results showing increased crystallite size.
The HR-TEM images of the F600 and F800 samples, shown in Figure 4A,B, respectively, reveal distinct differences in their particle size and morphology. The F600 sample consists of nearly spherical nanoparticles with an average particle diameter of 14.72 nm. The particles exhibit a relatively loose arrangement and a high degree of dispersion, suggesting that the lower calcination temperature of 600 °C limits extensive particle coalescence and growth. In contrast, the F800 sample displays larger, aggregated spherical and irregular-shaped particles with an average particle diameter of 59.22 nm, reflecting significant growth and densification due to the elevated thermal energy at 800 °C. This increase in particle size can be attributed to enhanced diffusion and crystal growth at higher temperatures, leading to the formation of larger and more compact structures. The morphological evolution observed between the two samples highlights the effect of temperature on particle nucleation and growth, where the F800 sample experiences greater particle fusion and densification, consistent with the FE-SEM and XRD results. The spherical and slightly irregular morphologies in both samples suggest that the synthesis method promotes the formation of uniform nanoparticles with temperature-dependent particle size distribution.

2.2. Removal of Cd(II) Ions from Aqueous Media
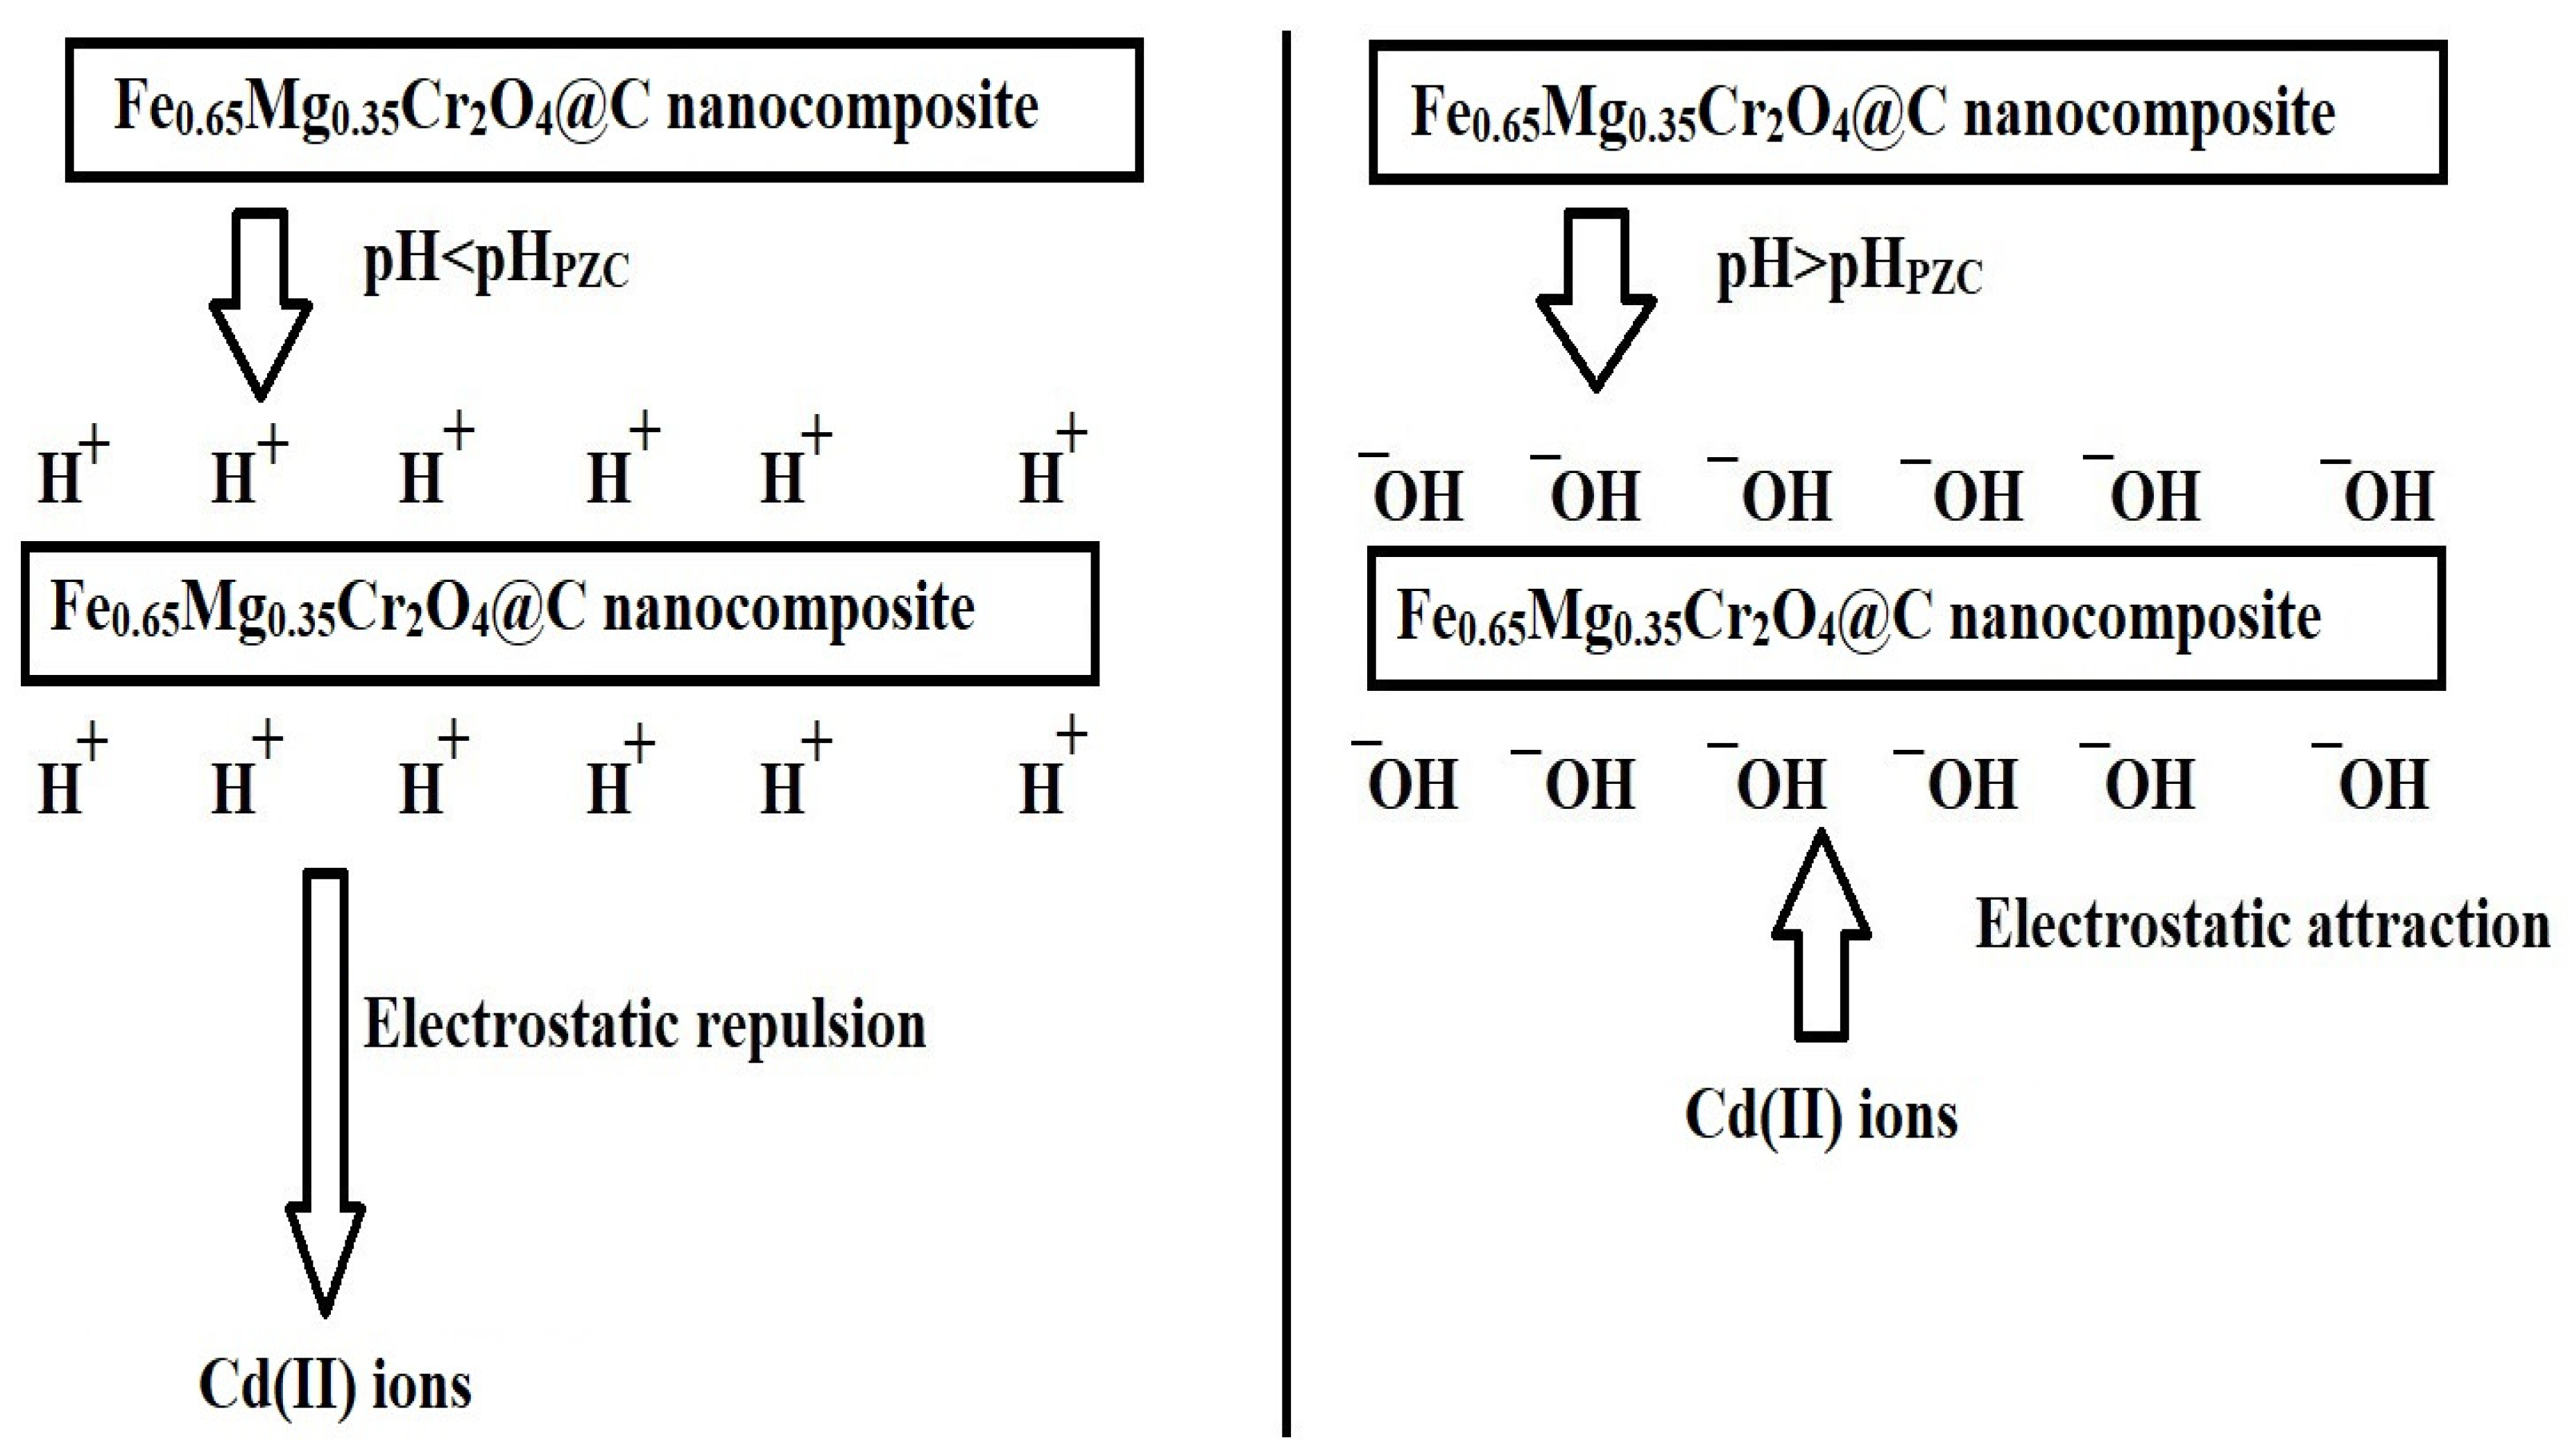
The removal percentage of the Cd(II) ions (% R) and the adsorption capacity of the adsorbent (Q) were calculated using Equations (1) and (2), respectively [30].
%   R = C o C e C o × 100
Q = C o C e × V W
The parameters in the equations are defined as follows: Co is the initial Cd(II) ion concentration (mg/L), Ce is the final Cd(II) ion concentration in the solution (mg/L), V is the volume of the solution (L), and W is the mass of the adsorbent (mg).

2.2.1. Effect of pH

The effect of pH on the removal of the Cd(II) ions by the F600 and F800 samples demonstrates the strong influence of solution pH on adsorption efficiency. Figure 5 shows that at pH 2, both samples exhibit minimal removal efficiencies, with F600 achieving 2.83% and F800 achieving 1.43%, indicating that at highly acidic conditions, electrostatic repulsion between the positively charged adsorbent surfaces and the Cd(II) ions significantly hinders adsorption. As the pH increases to 3 and 4, the removal efficiency improves gradually for both samples, with F600 reaching 8.23% and 24.53% and F800 achieving 4.90% and 9.59%, respectively, as the surface charge repulsion diminishes. A substantial increase in adsorption occurs at pH 5, where F600 achieves 59.69% removal compared to 14.79% for F800. This difference can be attributed to the higher porosity and surface area of F600, as observed in its characterization results, which provide more active adsorption sites at moderately acidic conditions. As the pH approaches 6, the %R reaches 89.77% for F600 and 38.33% for F800. The superior performance of F600 at this stage is linked to its smaller crystallite and particle sizes, which enhance ion accessibility and adsorption. At pH 7, the adsorption efficiency of F600 reaches its peak at 97.84%, while F800 achieves a significantly lower value of 59.68%, confirming the superior adsorption capacity of F600 in near-neutral conditions. To evaluate the structural stability of the Fe0.65Mg0.35Cr2O4@C nanocomposite under acidic and alkaline conditions, the filtrate obtained after adsorption experiments across a wide pH range (2–10) was analyzed using atomic absorption spectrophotometry. The results confirmed the absence of Fe, Mg, Cr, and C in the filtrate, indicating that no leaching of the nanocomposite’s main components occurred. This strongly suggests that the material retains its structural integrity across varying pH conditions.

Adsorption Mechanism of Cd(II) Ions onto F600 and F800 Nanocomposites

The adsorption mechanism of Cd(II) ions onto the nanocomposites can be explained based on the pHPZC. The pHPZC values, illustrated in Figure 6, are 5.70 for F600 and 6.24 for F800.
At pH < pHPZC, the adsorbent surface is positively charged, causing electrostatic repulsion between the Cd(II) ions and the nanocomposite, resulting in lower adsorption efficiency, as shown in Figure 7. At pH > pHPZC, the surface charge of the adsorbent becomes increasingly negative, favoring the adsorption of positive Cd(II) ions due to the electrostatic attraction between the Cd(II) ions and the nanocomposite, as shown in Figure 7. The optimal adsorption performance at pH 7 is attributed to the favorable electrostatic interactions between the negatively charged adsorbent surface and positive Cd(II) ions. Since the point of zero charge (pHPZC) of F600 is 5.70 and that of F800 is 6.24, the surface charge of both adsorbents becomes negative at pH > pHPZC, enhancing electrostatic attraction with the positively charged Cd(II) ions and the adsorbent surface. However, F600 exhibits higher adsorption efficiency at pH 7 due to its lower pHPZC, which means its surface is more negatively charged compared to F800, thereby offering stronger attraction forces for Cd(II) ions. This ensures maximum removal efficiency while preventing cadmium hydroxide precipitation, which typically occurs at pH > 7, confirming that adsorption, rather than precipitation, governs Cd(II) removal. Additionally, the larger grain size and reduced porosity of F800, as confirmed by FE-SEM and HR-TEM, hinder its adsorption capacity compared to F600, which benefits from a more porous and loosely agglomerated structure. Consequently, the combination of pHPZC behavior, morphological differences, and surface characteristics explains the superior removal efficiency of Cd(II) ions by F600 across the studied pH range.

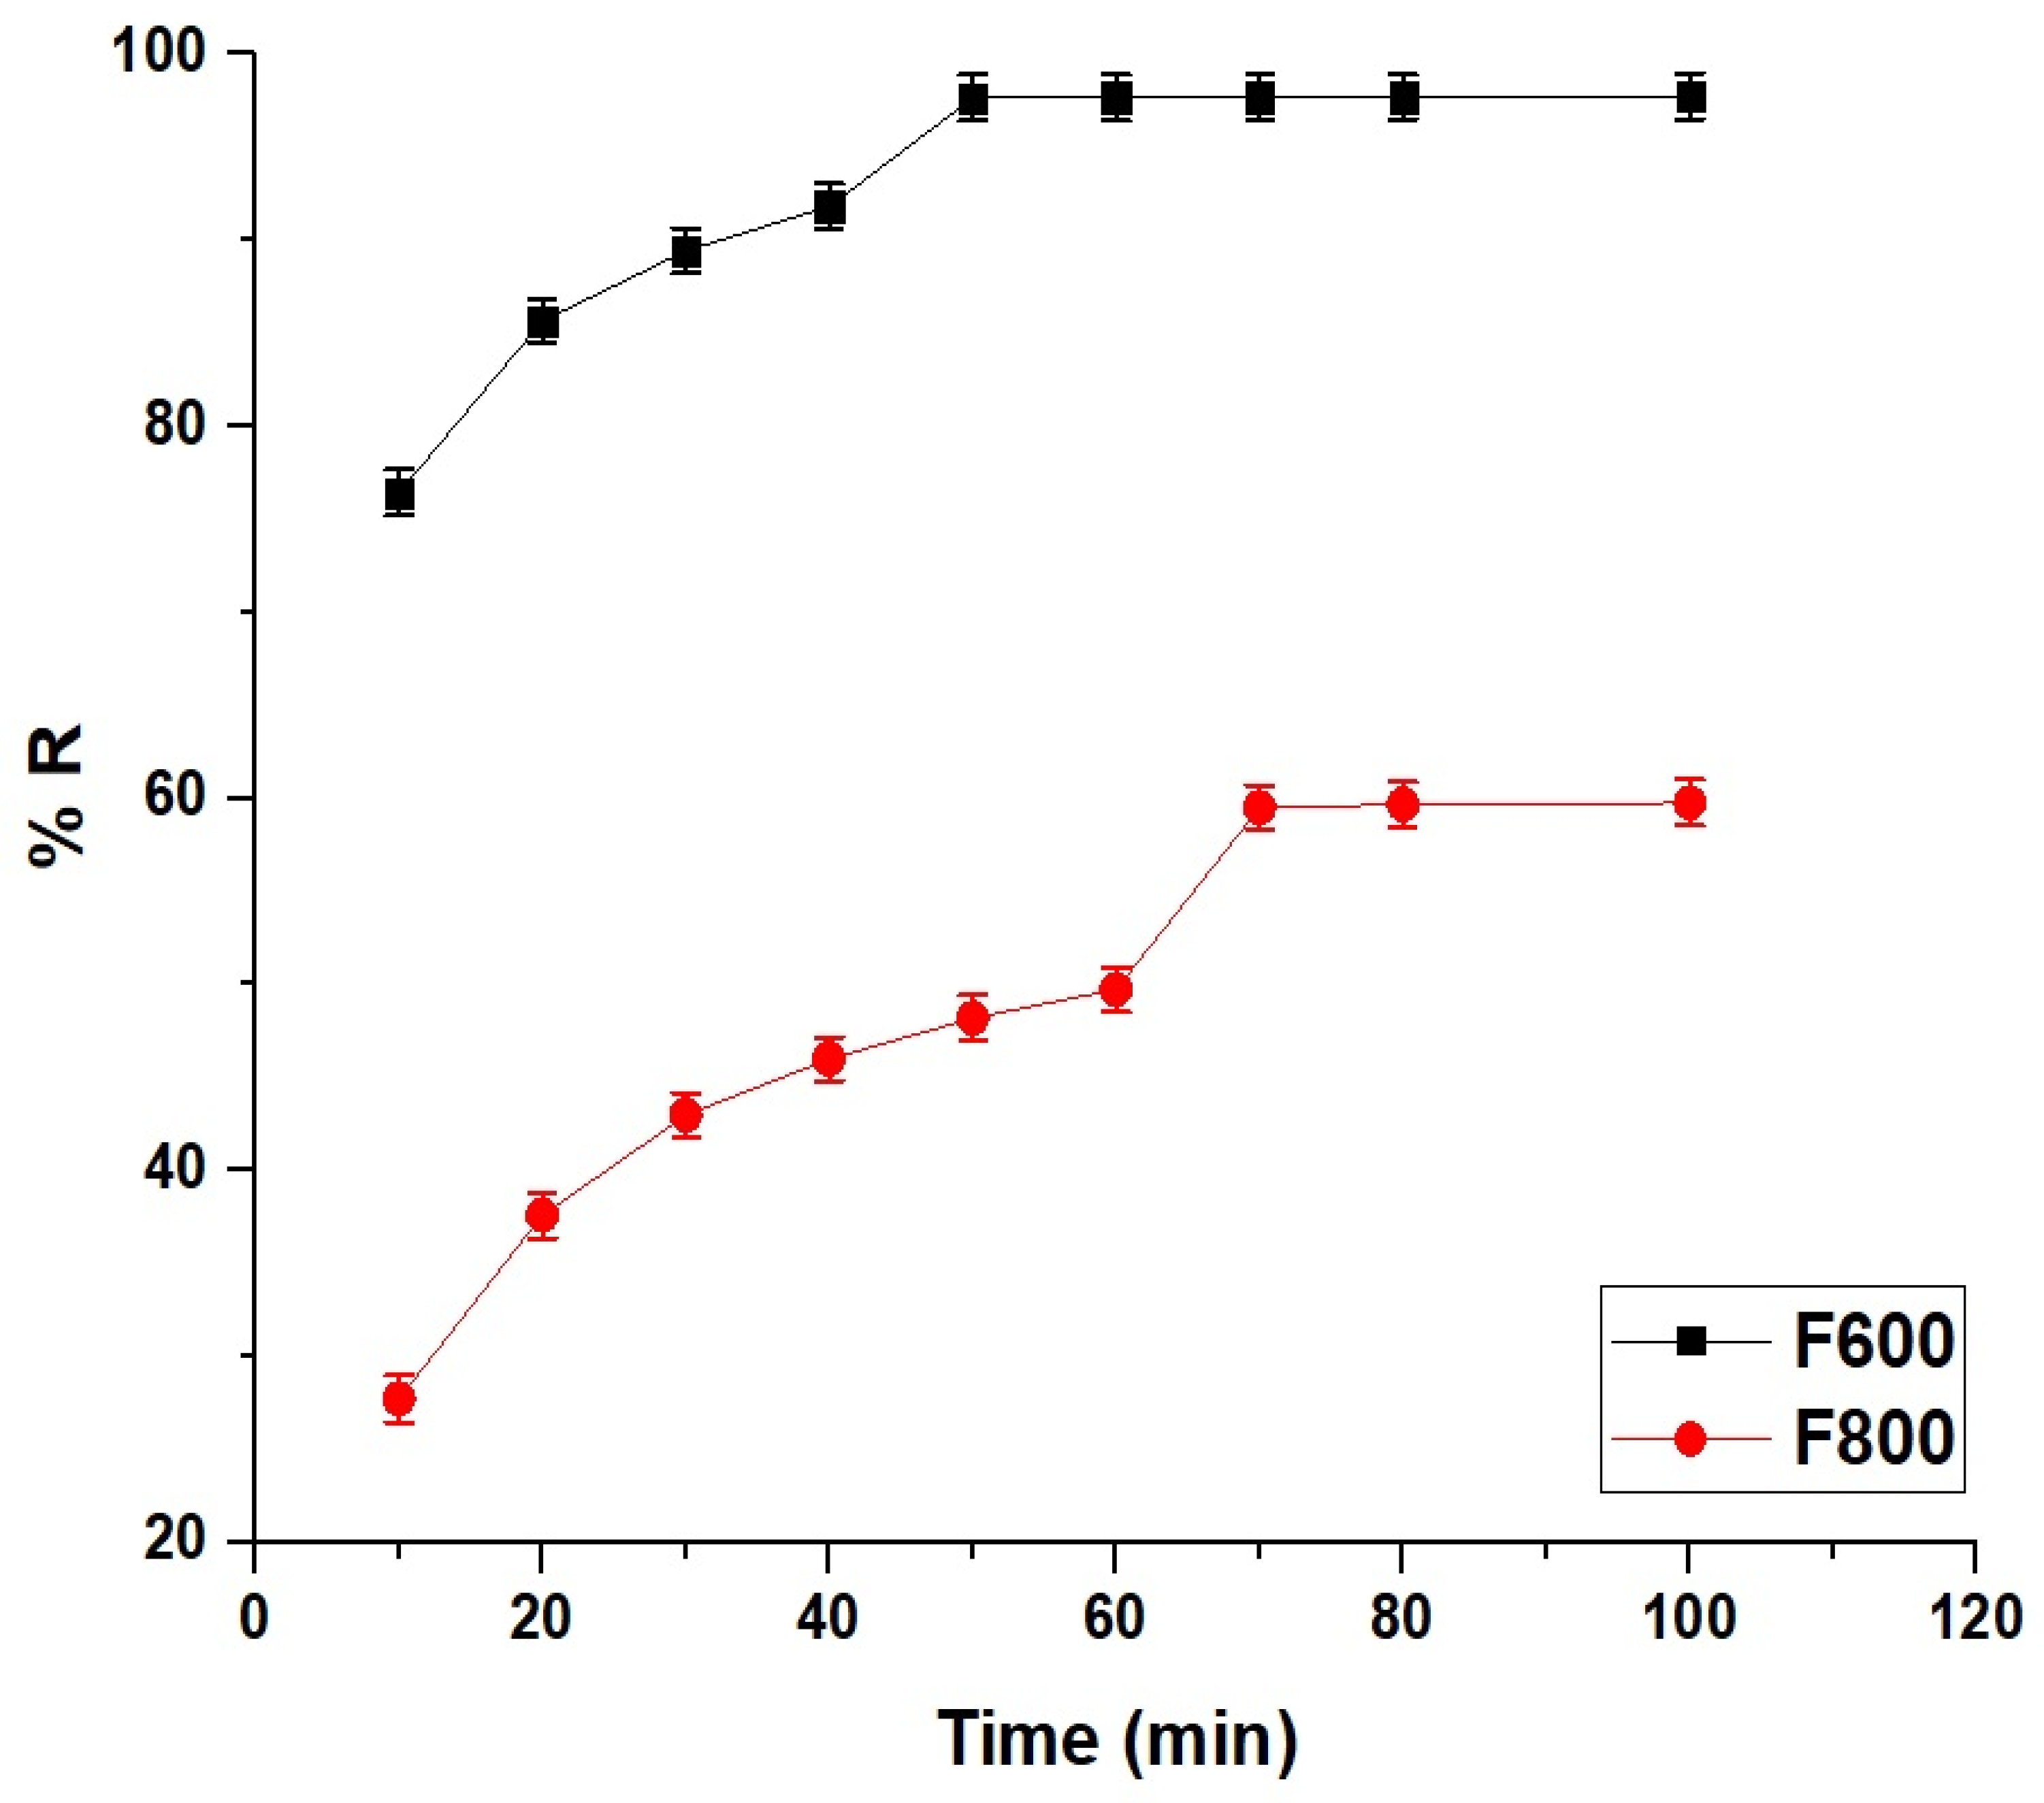
2.2.2. Effect of Contact Time

The adsorption efficiency of Cd(II) ions onto the F600 and F800 samples, presented in Figure 8, reveals distinct differences in removal percentage and equilibrium times. At 10 min, the removal percentage for F600 is 76.43%, significantly higher than 27.72% for F800, indicating the faster adsorption kinetics of F600 due to its higher surface area, porosity, and greater availability of active adsorption sites. As the adsorption progresses, F600 achieves 97.64% removal at 50 min, which marks its equilibrium time, beyond which the removal percentage remains nearly constant, demonstrating that the adsorbent becomes saturated and no further significant adsorption occurs. In contrast, F800 reaches only 48.19% removal at 50 min, with adsorption continuing until it reaches equilibrium at 70 min with a removal percentage of 59.49%. The slower adsorption rate of F800 compared to F600 can be attributed to its larger crystallite size and reduced porosity, which limit the accessibility of Cd(II) ions to active adsorption sites. Although both samples reach equilibrium, the overall removal efficiency of F600 is superior, reflecting its more favorable surface characteristics and faster kinetics. After equilibrium, the removal percentages remain constant for both samples, indicating the saturation of the available adsorption sites. The correlation between the rapid adsorption of F600 and the slower uptake by F800 highlights the influence of structural and morphological differences on the adsorption process and confirms the more effective performance of F600 in removing Cd(II) ions from aqueous solutions.
The kinetic data for the adsorption of the Cd(II) ions onto the F600 and F800 samples were analyzed using both the pseudo-first-order and pseudo-second-order models, as illustrated in Figure 9A,B, respectively. The pseudo-first-order kinetic model is described by Equation (3) [31].
log Q e Q t = l o g Q e K 1 2.303 t
where Qe (mg/g) represents the adsorption capacity at equilibrium, Qt (mg/g) is the adsorption capacity at time t (min), and K1 (1/min) is the rate constant of the pseudo-first-order model.
The pseudo-second-order kinetic model is described by Equation (4) [31].
t Q t = 1 K 2 Q e 2 + 1 Q e t
where K2 (g/mg·min) is the rate constant of the pseudo-second-order model.
Figure 9 shows the fitting curves for both kinetic models. The parameters derived from these models are provided in Table 2, where the experimental adsorption capacities QExp for F600 and F800 are 292.92 mg/g and 178.48 mg/g, respectively. The pseudo-first-order model shows moderate fits with R2 values of 0.9767 for F600 and 0.9615 for F800, and the corresponding calculated Qe values are 91.19 mg/g and 108.13 mg/g, which deviate significantly from the experimental values. In contrast, the pseudo-second-order model provides superior fits with R2 values of 0.9999 for both samples, and the calculated Qe values of 294.99 mg/g for F600 and 177.30 mg/g for F800 closely match the experimental values. The excellent agreement between the experimental and calculated Qe values, along with the high R2 values, indicates that the adsorption of the Cd(II) ions onto the F600 and F800 samples follows the pseudo-second-order kinetic model.

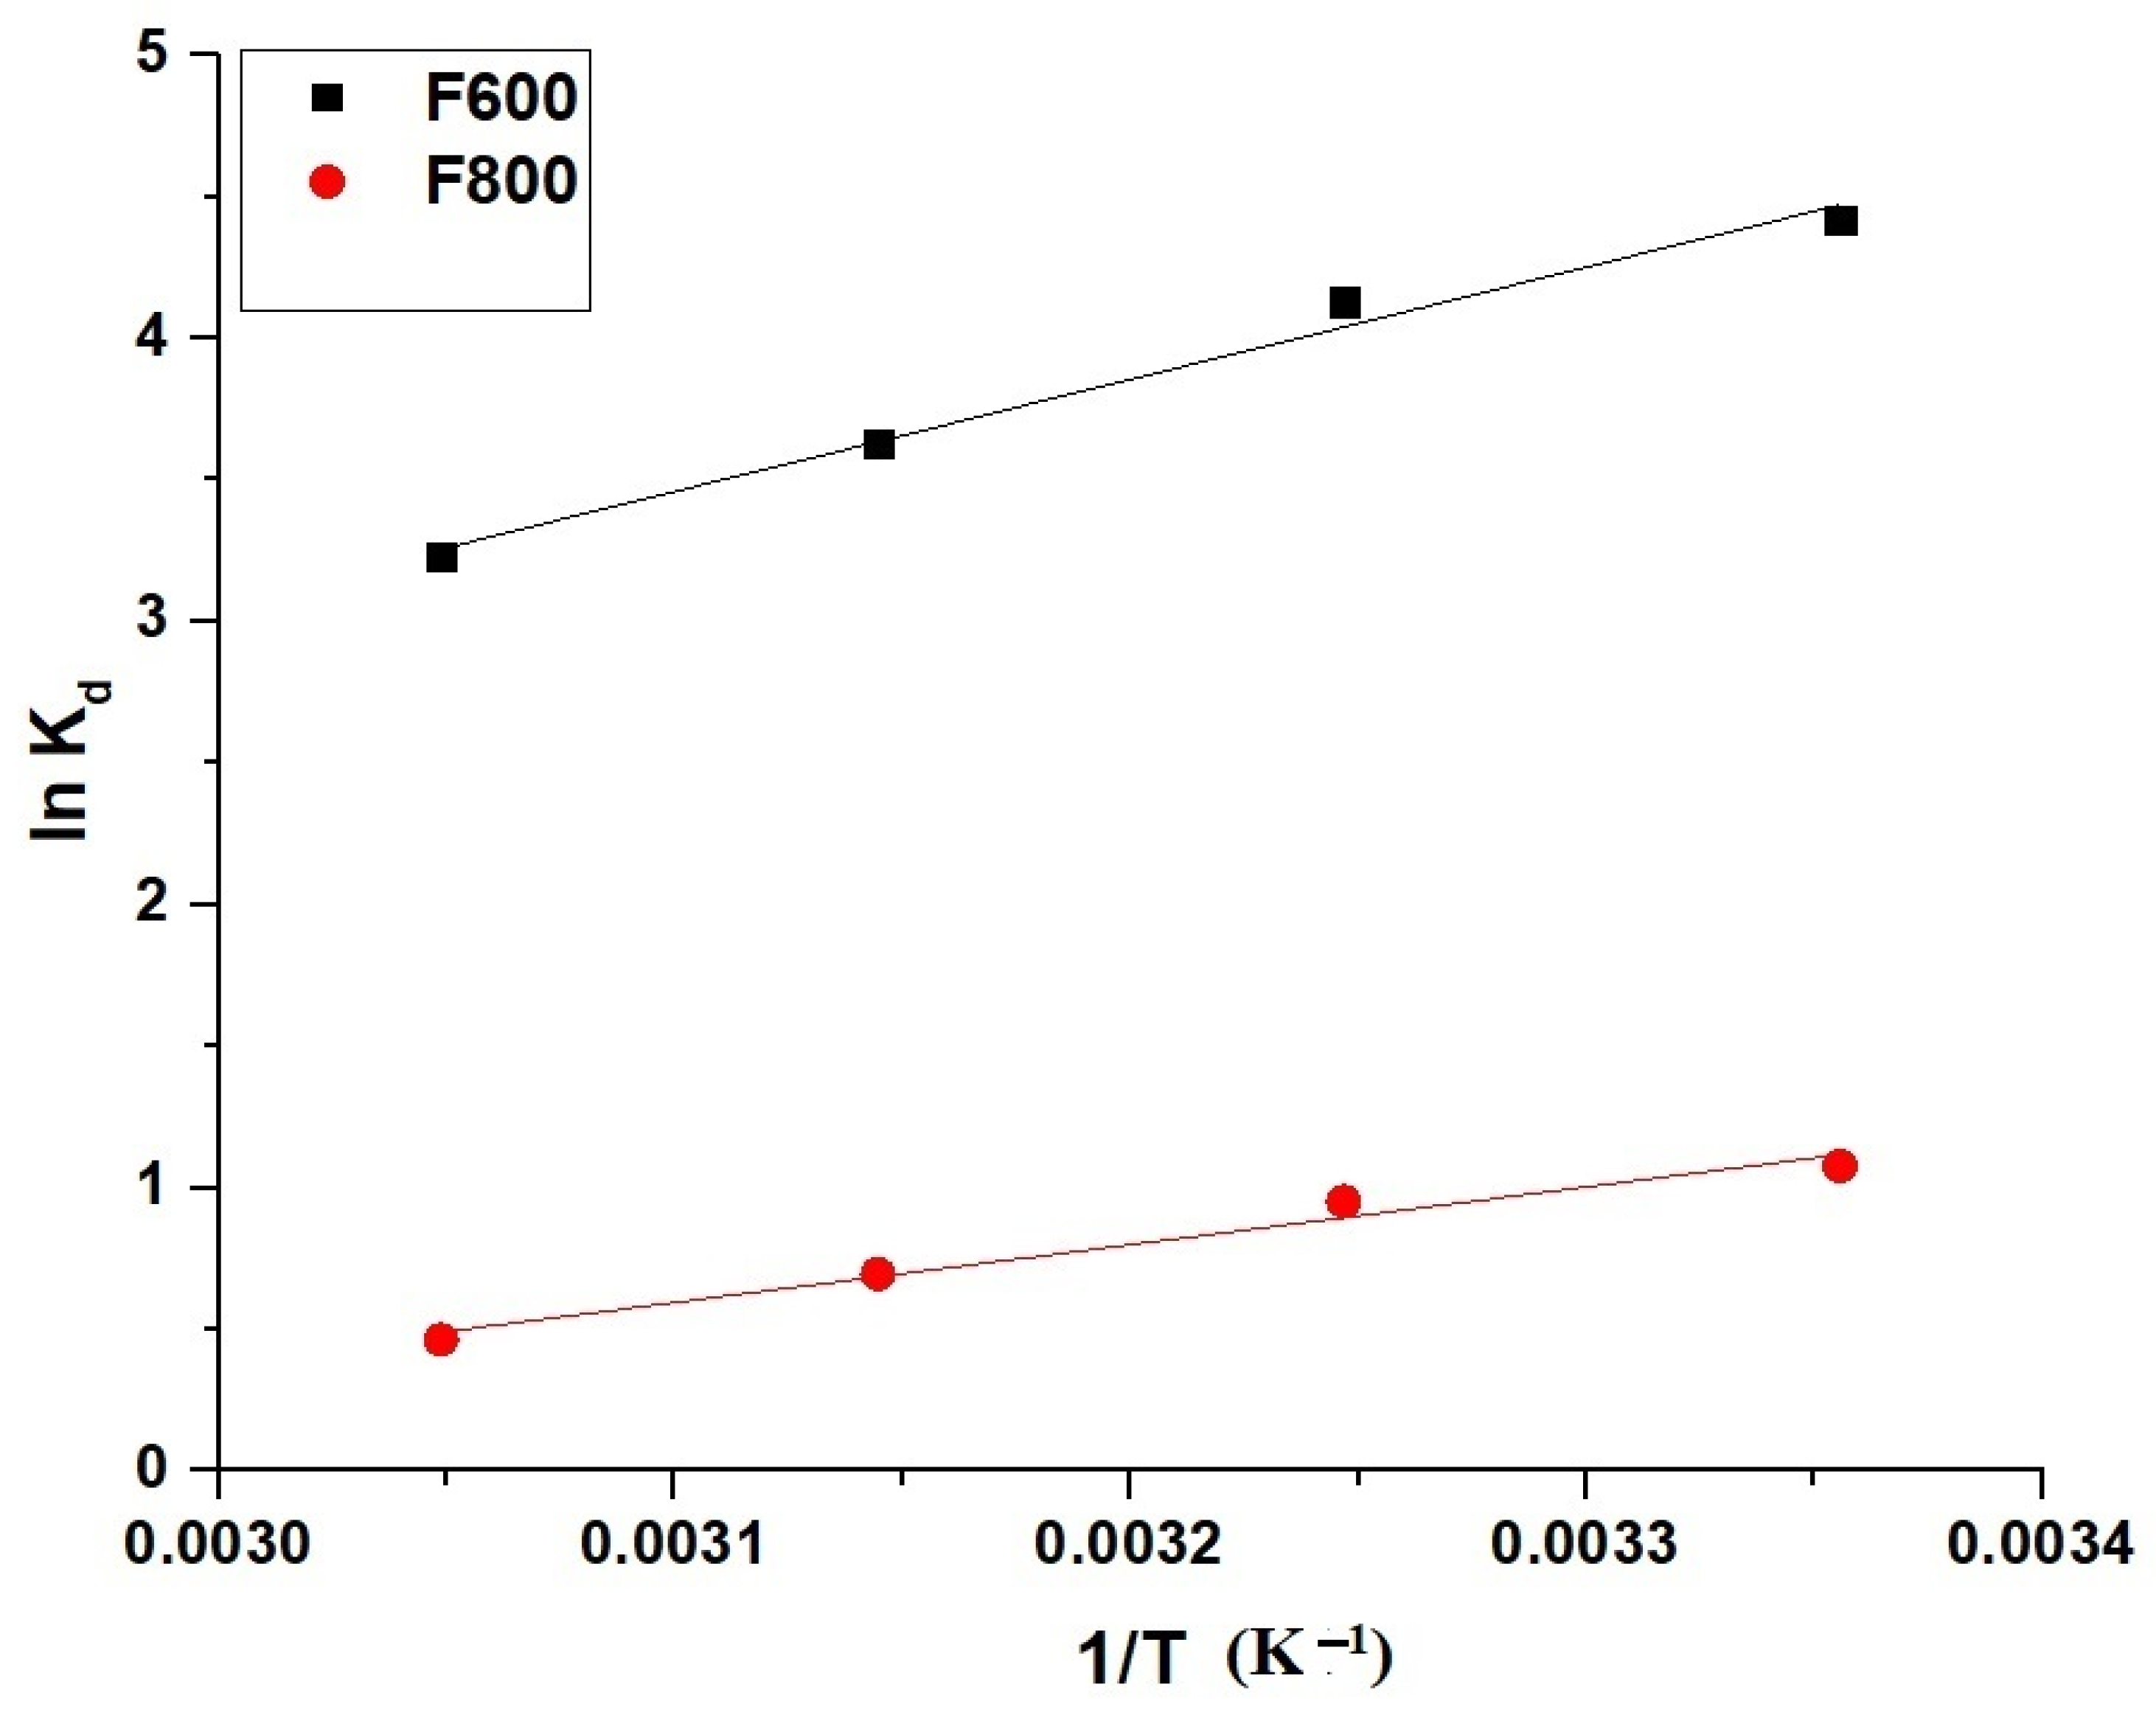
2.2.3. Effect of Temperature

The effect of temperature on the removal efficiency of Cd(II) ions by the F600 and F800 samples is shown in Figure 10, revealing a temperature-dependent decrease in adsorption efficiency for both samples. At 298 K, F600 achieves a high removal efficiency of 97.64%, significantly outperforming F800, which records 59.49% removal under the same conditions. This disparity highlights the superior adsorption performance of F600 due to its higher surface area, greater porosity, and more abundant active adsorption sites. As the temperature increases to 328 K, the removal efficiency of F600 decreases to 92.66%, while F800 experiences a more pronounced decline, reaching 44.31% removal. The observed reduction in removal efficiency with increasing temperature suggests that the adsorption process for both samples is exothermic in nature. The stronger decline in F800 compared to F600 indicates that the adsorption mechanism in F800 is more sensitive to thermal effects, likely due to its lower adsorption capacity and less favorable surface characteristics.
The thermodynamic parameters for the adsorption of the Cd(II) ions onto the F600 and F800 samples were determined using the Van’t Hoff equation and related thermodynamic expressions. The relationship between the equilibrium distribution coefficient and temperature is given by Equation (5) [29].
l n K d = S o R H o R T
where Kd (L/g) is the distribution coefficient, △So (kJ/mol·K) is the standard entropy change, △Ho (kJ/mol) is the standard enthalpy change, R (8.314 × 10⁻³ kJ/mol·K) is the universal gas constant, and T (K) is the absolute temperature.
The Gibbs free energy change (△Go, kJ/mol) is described by Equation (6) [29].
G o = H o T S o
The distribution coefficient is defined by Equation (7) [29].
K d = Q e C e
Figure 11 presents the Van’t Hoff plots for F600 and F800, while Table 3 summarizes the calculated thermodynamic parameters. The negative values of △Ho for both F600 (−33.10 kJ/mol) and F800 (−17.06 kJ/mol) indicate that the adsorption process is exothermic. The magnitude of △Ho being less than 40 kJ/mol for both samples confirms that the adsorption mechanism is physical in nature, likely involving weak interactions such as van der Waals forces or electrostatic attraction. The negative values of △Go at all temperatures, ranging from −55.06 kJ/mol to −57.27 kJ/mol for F600 and −31.34 kJ/mol to −32.77 kJ/mol for F800, confirm that the adsorption is spontaneous. The positive values of △So (0.0737 kJ/mol·K for F600 and 0.0479 kJ/mol·K for F800) suggest that the adsorption process is feasible and is associated with increased randomness at the solid–liquid interface as the Cd(II) ions are adsorbed onto the surfaces of the adsorbents.

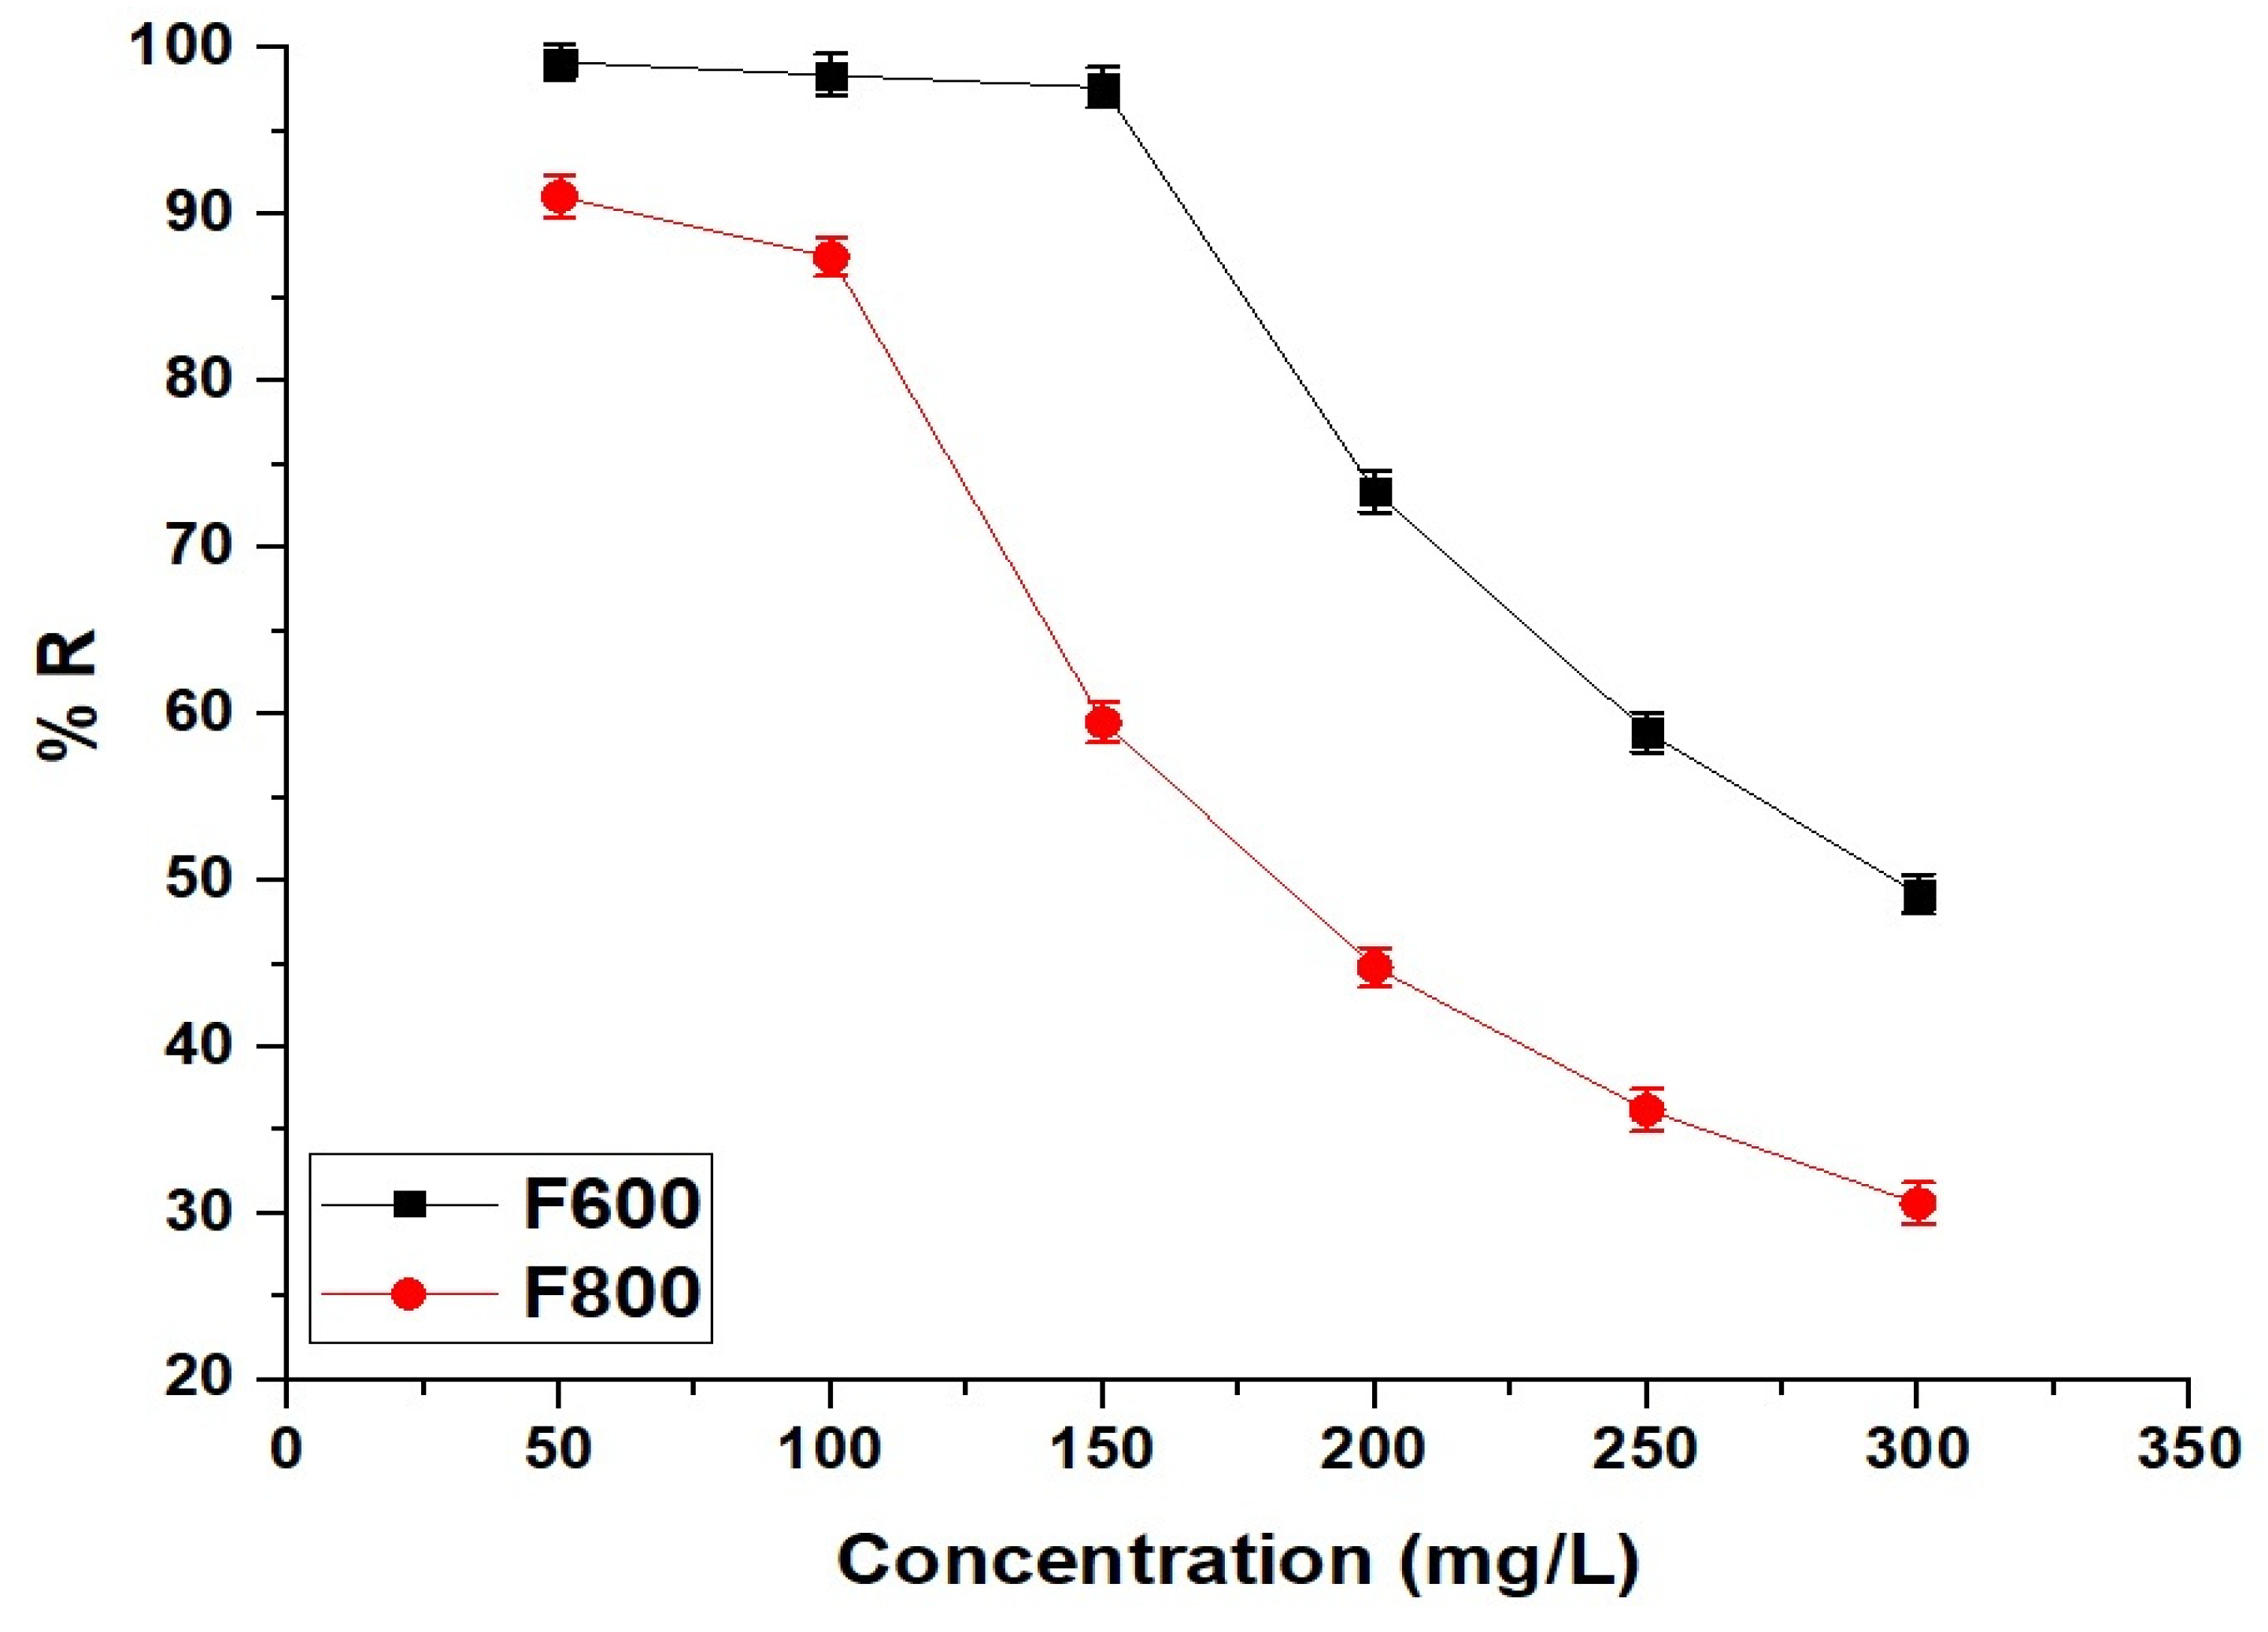
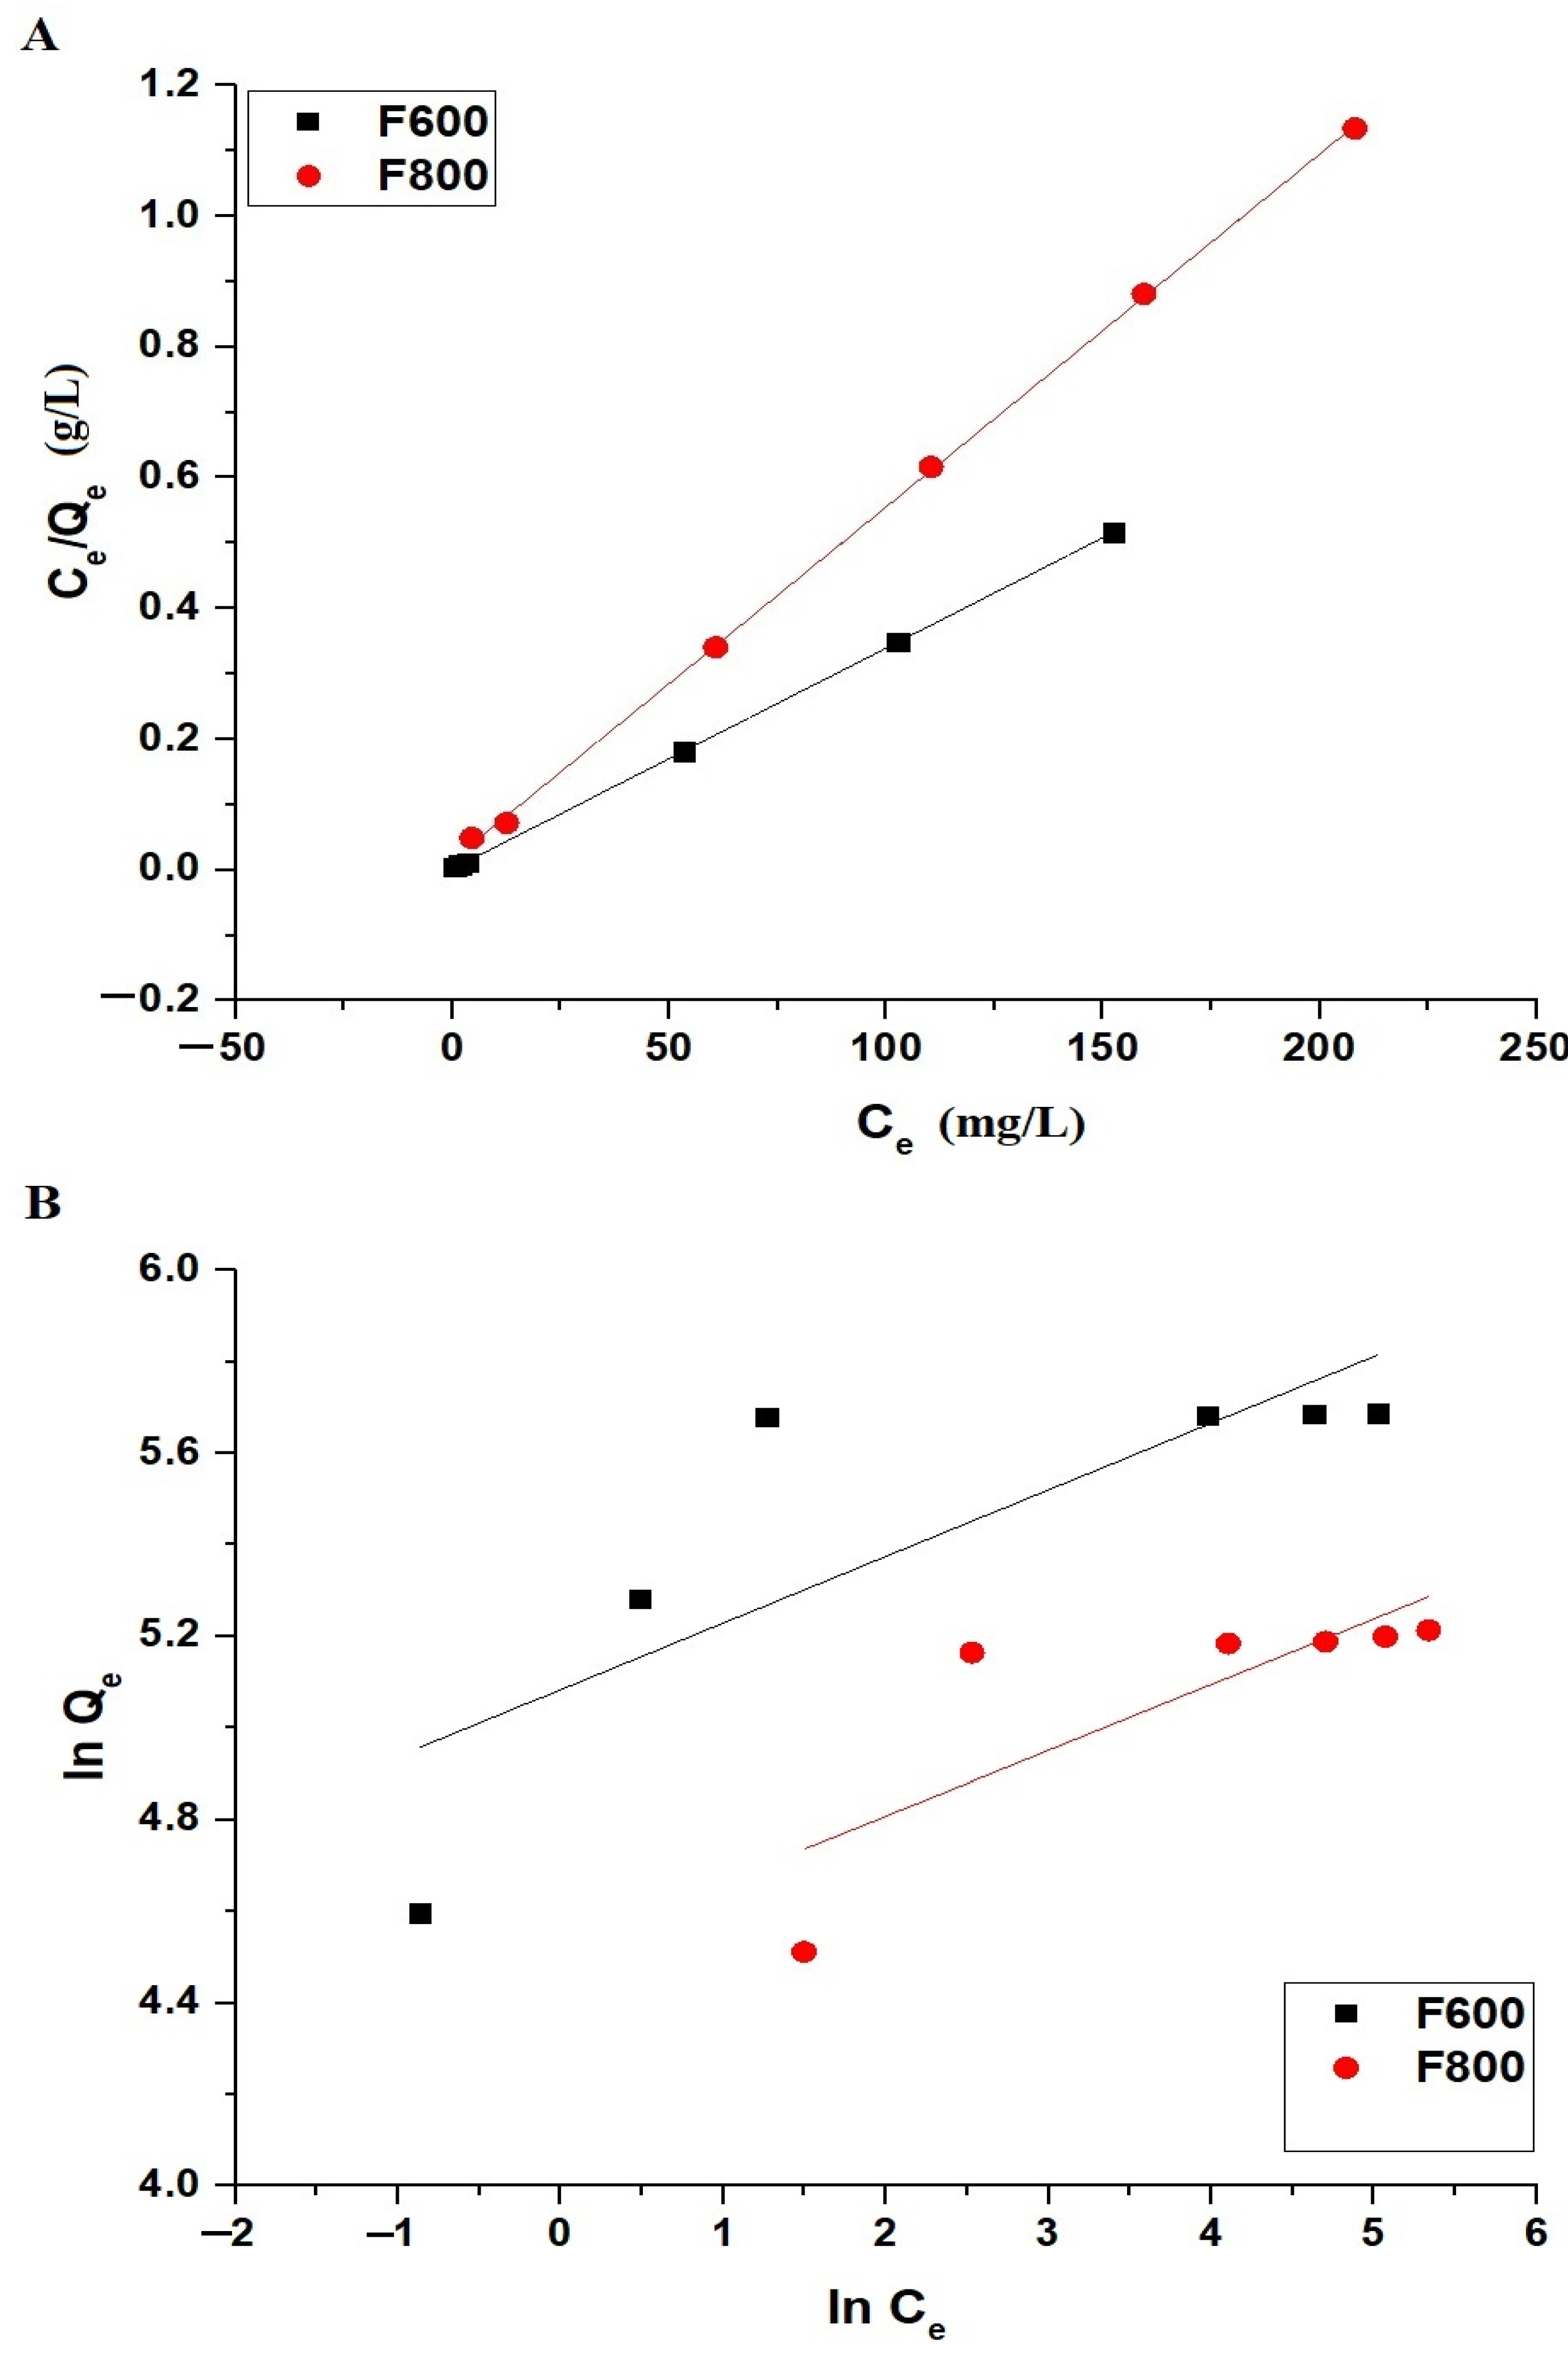
2.2.4. Effect of Concentration

The effect of initial Cd(II) ion concentration on the removal efficiency of the F600 and F800 samples is shown in Figure 12, demonstrating a concentration-dependent decrease in adsorption performance for both samples. At a low concentration of 50 mg/L, the removal efficiencies are 99.16% for F600 and 91.08% for F800, reflecting the abundance of available active adsorption sites on both samples. As the concentration increases to 100 mg/L, the removal efficiencies slightly decrease to 98.38% for F600 and 87.46% for F800 due to the gradual saturation of adsorption sites. A more pronounced decline is observed at 150 mg/L, where F600 achieves 97.64% removal compared to 59.49% for F800. This significant difference highlights the superior adsorption capacity of F600, which can be attributed to its higher surface area, greater porosity, and more abundant active sites compared to F800. At 200 mg/L, the removal efficiency of F600 drops to 73.37%, while F800 reaches 44.79%, indicating that as the concentration increases, the competition for available sites intensifies, leading to reduced adsorption efficiency. At higher concentrations of 250 mg/L and 300 mg/L, the removal efficiencies continue to decrease to 58.93% and 49.19% for F600 and to 36.21% and 30.60% for F800, respectively. The rapid decline in F800’s removal efficiency compared to F600 suggests that F800 has a lower adsorption capacity due to its larger crystallite size and reduced porosity, which limit the accessibility and availability of active adsorption sites. Conversely, F600 maintains relatively high removal efficiency even at elevated concentrations, emphasizing its enhanced performance and superior adsorption capability across a wide range of Cd(II) concentrations.
The adsorption isotherms of the Cd(II) ions onto the F600 and F800 samples were analyzed using both the Langmuir and Freundlich models as shown in Figure 13A,B, respectively. The Langmuir isotherm is described by Equation (8) [32].
C e Q e = 1 K 3 Q m a x + C e Q m a x
where Qmax (mg/g) is the maximum adsorption capacity and K3 (L/mg) is the Langmuir constant.
The Freundlich isotherm is represented by Equation (9) [32].
l n Q e = l n K 4 + 1 n l n C e
where K4 ((mg/g)(L/mg)1/n) is the Freundlich constant and 1/n is a parameter indicating the intensity of adsorption.
Additionally, the maximum adsorption capacity can be related to the Freundlich parameters by Equation (10) [29].
Q m a x = K 4 C o 1 / n
Figure 13 illustrates the linear fitting of the Langmuir and Freundlich isotherms, while Table 4 summarizes the isotherm parameters. The Langmuir isotherm fitting for both F600 and F800 samples shows R2 values of 0.9999 and 0.9996, respectively, indicating excellent agreement with the experimental data. The maximum adsorption capacities (Qmax) derived from the Langmuir model are 295.86 mg/g for F600 and 185.19 mg/g for F800, highlighting the superior adsorption capability of F600. The Langmuir constant K3 for F600 is 1.7979 L/mg, significantly higher than 0.3497 L/mg for F800, reflecting stronger interactions between the Cd(II) ions and F600’s adsorption sites. Although the Freundlich model provides acceptable fits with R2 values of 0.5656 for F600 and 0.5372 for F800, the Langmuir model shows a superior correlation, confirming that the adsorption follows monolayer coverage with a uniform distribution of active sites. The Freundlich parameter 1/n, with values of 0.1455 for F600 and 0.1433 for F800, indicates favorable adsorption, but the Langmuir dominance suggests that the process is governed by the formation of a monolayer of the adsorbed Cd(II) ions rather than multilayer adsorption or heterogeneous surface interactions. The overall results confirm the more efficient and higher-capacity adsorption behavior of F600 compared to F800.
Table 5 presents the maximum adsorption capacities (Qmax) of various adsorbents for the removal of Cd(II) ions, highlighting the superior performance of the F600 and F800 samples synthesized in this study [26,27,28,33,34,35]. Among the listed adsorbents, the F600 and F800 samples exhibit remarkably higher Qmax values of 295.86 mg/g and 185.19 mg/g, respectively, compared to other adsorbents such as modified biochar (108.54 mg/g), Fe3O4/g-C3N4 composite (102.00 mg/g), and FAU-type zeolite (74.07 mg/g). The performance of the F600 sample surpasses that of commonly used adsorbents by a significant margin, while the F800 sample also demonstrates superior adsorption efficiency. Several Fe- and Mg-based nanocomposites have been developed for Cd(II) adsorption, such as MgFe2O4 nanoparticles (221.36 mg/g) [36], functionalized biochar-supported MnFe2O4 nanocomposite (127.83) [37], and Fe3O4/graphene oxide composites (190.12 mg/g) [38]. However, these values are notably lower than that of F600 (295.86 mg/g), demonstrating the enhanced adsorption efficiency of our synthesized material. The exceptional performance of the F600 and F800 samples can be attributed to their optimized structural and morphological properties resulting from the Pechini sol–gel synthesis method. The F600 sample, with its smaller crystallite size, higher porosity, and enhanced surface area, provides abundant active adsorption sites, allowing for efficient Cd(II) ion uptake. Similarly, the F800 sample exhibits excellent adsorption behavior due to its compact nanoparticle structure and uniform surface, although its performance is slightly hindered by reduced porosity and larger crystallite size compared to F600.

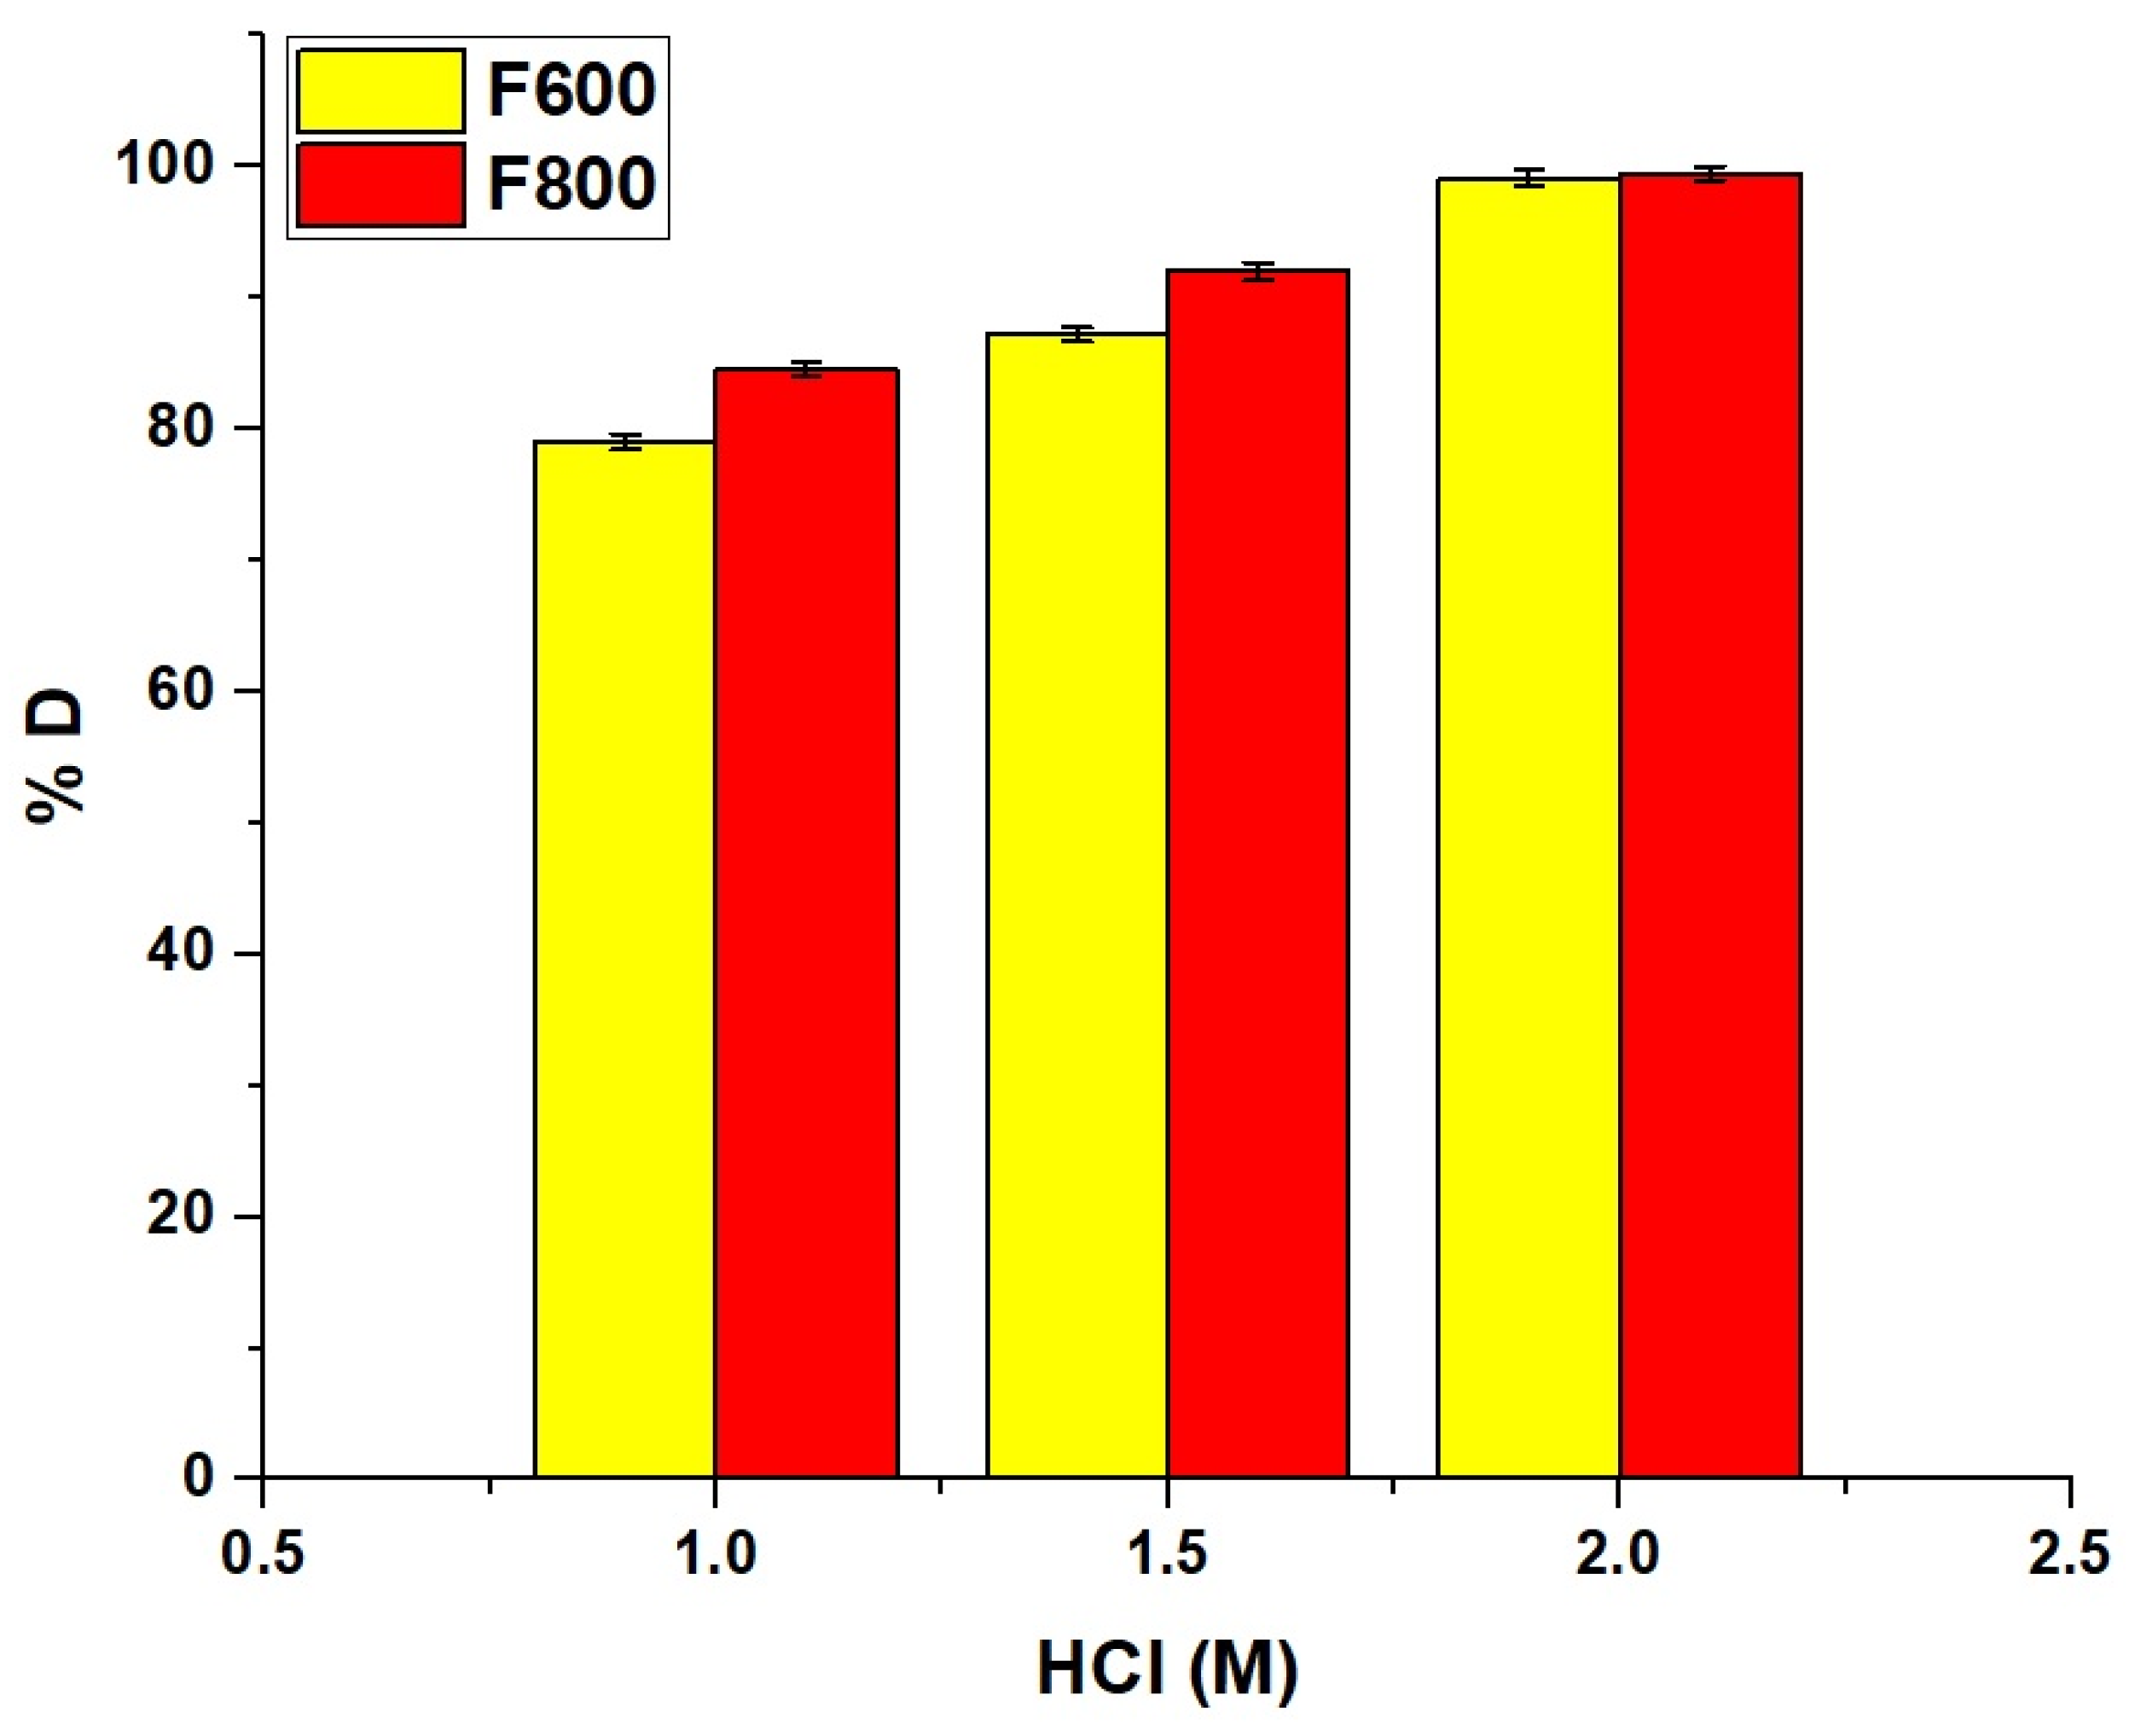
2.2.5. Effect of Regeneration and Reusability

To evaluate the reusability of the F600 or F800 nanocomposite, the desorption of the Cd(II) ions was conducted using hydrochloric acid (HCl) as an eluting agent. The Cd(II)-laden adsorbent was treated with HCl solutions of varying concentrations to determine the most effective desorption conditions. Specifically, desorption experiments were performed using 1.0 M, 1.5 M, and 2.0 M HCl, with a fixed eluting volume of 50 mL per cycle. The mixture was stirred for 120 min to facilitate cadmium release from the adsorbent surface. After the desorption process, the supernatant was separated by filtration and analyzed using an atomic absorption spectrophotometer to determine the concentration of Cd(II) ions in the eluent. The desorption efficiency of Cd(II) ions, expressed as % D, was calculated using Equation (11).
%   D = 100 C d V d ( C o C e ) V
where Cd represents the concentration of Cd(II) ions in the desorption solution (mg/L) whereas Vd is the volume of the desorption solution (L).
The desorption efficiency of Cd(II) ions from the synthesized nanocomposites increased with higher HCl concentrations, as shown in Figure 14, reaching 79.05% for F600 and 84.54% for F800 at 1.0 M HCl and rising to nearly complete desorption at 2.0 M HCl with 99.15% and 99.46%, respectively. This high efficiency is due to the protonation of functional groups on the nanocomposite surface, which weakens Cd(II) binding and enhances ion exchange, allowing Cd(II) ions to be effectively displaced by H+ ions.
The reusability of the synthesized nanocomposites for Cd(II) ion removal was assessed over five consecutive adsorption–desorption cycles under controlled experimental conditions. A Cd(II) solution with an initial concentration of 150 mg/L was prepared, and 100 mL of this solution was used for each adsorption cycle. A precisely measured 0.05 g of the adsorbent was introduced into the solution, and the adsorption experiments were conducted at a constant temperature of 298 K to ensure consistency. The pH of the solution was adjusted to 7 to optimize adsorption efficiency, and the contact time was set at 70 min for F800 and 50 min for F600 based on prior optimization studies. After each cycle, the adsorbent was separated, regenerated using 2.0 M HCl, and reused for the subsequent adsorption cycle to evaluate its long-term stability and efficiency in Cd(II) ion removal.
The reusability performance of the synthesized nanocomposites over five adsorption–desorption cycles, as shown in Figure 15, demonstrated that F600 retained high adsorption efficiency, decreasing only slightly from 97.64% at cycle 0 to 94.26% at cycle 5, while F800 showed a more significant decline from 59.49% to 54.60%. These results confirm that the synthesized nanocomposites, particularly F600, exhibit excellent recyclability and long-term efficiency, making them a viable adsorbent for sustainable Cd(II) removal.

2.2.6. Effect of Interference

The effect of competing ions on Cd(II) adsorption by the F600 and F800 nanocomposites was evaluated under binary adsorption conditions at pH 7 and 298 K using a 1:1 molar ratio of Cd(II) to each interfering ion, including Na+, K+, Mg2+, Ca2+, Cl, and NO3, with adsorption capacities determined via atomic absorption spectrophotometry (Table 6). Monovalent cations (Na+ and K+) had minimal impact, reducing adsorption by 5.5 mg/g and 5.0 mg/g for F600 and 4.3 mg/g and 3.8 mg/g for F800, while divalent cations (Mg2+ and Ca2+) caused greater reductions of 20.0 mg/g and 18.5 mg/g for F600 and 15.0 mg/g and 14.2 mg/g for F800, respectively, due to stronger competition for adsorption sites. Anions (Cl and NO3) had the least effect, with adsorption reductions of 4.0 mg/g and 3.5 mg/g for F600 and 3.0 mg/g and 2.7 mg/g for F800, suggesting a weaker influence on adsorption efficiency. These results confirm that the synthesized nanocomposites exhibit high selectivity for Cd(II) adsorption, with divalent cations posing the greatest interference, whereas monovalent cations and anions have a significantly lower impact.

3. Experimental

3.1. Materials

The chemicals used in this study were of analytical grade and obtained from Sigma-Aldrich (St. Louis, MO, USA). Magnesium nitrate hexahydrate (Mg(NO3)2·6H2O), iron(III) nitrate nonahydrate (Fe(NO3)3·9H2O), and chromium(III) nitrate nonahydrate (Cr(NO3)3·9H2O) were utilized as the sources of magnesium, iron, and chromium, respectively. Tartaric acid (C4H6O6) was employed as a chelating agent, while polyethylene glycol 400 (H(OCH2CH2)nOH) was used as a polymerizing agent to assist in the synthesis process. Hydrochloric acid (HCl) and sodium hydroxide (NaOH) were used to adjust the pH of the solutions. Potassium chloride (KCl) was also included as a supporting electrolyte in the pH control experiments. Cadmium nitrate tetrahydrate (Cd(NO3)2·4H2O) was used for adsorption experiments. All the chemicals were used without further purification to maintain consistency throughout the synthesis and experimental procedures.

3.2. Synthesis of Fe0.65Mg0.35Cr2O4@C Nanocomposites

The Fe0.65Mg0.35Cr2O4@C nanocomposite was synthesized using the Pechini sol–gel method, as illustrated in Figure 16. Initially, 35 g of tartaric acid was dissolved in 100 mL of distilled water. Separately, 20 g of Mg(NO3)2·6H2O, 20 g of Fe(NO3)3·9H2O, and 20 g of Cr(NO3)3·9H2O were dissolved in 200 mL of distilled water. The tartaric acid solution was then added to the metal nitrate solution with continuous stirring for 30 min. Subsequently, 15 mL of polyethylene glycol 400 was added to the mixture, and the resulting solution was stirred continuously at 250 °C until the complete evaporation of the solvents occurred. The remaining powder was further calcinated at 600 and 800 °C for 3 hrs to produce the Fe0.65Mg0.35Cr2O4@C nanocomposite. The samples synthesized at 600 and 800 °C were designated as F600 and F800, respectively. The molar ratio of Mg(NO3)2·6H2O, Fe(NO3)3·9H2O, and Cr(NO3)3·9H2O was carefully chosen to produce Fe0.65Mg0.35Cr2O4@C and prevents the formation of secondary phases, ensuring high crystallinity and homogeneity.

3.3. Instrumentation

The characterization and analysis of the synthesized samples were performed using advanced instrumentation to ensure comprehensive evaluation. The crystallographic structure of all the synthesized samples was examined using an X-ray diffraction diffractometer (D8 Discover, Bruker, Billerica, MA, USA). The morphological and elemental compositions were analyzed through scanning electron microscopy combined with energy dispersive X-ray spectroscopy (SEM/EDX) using a Quanta 250 FEG system (Thermo Fisher Scientific, Waltham, MA, USA). High-resolution transmission electron microscopy (HR-TEM) was conducted using a JEM-2100Plus microscope (JEOL Ltd., Tokyo, Japan) to investigate the nanostructure and particle morphology. The concentration of the Cd(II) ions in solution was determined using an atomic absorption spectrophotometer (AAS ZEEnit 700 p, Analytik Jena AG, Jena, Germany) to evaluate the adsorption performance of the synthesized materials.

3.4. Removal of Cd(II) Ions from Aqueous Media

The removal of Cd(II) ions from aqueous solutions was carried out by batch adsorption experiments, as shown in Table 7, using a magnetic stirrer to ensure uniform mixing. To study the effect of pH, 0.1 L of Cd(II) solution with an initial concentration (Co) of 150 mg/L and an adsorbent mass (W) of 50 mg was prepared. The solution was maintained at a temperature (T) of 298 K and stirred for 360 min, with the pH varying from 2 to 7. For investigating the effect of contact time, 0.1 L of Cd(II) solution with Co of 150 mg/L and W of 50 mg was stirred at 298 K and pH 7 for different time intervals ranging from 10 to 100 min. To evaluate the effect of temperature, 0.1 L of Cd(II) solution with Co of 150 mg/L and W of 50 mg was stirred at pH 7 for 70 min using the F800 sample and for 50 min using the F600 sample. The temperature was varied between 298 and 328 K. To examine the effect of initial Cd(II) concentration, 0.1 L of Cd(II) solutions with concentrations ranging from 50 to 300 mg/L were prepared and stirred at 298 K and pH 7 for 70 min using 50 mg of the F800 sample and using 50 mg for 50 min using the F600 sample.
After the adsorption process, the adsorbent was separated using a centrifuge, and the concentration of the Cd(II) ions in the filtrate was measured using an atomic absorption spectrophotometer. All the concentration values (Co) in Table 7 were measured with an error margin of ±0.5 mg/L using an atomic absorption spectrophotometer, and the adsorbent mass (W) was weighed with an accuracy of ±0.1 mg using an analytical balance to ensure reproducibility.

3.5. Point of Zero Charge (pHPZC) of Nanocomposites

The point of zero charge (pHPZC) of the F600 and F800 products was determined using the batch adsorption method with KCl as the supporting electrolyte. In this procedure, 0.1 g of the adsorbent was added to 50 mL of 0.01 M KCl solution in a series of flasks. The initial pH (pHI) of the solutions was adjusted to values ranging from 2 to 12 using either 0.1 M HCl or 0.1 M NaOH. The flasks were then sealed and stirred for 24 h at room temperature to allow equilibrium to be established. The final pH (pHF) of each solution was recorded, and the difference between the initial and final pH (△pH) was calculated using Equation (12) [39].
pH = pHF − pHI
The pHPZC was determined by plotting △pH versus pHI and identifying the point where △pH equals zero.

4. Conclusions

This research highlights the successful synthesis and characterization of Fe0.65Mg0.35Cr2O4@C nanocomposites (F600 and F800) for the effective removal of Cd(II) ions from aqueous media. The maximum adsorption capacities for F600 and F800 were 295.86 mg/g and 185.19 mg/g, respectively, demonstrating the superior capacity of F600 in capturing Cd(II) ions. Thermodynamic and kinetic studies revealed that the adsorption process was exothermic, spontaneous, and primarily governed by a physical mechanism following the pseudo-second-order model and Langmuir isotherm. EDX analysis confirmed the elemental composition of the samples, with F600 exhibiting higher carbon content, further enhancing its adsorption efficiency. The FE-SEM and HR-TEM images demonstrated that F600 maintained a more porous and loosely agglomerated nanoparticle structure, facilitating greater ion accessibility and adsorption. In contrast, F800 exhibited more compact and aggregated particles, limiting its adsorption potential. These findings emphasize the potential of F600 as a highly efficient adsorbent for addressing cadmium contamination, offering a sustainable solution for mitigating heavy metal pollution in aquatic systems.

Author Contributions

E.A.A. (methodology, funding acquisition, writing—review and editing, and conceptualization), A.M.M. (writing—review and editing), M.M.A.-K. (writing—review and editing), F.A.S. (writing—review and editing and visualization), R.K.S. (visualization and writing—review and editing). All authors have read and agreed to the published version of the manuscript.

Funding

This work was supported and funded by the Deanship of Scientific Research at Imam Mohammad Ibn Saud Islamic University (IMSIU) (grant number IMSIU-DDRSP2502).

Institutional Review Board Statement

Not applicable.

Informed Consent Statement

Not applicable.

Data Availability Statement

All the data generated or analyzed during this study are included in this published article.

Acknowledgments

This work was supported and funded by the Deanship of Scientific Research at Imam Mohammad Ibn Saud Islamic University (IMSIU) (grant number IMSIU-DDRSP2502).

Conflicts of Interest

The authors declare no conflicts of interest.

References

  1. Feng, J.; Yu, Y.; Huang, S.; Zhu, N.; Mojiri, A.; Ge, D. Tannic Acid as a Green Chemical for the Removal of Various Heavy Metals: A Critical Review of Recent Developments. J. Environ. Manag. 2025, 375, 124390. [Google Scholar] [CrossRef] [PubMed]
  2. Aziz, K.H.H.; Mustafa, F.S.; Hamarawf, R.F.; Omer, K.M. Adsorptive Removal of Toxic Heavy Metals from Aquatic Environment by Metal Organic Framework (MOF): A Review. J. Water Process Eng. 2025, 70, 106867. [Google Scholar] [CrossRef]
  3. Yu, K.; Yang, L.; Zhang, S.; Zhang, N. Nanocellulose-Based Aerogels for the Adsorption and Removal of Heavy-Metal Ions from Wastewater: A Review. Mater. Today Commun. 2025, 43, 111744. [Google Scholar] [CrossRef]
  4. Baldev; Kumar, G.; Sharma, V.; Nemiwal, M. Biomass-Derived Zirconium Composite: An Adsorbent for Preferential Removal of Heavy Metals and Contaminants in Wastewater. J. Water Process Eng. 2025, 69, 106778. [Google Scholar] [CrossRef]
  5. Richard, E.; Fatyeyeva, K.; Marais, S. Ionic Liquid-Based Polymer Inclusion Membranes for Heavy Metal Ions Removal from Water: Achievements and Challenges. Chem. Eng. J. 2025, 505, 158916. [Google Scholar] [CrossRef]
  6. Ávila, F.G.; Cabrera-Sumba, J.; Valdez-Pilataxi, S.; Villalta-Chungata, J.; Valdiviezo-Gonzales, L.; Alegria-Arnedo, C. Removal of Heavy Metals in Industrial Wastewater Using Adsorption Technology: Efficiency and Influencing Factors. Clean. Eng. Technol. 2025, 24, 100879. [Google Scholar] [CrossRef]
  7. Wibowo, Y.G.; Anwar, D.; Safitri, H.; Surya, I.; Sudibyo, S.; Yuliansyah, A.T.; Murti Petrus, H.T.B. Functionalized Magnetite-Biochar with Live and Dead Bacteria for Adsorption-Biosorption of Highly Toxic Metals: Cd, Hg, and Pb. Next Mater. 2025, 6, 100487. [Google Scholar] [CrossRef]
  8. Arya, K.; Kumar, A.; Kataria, R. Recent Advances in MOF-Based Composites for the Detection and Adsorptive Removal of Pb(II) Ions in Aqueous Phase. Mater. Today Sustain. 2025, 29, 101057. [Google Scholar] [CrossRef]
  9. Zheng, X.; Alam, O.; Zhou, Y.; Du, D.; Li, G.; Zhu, W. Heavy Metals Detection and Removal from Contaminated Water: A Critical Review of Adsorption Methods. J. Environ. Chem. Eng. 2024, 12, 114366. [Google Scholar] [CrossRef]
  10. Miretzky, P.; Cirelli, A.F. Hg(II) Removal from Water by Chitosan and Chitosan Derivatives: A Review. J. Hazard. Mater. 2009, 167, 10–23. [Google Scholar] [CrossRef]
  11. Naksen, P.; Boonruang, S.; Yuenyong, N.; Lee, H.L.; Ramachandran, P.; Anutrasakda, W.; Amatatongchai, M.; Pencharee, S.; Jarujamrus, P. Sensitive Detection of Trace Level Cd (II) Triggered by Chelation Enhanced Fluorescence (CHEF) “Turn on”: Nitrogen-Doped Graphene Quantum Dots (N-GQDs) as Fluorometric Paper-Based Sensor. Talanta 2022, 242, 123305. [Google Scholar] [CrossRef] [PubMed]
  12. Allah, A.F.; Shaban, M.; Alqhtani, H.A.; Bin-Jumah, M.; Alenazi, N.A.; Allam, A.A.; Abukhadra, M.R. Effective Remediation of Toxic Metal Ions (Cd(II), Pb(II), Hg(II), and Ba(II)) Using Mesoporous Glauconite-Based Iron Silicate Nanorods: Experimental and Theoretical Studies. Microporous Mesoporous Mater. 2025, 382, 113390. [Google Scholar] [CrossRef]
  13. Shao, Z.; Lu, J.; Ding, J.; Fan, F.; Sun, X.; Li, P.; Fang, Y.; Hu, Q. Novel Green Chitosan-Pectin Gel Beads for the Removal of Cu(II), Cd(II), Hg(II) and Pb(II) from Aqueous Solution. Int. J. Biol. Macromol. 2021, 176, 217–225. [Google Scholar] [CrossRef] [PubMed]
  14. Li, Y.; Rahman, S.U.; Qiu, Z.; Shahzad, S.M.; Nawaz, M.F.; Huang, J.; Naveed, S.; Li, L.; Wang, X.; Cheng, H. Toxic Effects of Cadmium on the Physiological and Biochemical Attributes of Plants, and Phytoremediation Strategies: A Review. Environ. Pollut. 2023, 325, 121433. [Google Scholar] [CrossRef]
  15. Salih, S.S.; Shihab, M.A.; Mohammed, H.N.; Kadhom, M.; Albayati, N.; Ghosh, T.K. Chitosan-Vermiculite Composite Adsorbent: Preparation, Characterization, and Competitive Adsorption of Cu(II) and Cd(II) Ions. J. Water Process Eng. 2024, 59, 105044. [Google Scholar] [CrossRef]
  16. Yuan, F.; Yan, D.; Song, S.; Zhang, J.; Yang, Y.; Chen, Z.; Lu, J.; Wang, S.; Sun, Y. Removal of Heavy Metals from Water by Adsorption on Metal Organic Frameworks: Research Progress and Mechanistic Analysis in the Last Decade. Chem. Eng. J. 2025, 506, 160063. [Google Scholar] [CrossRef]
  17. Chen, Q.; Yao, Y.; Li, X.; Lu, J.; Zhou, J.; Huang, Z. Comparison of Heavy Metal Removals from Aqueous Solutions by Chemical Precipitation and Characteristics of Precipitates. J. Water Process Eng. 2018, 26, 289–300. [Google Scholar] [CrossRef]
  18. Goyburo-Chávez, C.; Mendez-Ruiz, J.I.; Jiménez-Oyola, S.; Romero-Crespo, P.; Gutierrez, L.; Valverde-Armas, P.E. Pilot-Scale Reverse Osmosis Treatment of Gold Cyanidation Effluent for the Removal of Cyanide, Heavy Metal(Loid)s, and Ionic Species. Case Stud. Chem. Environ. Eng. 2024, 9, 100688. [Google Scholar] [CrossRef]
  19. Hou, R.; Bao, S.; Dai, J.; Yan, W.; Yao, Y.; Zhou, Y.; Gao, C. Development of Novel Nanofiltration Membrane via Cross-Linking a Natural Polymer and Its Application in Heavy Metals Removal from Groundwater. J. Memb. Sci. 2025, 719, 123768. [Google Scholar] [CrossRef]
  20. Atallah, C.; Mosadeghsedghi, S.; Dashtban Kenari, S.L.; Hudder, M.; Morin, L.; Volchek, K.; Mortazavi, S.; Ben Salah, I. Removal of Heavy Metals from Mine Water Using a Hybrid Electrocoagulation-Ceramic Membrane Filtration Process. Desalination Water Treat. 2024, 320, 100730. [Google Scholar] [CrossRef]
  21. Tabish, M.; Tabinda, A.B.; Mazhar, Z.; Yasar, A.; Ansar, J.; Wasif, I. Physical, Chemical and Biological Treatment of Textile Wastewater for Removal of Dyes and Heavy Metals. Desalination Water Treat. 2024, 320, 100842. [Google Scholar] [CrossRef]
  22. Razzak, S.A.; Faruque, M.O.; Alsheikh, Z.; Alsheikhmohamad, L.; Alkuroud, D.; Alfayez, A.; Hossain, S.M.Z.; Hossain, M.M. A Comprehensive Review on Conventional and Biological-Driven Heavy Metals Removal from Industrial Wastewater. Environ. Adv. 2022, 7, 100168. [Google Scholar] [CrossRef]
  23. Al-kadhi, N.S.; Abdelrahman, E.A.; Alamro, F.S.; Shah, R.K. Synthesis of Novel Magnesium Ferrite Schiff Base Chitosan Nanocomposite for Efficient Removal of Pb (II) Ions from Aqueous Media. Sci. Rep. 2025, 15, 4153. [Google Scholar] [CrossRef] [PubMed]
  24. Precious, N.; Patience, T.; Kweinor, E.; Rathilal, S. Review on Advancing Heavy Metals Removal: The Use of Iron Oxide Nanoparticles and Microalgae-Based Adsorbents. Clean. Chem. Eng. 2025, 11, 100137. [Google Scholar] [CrossRef]
  25. Lellala, K.; Behera, S.K.; Srivastava, P.; Saeed, W.S.; Haidyrah, A.S.; Burile, A.N. Fe3O4 Nanoparticles Decorated on N-Doped Graphene Oxide Nanosheets for Elimination of Heavy Metals from Industrial Wastewater and Desulfurization. Diam. Relat. Mater. 2024, 150, 111746. [Google Scholar] [CrossRef]
  26. Ge, S.; Zhao, S.; Wang, L.; Zhao, Z.; Wang, S.; Tian, C. Exploring Adsorption Capacity and Mechanisms Involved in Cadmium Removal from Aqueous Solutions by Biochar Derived from Euhalophyte. Sci. Rep. 2024, 14, 450. [Google Scholar] [CrossRef]
  27. Guo, S.; Duan, N.; Dan, Z.; Chen, G.; Shi, F.; Gao, W. G-C3N4 Modified Magnetic Fe3O4 Adsorbent: Preparation, Characterization, and Performance of Zn(II), Pb(II) and Cd(II) Removal from Aqueous Solution. J. Mol. Liq. 2018, 258, 225–234. [Google Scholar] [CrossRef]
  28. Joseph, I.V.; Tosheva, L.; Doyle, A.M. Simultaneous Removal of Cd(II), Co(II), Cu(II), Pb(II), and Zn(II) Ions from Aqueous Solutions via Adsorption on FAU-Type Zeolites Prepared from Coal Fly Ash. J. Environ. Chem. Eng. 2020, 8, 103895. [Google Scholar] [CrossRef]
  29. Al-Wasidi, A.S.; Abdelrahman, E.A.; Shah, R.K.; Abdelhakim, N.A.; Saad, F.A. Facile Synthesis of Novel Nanocomposite Composed of Co3O4, MgO, and Mg3B2O6 for Malachite Green Dye Decontamination from Aqueous Media. Sci. Rep. 2024, 14, 30570. [Google Scholar] [CrossRef]
  30. Singh, A.K.; Hussain, A.; Priyadarshi, M.; Haider, A. Heavy Metals Removal from Synthetic and Industrial Wastewater Using Synthesized Zinc Oxide Nanoparticles. J. Indian Chem. Soc. 2024, 101, 101145. [Google Scholar] [CrossRef]
  31. Mwebembezi, T.; Wakatuntu, J.; Jjagwe, J.; Kanyesigye, C.; Kulabako, R.N.; Olupot, P.W. Synthesis, Characterization and Application of Steel Waste-Based Iron Oxide Nanoparticles for Removal of Heavy Metals from Industrial Wastewaters. Heliyon 2024, 10, e28153. [Google Scholar] [CrossRef] [PubMed]
  32. Kaleem, M.; Anjum Minhas, L.; Zaffar Hashmi, M.; Umer Farooqi, H.M.; Waqar, R.; Kamal, K.; Saad Aljaluod, R.; Alarjani, K.M.; Samad Mumtaz, A. Biogenic Synthesis of Iron Oxide Nanoparticles and Experimental Modeling Studies on the Removal of Heavy Metals from Wastewater. J. Saudi Chem. Soc. 2024, 28, 101777. [Google Scholar] [CrossRef]
  33. Bagdat, S.; Tokay, F.; Demirci, S.; Yilmaz, S.; Sahiner, N. Removal of Cd(II), Co(II), Cr(III), Ni(II), Pb(II) and Zn(II) Ions from Wastewater Using Polyethyleneimine (PEI) Cryogels. J. Environ. Manag. 2023, 329, 117002. [Google Scholar] [CrossRef]
  34. Hua, R.; Li, Z. Sulfhydryl Functionalized Hydrogel with Magnetism: Synthesis, Characterization, and Adsorption Behavior Study for Heavy Metal Removal. Chem. Eng. J. 2014, 249, 189–200. [Google Scholar] [CrossRef]
  35. Khalifa, M.E.; Abdelrahman, E.A.; Hassanien, M.M.; Ibrahim, W.A. Application of Mesoporous Silica Nanoparticles Modified with Dibenzoylmethane as a Novel Composite for Efficient Removal of Cd(II), Hg(II), and Cu(II) Ions from Aqueous Media. J. Inorg. Organomet. Polym. Mater. 2020, 30, 2182–2196. [Google Scholar] [CrossRef]
  36. Chen, Y.; Liu, M. Preparation and Study of the Adsorption Performances of (Mg, Ca, Ba)Fe2O4 Magnetic Porous Materials for Removal of Cd(II) Heavy Metal Ion from Water Environment. Russ. J. Phys. Chem. A 2022, 96, 1761–1767. [Google Scholar] [CrossRef]
  37. Zhang, L.; Guo, J.; Huang, X.; Wang, W.; Sun, P.; Li, Y.; Han, J. Functionalized Biochar-Supported Magnetic MnFe2O4 Nanocomposite for the Removal of Pb(Ii) and Cd(II). RSC Adv. 2019, 9, 365–376. [Google Scholar] [CrossRef]
  38. Nguyen, T.H.N.; Mai, D.D.; Hoang, A.S.; Pham, S.H.; Nguyen, T.L. Preparation of Fe3O4/Graphene Oxide Nanocomposites on Activated Carbon for As(V) Removal from Aqueous Solutions. J. Porous Mater. 2024, 31, 659–671. [Google Scholar] [CrossRef]
  39. Al-Kadhi, N.S.; Abdelrahman, E.A.; Fowzia, A.A.; Fawaz, S.A.; Doaa, A.S. Facile Synthesis of MnCO3/ZrO2/MgCO3 Nanocomposite for High- Efficiency Malachite Green Dye Removal. J. Inorg. Organomet. Polym. Mater. 2025, in press. [Google Scholar] [CrossRef]
Figure 1. XRD of F600 (A) and F800 (B) samples.
Inorganics 13 00082 g001
Figure 2. EDX patterns of F600 (A) and F800 (B) samples.
Inorganics 13 00082 g002
Figure 3. FE-SEM images of F600 (A) and F800 (B) samples.
Inorganics 13 00082 g003
Figure 4. HR-TEM images of F600 (A) and F800 (B) samples.
Inorganics 13 00082 g004
Figure 5. Effect of pH on the removal efficiency (% R) of the Cd(II) ions using the F600 and F800 samples.
Inorganics 13 00082 g005
Figure 6. Determination of the point of zero charge (pHPZC) based on ΔpH variation as a function of initial pH (pHI) for the F600 and F800 samples.
Inorganics 13 00082 g006
Figure 7. Schematic representation of the surface charge behavior of the synthesized nanocomposites below and above the pHPZC.
Inorganics 13 00082 g007
Figure 8. Comparative removal efficiency (% R) of F600 and F800 samples over time.
Inorganics 13 00082 g008
Figure 9. Kinetic modeling of Cd(II) ion adsorption onto F600 and F800 samples. (A) Pseudo-first-order kinetic model and (B) pseudo-second-order kinetic model fitting curves.
Inorganics 13 00082 g009
Figure 10. Effect of temperature on the removal efficiency (% R) of the F600 and F800 samples for Cd(II) ions.
Inorganics 13 00082 g010
Figure 11. Van’t Hoff plots for the adsorption of the Cd(II) ions onto the F600 and F800 samples.
Inorganics 13 00082 g011
Figure 12. Effect of initial Cd(II) concentration on the removal efficiency of the F600 and F800 samples.
Inorganics 13 00082 g012
Figure 13. Linear fitting of adsorption isotherms for Cd(II) ions onto F600 and F800 samples: (A) Langmuir isotherm and (B) Freundlich isotherm.
Inorganics 13 00082 g013
Figure 14. Desorption efficiency (% D) of Cd(II) ions from F600 and F800 nanocomposites using different concentrations of HCl.
Inorganics 13 00082 g014
Figure 15. Reusability performance of F6000 and F800 nanocomposites over five adsorption–desorption cycles.
Inorganics 13 00082 g015
Figure 16. Synthesis process of Fe0.65Mg0.35Cr2O4@C.
Inorganics 13 00082 g016
Table 1. Atomic percentages of elements in F600 and F800 samples.
SampleAtomic Percentages
% C% O% Mg% Cr% Fe
F6007.048.419.013.512.1
F8003.442.717.619.017.3
Table 2. Experimental and kinetic model parameters for Cd(II) ion adsorption onto F600 and F800 samples, including pseudo-first-order and pseudo-second-order model fitting.
SampleQExp
(mg/g)
Pseudo-First-OrderPseudo-Second-Order
K1
(1/min)
R2Qe
(mg/g)
K2
(g/mg·min)
R2Qe
(mg/g)
F600292.920.04250.976791.190.001160.9999294.99
F800178.480.02310.9615108.130.0004960.9999177.30
Table 3. Thermodynamic parameters for the adsorption of the Cd(II) ions onto the F600 and F800 samples.
Sample△So
(KJ/molK)
△Ho
(KJ/mol)
△Go
(KJ/mol)
298308318328
F6000.0737−33.10−55.06−55.79−56.54−57.27
F8000.0479−17.06−31.34−31.82−32.29−32.77
Table 4. Langmuir and Freundlich isotherm parameters for the adsorption of the Cd(II) ions onto the F600 and F800 samples.
SampleLangmuirFreundlich
Qmax
(mg/g)
R2K3
(L/mg)
K4
(mg/g)(L/mg)1/n
Qmax
(mg/g)
1/nR2
F600295.860.99991.7979161.36348.840.14550.5656
F800185.190.99960.349791.99196.520.14330.5372
Table 5. Maximum adsorption capacities (Qmax) of various adsorbents for removal of Cd(II) ions.
AdsorbentQmax
(mg/g)
Ref.
Modified biochar108.54[26]
Fe3O4/g-C3N4 composite102.00[27]
Polyethyleneimine16.93[33]
FAU-type zeolite74.07[28]
Sulfhydryl functionalized hydrogel27.40[34]
SiO2/dibenzoylmethane composite55.37[35]
MgFe2O4 nanoparticles221.36[36]
Functionalized biochar-supported MnFe2O4 nanocomposite127.83[37]
Fe3O4;/graphene oxide nanocomposite190.12[38]
F600295.86This study
F800185.19This study
Table 6. Effect of interfering ions on adsorption of Cd(II) ions using F600 and F800 nanocomposites.
Interfering IonsQ of F600
(mg/g)
Q of F800
(mg/g)
Reduction
in Q of F600 (mg/g)
Reduction in
Q of F800 (mg/g)
None (Control)292.92178.48--------
Na+287.42174.185.54.3
K+287.92174.685.03.8
Mg2+272.92163.4820.015.0
Ca2+274.42164.2818.514.2
Cl288.92175.484.03.0
NO3289.42175.783.52.7
Table 7. Experimental parameters for studying the effects of pH, time, temperature, and initial Cd(II) concentration on adsorption.
EffectV (L)Co (mg/L)W (mg)T (K)T (min)pH
pH0.1150502983602–7
Time0.11505029810–1007
Temperature0.115050298–32870 (F800)
50 (F600)
7
Concentration0.150–3005029870 (F800)
50 (F600)
7
Disclaimer/Publisher’s Note: The statements, opinions and data contained in all publications are solely those of the individual author(s) and contributor(s) and not of MDPI and/or the editor(s). MDPI and/or the editor(s) disclaim responsibility for any injury to people or property resulting from any ideas, methods, instructions or products referred to in the content.

