Abstract
Titanium dioxide nanotubes (TiO2 NTs) decorated with lead sulfide nanoparticles (PbS NPs) were synthesized using the Successive Ionic Layer Adsorption and Reaction (SILAR) method at different number (n) of cycles (where n = 3, 5, and 8) and evaluated for tetracycline (TC) photodegradation under UV light. PbS NPs/TiO2 NTs heterojunctions prepared with 5 SILAR cycles showed optimal photocatalytic activity. Also, under optimized conditions, pure TiO2 NTs achieved complete TC photodegradation (99%) within 5 h under UV irradiation, with a proposed degradation mechanism based on holes (h+) and hydroxyl radicals (•OH) as dominant reactive species.
1. Introduction
The challenge of pollution in its various forms is becoming more and more pressing in today’s world. Water pollution, in particular, is a huge problem caused primarily by current industrialization practices. Various effluents are released into water resources without treatment, instantly polluting the water. Textile, dyeing, and printing industries discharge colored water into nearby water resources without treatment. This colored water is highly toxic and harmful. Significant efforts have been employed to develop suitable purification methods for dye removal. Various semiconductors are used as photocatalysts to degrade and destroy dyes, including carbon-based photocatalysts [1], conductive polymers [2], and metal-oxide semiconductors (i.e., ZnO [3], Al2O3 [4], Fe3O4 [5], and SnO2 [6]). Among the variety of semiconductors, Titanium Dioxide (TiO2), an n-type oxide semiconductor material, promoted tremendous interest for its applications in energy and environmental areas. TiO2 is widely used in photocatalytic processes due to several key properties. These include its non-toxic nature, photosensitivity, direct band gap energy (3.2 eV for anatase and 3.0 eV for rutile), and excellent chemical and mechanical stability. It has been shown that TiO2 can exist as nanoparticles (NPs), nanowires, nanofibers, or nanotubes (NTs). The nanotubular structure of TiO2 has attracted significant attention recently. Compared to other morphologies, TiO2 nanotubes offer a highly specific surface area. This enhanced surface area increases the absorption of organic molecules during photocatalytic reactions. Moreover, it has been found that crystallized TiO2 NTs have high photocatalytic performance, good electronic conductivity, and mechanical stability [7]. Self-organized and vertically oriented TiO2 NTs are prepared by electrochemical anodization of titanium foil. This morphology offers two key advantages: large effective surface area and efficient vertical charge carrier transport. Indeed, this transport mode can facilitate the collection and separation of photogenerated charges, much in demand for high-performance photoactive materials [8,9]. Several studies focused on the degradation of antibiotics, in particular tetracycline (TC), using TiO2, mainly in its powder form. For example, [10] studied the photocatalytic degradation of TC in an aqueous solution by the P25-TiO2 (80% anatase and 20% rutile, particle size = 20–30 nm) under UV irradiation. They were able to remove 95% of TC and 60% of the total organic carbon (TOC) after 60 min of irradiation and detected NH4 + ions among the final by-products. Similarly, [11] improved the photodegradation of TC by the P25- TiO2 by adding hydrogen peroxide (H2O2). The latter behaves as a trap for electrons from the TiO2 conduction band, thus reducing the electron-hole recombination rate, inducing a higher concentration of OH radicals [12], and leading to faster photodegradation of organic pollutants. Reyes et al. [13] also studied the photodegradation of TC by the P25-TiO2 powder using different light sources; they were able to degrade 100% of TC after 120 min of irradiation with a high level of mineralization (90%). These results are similar to those obtained by Palominos et al. [14], who studied the degradation of TC and obtained an optimal degradation rate (100%) with 50% mineralization. However, no study of the photodegradation of TC in aqueous solution by TiO2 NTs has been reported despite the advantages of using NTs in the photodegradation of pollutants compared to the powder. Indeed, the use of TiO2 NTs immobilized on Ti substrates makes it possible to avoid post-separation and a long recovery time by centrifugation and filtration of the photocatalyst particles. In turn, this long recovery period can influence the results, especially in the case of large photocatalytic reactors that require a large amount of photocatalyst. However, despite its good photoactivity, pure TiO2 NTS have some shortcomings, such as a large band gap of 3.273 eV, which limits the photon absorption of the TiO2 anatase phase to a small fraction of the solar energy (less than 5%). In addition, the rapid recombination of photogenerated electron/hole pairs also leads to a decrease in the photocatalytic efficiency [15]. Recent studies have demonstrated various strategies to overcome these limitations in TiO2-based photocatalytic systems for water treatment applications [16]. In recent years, considerable efforts have been made and many strategies have been considered to improve the optical properties and the photocatalytic activity of TiO2 NTs by extending the absorption range in visible light, and decreasing the recombination rate of the photogenerated electron-hole pairs during the photocatalysis process [17,18,19,20]. Among the strategies adopted, TiO2 NTs were doped with noble metals [21,22,23] and with non-metallic elements [24,25,26] or by forming heterostructures [27,28,29,30]. Several works focused on TiO2 NTs modified by PbS NPs for the photodegradation of dyes, pharmaceuticals, and organic and industrial compounds. Indeed, PbS is a p-type semiconductor having a narrow band gap (0.41 eV bulk state), a rather long exciton lifetime (200–800 ns), and a large excitonic Bohr radius (~18 nm) [31], which leads to extended quantum size effects [32]. PbS has proven its role in improving the electronic properties of TiO2, particularly by decreasing its carrier recombination rate and its optical band gap. Palma et al. [33] biologically synthesized PbS NPs and PbS/TiO2 composites and studied their potential as catalysts in the photodegradation of pharmaceuticals. They used chloramphenicol (CAP), a bacteriostatic antibiotic from the phenicol family, and paracetamol as the most commonly used analgesic and antipyretic drug. Hou et al. [34] showed that TiO2 NTs decorated with PbS NPs by the hydrothermal method are more efficient for the photodegradation of Rhodamine B (RhB) and Methylene Blue (MB) dyes and the reduction of Cr (VI) ions. Moreover, the PbS/TiO2 composite photocatalyst showed high photocatalytic performance in water splitting. Ali et al. [35] demonstrated that the association of PbS quantum particles with TiO2 NPs is highly effective for the degradation of RhB under visible light. Recently, simple and low-cost techniques were adopted for the preparation of PbS/TiO2 heterojunctions. Among them, the SILAR (Successive Ionic Layer Adsorption and Reaction) method is among the cheapest and easiest techniques to produce semiconducting or metallic nanoparticles by simply adjusting the operating conditions. Therefore, it is easy to control the nanoparticles’ loading rate, size, and shape. In the SILAR technique, the substrate is successively immersed in cationic and anionic precursor solutions, just separated by a rinse with purified water after each immersion. Kang et al. [30] applied the SILAR and the electrodeposition methods to deposit PbS NPs on (or in) TiO2 NTs. Zhu et al. [36] show that SILAR simultaneous deposition of PbS and CdS NPs on TiO2 NTs leads to a fast rate of electron injection and a large absorption of visible light via the CdS and PbS NPs, respectively, which can improve charge separation and extend absorption to the entire visible region. In this work, a photocatalytic study based on TiO2 NTs and PbS NPs decorated TiO2 NTs was reported. {PbS NPs}n/TiO2 NTs heterojunctions, where n = 3, 5, and 8, were prepared by a typical electrochemical anodization followed by a simple SILAR process at different cycle numbers (3, 5, and 8). The aim of this work consists first of studying the effects of the cycle number on the structural, morphological, and optical properties of PbS NPs. Then, the photocatalytic performances of pure TiO2 NTs and {PbS NPs} n/TiO2 NTs heterojunctions against TC were investigated. As far as we know, this is the first work dealing with TC photodegradation using TiO2 NTs and {PbS NPs} n/TiO2 NTs heterojunctions.
2. Results and Discussion
2.1. Morphological Analysis
The surface state, the morphology, and the chemical composition of SILAR-synthesized PbS NPs–TiO2 NTs nanocomposites were determined by FESEM/EDX and TEM.
Figure 1 displays FESEM top-view images of pure TiO2 NTs (Figure 1a) and {PbS NPs} n/TiO2 NTs (Figure 1b–d) for three (n) different SILAR cycles: 3, 5, and 8. Pure TiO2 NTs (Figure 1a) have a diameter of about 100 nm and an average NT wall thickness of approximately 20 nm. The inset of Figure 1a shows a cross-section of a homogeneous nanotubular layer with uniformly distributed pores and NTs tightly aligned vertically to the Ti substrate. It can be clearly observed that the PbS NPs were successfully loaded on the surface of the TiO2 NTs. However, PbS NPs may aggregate and block the TiO2 NTs entrance as the number of SILAR cycles “n” increases beyond 5 cycles (Figure 1c,d). These results prove that we can easily control the TiO2 NTs surface coverage rate by simply varying the SILAR number of cycles. Indeed, as “n” increases, we move from PbS NPs partially covered (filled) TiO2 NTs to a discontinuous film of PbS NPs and aggregates deposited on the TiO2 NTs (Figure 1d). TEM images (Figure 2) show the presence of PbS NPs inside or on the walls of the TiO2 NTs.
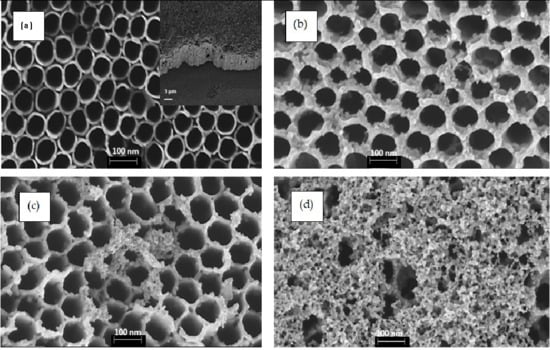
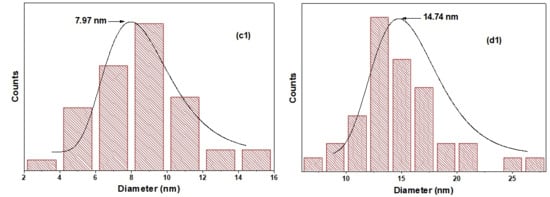
Figure 1.
FESEM top-view images of TiO2 NTs before (a) and after the deposition of PbS NPs at different SILAR cycle number “n” (b) 3 cycles (c) 5 cycles, and (d) 8 cycles. All images were captured at almost a magnification of 100,000×; the scale bar in each image represents 100 nm. The inset of (a) presents a cross-section of pure TiO2 nanotubes. The size distribution of PbS NPs in 5PNTs and 8PNTs is presented in (c1,d1).
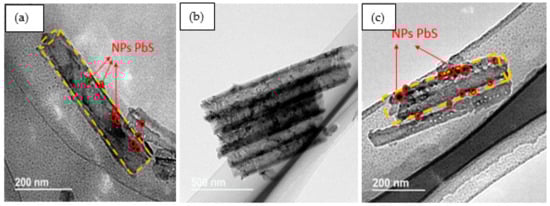
Figure 2.
{PbS NPs}n/TiO2 NTs corresponding TEM images for (a) 5 cycles, (b,c) 8 cycles.
TEM images confirm the presence of PbS NPs on the external walls of the nanotubes and even inside them.
The energy dispersive X-ray analysis (EDX) spectrum (Figure 3) shows the presence of Titanium (Ti), oxygen (O), lead (Pb), and sulfur (S), indicating the decoration of the TiO2 NTs by the PbS NPs. In all EDX analyses, no characteristic peaks belonging to impurities are observed, indicating the high purity of the prepared samples.
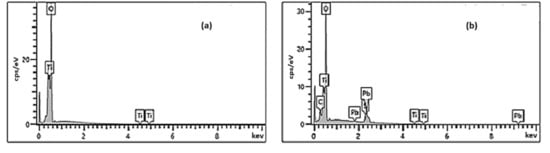
Figure 3.
EDX analyses for (a) pure TiO2 NTs and (b) {PbS NPs} n/TiO2 NTs systems.
It is important to note that PbS NPs are off-stoichiometry; the [Pb]/[S] rate is always slightly greater than 1 and is between 1.2 and 1.3, quasi-independent of the SILAR cycle number “n” (Table 1).

Table 1.
Variation of the atomic percentage of Pb and S versus the number of SILAR cycles.
2.2. X-Ray Diffraction Analysis
Figure 4 depicts the XRD patterns of TiO2 NTs and PbS NPs-TiO2 NTs. The main diffraction peaks are located at 2θ (°) 201 = 25.15, 37.85, 47.92, 53.80, 55.04, 62.63, and 68.83, which are related to the crystalline anatase phase of TiO2 (in good agreement with JCPDS No. 894921). These peaks are labeled by the letter “A” in Figure 4. Sharp XRD peaks indicate good TiO2 NTs crystallinity after the two-step anodization process. Additionally, peaks corresponding to metallic titanium (labeled as “Ti” in Figure 4) are observed, which originate from the underlying Ti substrate used for nanotube growth. These substrate peaks are expected and commonly reported in XRD analysis of anodized TiO2 nanotube arrays grown on titanium foil, as the X-ray penetration depth extends beyond the nanotube layer thickness. Moreover, we may notice the appearance of three peaks assigned to the (200), (220), and (311) crystallographic orientations of the cubic face-centered structure of PbS that are observed at 2θ = 30.00°, 42.93°, and 50.85° (JCPDS No. 781901), respectively. It is worth noting that the intensity of the XRD peak of PbS increases as the number of SILAR cycles “n” rises, leading to further loading of PbS on the TiO2 NTs. The PbS XRD peaks are difficult to detect for 3PTNs (n = 3), probably due to the low density of the PbS NPs at the top of the NTs (Figure 1a). The full width at half maximum (FWHM) and the intensity of the peaks, as well as the crystallite size of PbS in the 5PTNs (n = 5) and 8PTNs (n = 8) samples, are reported in Table 2. We notice a decrease in the FWHM as the number of SILAR cycles “n” increases.
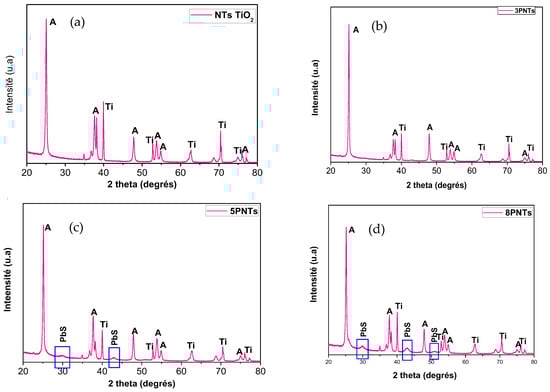
Figure 4.
X-ray diffraction (XRD) patterns of TiO2 NTs before (a) and after the deposition of PbS NPs at different SILAR cycle number “n” = 3 (b), 5 (c) & 8 cycles (d). Peaks labeled “A” correspond to anatase TiO2 phase (JCPDS No. 894921), “Ti” indicates metallic titanium from the substrate, and unlabeled peaks at 2θ = 30.00°, 42.93°, and 50.85° correspond to PbS cubic phase (JCPDS No. 781901).
Table 2.
Variation of the crystallographic parameters of PbS NPs in {PbS NPs} n=58-TiO2 NTs systems and the average crystallite size of 5PNTs and 8PNTs.
The source of the Full Width of Half Maximum (FWHM) narrowing could be determined to estimate the average crystallite size of PbS in samples 5PNTs and 8PNTs, by using the Debye–Scherrer formula:
where D is the average crystallite size (nm), λ is the wavelength of the X-ray radiation (0.15406 nm), K is the shape factor (0.94), β is the FWHM of the diffracted peak, and θ is the Bragg angle. The calculation of the average crystallite size of PbS was carried out by referring to the (200) and (220) crystallographic orientations (Table 2).
2.3. Optical Analysis
Photoluminescence (PL) measurements were performed to estimate the influence of PbS NPs on photogenerated charge carriers’ dynamics in TiO2 NTs. Figure 5 exhibits the PL spectra of pure TiO2 NTs and that of the nanohybrid systems {NPs PbS}n=3, 5 and 8—TiO2 NTs, after a light excitation having a 340 nm wavelength.
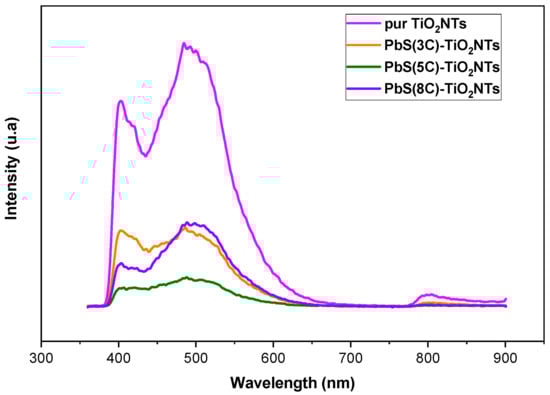
Figure 5.
PL spectra of TiO2 before and after the deposition of PbS NPs at different SILAR cycle number (n = 3, 5, and 8).
PL emission intensity relates to photogenerated charge carrier recombination. Lower PL intensity suggests longer carrier lifetime and reduced recombination rates. In fact, there are two PL processes: band-to-band PL and excitonic PL, determined by their attributes and formation mechanism [37].
The PL peaks located around 402 nm are attributed to a band-to-band transition, while the replica observed in the 245 nm region is attributed to excitonic PL, which mainly results from surface oxygen vacancies due to the non-stoichiometry of TiO2 and probably to surface defects in TiO2 NTs [38].
Figure 5 shows that PbS NPS affects the PL intensity, which varies with the number of SILAR cycles. The lowest PL intensity corresponds to a number of SILAR cycles n = 5. In fact, when PL intensities are in the same order of magnitude, it is difficult to decide whether PbS NPs concentration affects the PL; indeed, when the number of SILAR cycles increases, the PbS NPs may form a rather inhomogeneous layer, and the resulting PL emission does not properly account for carrier dynamics. Nevertheless, the general trend shows that the deposition of PbS NP plays an effective role in reducing the recombination rate of electron/hole pairs. For a fairly large number of SILAR cycles (example n = 8), the NPs agglomerate almost entirely to cover the TiO2 nanotubular surface (Figure 1d) to block the entry of light (the excitation) into the NTs.
Figure 6 shows the diffuse reflectance spectra (DRS) of pure TiO2 NTs and the different nanohybrid systems {NPs PbS}n=3, 5 and8—TiO2 NTs. These spectra will serve to determine the gap energies for different values of “n”. DRS shows an intense peak around 400 nm (Figure 6), which can be due to an absorbance peak resulting from the charge transfer from the valence band formed by the 2P orbitals of the oxide anions to the conduction band formed by the 3d orbitals of the Ti4+ cations [39].
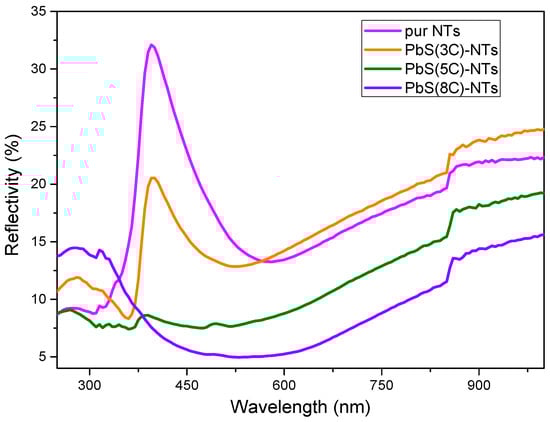
Figure 6.
Diffuse reflectance spectra of TiO2 before and after the deposition of PbS NPs at different SILAR cycle numbers “n”.
It is clearly observable that the diffuse reflectivity of the PbS NPs—TiO2 NTs structures decreases compared to pure TiO2 NTs as “n” increases. This result could be explained by the formation of an ordered nanostructure (PbS NPs) suitable for light trapping. The obtained data were processed by referring to the Kubelka–Munk (K-M) theory [40] given by Equation (2), which links the absorption coefficient α to the reflection coefficient R.
In order to determine the value of the gap energy, we plot the curve (αhυ) 1/β depending on the energy (hυ), as shown in Figure 7; with β a real number which depends on the nature of the transition:
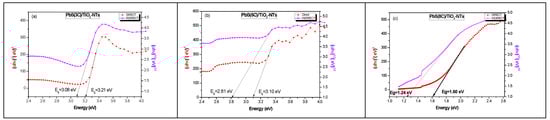
Figure 7.
Extrapolation of the gap (using the Kubelka–MunK theory) of TiO2 NTs after the deposition of PbS nanoparticles at different numbers of SILAR cycles “n” (a) 3 cycles; (b) 5 cycles and (c) 8 cycles.
β = 1/2: direct transition allowed.
β = 2: indirect transition allowed.
Table 3 summarizes the values of the band gap energies of the samples. First, it should be noted that the electronic band gaps of TiO2 and PbS are direct, and it is well known that the band gap energy corresponds to the weakest energetic transition. On the other hand, all the estimated band gap values are greater than the electronic band gap of bulk PbS (0.41 eV). If we consider that all gaps (direct and indirect) correspond to the TiO2-NTs, its band gap is indirect, since it corresponds to the weakest optical band gap (Table 3). The width of this indirect band gap decreases (Table 3) with increasing PbS NPs concentration, presuming that PbS introduces surface levels in TiO2 NTs, resulting in an indirect optical band gap smaller than that of the direct electronic band gap.
Table 3.
Estimation of the gap energy of TiO2 NTs after deposition of PbS NPs.
2.4. Photocatalytic Removal Investigations
The photocatalytic activities of pure TiO2 NTs and {NPs PbS}n=0 - 3 - 55 and 8-TiO2 NTs systems were evaluated via the degradation of aqueous tetracycline (TC) solution under UV light irradiation.
2.4.1. Photocatalytic Test: Kinetic Study of the Tetracycline Degradation Ability by {NPs PbS-NTs TiO2}n Systems
The {PbS NPs} n-TiO2 NTs structures (where n = 0, 3, 5, and 8, which is the number of SILAR cycles) were tested in the photodegradation of tetracycline under ultraviolet irradiation; the effect of the deposition of PbS NPs on the photoactivity of TiO2 NTs was studied. The tested samples were designated as pure NTs, 3PNTs, 5PNTs, and 8PNTs. The used irradiation source is a xenon lamp emitting between 300 and 450 nm with a UV filter at 365 nm. In order to be able to interpret the obtained results, we resort to a series of control experiments. The first check is to see whether we can degrade tetracycline without using TiO2 NTs as a photocatalyst (photolysis), just by exposing the TC to ultraviolet irradiation. Figure 8 shows the UV–vis absorption spectra of light-photodegraded TC (10 mg/L) without introducing a photocatalyst in the solution. It is clearly observable that in the absence of the photocatalyst and after 150 min of UV irradiation, there is a reduction of the TC absorption band at 355 nm; however, there is no observable degradation at the TC characteristic peak at 275 nm; this proves the possibility of the formation of intermediate molecules during irradiation time.
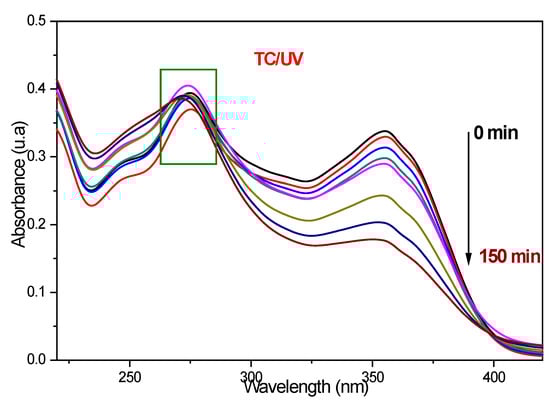
Figure 8.
UV–vis absorbance spectra of TC (10 mg/L) as a function of time without using a photocatalyst.
Figure 9 shows the UV-vis absorbance spectra of TC (10 mg/L) photodegraded in the presence 306 of pure TiO2 nanotubes and {NPs PbS} n-NTs TiO2 heterostructures where n = 3, 5, and 8. It can be clearly noticed that the intensity of both main absorption bands of TC peaking at 275 nmand 355 nm decreases significantly during irradiation time. Interestingly, we note that 8PNTs degrade TC while another band peaking at 208 nm appears (Figure 9d), whose intensity increases as TC photodegrades, indicating the formation of possible by-products. The amount of photocatalytically degraded TC can be defined as follows:
where Ct is the concentration of TC after a UV photodegradation time t, and C0 is the initial concentration of TC before the photocatalytic reaction. As indicated in Table 4, the heterostructure {PbS NPs}5–NTs TiO2 gives the best TC photodegradation. However, this photodegradation is not as high as pure TiO2 NTs; in fact, the surface defects of TiO2 NTs would make them more active under UV and visible light.
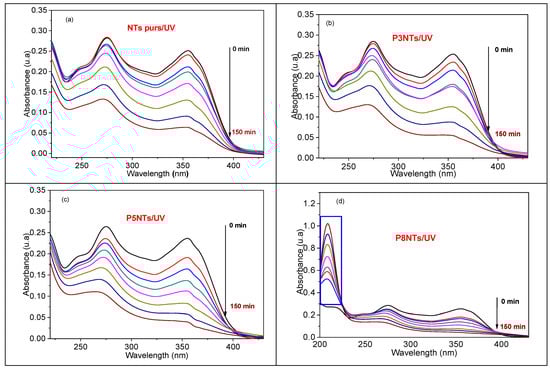
Figure 9.
UV–vis absorbance spectra of TC (10 mg/L) as a function of different times using (a) pure TiO2 NTs, (b) 3PNTs, (c) 5PNTs, and (d) 8PNTs.
Table 4.
Amount of degraded TC for each sample after 150 min of UV irradiation.
Table 4 presents the amount of TC disappeared by photocatalysis for each sample.
Figure 10a illustrates the photodegradation kinetics of TC under UV irradiation for each sample; it represents the variation of the ratio C/C0 versus the irradiation time (where C0 and C are the concentrations of TC before and after irradiation, respectively). Note that the blank experiment (without any photocatalyst, i.e., photolysis) shows 327 that TC is sensitive to light under UV irradiation. We found that photolysis under 150 min of UV irradiation can degrade 47% of TC. The 5PNTs sample has the highest activity with 84% degradation of TC during 150 min of UV irradiation. This result is due to the existence of PbS NPs on the TiO2 NTs, which leads to an efficient transfer of excited electrons from the PbS nanoparticles to the conduction band of the TiO2 NTs, hence improving charge carrier separation and the decrease in their recombination rate.
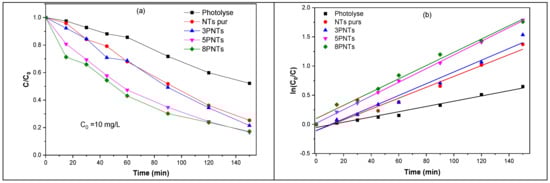
Figure 10.
(a) Variation of TC concentration as a function of UV irradiation time, UV without (photolyse) and in the presence of pure TiO2 NTs, 3PNTs, 5PNTs, and 8PNTs. (b) Photodegradation kinetics of TC (10 mg/L) as a function of UV irradiation time.
However, when the number of SILAR cycles increases up to 8 cycles, the surface coverage of the NTs by the PbS NPs increases, and the degradation decreases slightly to about 82%, giving rise to the formation of intermediate products, which absorb at 208 nm and whose concentration increases with irradiation time (Figure 9d).
The kinetic study can be useful to understand the degradation mechanisms and the different phenomena involved. Several recent studies have reported that the kinetics of photocatalytic degradation of polluted aqueous solutions by TiO2 follow the kinetic model of Langmuir–Hinshelwood (L–H). The kinetics of TC photodegradation by different prepared photocatalysts as a function of irradiation time were studied, and the data obtained were fitted by a pseudo-first-order kinetic equation:
where C (mg/L) is the TC concentration after photodegradation at an irradiation time t (min), C0 (mg/L) is the initial concentration of TC before the photocatalytic reaction, and k (min−1) is the pseudo-first-order rate constant. Figure 10b shows the variation of Ln (C0/C) as a function of UV irradiation time without and with the presence of the different photocatalysts.
Figure 11 illustrates the variation of the rate constant as a function of SILAR cycle number of PbS NPs deposition on TiO2 NTs. The kinetic analysis shows that TC photolysis is a slow photodegradation process (k = 0.0045 min−1), which can be significantly improved by introducing pure TiO2 NTs (k = 0.0093 min−1). The 5PNTs photocatalyst demonstrates the highest activity with a rate constant of 0.0117 min−1, followed by 8PNTs (0.0113 min−1) and 3PNTs (0.0100 min−1). All correlation coefficients (R2) range from 0.9675 to 0.9990, confirming good agreement with the pseudo-first-order kinetic model. This demonstrates that associating TiO2 NTs with PbS NPs effectively improves the photocatalytic activity for TC degradation under UV irradiation.
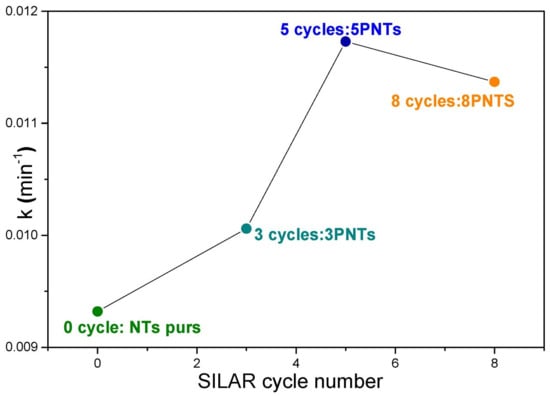
Figure 11.
Variation of degradation rate constants as a function of SILAR cycle number.
2.4.2. Photocatalytic Performance and Stability of Metallic Pure TiO2 Nanotubes: A Proposed Photocatalytic Mechanism
We evaluated both pure TiO2 NTs and PbS-decorated TiO2 NTs for tetracycline photodegradation under UV irradiation. The results showed that PbS decoration improves photoactivity, although the enhancement is moderate. This is because TiO2 NTs already exhibit significant surface defects, making them highly effective photocatalysts for pollutant degradation in general and tetracycline in particular. For this reason, we considered that it is relevant to make a systematic study of the photodegradation of tetracycline using solely pure TiO2 NTs in order to understand the photodegradation mechanism and the different reactions involved. In order to study the photodegradation of TC by pure TiO2 NTs, a sample was immersed in 10 mL of an aqueous solution of TC (20 mg/L). The solution was covered with an aluminum film and kept in the dark for 1 h in order to allow TC to be adsorbed on the surface of the NTs. Figure 12 shows the absorbance of TC in the presence of the TiO2 NTs. The photolysis process shown in Figure 12a is unable to degrade TC under UV irradiation, even after 1, 2, 3, 4, and 5 h of exposure. In contrast, the application of the TiO₂ NTs photocatalyst under the same UV irradiation conditions (Figure 12b) results in a progressive decrease in the intensity of the main absorption bands of TC, at 275 nm and 355 nm. This decrease in absorbance indicates the breakdown of TC molecules, ultimately achieving nearly 99% degradation of TC after 5 h of photocatalytic treatment.
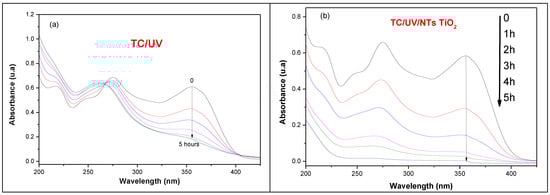
Figure 12.
UV–vis absorbance spectra of TC (20 mg/L) recorded over time (1, 2, 3, 4, and 5 h): (a) without photocatalyst (photolysis) and (b) in the presence of metallic TiO₂ NTs under UV irradiation.
2.5. The Effect of Antibiotic Dosage
In photocatalysis, the degradation efficiency depends on the pollutant amount; hence, we will study quantitatively the TiO2 NTs-based photodegradation rate of TC for different initial concentrations. A 3 h UV irradiation of 5, 20, and 35 mg/L of an initial concentration of TC leads to a photodegradation of about 96, 91, and 74% of the pollutant, respectively (Figure 13a). This shows that the removal efficiency of TC decreases when its concentration increases. Figure 13b displays the plots of Ln (C0/C) versus irradiation time for different amounts of doses of TC. The experimental data were fitted by a pseudo-first-order kinetic equation, and the corresponding rate constants were calculated: 1.1032, 0.8048, and 0.4658 min−1 for an initial TC concentration of 5, 20, and 35 mg/L, respectively (Figure 13b). The increase in the initial TC concentration leads to a decrease in the degradation rate constant. This could mean that for high enough TC concentrations, hydroxyl radicals become the limiting reactant, and therefore lower-order kinetics occur [41].
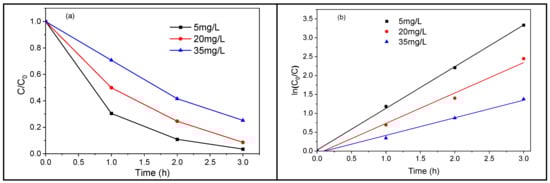
Figure 13.
Photodegradation of TC using metallic TiO2 NTs under UV–vis (a) TC concentration ratios versus irradiation time, (b) TC degradation kinetics.
A high initial concentration of TC leads to more adsorbed antibiotic molecules on the surface of the TiO2 NTs, which in turn slows down the contact (reaction) of the TC molecules with the photogenerated holes or the formed hydroxyl radicals. The higher the TC concentration, the lighter it absorbs, preventing photons from reaching the photocatalyst (TiO2), thus decreasing the photodegradation efficiency [42]. Although the best photodegradation rate of TC was obtained for an initial concentration of 5 mg/L, we found it relevant to end the study with a high concentration of 20 mg/L. Figure 14 depicts the variation of the C/C0 ratio as a function of UV irradiation time. The results show that TC can be degraded faster in the presence of TiO2 NTs.
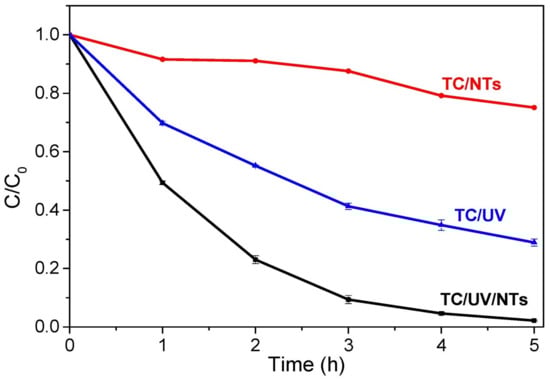
Figure 14.
TC concentration ratio versus UV irradiation time: TC/UV (photolysis, without photocatalyst), TC/NTs (in presence of TiO2 NTs), TC/UV/NTs (in presence of TiO2 NTs and UV irradiation).
2.6. The Effect of Different Scavengers
Three types of active species (superoxide radicals: ·O2−, hydroxyl radicals: OH·, and holes: h+) participate in the photodegradation of pollutants by TiO2. In order to know which active species participate in the UV—photocatalytic degradation of TC via TiO2 NTs and in order to understand the different reactions and mechanisms involved during this process, three types of scavengers (benzoquinone: BQ, isopropanol: IPA, and ethylenediaminetetraacetic acid: EDTA) were used to trap O2−, OH·, and h+, respectively. The introduction of EDTA significantly reduces the photodegradation efficiency of TC from 99 to 79% (Figure 15a); this indicates that the holes (h+) actively participate in the photocatalytic degradation of the antibiotic. When IPA is used, the photodegradation of TC decreases to 83%, indicating that OH· radicals are also important species that contribute to the photodegradation of TC. However, only a slight decrease in the photodegradation efficiency of TC (5%) was observed in the presence of BQ, revealing that superoxide radicals, O2−, play a minor role in the photodegradation process. Therefore, h+ and OH· radicals are the main active species prevailing in the photodegradation of TC via TiO2 NTs under UV irradiation (Figure 15b).
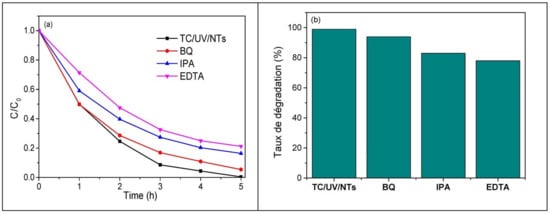
Figure 15.
The effect of different scavengers on TC removal, (a) photodegradation efficiency of TC and (b) photodegradation of TC. (Initial TC concentration: 20 mg/L, photocatalyst: metallic TiO2 NTs, scavengers, and UV light irradiation time: 5 h).
2.7. The Proposed Mechanism for TC Degradation
Figure 16 summarizes the different mechanisms involved during the photodegradation processes based on the results of the scavenging tests. The excitation of the TiO2 NTs by a UV light, having an energy greater than or equal to the band gap energy, generates electrons in the conduction band (CB), leaving holes in the valence band (VB) (Equation (5)). While photogenerated electrons (e−) can react with O2 to form superoxide radicals (·O2−) (Equation (6)), scavenging tests demonstrate this pathway contributes minimally to TC degradation (only 5% decrease with BQ scavenger). The photogenerated holes (h+) could directly oxidize the TC or react with water (Equation (7)) (or the hydroxyl ion OH− (Equation (8)) to form strong oxidants (OH·), which participate in the degradation of TC into stable products. This mechanism is strongly supported by scavenging experiments, which demonstrate that hole trapping with EDTA reduces degradation efficiency from 99% to 79%, while hydroxyl radical scavenging with IPA decreases it to 83%. In contrast, superoxide radical trapping with BQ shows only minimal impact (5% decrease), confirming that the hole-mediated pathways are dominant in TC photodegradation.
TiO2 + hν → TiO2 (e− + h+)
e− + O2 → ·O2−
h+ + H2O → H+ + OH·
h+ + OH− → OH·
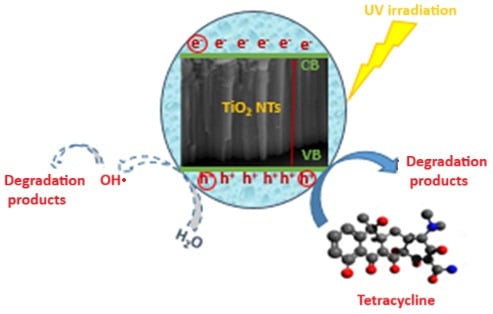
Figure 16.
Proposed mechanism for TC photodegradation by TiO2 NTs under UV irradiation. Solid arrows indicate dominant pathways (h+ and •OH radicals, ~95% contribution), while dashed arrows show minor contributions (~5%).
Therefore, the ability of the photocatalyst to oxidize the antibiotic is mainly due to the photogenerated holes as well as to the hydroxyl radicals (Equation (9)), which are considered as the primary oxidizing agent acting not only on the surface but also in solution.
TC + OH· → Degradation products
The presence of intermediate and resulting by-products in the final solution versus UV irradiation time is verified by high-performance liquid chromatography (HPLC) analysis for each sample at different irradiation time intervals. The sample was monitored by an HPLC equipped with a UV–vis detector at 215 nm. The recorded chromatograms (Figure 17) show the progressive disappearance of the characteristic peak of TC as UV irradiation time increases until total disappearance after 5 h of irradiation.
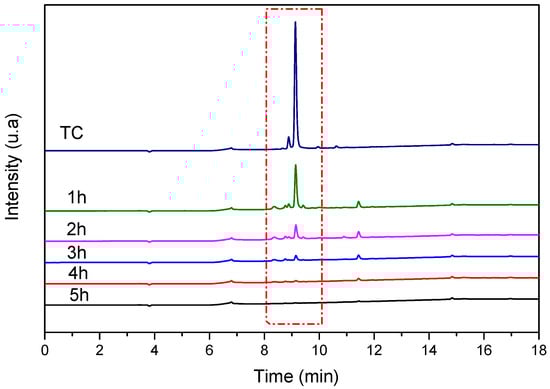
Figure 17.
HPLC chromatograms of TC (20 mg/L) recorded before and after reaction with TiO2 NTs at different UV irradiation times. Red dash represent the disappearance of the characteristic peak of TC as UV irradiation time.
The progressive disappearance of the TC peak with no corresponding increase in intermediate product peaks suggests efficient mineralization rather than simple molecular transformation or surface adsorption. Control experiments showed that TC adsorption on TiO2 NTs in the dark reached equilibrium within 1 h with minimal TC removal, confirming that the observed peak disappearance under UV irradiation is due to photocatalytic degradation.
2.8. Reusability and Stability
The TiO2 NTs must be stable over time and able to be reused with limited performance losses. To evaluate the reusability of the photocatalyst, a series of recycling experiments (cyclic photodegradation of TC in the presence of TiO2 NTs) were performed. Five consecutive tests of photodegradation were carried out under the same experimental conditions (20 mg/L of TC, 5 h of UV irradiation). After each run, we used a fresh initial solution of TC (20 mg/L). We observed that the photocatalyst could be used successfully for at least five consecutive cycles (Figure 18) without any noticeable loss in performance. Considering their significant photocatalytic activity and their stability, TiO2 NTs constitute an excellent candidate for the photodegradation of antibiotics, in particular tetracycline (TC).
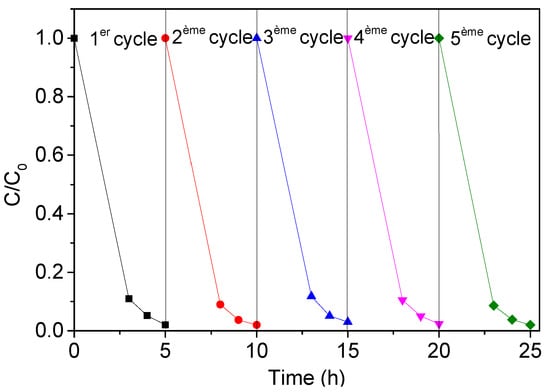
Figure 18.
Stability of metallic TiO2 NTs photocatalyst after five consecutive cycles for the photodegradation of TC (20 mg/L).
The photocatalyst that was recycled five times was analyzed by XRD before and after the recycling step. The XRD patterns of TiO2 NTs before and after photodegradation (Figure 19) show that the photocatalyst preserves the anatase phase of TiO2 (in good agreement with JCPDS No. 894921). The presence of sharp XRD diffraction peaks shows that the nanotubes conserve high crystallinity after a certain number of photocatalytic cycles. Based on the above results, the TiO2 NTs have satisfactory recycling stability and performance.
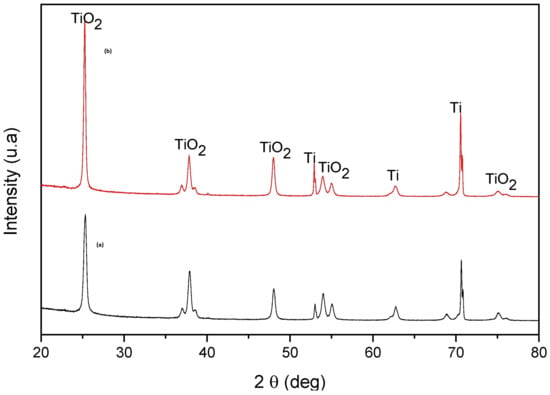
Figure 19.
X-ray diffraction (XRD) patterns of TiO2 NTs (a) before and (b) after five cycles of TC photodegradation.
3. Materials and Methods
3.1. Materials
All the chemicals used in this method were of analytical grade and used as received without any further purification.
3.2. Preparation of PbS-TiO2 Photocatalysts
The synthesis of TiO2 NTs was based on previous reports [43]. Briefly, the electrochemical growth of the nanotubes was carried out at room temperature and under identical experimental conditions; it was carried out in two steps. The first one consists of an anodization in an electrolytic cell containing 100 mL of ethylene glycol, 1% of ammonium fluoride (NH4F), and 2% of ultrapure water (H2O) with a platinum foil as counter electrode. The anodization voltage and time were fixed at 60 V and 60 min, respectively. The first TiO2 NT layer is treated in an ultrasonic bath until it is eliminated. The purpose of this step is to prepare the surface for the growth of a well-ordered and rigid nanotubular structure. In a second step, a second anodization is performed under the same experimental conditions, while fixing the anodization time to 20 min. At the end of the process, a nanotubular TiO2 layer forms on the Ti sheet; this layer is then carefully treated by low-frequency ultrasound in an ultrapure water bath in order to eliminate debris and ions formed in the superficial layer. The samples are then air-dried before proceeding to the annealing step. The crystallization of the TiO2 nanotubes in the anatase phase requires annealing for 3 h at 400 °C (5 °C/min). Finally, the samples are cooled to room temperature and ready to be sensitized with PbS nanoparticles for photocatalytic studies. For the deposition of PbS NPs, we performed the simple SILAR method. First, the cationic precursor solution was prepared by mixing (0.01 M) lead (II) nitrate (Pb (NO3)2) in 50 mL of water, while the anionic precursor solution was prepared by dissolving (0.01 M) sodium sulfide (Na2S) in water. Both solutions were well stirred to avoid any precipitation. The TiO2 NTs were successively immersed in the Pb (NO3)2 for 30 s and then in the Na2S solution for the same duration. This step allows the TiO2 substrate surface to adsorb both anionic and cationic ions. After each step of immersion, the substrate was washed with DI water to remove the excessive precursor solution and impurities. This whole process corresponds to one SILAR cycle (Figure 20). The latter is repeated n times (n cycles) to achieve {PbS NPs} n/TiO2 NTs heterojunctions (where n = 0, 3, 5, and 8); the prepared samples were denoted as NTs, 3 PNTs, 5 PNTs, and 8 PNTs, respectively.
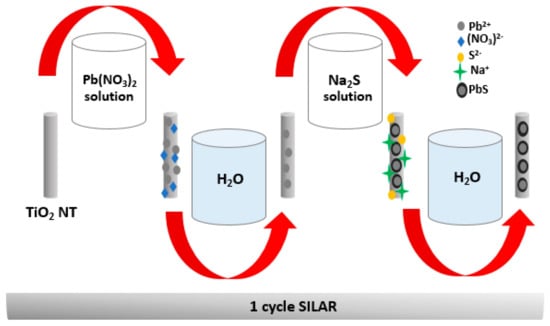
Figure 20.
Illustration of the fabrication process of {PbS NPs} n-TiO2 NTs with SILAR method.
3.3. Characterization of Synthesized Materials
To investigate the crystal structure of the prepared samples, a Rigaku Ultima IV X-Ray (Rigaku, Tokyo, Japan) diffractometer working in the Bragg-Brentano configuration (the X-ray radiation is λCuKα = 1.54060 Å) was used. The elemental composition of the PbS NPs-TiO2 NTs heterojunctions was determined using energy dispersive X-ray spectroscopy (SEM—EDS); the EDS detector is a Zeiss ULTRA 55 model INCA X-MAX 50 (Oxford Instruments, Wiesbaden, Germany), equipped with an In-Lens SE detector. TEM images were 145 carried out using a JEM-100CX2 (JEOL, Tokyo, Japan) transmission electron microscope having an accelerating voltage of 200 KV. The spectral absorption of the PbS NPs-TiO2 NTs samples was performed using a UV–Vis–IR spectrometer. The photoluminescence (PL) signals of the PbS NPs-TiO2 NTs samples were recorded using a Perkin Elmer (PerkinElmer LS55, Waltham, MA, USA) spectrophotometer equipped with a xenon lamp filtered at an excitation wavelength λ = 340 nm.
3.4. Photocatalytic Degradation Experiments
To explore the photocatalytic activity of the TiO2 NTs and the PbS NPs-TiO2 NTs heterojunction systems, photodegradation of a model organic pollutant “tetracycline (TC)” was carried out using a mercury-xenon lamp filtered at 153 at 365 nm (UV light source). The procedure is described as follows: the prepared samples were immersed in a 20 mL solution containing an appropriate concentration of TC. The photodegradation progress was evaluated using a Bio-UVmc2 spectrophotometer (Safas, Monaco, Monaco) working in the 200–800 nm wavelength range at ambient temperature (25 °C); the 156 TC maximum absorbance (peaking at 356 nm) was measured every 30 min until total degradation. Almost all experiments were conducted in three replicates at room temperature. The photodegradation of TC by TiO2 NTs and PbS NPs-TiO2 NTs heterojunction systems was determined by calculating the yield of dye degradation (W), using the formula:
W (%) = (1 − Ct/C0) * 100 %
The kinetics for photocatalytic degradation of TC were also investigated, and the obtained data were fitted by a pseudo-first-order kinetic equation:
where: C0 and Ct (mg/L) are the initial TC concentration prior to irradiation and the TC concentration at time t under UV irradiation, respectively; k (min−1) is the pseudo-first-order rate constant.
ln (C0/Ct) = kt
4. Conclusions
First, we demonstrated the efficiency of SILAR as a technique that can associate PbS NPs with TiO2 NTs and realize {PbS NPs} n—TiO2 NTs heterostructures that can be used for the degradation of pharmaceutical products. We showed that the quality of the deposit, the structure, the crystalline size, and the optical properties of the systems {NPs PbS} n—NTs TiO2 depend on the number of SILAR cycles; the size of the deposited PbS NPs increases from 8 to 14 nm as the number of SILAR cycles increases from 5 to 8. The performance of the prepared photocatalysts—like {PbS NPs} n—TiO2 NTs heterostructures was tested for the degradation of tetracycline (TC) under UV light at room temperature. We found that the {PbS NPs} n—TiO2 NTs heterostructure system is efficient for the photocatalytic degradation of 488 of TC, with an optimum degradation for a SILAR cycle number equal to 5. In a second step, we studied in depth the effect of introducing pure TiO2 NTs in an aqueous solution of TC under UV light. After optimizing the experimental conditions, we achieved a photodegradation of about 99% of TC after 5 h of irradiation. The combination of UV-Vis spectroscopy, HPLC analysis, and scavenging studies provides comprehensive evidence for actual photocatalytic degradation rather than simple adsorption processes. Furthermore, we showed that the photocatalyst is stable and could be used successfully for at least five successive cycles without any noticeable loss in performance. This shows that a reuse of the TiO2 NTs is possible for the photocatalytic degradation of TC. These results suggest that the TiO2 NTs photocatalyst is indeed an effective and promising material for water purification and pollution control. Finally, based on the results of trapping tests, a possible photodegradation mechanism was proposed.
Author Contributions
All authors contributed to the study’s conception and design. Conceptualization, S.J., A.H., and M.B.R.; methodology, S.J. and S.S.; software, A.H.; validation, B.B., S.S., and B.M.S.; formal analysis, A.H., and B.B.; investigation, M.A.A. and K.C.; resources, S.S. and M.B.R.; data curation, S.J. and A.H.; writing—original draft preparation, S.J. and B.B.; writing—review and editing, B.B., M.A.A., M.B.R. and B.M.S.; visualization, A.H.; supervision, M.B.R., B.M.S., and A.H.; project administration, K.C.; funding acquisition, K.C. All authors have read and agreed to the published version of the manuscript.
Funding
This work was supported and funded by the Deanship of Scientific Research at Imam Mohammad Ibn Saud Islamic University (IMSIU) (grant number IMSIU-DDRSP2502).
Institutional Review Board Statement
Not applicable.
Informed Consent Statement
Not applicable.
Data Availability Statement
The original contributions presented in the study are included in the article, further inquiries can be directed to the corresponding author.
Conflicts of Interest
The authors declare no conflicts of interest.
References
- Syed, N.; Huang, J.; Feng, Y.; Wang, X.; Cao, L. Carbon-Based Nanomaterials via Heterojunction Serving as Photocatalyst. Front. Chem. 2019, 7, 713. [Google Scholar] [CrossRef]
- Kundu, S.; Satpati, B.; Kar, T.; Pradhan, S.K. Microstructure characterization of hydrothermally synthesized PANI/V2O5·nH2O heterojunction photocatalyst for visible light induced photodegradation of organic pollutants and non absorbing colorless molecules. J. Hazard. Mater. 2017, 339, 161–173. [Google Scholar] [CrossRef]
- Siva, N.; Sakthi, D.; Ragupathy, S.; Arun, V.; Kannadasan, N. Synthesis, structural, optical and photocatalytic behavior of Sn doped ZnO nanoparticles. Mater. Sci. Eng. B 2020, 253, 114497. [Google Scholar] [CrossRef]
- Hernández-Oloño, J.T.; Infantes-Molina, A.; Vargas-Hernández, D.; Domínguez-Talamantes, D.G.; Rodríguez-Castellón, E.; Herrera-Urbina, J.R.; Tánori-Córdova, J.C. A novel heterogeneous photo-Fenton Fe/Al2O3 catalyst for dye degradation. J. Photochem. Photobiol. A 2021, 421, 113529. [Google Scholar] [CrossRef]
- Taheri-Ledari, R.; Valadi, K.; Gharibi, S.; Maleki, A. Synergistic photocatalytic effect between green LED light and Fe3O4/ZnO-modified natural pumice: A novel cleaner product for degradation of methylene blue. Mater. Res. Bull. 2020, 130, 110946. [Google Scholar] [CrossRef]
- Bhuvaneswari, K.; Nguyen, B.-S.; Nguyen, V.-H.; Nguyen, V.-Q.; Nguyen, Q.-H.; Palanisamy, G.; Sivashanmugan, K.; Pazhanivel, T. Enhanced photocatalytic activity of ethylenediamine-assisted tin oxide (SnO2) nanorods for methylene blue dye degradation. Mater. Lett. 2020, 276, 128173. [Google Scholar] [CrossRef]
- Su, Z.; Zhang, L.; Jiang, F.; Hong, M. Formation of crystalline TiO2 by anodic oxidation of titanium. Prog. Nat. Sci. Mater. Int. 2013, 23, 294–301. [Google Scholar] [CrossRef]
- Chen, B.; Hou, J.; Lu, K. Formation mechanism of TiO2 nanotubes and their applications in photoelectrochemical water splitting and supercapacitors. Langmuir 2013, 29, 5911–5919. [Google Scholar] [CrossRef] [PubMed]
- Lai, C.W.; Sreekantan, S. Preparation of hybrid WO3-TiO2 nanotube photoelectrodes using anodization and wet impregnation: Improved water-splitting hydrogen generation performance. Int. J. Hydrogen Energy 2013, 38, 2156–2166. [Google Scholar] [CrossRef]
- Zhu, X.D.; Wang, Y.J.; Sun, R.J.; Zhou, D.M. Photocatalytic degradation of tetracycline in aqueous solution by nanosized TiO2. Chemosphere 2013, 92, 925–932. [Google Scholar] [CrossRef]
- Safari, G.H.; Hoseini, M.; Seyedsalehi, M.; Kamani, H.; Jaafari, J.; Mahvi, A.H. Photocatalytic degradation of tetracycline using nanosized titanium dioxide in aqueous solution. Int. J. Environ. Sci. Technol. 2015, 12, 603–616. [Google Scholar] [CrossRef]
- Elmolla, E.S.; Chaudhuri, M. Photocatalytic degradation of amoxicillin, ampicillin and cloxacillin antibiotics in aqueous solution using UV/TiO2 and UV/H2O2/TiO2 photocatalysis. Desalination 2010, 252, 46–52. [Google Scholar] [CrossRef]
- Reyes, C.; Fernández, J.; Freer, J.; Mondaca, M.; Zaror, C.; Malato, S.; Mansilla, H. Degradation and inactivation of tetracycline by TiO2 photocatalysis. J. Photochem. Photobiol. A 2006, 184, 141–146. [Google Scholar] [CrossRef]
- Palominos, R.; Mondaca, M.A.; Giraldo, A.; Peñuela, G.; Pérez-Moya, M.; Mansilla, H.D. Photocatalytic oxidation of the antibiotic tetracycline on TiO2 and ZnO suspensions. Catal. Today 2009, 144, 100–105. [Google Scholar] [CrossRef]
- Wu, Z.; Wang, Y.; Sun, L.; Mao, Y.; Lin, C. An ultrasound-assisted deposition of NiO nanoparticles on TiO2 nanotube arrays for enhanced photocatalytic activity. J. Mater. Chem. A 2014, 2, 8223–8229. [Google Scholar] [CrossRef]
- Li, D.; Dong, Y.; Yang, F.; Ding, Y.; Lv, K.; Wang, C.; Huang, J. Activation of periodate by CNT for selective catalytic oxidation: The overlooked significant role of residual metal species as catalytic sites. Sep. Purif. Technol. 2025, 357, 130037. [Google Scholar] [CrossRef]
- Ye, M.; Gong, J.; Lai, Y.; Lin, C.; Lin, Z. High-efficiency photoelectrocatalytic hydrogen generation enabled by palladium quantum dots-sensitized TiO2 nanotube arrays. J. Am. Chem. Soc. 2012, 134, 15720–15723. [Google Scholar] [CrossRef]
- Zhang, X.; Wang, F.; Huang, H.; Li, H.; Han, X.; Liu, Y.; Kang, Z. Carbon quantum dot sensitized TiO2 nanotube arrays for photoelectrochemical hydrogen generation under visible light. Nanoscale 2013, 5, 2274–2278. [Google Scholar] [CrossRef]
- Chen, S.; Paulose, M.; Ruan, C.; Mor, G.K.; Varghese, O.K.; Kouzoudis, D.; Grimes, C.A. Electrochemically synthesized CdS nanoparticle-modified TiO2 nanotube-array photoelectrodes: Preparation, characterization, and application to photoelectrochemical cells. J. Photochem. Photobiol. A 2006, 177, 177–184. [Google Scholar] [CrossRef]
- Mahshid, S.; Li, C.; Mahshid, S.S.; Askari, M.; Dolati, A.; Yang, L.; Luo, S.; Cai, Q. Sensitive determination of dopamine in the presence of uric acid and ascorbic acid using TiO2 nanotubes modified with Pd, Pt and Au nanoparticles. Analyst 2011, 136, 2322–2329. [Google Scholar] [CrossRef] [PubMed]
- Nguyen, N.T.; Altomare, M.; Yoo, J.E.; Taccardi, N.; Schmuki, P. Noble metals on anodic TiO2 nanotube mouths: Thermal dewetting of minimal Pt Co-catalyst loading leads to significantly enhanced photocatalytic H2 generation. Adv. Energy Mater. 2016, 6, 1501926. [Google Scholar] [CrossRef]
- Nguyen, N.T.; Altomare, M.; Yoo, J.E.; Schmuki, P. Efficient photocatalytic H2 evolution: Controlled dewetting dealloying to fabricate site-selective high-activity nanoporous Au particles on highly ordered TiO2 nanotube arrays. Adv. Mater. 2015, 27, 3208–3215. [Google Scholar] [CrossRef]
- Qin, Y.-H.; Yang, H.-H.; Lv, R.-L.; Wang, W.-G.; Wang, C.-W. TiO2 nanotube arrays supported Pd nanoparticles for ethanol electrooxidation in alkaline media. Electrochim. Acta 2013, 106, 372–377. [Google Scholar] [CrossRef]
- Li, H.; Xing, J.; Xia, Z.; Chen, J. Preparation of extremely smooth and boron-fluorine co-doped TiO2 nanotube arrays with enhanced photoelectrochemical and photocatalytic performance. Electrochim. Acta 2014, 139, 331–336. [Google Scholar] [CrossRef]
- Lai, Y.-K.; Huang, J.-Y.; Zhang, H.-F.; Subramaniam, V.-P.; Tang, Y.-X.; Gong, D.-G.; Sundar, L.; Sun, L.; Chen, Z.; Lin, C.-J. Nitrogen-doped TiO2 nanotube array films with enhanced photocatalytic activity under various light sources. J. Hazard. Mater. 2010, 184, 855–863. [Google Scholar] [CrossRef] [PubMed]
- Ramanathan, R.; Bansal, V. Ionic liquid mediated synthesis of nitrogen, carbon and fluorine-codoped rutile TiO2 nanorods for improved UV and visible light photocatalysis. RSC Adv. 2015, 5, 1424–1429. [Google Scholar] [CrossRef]
- Yang, H.; Fan, W.; Vaneski, A.; Susha, A.S.; Teoh, W.Y.; Rogach, A.L. Heterojunction engineering of CdTe and CdSe quantum dots on TiO2 nanotube arrays: Intricate effects of size-dependency and interfacial contact on photoconversion efficiencies. Adv. Funct. Mater. 2012, 22, 2821–2829. [Google Scholar] [CrossRef]
- Cai, F.; Yang, F.; Zhang, Y.; Ke, C.; Cheng, C.; Zhao, Y.; Yan, G. PbS sensitized TiO2 nanotube arrays with different sizes and filling degrees for enhancing photoelectrochemical properties. Phys. Chem. Chem. Phys. 2014, 16, 23967–23974. [Google Scholar] [CrossRef]
- Ge, M.; Cao, C.; Li, S.; Zhang, S.; Deng, S.; Huang, J.; Li, Q.; Zhang, K.; Al-Deyab, S.S.; Lai, Y. Enhanced photocatalytic performances of n-TiO2 nanotubes by uniform creation of p-n heterojunctions with p-Bi2O3 quantum dots. Nanoscale 2015, 7, 11552–11560. [Google Scholar] [CrossRef]
- Yu, X.; Zhang, J.; Zhao, Z.; Guo, W.; Qiu, J.; Mou, X.; Li, A.; Claverie, J.P.; Liu, H. NiO-TiO2 p-n heterostructured nanocables bridged by zero-bandgap rGO for highly efficient photocatalytic water splitting. Nano Energy 2015, 16, 207–217. [Google Scholar] [CrossRef]
- Kang, Q.; Liu, S.; Yang, L.; Cai, Q.; Grimes, C.A. Fabrication of PbS nanoparticle-sensitized TiO2 nanotube arrays and their photoelectrochemical properties. ACS Appl. Mater. Interfaces 2011, 3, 746–749. [Google Scholar] [CrossRef]
- Wang, D.; Zhao, H.; Wu, N.; El Khakani, M.A.; Ma, D. Tuning the charge-transfer property of PbS-quantum Dot/TiO2-nanobelt nanohybrids via quantum confinement. J. Phys. Chem. Lett. 2010, 1, 1030–1035. [Google Scholar] [CrossRef]
- Palma, T.L.; Vieira, B.; Nunes, J.; Lourenço, J.P.; Monteiro, O.C.; Costa, M.C. Photodegradation of chloramphenicol and paracetamol using PbS/TiO2 nanocomposites produced by green synthesis. J. Iran. Chem. Soc. 2020, 17, 2013–2031. [Google Scholar] [CrossRef]
- Hou, J.; Yang, Y.; Zhou, J.; Wang, Y.; Xu, T.; Wang, Q. Flexible CdS and PbS nanoparticles sensitized TiO2 nanotube arrays lead to significantly enhanced photocatalytic performance. Ceram. Int. 2020, 46, 28785–28791. [Google Scholar] [CrossRef]
- Ali, I.; Muhyuddin, M.; Mullani, N.; Kim, D.W.; Basit, M.A.; Park, T.J. Modernized H2S-treatment of TiO2 nanoparticles: Improving quantum-dot deposition for enhanced photocatalytic performance. Curr. Appl. Phys. 2020, 20, 384–390. [Google Scholar] [CrossRef]
- Zhu, Y.; Wang, R.; Zhang, W.; Ge, H.; Li, L. CdS and PbS nanoparticles co-sensitized TiO2 nanotube arrays and their enhanced photoelectrochemical property. Appl. Surf. Sci. 2014, 315, 149–153. [Google Scholar] [CrossRef]
- Moreels, I.; Lambert, K.; Smeets, D.; Muynck, D.D.; Nollet, T.; Martins, J.C.; Vanhaecke, F.; Vantomme, A.; Delerue, C.; Allan, G.; et al. Size-dependent optical properties of colloidal PbS quantum dots. ACS Nano 2009, 3, 3023–3030. [Google Scholar] [CrossRef]
- Kim, D.; Kim, D.-H.; Lee, J.; Grossman, J.C. Impact of Stoichiometry on the Electronic Structure of PbS Quantum Dots. Phys. Rev. Lett. 2013, 110, 196802. [Google Scholar] [CrossRef]
- Rahulan, K.M.; Ganesan, S.; Aruna, P. Synthesis and optical limiting studies of Au-doped TiO2 nanoparticles. Adv. Nat. Sci. Nanosci. Nanotechnol. 2011, 2, 025012. [Google Scholar] [CrossRef]
- Kubelka, P. An Article on Optics of Paint Layers. Z. Tech. Phys. 1931, 12, 593–609. [Google Scholar]
- Dimitrakopoulou, D.; Rethemiotaki, I.; Frontistis, Z.; Xekoukoulotakis, N.P.; Venieri, D.; Mantzavinos, D. Degradation, mineralization and antibiotic inactivation of amoxicillin by UV-A/TiO2 photocatalysis. J. Environ. Manag. 2012, 98, 168–174. [Google Scholar] [CrossRef] [PubMed]
- Mohammadi, R.; Massoumi, B.; Rabani, M. Photocatalytic Decomposition of Amoxicillin Trihydrate Antibiotic in Aqueous Solutions under UV Irradiation Using Sn/TiO2 Nanoparticles. Int. J. Photoenergy 2012, 2012, 514856. [Google Scholar] [CrossRef]
- Hajjaji, A.; Jemai, S.; Rebhi, A.; Trabelsi, K.; Gaidi, M.; Alhazaa, A.; Al-Gawati, M.; El Khakani, M.; Bessais, B. Enhancement of photocatalytic and photoelectrochemical properties of TiO2 nanotubes sensitized by SILAR-deposited PbS nanoparticles. J. Mater. 2020, 6, 62–69. [Google Scholar] [CrossRef]


Disclaimer/Publisher’s Note: The statements, opinions and data contained in all publications are solely those of the individual author(s) and contributor(s) and not of MDPI and/or the editor(s). MDPI and/or the editor(s) disclaim responsibility for any injury to people or property resulting from any ideas, methods, instructions or products referred to in the content. |
© 2025 by the authors. Licensee MDPI, Basel, Switzerland. This article is an open access article distributed under the terms and conditions of the Creative Commons Attribution (CC BY) license (https://creativecommons.org/licenses/by/4.0/).