Article

Comparison of Photocatalytic Activity: Impact of Hydrophilic Properties on TiO2 and ZrO2 Thin Films

by
Yuliana de Jesús Acosta-Silva
1,*,
Misael Ian Lugo-Arredondo
2,
Salvador Gallardo-Hernández
3,
Juan Fernando Garcia-Trejo
4,
Yasuhiro Matsumoto
5,
Sandra Rivas
1,
Ana Angélica Feregrino-Pérez
4,
Luis A. Godínez
6 and
Arturo Méndez-López
1,*
1
Cuerpo Académico de Nanotecnología y su Aplicación, Facultad de Ingeniería, Universidad Autónoma de Querétaro, Centro Universitario, Santiago de Querétaro 76010, QRO, Mexico
2
Facultad de Ingeniería, Universidad Autónoma de Querétaro, Centro Universitario, Santiago de Querétaro 76010, QRO, Mexico
3
Departamento de Física, Centro de Investigación y de Estudios Avanzados del Instituto Politécnico Nacional, Av. IPN 2508, Ciudad de México 07360, Mexico
4
Cuerpo Académico de Bioingeniería Básica y Aplicada, Facultad de Ingeniería, Universidad Autónoma de Querétaro, Cerro de las Campanas s/n, Las Campanas, Querétaro 76010, Mexico
5
Departamento de Ingeniería Eléctrica (SEES), CINVESTAV-IPN, Avenida IPN No 2508, Mexico City 07360, Mexico
6
Centro de Investigación en Química para la Economía Circular, CIQEC, Facultad de Química, Universidad Autónoma de Querétaro, Centro Universitario, Querétaro 76010, Mexico
*
Authors to whom correspondence should be addressed.
Inorganics 2024, 12(12), 320; https://doi.org/10.3390/inorganics12120320
Submission received: 24 October 2024 / Revised: 27 November 2024 / Accepted: 5 December 2024 / Published: 10 December 2024
(This article belongs to the Special Issue Nanocomposites for Photocatalysis, 2nd Edition)

Abstract

:
Thin films (TFs) of TiO2 and ZrO2 were prepared and characterized to evaluate their structural and optical (SO) properties and, later, to test their efficiency for the photocatalytic degradation (PD) of methylene blue (MB) in aqueous solution. The X-ray diffraction patterns showed that the TiO2 TFs had an anatase crystalline structure, unlike the ZrO2 TFs, which showed a tetragonal crystalline structure that was verified by Raman spectroscopy. The band gap (BG) energies, as calculated from UV-Vis spectroscopy and diffuse reflectance spectroscopy, corresponded to 3.2 and 3.7 eV for the TiO2 and ZrO2 TFs, respectively. SEM examination of the obtained materials was also carried out to assess the surface morphology and topography. The comparative study of the FTIR spectra of the TiO2 and ZrO2 TFs successfully confirmed the composition of the two-metal oxide TFs. The electrical properties of the films were studied by conductivity measurements. The two films also showed a similar thickness of about 200 nm and a substantially different photocatalytic performance for the discoloration of MB in aqueous solution. The corresponding rate constants, as obtained from a pseudo-first-order kinetic model, revealed that TiO2 films promote color removal of the model dye solution almost 20 times faster than the rate observed for ZrO2 modified glass substrates. We suggest that this difference may be related to the hydrophilic character of the two films under study, which may affect the charge carrier injection process and, therefore, the overall photocatalytic performance.

1. Introduction

The escalating global population and the corresponding surge in energy and water demands from various industries, such as petrochemicals, pharmaceuticals, textiles, agrochemicals, fuels, and plastics, have resulted in a significant environmental challenge [1,2,3,4]. This situation is even more complicated when the widespread contamination of water sources is considered, jeopardizing both wildlife and human health and disrupting fragile ecosystems [5]. Addressing this problem entails ensuring universal access to safe drinking water, a goal advocated by organizations such as the Organization for Economic Co-operation and Development (OECD), which stresses the importance of coordinated government efforts to manage water resources effectively [6]. Over recent decades, several remediation techniques have emerged, encompassing physical, chemical, and biological approaches [7]. Notably, metal oxides exhibit multifunctionality as both absorbents and antimicrobial agents, while semiconductors offer potential for environmental regulation and contaminant mitigation due to their light absorption properties, variable oxidation states and large surface areas [8]. Moreover, the application potential of nanocomposite configurations, combining several unit components with various chemical and physical characteristics, has garnered significant interest in research groups [9,10,11,12]. The formation of nanocomposite materials and the examination of their physical characteristics have been the subject of numerous investigations, showing their adaptability in a range of industries, including photocatalysis, fuel cells, optoelectronics, microelectromechanical systems, and sensors [13,14,15,16,17].
Titanium dioxide (TiO2), a semiconductor known for its chemical stability and low cost, has received a great deal of attention from academic and technological circles due to its wide-ranging applications in various fields [18]. Of particular interest are its different crystalline forms, including anatase (A) and rutile (R), each characterized by unique atomic structures and properties [19]. While anatase TiO2 displays an indirect BG, the rutile phase predominantly exhibits direct optical processes [20,21]. Typically, the optical absorption edge of TiO2 is observed around 400 nm, although exact values may vary based on factors such as sample morphology and measurement conditions [22]. It is worth noting, however, that TiO2 polymorphs can undergo phase transitions under specific experimental conditions, with the permanent conversion of anatase to rutile taking place at temperatures that exceed 850 K [23]. Despite these complexities, both anatase and rutile TiO2 have been pivotal in numerous successful applications, spanning from photo-driven processes to environmental sensing and energy storage [24,25,26,27,28]. Moreover, the SO characteristics of TiO2 significantly influence its performance across a range of uses, for instance, for dye-sensitized solar cells, where the existence of rutile TiO2 enhances photocurrent and electron generation or compensates for variations in photo-electrode areas [29,30,31]. Therefore, further advancements in TiO2-based technologies hinge upon a thorough understanding and precise characterization of the properties and behavior of its polymorphs [32,33].
Zirconia (ZrO2), on the other hand, is a versatile material renowned for its wide BG (ranging from 3 to 5.2 eV) [34,35]. It boasts exceptional stability across chemical, electrical, and thermal domains, and it is highly coveted in various fields, including biomedical, sensing, and catalysis [36,37,38]. Moreover, its tunable conductivity and high refractive index make it valuable for emerging technologies [39]. ZrO2 has been synthesized using diverse techniques, with both vacuum and solution processing playing crucial roles [40,41]. Tailoring the properties of ZrO2 TFs involves meticulous consideration of factors such as crystallinity and post-deposition heat treatment [42,43]. These variables affect mechanical strength, ionic conductivity, and dielectric characteristics [44]. The material’s polymorphic phases—monoclinic, tetragonal, and cubic—exhibit distinct characteristics, with their stability being influenced by synthesis temperatures [37,45,46]. Tetragonal and cubic phases, while less stable at room temperature (RT), offer unique advantages for various applications [47,48]. For instance, tetragonal ZrO2 shows promise in reinforcing materials and increasing fracture toughness [49]. TFs of ZrO2 find extensive utility in optical storage elements, lasers, and anti-corrosion coatings [50,51]. Furthermore, ZrO2 displays photocatalytic properties, albeit with limited solar light absorption because of its broad BG [52]. Notably, the choice of calcination temperatures significantly influences the crystal phases and, consequently, the material’s performance in various applications [53,54].
To manufacture TiO2 and ZrO2 TFs, a variety of deposition processes have been used, such as pulsed laser deposition [55,56], atomic layer deposition [57,58], chemical vapor deposition (CVD) [39,59] and sol–gel [60,61]. Compared to alternative surface modification methods, the sol–gel method offers several benefits, including (i) easy processing and application at lower temperatures, (ii) flexibility in the substrate’s shape and kind, and (iii) the ability to synthesize high-purity films that are both chemically and physically uniform at small and large scales [62]. Additional benefits of this approach include high purity and great chemical homogeneity, as well as precise control over composition and microstructure. The wet approach (sol–gel), in contrast to traditional synthesis procedures, allows the material to form nanocrystals and nanopores. Utilizing wet synthesis techniques in conjunction with appropriate heat treatment, and dip-coating (DC) deposition, enables the customization of TFs with a precise and repeatable thickness and microstructure. Controlling these attributes is not simple, though, as a variety of factors can alter the TF’s characteristics, many of which are reliant on the sol’s synthesis and the thermal treatments applied after deposition.
In this context, this work’s primary objective is to compare photocatalytic activity, where the importance of hydrophilicity in the different thin films is demonstrated. In addition, the optical and structural characteristics are compared and evaluated. Since DC is a low-cost and frequently employed TF deposition technique, particularly on large-area glass substrates where thickness homogeneity is crucial, it was selected as the deposition method.

2. Results and Discussion

2.1. X-Ray Diffraction

Figure 1 shows the X-ray diffractograms (in the 2θ range 20–80°) of the TiO2 and ZrO2 TFs that were calcined at 500 °C. While the diffraction peaks observed for the TiO2 films correspond to the anatase phases (see Figure 1a), Figure 1b reveals that the ZrO2 films are characterized by a tetragonal phase (TP) (in both images, the corresponding diffraction planes have been added in parenthesis). Inspection of Figure 1a shows that the main diffraction peaks of the TiO2 TFs are located at 2θ values of 25.24°, 37.81°, 48.08°, 53.89°, 55.15°, 62.22°, and 62.80°, which correspond to the (1 0 1), (0 0 4), (2 0 0), (1 0 5), (2 1 1), (2 1 3), and (2 0 4) planes of anatase TiO2 (JCPDS No. 21–1272) [63]. Figure 1b, on the other hand, shows that the diffraction peaks of the ZrO2 TFs are positioned at 30.27°, 35.24°, 50.38°, 50.75°, 60.23°, and 63.01°, which can be indexed to the (0 1 1), (1 1 0), (1 1 2), (0 2 0), (1 2 1), and (2 0 2) planes of tetragonal ZrO2 (JCPDS No. 10-5089) [64]. In Figure 1a,b, it is possible to see that there are overlapped signals that make the identification of planes a relatively difficult task. See, for example, the insets that show the overlapping of the (213) and (204) planes for TiO2 and the (112) and (020) planes for ZrO2. Recently, Wang et al. obtained similar results using both hydrothermal and solvothermal methods to synthesize uniform ZrO2 nanoparticles [64].
In the following stage of the characterization study, the average grain sizes were determined using Scherrer’s formula [65]. The crystallite size was calculated using the FWHM value of the highest peak. The typical crystallite sizes determined by the TiO2 and ZrO2 TFs corresponded to 16, and 41 nm, respectively, at 500 °C. This finding showed that as the annealing temperature was raised, the nanocrystals’ grain sizes grew.

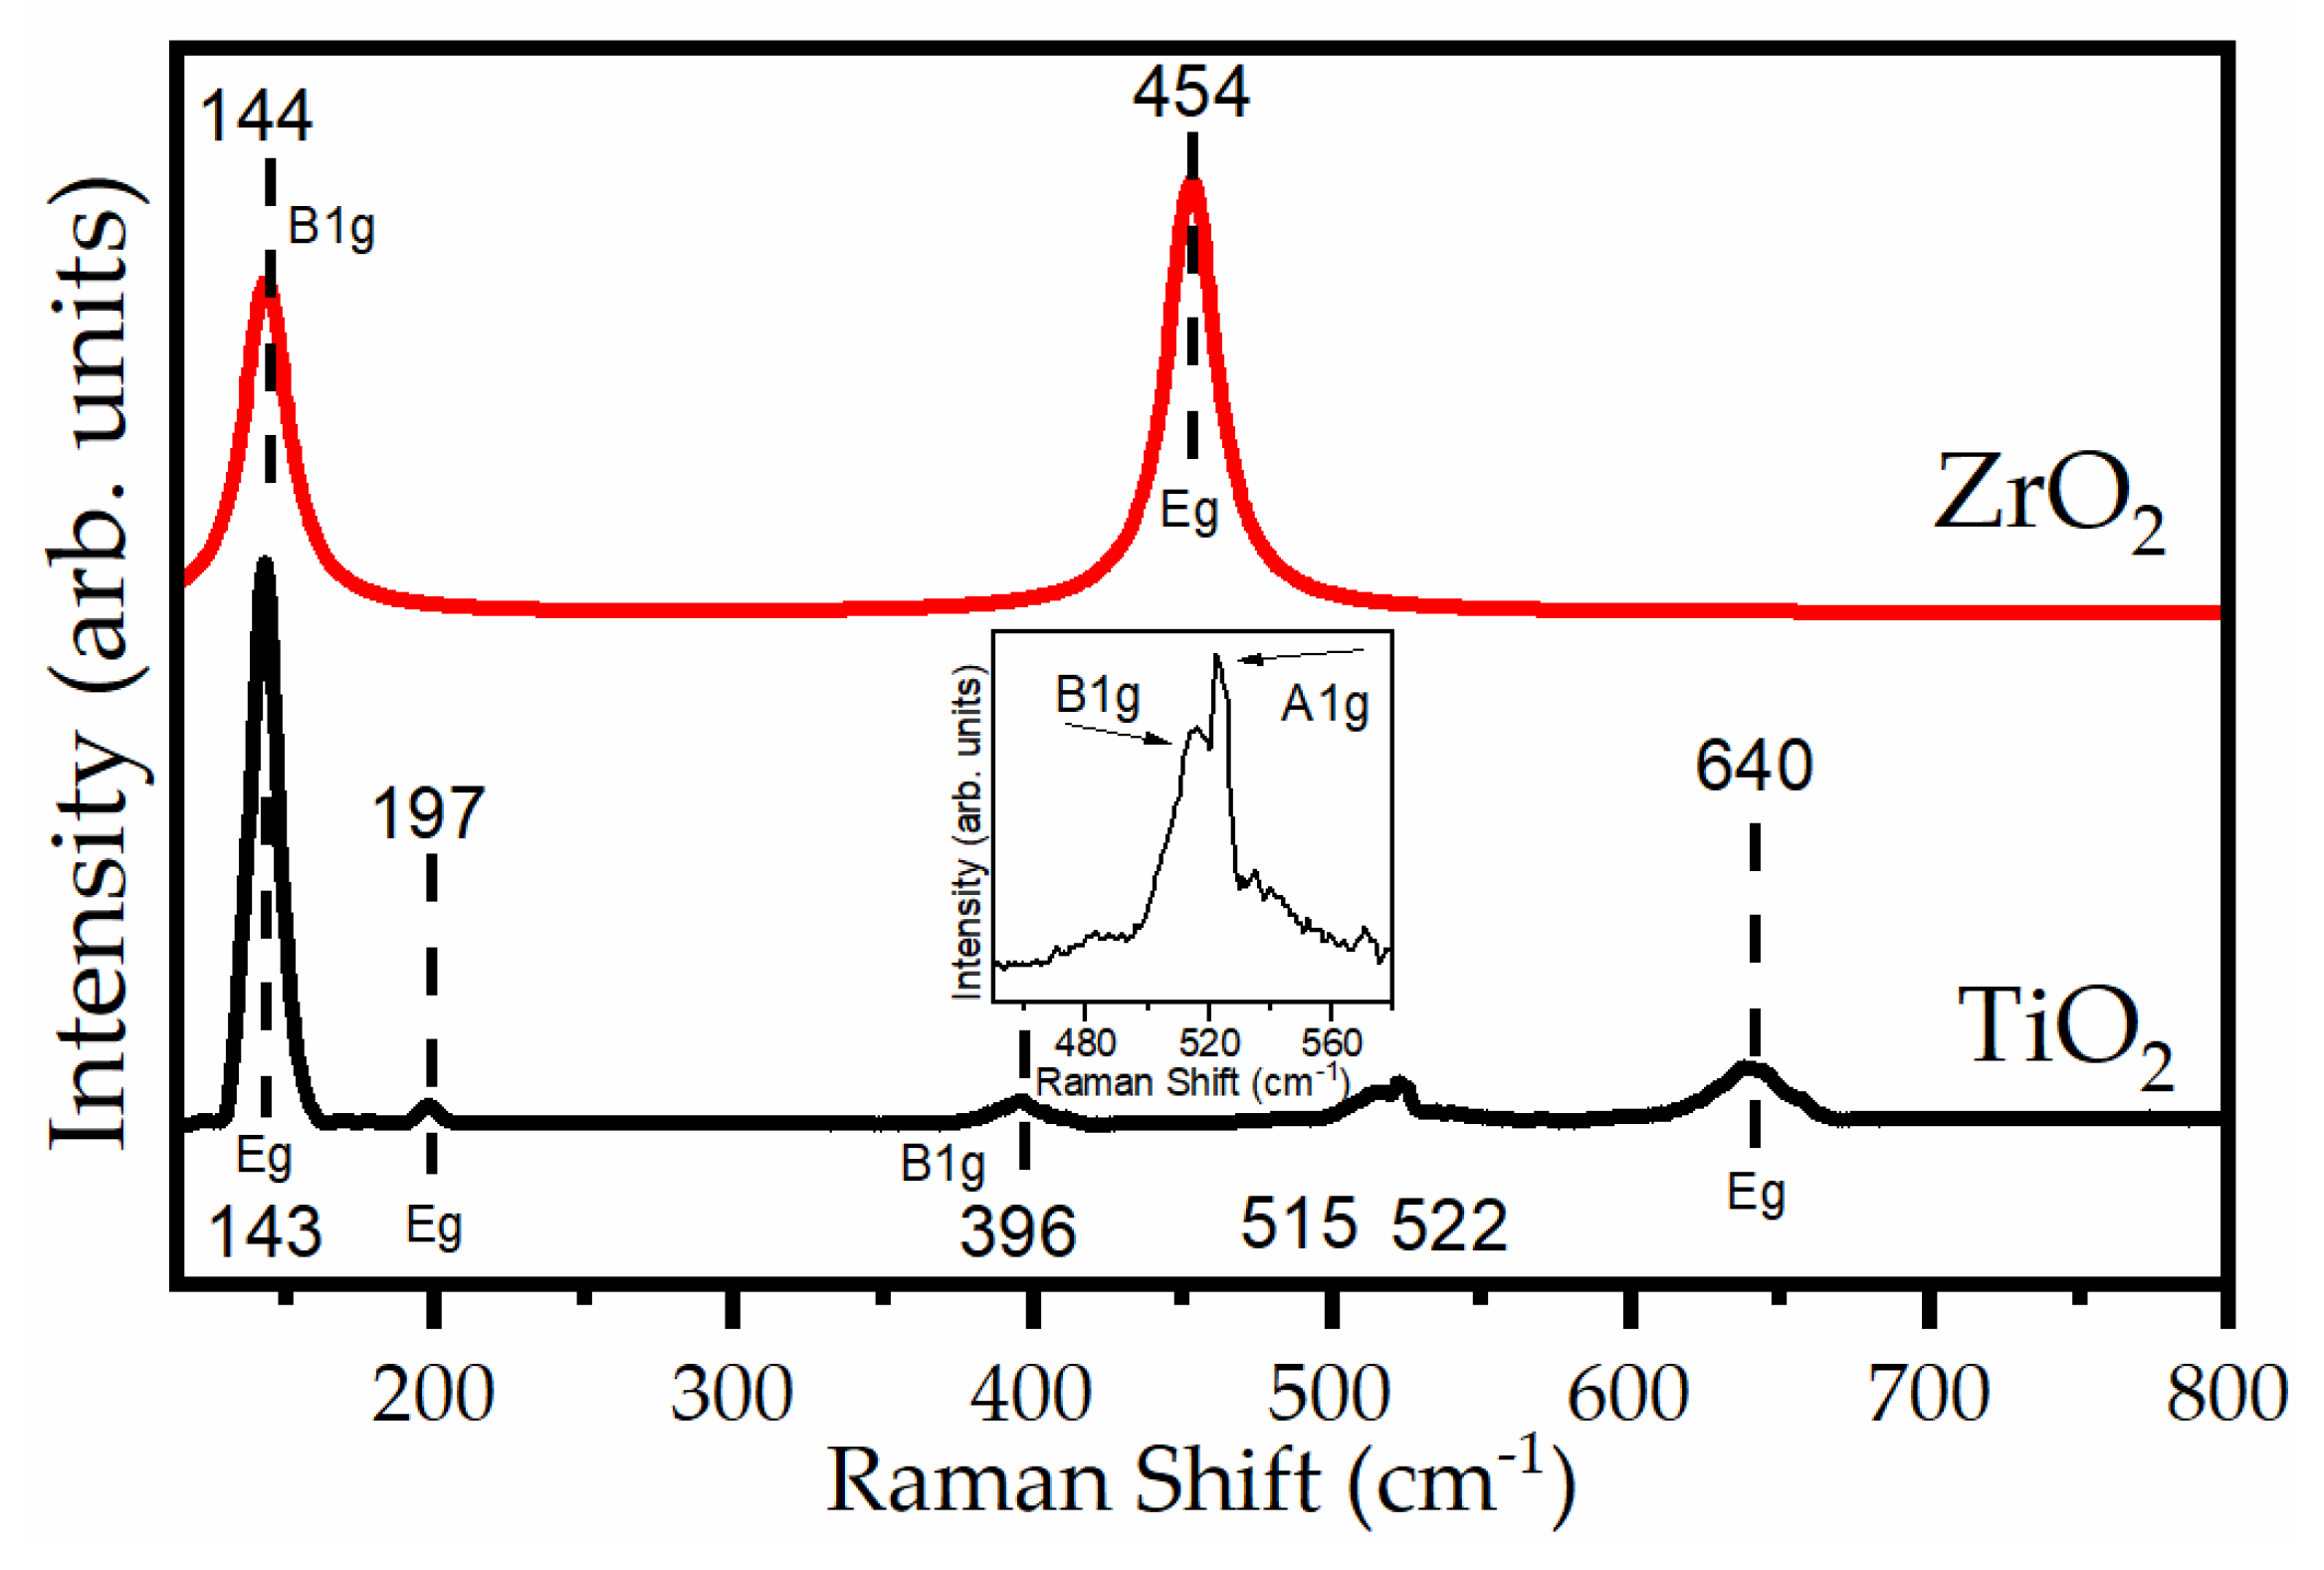
2.2. Raman Spectroscopy

Since the XRD reflection peaks of the TFs under study may overlap with each other, Raman spectroscopy was employed to further investigate the structure of the TiO2 and ZrO2 modified surfaces. As expected, the DC deposited TiO2 TFs showed the anatase phase. As can be observed in Figure 2, six Raman active modes are seen in the anatase phase, with a high signal peak at 143 cm−1 and low intensity peaks at 197, 396, 515, 522, and 640 cm−1. Only one band is visible in our experiment, and the bands at 515 and 522 cm−1 overlap. However, an enlargement of Figure 2 was carried out in order to visualize the two signals. No signals of the rutile or brookite phase were present, which means that the pure anatase phase was obtained. Also, we were able to identify the two materials’ vibrational modes in Figure 2 by comparing their spectra for anatase and the TP [66,67]. Specifically, the Raman peaks were due to the vibrational signatures of the tetragonal ZrO2, being made abundantly evident by the existence of the 144 cm−1 and 454 cm−1 resonance, which was allocated to TP. No other bands were detected [68]. When compared to ZrO2 TFs, the TiO2 spectra exhibit stronger intensity.

2.3. Scanning Electron Microscopy (SEM)

To examine the surface morphologies of the samples under study, SEM measurements were carried out. Figure 3a,d show SEM images taken at 5 k magnification for TiO2 and ZrO2 TFs coated on glass substrates. The top aspect of a columnar growth resembles the surface structure of TFs obtained by sputtering at RT [69]. Figure 3b, showing an SEM image of TiO2 nanocrystals, clearly reveals their spherical shape with very little aggregation. Prucnal et al. reported similar SEM images for TiO2 films [70]. Figure 3d, on the other hand, shows that ZrO2 TFs have an excellent uniform aggregation. The films appear free of microcracks and defects, and they are homogeneous. Figure 3e shows a representative image of ZrO2 TFs, which are dense, highly homogeneous, and have a surface with no imperfections. Additionally, it was noted that all the crystals were in the nanoscale range. Figure 3c,f show the cross-section SEM images of TiO2 and ZrO2 TFs, respectively. The thickness of the samples is 352 and 365 nm. A very similar thickness was obtained by Mansilla for ZrO2 TFs obtained by the sol–gel method [71].

2.4. UV-Vis Analysis

The absorbance, reflectance, and (αhv)n vs. (hν) spectra of titanium oxide (TiO2) and zirconium oxide (ZrO2) TFs that were annealed at 500 °C in the 300–1000 nm wavelength range are shown in Figure 4a–c for TiO2 and in Figure 4c–e for ZrO2 TFs. An inspection of Figure 4a,d reveals that the absorbance spectrum can be separated in two distinct regions: The first region is characterized by a high absorption (λ < 385 nm), which is brought on by the light’s fundamental absorption in TFs of TiO2 and ZrO2, reflecting the electronic transition of the two materials’ valence and conduction bands. In the visible range (400–800 nm), there is a second significant absorbance zone where the value is low. These materials can be helpful for optical coating applications such as UV-protecting films for optoelectronic devices, anti-reflective films, and wavelength-selective films due to their exceptional optical absorbance.
Plotting a curve of (αhv)n vs. (hν) yields the optical BG energy of TiO2 and ZrO2 TFs, as illustrated in Figure 4b and Figure 4e, respectively. The corresponding BG energies were calculated using Tauc’s equation:
( α h v ) n = A h v E g
where h v is the photon energy, α is the absorption coefficient, A is a constant, E g is the optical BG energy, and n varies according to the kind of optical transition (direct or indirect) taking place. This absorption coefficient ( α ) might be calculated using the following equation:
α = 1 d ln 1 T
where d represents the sample’s thickness. In this way, the TiO2 indirect optical transition corresponds to n = 1/2 [72]. Plots of (αhv)1/2 vs. (hv) are shown in Figure 4b, where E g is determined by intercepting the photon energy axis and the linear part of the basic absorption edge. The obtained BG energy for TiO2 was 3.49 eV. Khetta et al. deposited TiO2 TFs by the ultrasonic spray process and obtained a BG of 3.47 eV, a value that agrees well with our results [73]. For ZrO2 TFs, a plot of (αhv)2 versus photon energy () and projection of the linear portion of the curve to the energy axis, yielded the ( n = 2) direct transition [74] E g values that can be observed in the inset of Figure 4e. The ZrO2 TFs therefore have a BG of 4.17 eV. Nirun and Surasing obtained ZrO2 TFs deposited on glass, and the energy BG of the as-deposited film was approximately 4.17 eV [75]. These results are similar to those obtained in this work.
The diffuse reflectance spectral (DRS) study is a method for investigating a semiconductor’s optical characteristics. This characteristic is dependent on the BG, oxygen vacancies, impurity centers, and surface morphology. A material’s optical sensitivity can be described by a combination of assessing the BG and the relative locations of the valence and conduction bands [76]. The Kubelka–Munk (K-M) approach, which is predicated on the idea that the DRS may be converted into the appropriate absorption spectra, was used to estimate the optical BG of the TiO2 and ZrO2 TFs [77]:
F R = 1 R 2 2 R                      
where R is the diffuse reflectance and F R is the K-M absorption function. In Tauc’s technique, the energy-dependent absorption coefficient is substituted with the K-M function:
F R h v n = A h v E g  
Assuming the indirect transition for TiO2 (n = 1/2) and the direct transition for ZrO2 ( n = 2) TFs, it is possible to extrapolate the linear region of the plot of F R h v n vs. ( h v ) at F R h v n = 0 to obtain the corresponding BG energy ( E g ) [78] (see Figure 4c,f). The obtained values for the BGs corresponded to 3.48 eV and 4.17 eV for TiO2 and ZrO2 TFs, respectively.

2.5. Photoluminescence (PL)

The rate of recombination of e-/h+ pairs was analyzed using photoluminescence (PL) spectra, in which electrons were excited using a laser source (325 nm wavelength). As can be observed in Figure 5, there is a clear photoluminescence peak positioned at 440 nm. This signal is most likely produced by oxygen vacancies (defects) related to trap-assisted recombination in TiO2. U. Chacon-Argaez et al., in their report on Photocatalytic Activity and Biocide Properties of Ag-TiO2 Composites on Cotton Fabrics, point out that the band at 441 nm is attributed to excitons resulting from vacancies and oxygen defects on the surface [79]. PL emission spectra of the TFs under study exhibited a broad emission peak around 534 nm. Nagaveni et al. reported one peak at about 530 nm which was attributed to energy gap conversion [80]. According to the PL and PL–excitation experiments reported by Pallotti et al., the green luminescence (500 to 550 nm) in anatase TiO2 is due to the radiative recombination of photogenerated conduction band electrons with self-trapped holes [81]. The type of point flaws in zirconia crystals determines their luminescence. Interstitial/vacancy zirconia and interstitial/vacancy oxygen are the causes of these problems. Deep defect level emission and near band edge emission can result from the defects’ creation of new energy levels in the BG area. According to these reports, the TP can stabilize as a result of increased oxygen vacancies in zirconia nanocrystals. Figure 5b displays the photoluminescence spectra of the samples under study with an excitation wavelength of 320 nm and a range of 350 to 600 nm. The ZrO2 TF sample exhibits a broad emission peak at 433 nm and emission peaks at 532 nm. The singly ionized oxygen vacancies in the zirconia nanocrystals are responsible for the near emission in the visible range at 433 nm. Prakashbabu et al. point out that the narrow band at 430 nm could originate from the (F-F)+ centers which are singly ionized oxygen vacancy defects [82]. Ashraf et al., on the other hand, show that in a shorter wavelength region, a shoulder near 433 nm was also observed and associated with a transition to singly ionized associated oxygen vacancy defects [83]. Because an electron occupies the oxygen vacancy in a photogenerated holes by radiative recombination, the green emission at 532 nm is known as a deep-level or trap-state emission. Gnanamoorthi et al. observed a green emission peak at ~535 nm, which is often attributed to the radiative recombination of photogenerated holes with electrons occupying the singly ionized oxygen vacancy [84].

2.6. Contact Angle Measurements

In order to assess the wettability of a solid surface, the contact angle is often measured using a liquid droplet placed on the surface. Surface wettability is determined by the surface’s excess energy and roughness. In this way, the relative molecular interaction strengths between vapor, liquid, and solid are reflected by the equilibrium contact angle. The wettability of the TiO2 and ZrO2 TFs was determined from the water contact angle values over a period of time, as shown in Figure 6. All angles were taken at different times from 0 to 180 s with an increment of 20 s. Then, one minute was allowed to elapse and the last reading was taken. The final contact angle values were 78° and 81.5° for TiO2 and ZrO2 TFs, respectively. From these data, TiO2 TFs showed a lower contact angle value than ZrO2 TFs, indicating that the surface of TiO2 TFs is characterized by a stronger hydrophilic character than ZrO2 TFs. In addition, it should be noted that water droplets spread out better over time on TiO2 TFs, indicating proper surface wetting [85]. Good surface wetting is a desired characteristic in self-cleaning surfaces in which the PD of organic contaminants takes place. In this context, Al-Shomar et al. carried out a study of Ellipsometric and ultrasonic titanium dioxide. They found a contact angle of 93° in their TiO2 TFs, a value which is similar to that obtained in this study [86]. In their experiment, Purcar et al. showed that the contact angle of water on coated glass surfaces covered with TiO2 films was 93 ± 2°, suggesting that the surface properties of the coatings can be classified as partially hydrophobic [87].

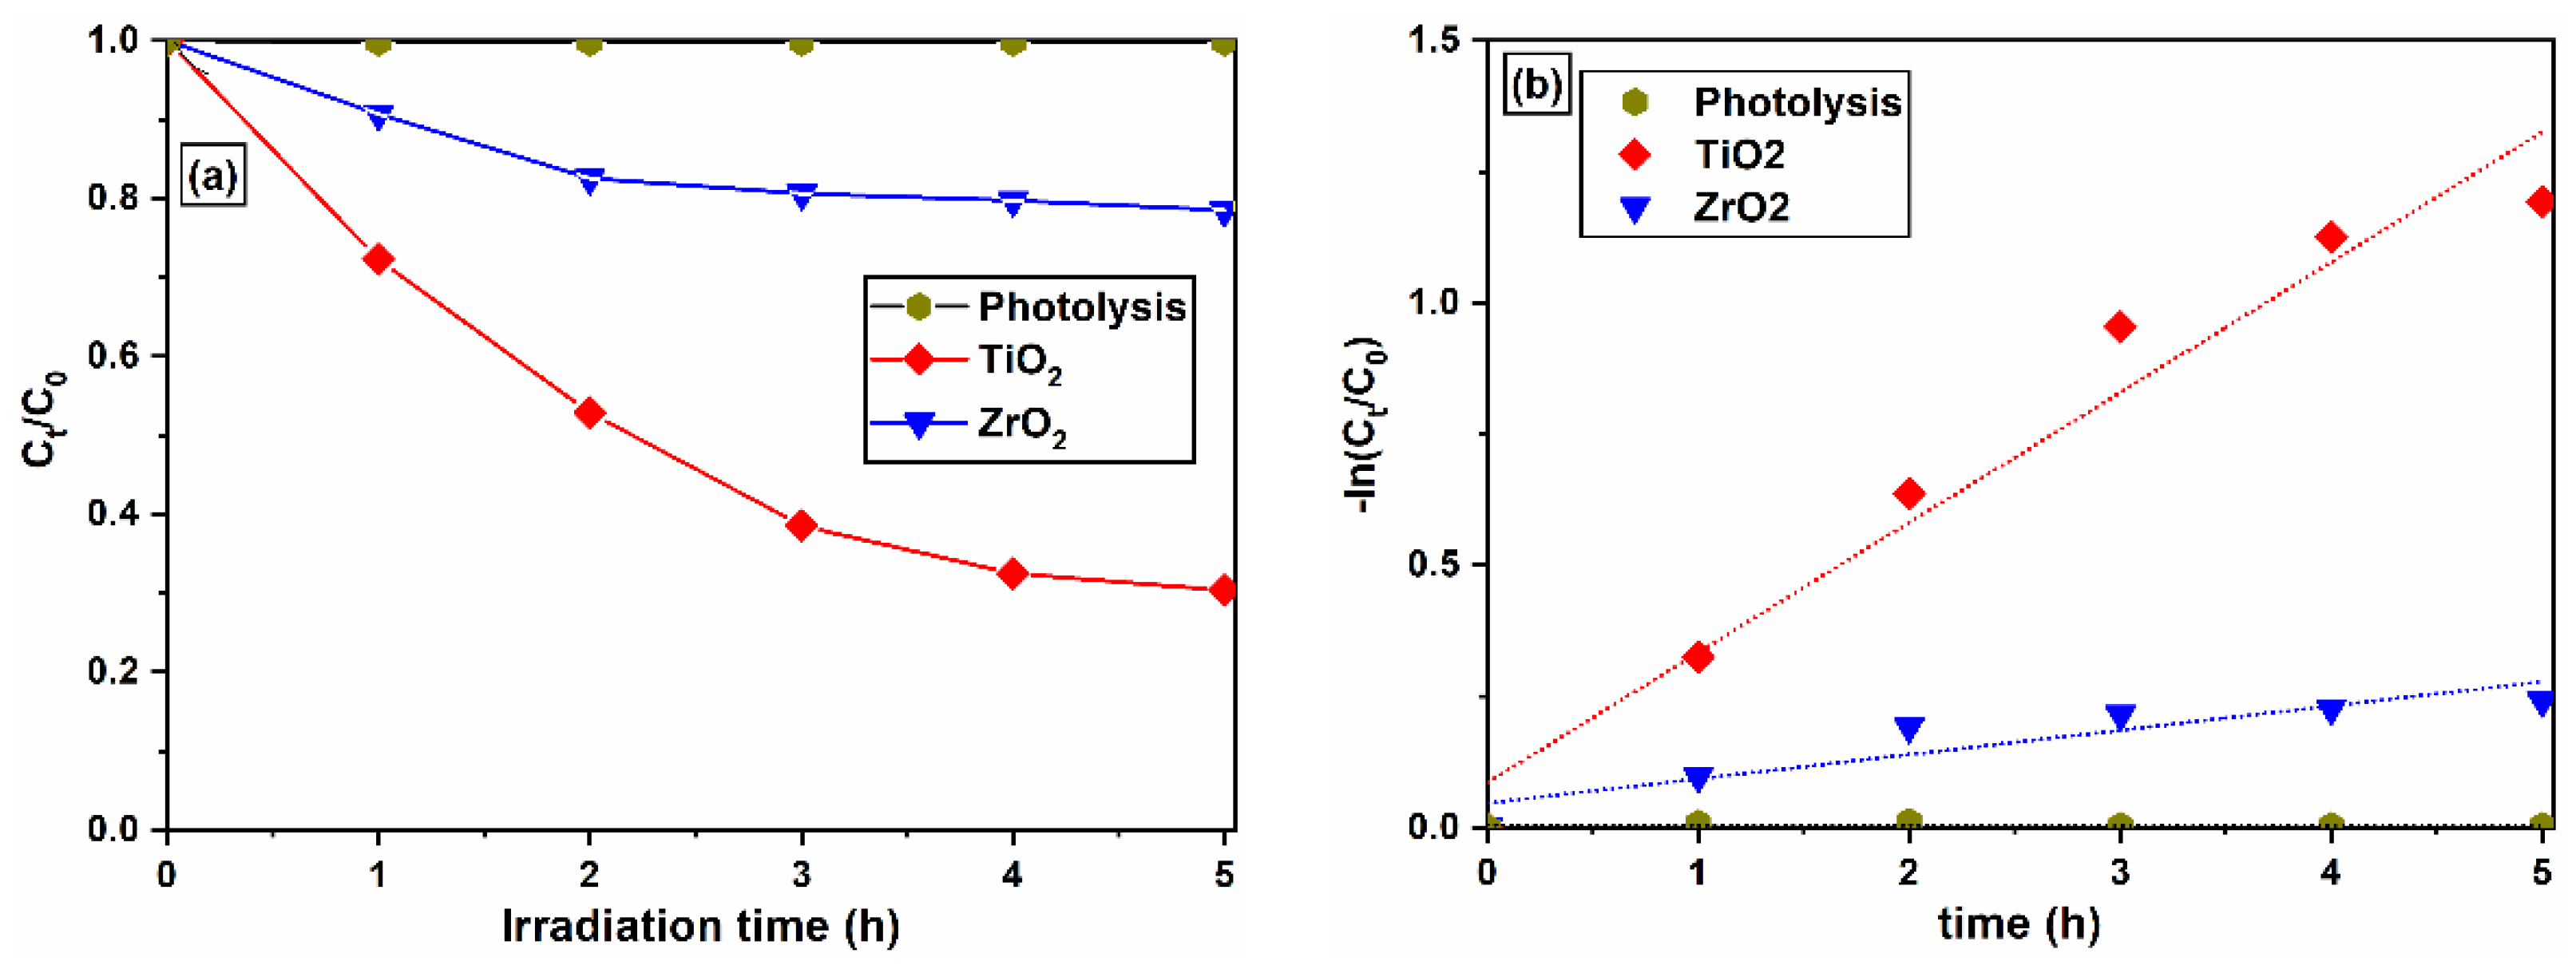
2.7. Photocatalytic Decolorization of MB

The photocatalytic performance of TiO2 and ZrO2 TFs was followed by means of the discoloration kinetics of an aqueous MB solution. The measured concentration of MB dye exhibited no significant changes upon UV light radiation. The concentration of MB dye, on the other hand, was rapidly reduced under UV lighting using TiO2 TFs. Using ZrO2 TFs, however, the degradation was less efficient, as can be seen in Figure 7a. In this way, while TiO2 TFs reduced the absorption of MB in 70% after 300 min, ZrO2 TFs showed a discoloration extent of 22%. Consistent with these results, Bathula et al. reported an efficient photodegradation of MB by TiO2 films achieving discoloration values close to 50% in 180 min [88].
The PD efficiency was computed using the following equation:
D e g r a d a t i o n % = C 0 C C 0 × 100
where C is the dye concentration at different irradiation times and C 0 is the starting concentration. Using this equation, Bathula et al. reported similar degradation close to 50% in 180 min [88]. Recently, João et al. also reported a novel apparatus for automated sol–gel solution deposition through a cost-effective spray coating technique, resulting in TiO2 films with an anatase-like crystalline structure and uniform surface morphology that reach a degradation of almost 75% in five hours [89]. Carlos et al., in their experiment for the removal and PD of MB on ZrO2 TFs, reported 14% discoloration after 100 min [90]; a value that is similar to that obtained in this work.
The kinetics of the dye degradation photocatalytic process were examined using a pseudo-first-order kinetic model. For this purpose, the following equation was used to fit the experimental data, and from the linearized equation, the pseudo-first-order reaction constant, k, was obtained
ln C C 0 = k t
In this equation, k corresponds to the kinetic discoloration rate constant, and t is time. Figure 7b shows the experimental and fitted data that result in the pseudo-first-order kinetic constant values of 0.0856 min−1 and 0.00465 min−1 for TiO2 and ZrO2 TFs, respectively.
Inspection of Figure 7 shows not only a reasonably good fitting of the data to a pseudo-first-order kinetic model but also an important difference in the performance of the two TFs under study. As expected, and in terms of the computed rate constants, the TiO2 value is about 20 times larger than that exhibited by the ZrO2 film. This difference is obviously related to a variety of semiconductor features, among which the chemical composition, purity, BG energy, surface trap density and dye adsorption properties are commonly identified. From our contact angle measurements and consistent with the fact that more hydrophobic surfaces should make the adsorption of water molecules on the TF surface more thermodynamically difficult, it is possible to suggest that photogenerated hole injection is less efficient for ZrO2 when compared to TiO2 films, and therefore, recombination of charge carriers and less efficient photocatalytic performance should be expected for ZrO2 TFs.

3. Experimental Section

3.1. Substrate Cleaning

The substrates were cleaned following the method described by Jothibas et al. [91]. Initially, glass substrates (Corning 2947) underwent an extensive cleaning procedure involving ultrasonic treatment in a deionized solution for several minutes. They were then sequentially immersed in a chromic acid (H2CrO4) solution for three hours, followed by an additional hour in a nitric acid solution at 100 °C. After cleaning, TFs were deposited on the substrates using the DC technique, with a different dipping rate for each material.

3.2. TiO2 TFs

For the sol–gel synthesis of TiO2, 1.5 mL of hydrochloric acid (HCl, J.T. Baker, Phillipsburg, NJ, USA, 36.7%) was slowly added (dropwise, 30 min) to 55 mL of isopropyl alcohol ((CH3)2CHOH, JT Baker 99.5%) under stirring conditions. Then, 4.5 mL of Titanium(IV) isopropoxide (Ti[OCH(CH3)2]4, Sigma-Aldrich, St. Louis, MI, USA, 97%) was added, followed by drop-wise addition under stirring (60 min) of 0.1 mL of distilled water (H2O) at RT.

3.3. ZrO2 TFs

To prepare the precursor solution necessary for the film deposition process, 1.5 mL of nitric acid (HNO3) was poured into a 100 mL beaker, followed by the addition of 40 mL of ethanol while magnetically stirring for 15 min. To obtain a translucent yellowish solution, 9 mL of zirconium propoxide was then added to the mixture and stirred for an additional hour. The precursor solution was then aged for one day. During the coating process, the substrates were withdrawn at a rate of 2 cm/min. ZrO2 films were deposited using five coating layers, with each layer being dried in an open-environment oven for three minutes. After applying the required number of coatings, the films were dried at 250 °C for 30 min and subsequently annealed at 500 °C.

3.4. Structural, Optical, and Morphological Characterization of the Films

UV-Vis measurements were carried out using an Evolution 220 UV-Vis Spectrophotometer. X-ray diffraction experiments, on the other hand, were performed using a Philips X-ray diffractometer (PANalytical’s X’pert PRO X-ray diffractometer), that employed a Cu-Kα radiation with a wavelength of 0.154 nm in the 20° ≤ 2θ ≤ 80° range. The voltage and current settings were 30 kV and 40 mA, respectively. The samples were continuously scanned with a step size of 0.02° (2θ) and a count time of 1 s per step. Structural properties were also studied using Raman spectroscopy, which collected data using a Labram Dilor Raman spectrometer equipped with a He-Ne laser exciting source operating between the wavelengths of 150 and 800 nm at ambient temperature (AT). Using a scanning electron microscope (SEM, JEOL JSM-6300), surface images were acquired. The UV–visible transmittance spectrum (Thermo Fisher Scientific, Billerica, MA, USA) of TFs was recorded using a Thermo Scientific™ (Waltham, MA, USA) Evolution 220 UV-Vis Spectrophotometer. Photoluminescence (PL) data were obtained at RT by optical excitation with a He-Cd laser, and luminescence was registered employing a Horiba/Spex 1404 0.85 m Double Spectrometer. The hydrophilic properties of the TFs were evaluated by a contact angle measuring instrument (Dataphysics, model OCA 50, Philips, Warsaw, Poland) on which a 5 µL droplet of deionized water was carefully positioned on the surface of the TFs at RT.

3.5. Photocatalytic Activity Evaluation

The kinetics of MB discoloration in aqueous solutions under UV light were utilized to measure the photocatalytic activity (PA) of the films under study at RT. A standard quartz cell was filled with 3 mL of MB solution, into which a sample TF with an area of 2 cm2 was introduced. Five replicates were prepared for each TF being studied. The irradiation light was provided by a 15 W lamp with a wavelength of 254 nm (using a G15T8 germicidal lamp (Philips, Warsaw, Poland) as the excitation source). The distance between the quartz cells and the lamp was maintained at 5 cm. Every hour, the lamp was turned off, a quartz cell was taken, and subsequently the lamp was turned on; the TF was removed from the quartz cell and the dye concentration in the quartz cells without the TFs was analyzed by UV-Vis. This process was repeated 4 more times.

4. Conclusions

In conclusion, TiO2 and ZrO2 TFs were prepared and thoroughly characterized using spectroscopy, microscopy and hydrophobicity measurements. The results revealed that, as expected, both films are characterized by a similar energy BG, porosity, thickness and homogeneity. The two films under study are also characterized by substantially different photocatalytic activities for the discoloration of a model dye aqueous solution. The observed difference is consistent with PD experiments reported by other authors and is probably due to differences in the e/h+ generation and recombination rates, as well as in the efficiency of the TF materials to produce OH radicals that result from hole injection to water adsorbed molecules. In this regard, the differences observed in the surface hydrophilicity of the TiO2 and ZrO2 TFs under study are probably related to the hole injection kinetic performances of the two materials and, therefore, to the different photocatalytic activity that was found in the dye discoloration experiments.

Author Contributions

Conceptualization, Y.d.J.A.-S., M.I.L.-A., S.R., A.A.F.-P. and A.M.-L.; Methodology, Y.d.J.A.-S., J.F.G.-T. and A.M.-L.; Validation, M.I.L.-A., S.R. and A.A.F.-P.; Formal analysis, M.I.L.-A., S.G.-H., Y.M., L.A.G. and A.M.-L.; Investigation, Y.d.J.A.-S., M.I.L.-A., S.G.-H., J.F.G.-T., Y.M., S.R., A.A.F.-P., L.A.G. and A.M.-L.; Resources, S.G.-H., J.F.G.-T. and Y.M.; Data curation, M.I.L.-A.; Writing—original draft, Y.d.J.A.-S. and A.M.-L.; Writing—review & editing, Y.d.J.A.-S., L.A.G. and A.M.-L.; Visualization, M.I.L.-A.; Supervision, Y.d.J.A.-S., S.G.-H., J.F.G.-T., Y.M., S.R., A.A.F.-P., L.A.G. and A.M.-L.; Project administration, Y.d.J.A.-S., S.G.-H., J.F.G.-T., L.A.G. and A.M.-L. All authors have read and agreed to the published version of the manuscript.

Funding

This research received no external funding.

Data Availability Statement

The original contributions presented in the study are included in the article, further inquiries can be directed to the corresponding author.

Acknowledgments

The authors thank the financial support of “FONDO PARA EL DESARROLLO DEL CONOCIMIENTO (FONDEC-UAQ-2022, FIN202209)”. We also thank A. Guzmán-Campuzano for his technical assistance. Also, the authors would like to thank to all members of the Nanotechnology and Photocatalysis Laboratory at Airport Campus of the Autonomous University of Querétaro.

Conflicts of Interest

The authors declare no conflicts of interest.

References

  1. Shanmugam, M.; Augustin, A.; Mohan, S.; Honnappa, B.; Chuaicham, C.; Rajendran, S.; Hoang, T.K.A.; Sasaki, K.; Sekar, K. Conducting polymeric nanocomposites: A review in solar fuel applications. Fuel 2022, 325, 124899. [Google Scholar] [CrossRef]
  2. Raza, R.; Zhu, B.; Rafique, A.; Naqvi, M.R.; Lund, P. Functional ceria-based nanocomposites for advanced low-temperature (300–600 °C) solid oxide fuel cell: A comprehensive review. Materials 2020, 15, 100373. [Google Scholar] [CrossRef]
  3. Khan, K.; Tareen, A.K.; Aslam, M.; Zhang, Y.; Wang, R.; Ouyang, Z.; Gou, Z.; Zhang, H. Recent advances in two-dimensional materials and their nanocomposites in sustainable energy conversion applications. Nanoscale 2019, 11, 21622–21678. [Google Scholar] [CrossRef] [PubMed]
  4. Kumar, S.A.; Kuppusami, P.; Vengatesh, P. Auto-combustion synthesis and electrochemical studies of La0.6Sr0.4Co0.2Fe0.8O3-δ—Ce0.8Sm0.1Gd0.1O1.9 nanocomposite cathode for intermediate temperature solid oxide fuel cells. Ceram. Int. 2018, 44, 21188–21196. [Google Scholar] [CrossRef]
  5. UNESCO. United Nations Educational Scientific and Cultural Organization. In The United Nations World Water Development Report 2021: Valuing Water; United Nations: New York, NY, USA, 2021; ISBN 978-92-3-100434-6. [Google Scholar]
  6. OECD. Groundwater Allocation: Managing Growing Pressures on Quantity and Quality; OECD Publishing: Paris, France, 2017; ISBN 978-92-6-428155-4. [Google Scholar]
  7. Speight, J.G. Remediation technologies. In Natural Water Remediation—Chemistry and Technology; Elsevier: Amsterdam, The Netherlands, 2020; pp. 263–303. [Google Scholar] [CrossRef]
  8. Hosny, N.M.; Gomaa, I.; Elmahgary, M.G. Adsorption of polluted dyes from water by transition metal oxides: A review. Appl. Surf. Sci. Adv. 2023, 15, 100395. [Google Scholar] [CrossRef]
  9. Camargo, P.H.C.; Satyanarayana, K.G.; Wypych, F. Nanocomposites: Synthesis, structure, properties and new application opportunities. Mater. Res. 2009, 12, 1–39. [Google Scholar] [CrossRef]
  10. Barbero, E.J. Introduction to Composite Materials Design, 3rd ed.; CRC Press: London, UK, 2017. [Google Scholar] [CrossRef]
  11. Choi, S.M.; Awaji, H. Nanocomposites-a new material design concept. Sci. Technol. Adv. Mater. 2005, 6, 2–10. [Google Scholar] [CrossRef]
  12. Wang, M.; Pan, N. Predictions of effective physical properties of complex multiphase materials. Mater. Sci. Eng. R Rep. 2008, 63, 1–30. [Google Scholar] [CrossRef]
  13. Yang, Z.; Zhang, J.; Wu, B.; Zhao, X.; Lu, X.; Zhao, Y.; Li, Y. Self-assembled La0.6Sr0.4FeO3−δ-La1.2Sr0.8NiO4+δ composite cathode for protonic ceramic fuel cells. Ceram. Int. 2023, 49, 25381–25388. [Google Scholar] [CrossRef]
  14. Chen, B.; Meng, Y.; Sha, J.; Zhong, C.; Hu, W.; Zhao, N. Preparation of MoS2/TiO2 based nanocomposites for photocatalysis and rechargeable batteries: Progress, challenges, and perspective. Nanoscale 2018, 10, 34–68. [Google Scholar] [CrossRef]
  15. Li, G.; Fu, R.; Agathopoulos, S.; Su, X.; He, Q.; Ji, Y.; Liu, X. Ultra-low thermal expansion coefficient of PZB/β-eucryptite composite glass for MEMS packaging. Ceram. Int. 2020, 46, 8385–8390. [Google Scholar] [CrossRef]
  16. Martínez-Saucedo, G.; Torres-Delgado, G.; Márquez-Marín, J.; Zelaya-Ángel, O.; Castanedo-Pérez, R. Copper oxide and tin oxide amorphous-thin-film heterojunction diodes obtained via solution-based techniques with increased rectification after rapid thermal annealing treatments. J. Alloys Compd. 2021, 859, 157790. [Google Scholar] [CrossRef]
  17. Kahveci, O.; Akkaya, A.; Yücel, E.; Aydın, R.; Sahin, B. Production of p-CuO/n-ZnO:Co nanocomposite heterostructure TFs: An optoelectronic study. Ceram. Int. 2023, 49, 16458–16466. [Google Scholar] [CrossRef]
  18. Dubey, R.S.; Jadkar, S.R.; Bhorde, A.B. Synthesis and characterization of various doped TiO2 nanocrystals for dye-sensitized solar cells. ACS Omega 2021, 6, 3470–3482. [Google Scholar] [CrossRef]
  19. Jemaa, I.B.; Chaabouni, F.; Ranguis, A. Cr doping effect on the structural, optoelectrical and photocatalytic properties of RF sputtered TiO2 TFs from a powder target. J. Alloys Compd. 2020, 825, 153988. [Google Scholar] [CrossRef]
  20. DCoronado, R.; Gattorno, G.R.; Pesqueira, M.E.E.; Cab, C.; Coss, R.; Oskam, G. Phase-pure TiO2 nanoparticles: Anatase, Brookite and Rutile. Nanotechnology 2008, 19, 145605. [Google Scholar] [CrossRef]
  21. Zhu, T.; Gao, S.P. The Stability, Electronic Structure, and Optical Property of TiO2 Polymorphs. J. Phys. Chem. C 2014, 118, 11385–11396. [Google Scholar] [CrossRef]
  22. Zanatta, A.R. Assessing the amount of the Anatase and Rutile phases of TiO2 by optical reflectance measurements. Results Phys. 2021, 22, 103864. [Google Scholar] [CrossRef]
  23. Hanaor, D.A.H.; Sorrell, C.C. Review of the Anatase to Rutile phase transformation. J. Mater. Sci. 2011, 46, 855–874. [Google Scholar] [CrossRef]
  24. Baran, W.; Masternak, E.; Sapińska, D.; Sobczak, A.; Adamek, E. Synthesis of New Antibiotics Derivatives by the Photocatalytic Method: A Screening Research. Catalysts 2021, 11, 1102. [Google Scholar] [CrossRef]
  25. Tian, S.; Feng, Y.; Zheng, Z.; He, Z. TiO2-Based Photocatalytic Coatings on Glass Substrates for Environmental Applications. Coatings 2023, 13, 1472. [Google Scholar] [CrossRef]
  26. Si, P.; Zheng, Z.; Gu, Y.; Geng, C.; Guo, Z.; Qin, J.; Wen, W. Nanostructured TiO2 Arrays for Energy Storage. Materials 2023, 16, 3864. [Google Scholar] [CrossRef] [PubMed]
  27. Bertel, L.; Miranda, D.A.; García-Martín, J.M. Nanostructured Titanium Dioxide Surfaces for Electrochemical Biosensing. Sensors 2021, 21, 6167. [Google Scholar] [CrossRef] [PubMed]
  28. Xu, Y.; Zangari, G. TiO2 Nanotubes Architectures for Solar Energy Conversion. Coatings 2021, 11, 931. [Google Scholar] [CrossRef]
  29. Gnida, P.; Jarka, P.; Chulkin, P.; Drygała, A.; Libera, M.; Tański, T.; Schab-Balcerzak, E. Impact of TiO2 Nanostructures on Dye-Sensitized Solar Cells Performance. Materials 2021, 14, 1633. [Google Scholar] [CrossRef]
  30. Arifin, Z.; Suyitno, S.; Hadi, S.; Sutanto, B. Improved Performance of Dye-Sensitized Solar Cells with TiO2 Nanoparticles/Zn-Doped TiO2 Hollow Fiber Photoanodes. Energies 2018, 11, 2922. [Google Scholar] [CrossRef]
  31. Ezeh, I.M.; Enaroseha, O.O.E.; Agbajor, G.K.; Achuba, F.I. Effect of Titanium Oxide (TiO2) on Natural Dyes for the Fabrication of Dye-Sensitized Solar Cells. Eng. Proc. 2024, 63, 25. [Google Scholar] [CrossRef]
  32. Matsui, M.; Akaogi, M. Molecular Dynamics Simulation of the Structural and Physical Properties of the Four Polymorphs of TiO2. Mol. Simul. 1991, 6, 239–244. [Google Scholar] [CrossRef]
  33. Eddy, D.R.; Permana, M.D.; Sakti, L.K.; Sheha, G.A.N.; Solihudin; Hidayat, S.; Takei, T.; Kumada, N.; Rahayu, I. Heterophase Polymorph of TiO2 (Anatase, Rutile, Brookite, TiO2 (B)) for Efficient Photocatalyst: Fabrication and Activity. Nanomaterials 2023, 13, 704. [Google Scholar] [CrossRef]
  34. Balog, M.; Schieber, M.; Michman, M.; Patai, S. The chemical vapour deposition and characterization of ZrO2 films from organometallic compounds. Thin Solid Films 1977, 47, 109–120. [Google Scholar] [CrossRef]
  35. Ibrahim, M.M. Photocatalytic activity of nanostructured ZnO–ZrO2 binary oxide using fluorometric method. Spectrochim. Acta Part A Mol. Biomol. Spectrosc. 2015, 145, 487–492. [Google Scholar] [CrossRef] [PubMed]
  36. Zegtouf, H.; Saoula, N.; Azibi, M.; Bait, L.; Madaoui, N.; Khelladi, M.R.; Kechouane, M. A study of properties of ZrO2 TFs deposited by magnetron sputtering under different plasma parameters: Biomedical application. J. Electr. Eng. 2019, 70, 117. [Google Scholar] [CrossRef]
  37. Hirano, M.; Watanabe, S.; Kato, E.; Mizutani, Y.; Kawai, M.; Nakamura, Y. Fabrication, electrical conductivity and mechanical properties of Sc2O3-doped tetragonal zirconia ceramics. Solid State Ion. 1998, 111, 161–169. [Google Scholar] [CrossRef]
  38. Nova, C.V.; Reis, K.A.; Pinheiro, A.L.; Dalmaschio, C.J.; Chiquito, A.J.; Teodoro, M.D.; Rodrigues, A.D.; Longo, E.; Pontes, F.M. Synthesis, characterization, photocatalytic, and antimicrobial activity of ZrO2 nanoparticles and Ag@ZrO2 nanocomposite prepared by the advanced oxidative process/hydrothermal route. J. Sol-Gel Sci. Technol. 2021, 98, 113–126. [Google Scholar] [CrossRef]
  39. Lamm, B.W.; Mitchell, D.J. Chemical Vapor Deposition of Zirconium Compounds: A Review. Coatings 2023, 13, 266. [Google Scholar] [CrossRef]
  40. Desforges, J.; Robichaud, L.; Gauvin, S. Determination of Optical Properties of TFs from Ketteler-Helmholtz Dispersion Relations: Application to the Case of Ultraviolet Irradiated Zirconium Oxide. Adv. Mater. Sci. Eng. 2017, 2017, 8285230. [Google Scholar] [CrossRef]
  41. Sawka, A. Chemical Vapour Deposition of Scandia-Stabilised Zirconia Layers on Tubular Substrates at Low Temperatures. Materials 2022, 15, 2120. [Google Scholar] [CrossRef]
  42. Xu, X.; Cui, Q.; Jin, Y.; Guo, X. Low-voltage zinc oxide thin-film transistors with solution-processed channel and dielectric layers below 150 °C. Appl. Phys. Lett. 2012, 101, 222114. [Google Scholar] [CrossRef]
  43. Husain, A.; Ahmad, S.; Mohammad, F. Thermally stable and highly sensitive ethene gas sensor based on polythiophene/zirconium oxide nanocomposites. Mater. Today Commun. 2019, 20, 100574. [Google Scholar] [CrossRef]
  44. Nishizawa, K.; Miki, T.; Suzuki, K.; Kato, K. Wavelength dependence of crystallization of alkoxy-derived ZrO2 TFs prepared by ultraviolet irradiation. J. Mater. Res. 2005, 20, 3133–3140. [Google Scholar] [CrossRef]
  45. Lovchinov, K.; Gergova, R.; Alexieva, G. Structural, Morphological and Optical Properties of Nanostructured ZrO2 Films Obtained by an Electrochemical Process at Different Deposition Temperatures. Coatings 2022, 12, 972. [Google Scholar] [CrossRef]
  46. Ahmad, T.; Shahazad, M.; Phul, R. Hydrothermal synthesis, characterization and dielectric properties of zirconia nanoparticles. Mater. Sci. Eng. Int. J. 2017, 1, 100–104. [Google Scholar] [CrossRef]
  47. Cao, W.; Kang, J.; Fan, G.; Yang, L.; Li, F. Fabrication of porous ZrO2 nanostructures with controlled crystalline phases and structures via a facile and cost-effective hydrothermal approach. Ind. Eng. Chem. Res. 2015, 54, 12795–12804. [Google Scholar] [CrossRef]
  48. Boratto, M.H.; Lima, J.V.M.; Scalvi, L.V.A.; Graeff, C.F.O. Low-temperature ZrO2 TFs obtained by polymeric route for electronic applications. J. Mater. Sci. Mater. Electron. 2020, 31, 16065–16072. [Google Scholar] [CrossRef]
  49. Hashemzadeh, M.; Simchen, F.; Winter, L.; Lampke, T. Evaluation of Fracture Toughness of Plasma Electrolytic Oxidized Al2O3-ZrO2 Coatings Utilizing Nano-Scratch Technique. Coatings 2023, 13, 799. [Google Scholar] [CrossRef]
  50. Liang, L.; Xu, Y.; Wu, D.; Sun, Y. A simple sol–gel route to ZrO2 films with high optical performances. Mater. Chem. Phys. 2009, 114, 252–256. [Google Scholar] [CrossRef]
  51. Kumar, K.R.; Pridhar, T.; Balaji, V.S.S. Mechanical properties and characterization of zirconium oxide (ZrO2) and coconut shell ash(CSA) reinforced aluminium (Al 6082) matrix hybrid composite. J. Alloys Compd. 2018, 765, 171–179. [Google Scholar] [CrossRef]
  52. Rani, V.; Sharma, A.; Kumar, A.; Singh, P.; Thakur, S.; Singh, A.; Le, Q.V.; Nguyen, V.H.; Raizada, P. ZrO2-Based Photocatalysts for Wastewater Treatment: From Novel Modification Strategies to Mechanistic Insights. Catalysts 2022, 12, 1418. [Google Scholar] [CrossRef]
  53. Yao, N.Q.; Liu, Z.C.; Gu, G.R.; Wu, B.J. Structural, optical, and electrical properties of Cu-doped ZrO2 films prepared by magnetron co-sputtering. Chin. Phys. B 2017, 26, 106801. [Google Scholar] [CrossRef]
  54. Nakonieczny, D.S.; Kern, F.; Dufner, L.; Dubiel, A.; Antonowicz, M.; Matus, K. Effect of Calcination Temperature on the Phase Composition, Morphology, and Thermal Properties of ZrO2 and Al2O3 Modified with APTES (3-aminopropyltriethoxysilane). Materials 2021, 14, 6651. [Google Scholar] [CrossRef]
  55. Cesaria, M.; Scrimieri, L.; Torrisi, A.; Quarta, G.; Serra, A.; Manno, D.; Caricato, A.P.; Martino, M.; Calcagnile, L.; Velardi, L. Pulsed-laser deposition and photocatalytic activity of pure rutile and anatase TiO2 films: Impact of single-phased target and deposition conditions. Vacuum 2022, 202, 111150. [Google Scholar] [CrossRef]
  56. Gottmann, J.; Kreutz, E.W. Pulsed laser deposition of alumina and zirconia TFs on polymers and glass as optical and protective coatings. Surf. Coat. Technol. 1999, 116–119, 1189–1194. [Google Scholar] [CrossRef]
  57. Pore, V.; Kivelä, T.; Ritala, M.; Leskelä, M. Atomic layer deposition of photocatalytic TiO2 TFs from TiF4 and H2O. Dalton Trans. 2008, 45, 6467–6474. [Google Scholar] [CrossRef] [PubMed]
  58. Cassir, M.; Goubin, F.; Bernay, C.; Vernoux, P.; Lincot, D. Synthesis of ZrO2 TFs by atomic layer deposition: Growth kinetics, structural and electrical properties. Appl. Surf. Sci. 2002, 193, 120–128. [Google Scholar] [CrossRef]
  59. Iwamura, S.; Motohashi, S.; Mukai, S.R. Development of an efficient CVD technique to prepare TiO2/porous–carbon nanocomposites for high-rate lithium-ion capacitors. RSC Adv. 2020, 10, 38196–38204. [Google Scholar] [CrossRef]
  60. Flores-Ruiz, F.J.; Diliegros-Godines, C.J.; Hernández-García, F.A.; Castanedo-Pérez, R.; Torres-Delgado, G.; Broitman, E. Mechanical and tribological behavior of sol–gel TiO2–CdO films measured at the microscale levels. J. Sol-Gel Sci. Technol. 2017, 82, 682–691. [Google Scholar] [CrossRef]
  61. Caracoche, M.C.; Rivas, P.C.; Cervera, M.M.; Caruso, R.; Benavídez, E.; de Sanctis, O.; Escobar, M.E. Zirconium Oxide Structure Prepared by the Sol–Gel Route: I, The Role of the Alcoholic Solvent. J. Am. Ceram. Soc. 2000, 83, 377–384. [Google Scholar] [CrossRef]
  62. Owens, G.J.; Singh, R.K.; Foroutan, F.; Alqaysi, M.; Han, C.M.; Mahapatra, C.; Kim, H.W.; Knowles, J.C. Sol–gel based materials for biomedical applications. Prog. Mater. Sci. 2016, 77, 1–79. [Google Scholar] [CrossRef]
  63. Torres-Limiñana, J.; Feregrino-Pérez, A.A.; Vega-González, M.; Escobar-Alarcón, L.; Cervantes-Chávez, J.A.; Esquivel, K. Green Synthesis via Eucalyptus globulus L. Extract of Ag-TiO2 Catalyst: Antimicrobial Activity Evaluation toward Water Disinfection Process. Nanomaterials 2022, 12, 1944. [Google Scholar] [CrossRef]
  64. Wang, X.; Sun, P.; Zhao, Z.; Liu, Y.; Zhou, S.; Yang, P.; Dong, Y. Effects of the ZrO2 Crystalline Phase and Morphology on the Thermocatalytic Decomposition of Dimethyl Methylphosphonate. Nanomaterials 2024, 14, 611. [Google Scholar] [CrossRef]
  65. Stefanov, B.I. Optically Transparent TiO2 and ZnO Photocatalytic TFs via Salicylate-Based Sol Formulations. Coatings 2023, 13, 1568. [Google Scholar] [CrossRef]
  66. Ji, P.; Wang, Z.; Shang, X.; Zhang, Y.; Liu, Y.; Mao, Z.; Shi, X. Direct observation of enhanced Raman scattering on nano-sized ZrO2 substrate: Charge-transfer contribution. Front. Chem. 2019, 7, 245. [Google Scholar] [CrossRef] [PubMed]
  67. López, E.F.; Escribano, V.S.; Panizza, M.; Carnasciali, M.M. Vibrational and electronic spectroscopic properties of zirconia powders. J. Mater. Chem. 2001, 11, 1891–1897. [Google Scholar] [CrossRef]
  68. Basahel, S.N.; Ali, T.T.; Mokhtar, M.; Narasimharao, K. Influence of crystal structure of nanosized ZrO2 on PD of methyl orange. Nanoscale Res. Lett. 2015, 10, 73. [Google Scholar] [CrossRef]
  69. Sezgin, A.; Čtvrtlík, R.; Václavek, L.; Tomáštík, J.; Nožka, L.; Menşur, E.; Türküz, S. Optical, structural and mechanical properties of TiO2 and TiO2-ZrO2 TFs deposited on glass using magnetron sputtering. Mater. Today Commun. 2023, 35, 106334. [Google Scholar] [CrossRef]
  70. Prucnal, S.; Gago, R.; Calatayud, D.G.; Rebohle, L.; Liedke, M.O.; Butterling, M.; Wagner, A.; Helm, M.; Zhou, S. TiO2 Phase Engineering by Millisecond Range Annealing for Highly Efficient Photocatalysis. J. Phys. Chem. C 2023, 127, 12686–12694. [Google Scholar] [CrossRef]
  71. Mansilla, Y.; Arce, M.D.; González-Oliver, C.; Basbus, J.; Troiani, H.; Serquis, A. Characterization of stabilized ZrO2 TFs obtained by sol-gel method. Appl. Surf. Sci. 2021, 569, 150787. [Google Scholar] [CrossRef]
  72. Pérez-González, M.; Tomás, S.A.; Morales-Luna, M.; Arvizu, M.A.; Tellez-Cruz, M.M. Optical, structural, and morphological properties of photocatalytic TiO2–ZnO TFs synthesized by the sol–gel process. Thin Solid Films 2015, 594, 304–309. [Google Scholar] [CrossRef]
  73. Khetta, O.B.; Attaf, A.; Derbali, A.; Saidi, H.; Bouhdjer, A.; Aida, M.S.; Khetta, Y.B.; Messemeche, R.; Nouadji, R.; Rahmane, S.; et al. Precursor concentration effect on the physical properties of transparent titania (Anatase-TiO2) TFs grown by ultrasonic spray process for optoelectronics application. Opt. Mater. 2022, 132, 112790. [Google Scholar] [CrossRef]
  74. Singh, H.; Sunaina; Yadav, K.K.; Bajpai, V.K.; Jha, M. Tuning the bandgap of m-ZrO2 by incorporation of copper nanoparticles into visible region for the treatment of organic pollutants. Mater. Res. Bull. 2020, 123, 110698. [Google Scholar] [CrossRef]
  75. Witit-anun, N.; Chaiyakun, S. Structural and optical properties of ZrO2 TFs deposited by reactive DC unbalanced magnetron sputtering. Adv. Mater. Res. 2014, 979, 374–377. [Google Scholar] [CrossRef]
  76. Mukhtar, F.; Munawar, T.; Nadeem, M.S.; Rehman, M.N.; Khan, S.A.; Koc, M.; Batool, S.; Hasan, M.; Iqbal, F. Dual Z-scheme core-shell PANI-CeO2-Fe2O3-NiO heterostructured nanocomposite for dyes remediation under sunlight and bacterial disinfection. Environ. Res. 2022, 215, 114140. [Google Scholar] [CrossRef] [PubMed]
  77. Makuła, P.; Pacia, M.; Macyk, W. How To Correctly Determine the BG Energy of Modified Semiconductor Photocatalysts Based on UV–Vis Spectra. J. Phys. Chem. Lett. 2018, 9, 6814–6817. [Google Scholar] [CrossRef] [PubMed]
  78. Murillo, V.N.; Rajput, D.; Manriquez, J.; Bustos, E.; Bueno, J.J.P.; Singh, D.; Dubey, H.; Vazquez, C.E.F.; Godavarthi, S.; Zarhri, Z.; et al. Modulating temperature for Cu2ZnSnS4 (CZTS) synthesis via hot injection method and studying the photocatalytic efficiencies for the degradation of rhodamine 6G and methylene blue pollutants. Environ. Res. 2024, 258, 119371. [Google Scholar] [CrossRef] [PubMed]
  79. Chacon-Argaez, U.; Cedeño-Caero, L.; Cadena-Nava, R.D.; Ramirez-Acosta, K.; Fuentes-Moyado, S.; Sánchez-López, P.; Alonso-Núñez, G. Photocatalytic Activity and Biocide Properties of Ag–TiO2 Composites on Cotton Fabrics. Materials 2023, 16, 4513. [Google Scholar] [CrossRef]
  80. Nagaveni, K.; Hegde, M.S.; Madras, G. Structure and Photocatalytic Activity of Ti1−xMxO2±δ (M = W, V, Ce, Zr, Fe, and Cu) Synthesized by Solution Combustion Method. J. Phys. Chem. B 2004, 108, 20204–20212. [Google Scholar] [CrossRef]
  81. Pallotti, D.K.; Passoni, L.; Maddalena, P.; Di Fonzo, F.; Lettieri, S. Photoluminescence Mechanisms in Anatase and Rutile TiO2. J. Phys. Chem. C 2017, 121, 9011–9021. [Google Scholar] [CrossRef]
  82. Prakashbabu, D.; Krishna, R.H.; Nagabhushana, B.M.; Nagabhushana, H.; Shivakumara, C.; Chakradar, R.P.S.; Ramalingam, H.B.; Sharma, S.C.; Chandramohan, R. Low temperature synthesis of pure cubic ZrO2 nanopowder: Structural and luminescence studies. Spectrochim. Acta Part A Mol. Biomol. Spectrosc. 2014, 122, 216–222. [Google Scholar] [CrossRef]
  83. Ashraf, S.; Irfan, M.; Kim, D.; Jang, J.H.; Han, W.T.; Jho, Y.D. Optical influence of annealing in nano- and submicron-scale ZrO2 powders. Ceram. Int. 2014, 40, 8513–8518. [Google Scholar] [CrossRef]
  84. Gnanamoorthi, K.; Balakrishnan, M.; Mariappan, R.; Kumar, E.R. Effect of Ce doping on microstructural, morphological and optical properties of ZrO2 nanoparticles. Mater. Sci. Semicond. Process. 2015, 30, 518–526. [Google Scholar] [CrossRef]
  85. Adachi, T.; Latthe, S.S.; Gosavi, S.W.; Roy, N.; Suzuki, N.; Ikari, H.; Kato, K.; Katsumata, K.I.; Nakata, K.; Furudate, M.; et al. Photocatalytic, superhydrophilic, self-cleaning TiO2 coating on cheap, light-weight, flexible polycarbonate substrates. Appl. Surf. Sci. 2018, 458, 917–923. [Google Scholar] [CrossRef]
  86. Al-Shomar, S.M.; Barakat, M.A.Y.; Abdallah, A.W. Ellipsometric and ultrasonic studies of nano titanium dioxide specimens doped with Erbium. Mater. Res. Express 2020, 7, 106413. [Google Scholar] [CrossRef]
  87. Purcar, V.; Rădiţoiu, V.; Dumitru, A.; Nicolae, A.; Frone, A.N.; Anastasescu, M.; Rădiţoiu, A.; Raduly, M.F.; Gabor, R.A.; Căprărescu, S. Antireflective coating based on TiO2 nanoparticles modified with coupling agents via acid-catalyzed sol-gel method. Appl. Surf. Sci. 2019, 487, 819–824. [Google Scholar] [CrossRef]
  88. Bathula, C.; Nissimagoudar, A.S.; Kumar, S.; Jana, A.; Sekar, S.; Lee, S.; Kim, H.S. Enhanced photodegradation of methylene blue by Zr-doped TiO2: A combined DFT and experimental investigation. Inorg. Chem. Commun. 2024, 164, 112442. [Google Scholar] [CrossRef]
  89. Pinton, J.H.B.; Oliveira, A.F.; Huanca, D.R.; Mohallem, N.D.S. Development of an automated and cost-effective apparatus for sol-gel solution deposition using spray coating technique and its application for TiO-based photocatalytic films. Mater. Chem. Phys. 2024, 318, 129213. [Google Scholar] [CrossRef]
  90. Diaz-Uribe, C.; Florez, J.; Vallejo, W.; Duran, F.; Puello, E.; Roa, V.; Schott, E.; Zarate, X. Removal and PD of methylene blue on ZrO2 TFs modified with Anderson-Polioxometalates (Cr3+, CO3+, Cu2+): An experimental and theoretical study. J. Photochem. Photobiol. A Chem. 2024, 454, 115689. [Google Scholar] [CrossRef]
  91. Jothibas, M.; Manoharan, C.; Jeyakumar, S.J.; Praveen, P.; Panneerdoss, I.J. Photocatalytic activity of spray deposited ZrO2 nano-TFs on methylene blue decolouration. J. Mater. Sci. Mater. Electron. 2016, 27, 5851–5859. [Google Scholar] [CrossRef]
Figure 1. X-ray diffraction experimental data for (a) TiO2 and (b) ZrO2.
Inorganics 12 00320 g001
Figure 2. Raman spectra of TiO2 and ZrO2 TFs calcined at 500 °C.
Inorganics 12 00320 g002
Figure 3. SEM images of (ac) TiO2 and (df) ZrO2 TFs coated on glass substrates.
Inorganics 12 00320 g003
Figure 4. UV-Vis on glass substrates: (a,d) Absorbance spectrum, (b,e) (αhv)n vs. (hν), (c,f) K-M.
Inorganics 12 00320 g004
Figure 5. Photoluminescence spectra of (a) sample TiO2 TFs and (b) sample ZrO2 TFs.
Inorganics 12 00320 g005
Figure 6. Wettability of the TiO2 and ZrO2 TFs coatings after time.
Inorganics 12 00320 g006
Figure 7. (a) Normalized MB concentration versus UV light irradiation duration with TiO2 and ZrO2 TFs present. (b) Reaction kinetics of TiO2 and ZrO2 TF degradation via MB photocatalysis.
Inorganics 12 00320 g007
Disclaimer/Publisher’s Note: The statements, opinions and data contained in all publications are solely those of the individual author(s) and contributor(s) and not of MDPI and/or the editor(s). MDPI and/or the editor(s) disclaim responsibility for any injury to people or property resulting from any ideas, methods, instructions or products referred to in the content.

