Article

A Structure and Magnetism Study of {MnII3MnIVLnIII3} Coordination Complexes with Ln = Dy, Yb

by
Victoria Mazalova
1,2,*,
Tatiana Asanova
3,
Igor Asanov
3 and
Petra Fromme
4
1
Center for Free-Electron Laser Science CFEL, Deutsches Elektronen-Synchrotron DESY, Notkestr. 85, 22607 Hamburg, Germany
2
TWK-SENSORIK GmbH, 22880 Wedel, Germany
3
Nikolaev Institute of Inorganic Chemistry, Siberian Branch of Russian Academy of Sciences, 630090 Novosibirsk, Russia
4
Center for Applied Structural Discovery, The Biodesign Institute, Arizona State University, Tempe, AZ 85281, USA
*
Author to whom correspondence should be addressed.
Inorganics 2024, 12(11), 286; https://doi.org/10.3390/inorganics12110286
Submission received: 25 August 2024 / Revised: 24 October 2024 / Accepted: 28 October 2024 / Published: 31 October 2024
(This article belongs to the Section Coordination Chemistry)

Abstract

:
We report the research results of polynuclear complexes consisting of 3d-4f mixed-metal cores that are maintained by acetate ligands and multidentate Schiff base ligands with structurally exposed thioether groups. The presence of the latter at the periphery of these neutral compounds enables their anchoring onto substrate surfaces. Specifically, we investigated the electronic and magnetic properties as well as the structural arrangement in {MnII3MnIVLnIII3} with Ln = Dy, Yb coordination complexes using various complementary methods. We studied the electronic and atomic structure of the target compounds using the XAS and XES techniques. The molecular structures of the compounds were determined using density functional theory, and the magnetic data were obtained as a function of the magnetic field. Using the XMCD method, we followed the changes in the electronic and magnetic properties of adsorbed magnetic compounds induced by the reaction of ligands through interaction with the substrate. The complexes show antiferromagnetic exchange interactions between Mn and Ln ions. The spectroscopic analyses confirmed the structural and electronic integrity of complexes in organic solution. This study provides important input for a full understanding of the dependence of the magnetic properties and the molecule–substrate interaction of single adsorbed molecules on the type of ligands. It highlights the importance of chemical synthesis for controlling and tailoring the magnetic properties of metalorganic molecules for their use as optimized building blocks of future molecular spin electronics.

Graphical Abstract

1. Introduction

Magnetic molecules are envisaged as functional units in molecular and supramolecular spintronic devices for future information technology. An essential first step in the implementation of the molecular systems in devices is the study and control of the molecule–electrode interfaces. Specifically, the electronic, magnetic, and structural properties of the molecules depend critically on their interaction with metallic electrodes. Charge transfer and hybridization can modify their electronic structure and thereby influence the molecular magnetic moment. In extreme cases, the molecule can decompose upon adsorption. Thus, it is a priori unclear if and to what extent the geometric, electronic, and magnetic properties inherent to the molecule in the gas phase are modified upon adsorption. It can influence the spin state, the magnetic anisotropy, and, via Kondo screening, also the effective magnetic moment. Here, we propose to study the change in the local atomic, electronic, and magnetic structure of adsorbed magnetic molecules induced by an in situ reaction of the ligands which modifies the interaction with the substrate.
Metal-based coordination compounds containing paramagnetic metal ions are intensively studied in many fields of research [1,2,3]. Nowadays, manganese is one of the preferred transition metals to use as a building part of molecular magnets due to its general tendency to form molecules with a high-spin structure and significant spin anisotropy due to the presence of Jahn–Teller distortion around Mn ions [4,5]. The large spin values in Mn-based compounds result from the ferri- or ferromagnetic spin interaction and/or spin frustrations that prevent preferred spin alignments. Such ferromagnetic interactions can originate from ligands or structural characteristics that provide ferromagnetic interactions between metal centers.
Lanthanide metals are ubiquitous in technology and are used in various fields including optical fibers, alloys, luminescent devices, high temperature superconductors, permanent magnets, and catalysts [6,7,8]. In addition, recent discoveries have revealed the potential of lanthanides in the magnetism of individual atoms [9,10]. The advantage of using lanthanide atoms in the synthesis of single molecular magnets (SMMs) is that they create an energy barrier to the relaxation of magnetization due to the combination of a large spin multiplicity of the ground state and a strong Ising-type magnetic anisotropy [11,12]. Additional features, such as the electropositive nature of rare earth metals with uniform chemical properties and the ability to select a rare earth metal with a specific ion size, can lead to the ability to customize the properties of these compounds [13].
Considerable interest has been paid to the 3d-4f heteronuclear complexes, which behave like molecular magnets, due to their rich physical properties and potential applications [14,15,16]. It is expected that the magnetic properties of 3d-4f complexes will differ from those of transition metal ions due to the large angular momentum of lanthanide atoms, and that magnetic interactions between 3d and 3d, 3d-4f, and 4f-4f ions in heterometallic complexes are quite complex, especially for those with high nuclearity. Such combinations of metals can result in high-spin ground states via the presence of 3d metal ions in combination with the large single-ion anisotropy specific of 4f ions. Despite the anisotropy that is usually efficiently introduced by the rare earth ions, a potential quenching of SMM properties in 3d-4f heteronuclear complexes can be explained by the very weak coupling between 4f-4f ions compared to that of 3d-3d ions [17]. It was recently demonstrated that the observation of SMM behavior cannot be described using only spin and anisotropy parameters; the general symmetry of the complex should be carefully considered, in particular, with the orientation of the anisotropy axes with respect to lanthanide ions [18,19]. A recently published study of two Schiff base compounds shows that the enhancement of SMM properties in 3d-4f heteronuclear complexes requires a strong exchange interaction between the metal sites, and the presence of both 3d and 4f ions in one system may reduce this interaction [20]. Therefore, to better understand and make an independent assessment of the influence of molecular geometry and the type of metal ions on the magnetic properties of heteronuclear 3d-4f complexes, it is necessary to study the wide spectrum of such combinations.
Herein, we report on the characterization of two polynuclear complexes consisting of 3d-4f mixed-metal cores, which are maintained by acetate ligands and multidentate Schiff base ligands (L·SMe-) with structurally exposed thioether groups (-SMe). The presence of the latter at the periphery of these neutral molecules enabled the anchoring of antiferromagnetic (AFM) molecules to substrate surfaces. We use the improved structural, thermal, and redox stability of the molecular magnets to achieve their intact deposition from the solution onto the metallic electrodes and, eventually, to follow the changes in the key magnetic characteristics of anchored individual molecules. This knowledge is required in order to engineer electrically accessible metal complexes (molecular spin qubits, spin transistors, etc.) for future compact and energy-efficient nanodevices.
We also demonstrate how systematic studies supported by a combination of X-ray spectroscopy techniques, such as X-ray absorption spectroscopy (XAS), X-ray emission spectroscopy (XES), and X-ray magnetic circular dichroism (XMCD), with theoretical analysis using density functional theory (DFT) to develop an understanding of the interactions within molecular magnets.

2. Results and Discussion

2.1. X-Ray Crystal Structure

The synthesis procedure and the detailed structure description of similar heptanuclear manganese–ytterbium complexes is described in [21]. In the resulting geometry, all four manganese ions are coordinated in a distorted octahedral fashion, where the three Mn(II) ions are in a NO5 coordination mode and form a triangle with non-binding MnII…MnII. The Mn(IV) ion is in the center of this triangle; its coordination environment is saturated by six oxygen atoms and the non-binding MnII…MnIV. The eightfold O8-coordinated Dy(III) ions form a triangle above the Mn(II)-triangle, which is shifted and smaller with non-binding Dy…Dy. This Dy-triangle is capped by a discrete hydroxyl group with a Dy–O(H) bond. The three µ4-oxygen atoms form a triangle between the manganese and dysprosium layer and connect these. Altogether, this leads to a structure of twisted triangles of dysprosium(III) and manganese(II) ions (see Figure 1).

2.2. Mn K-Edge XAS

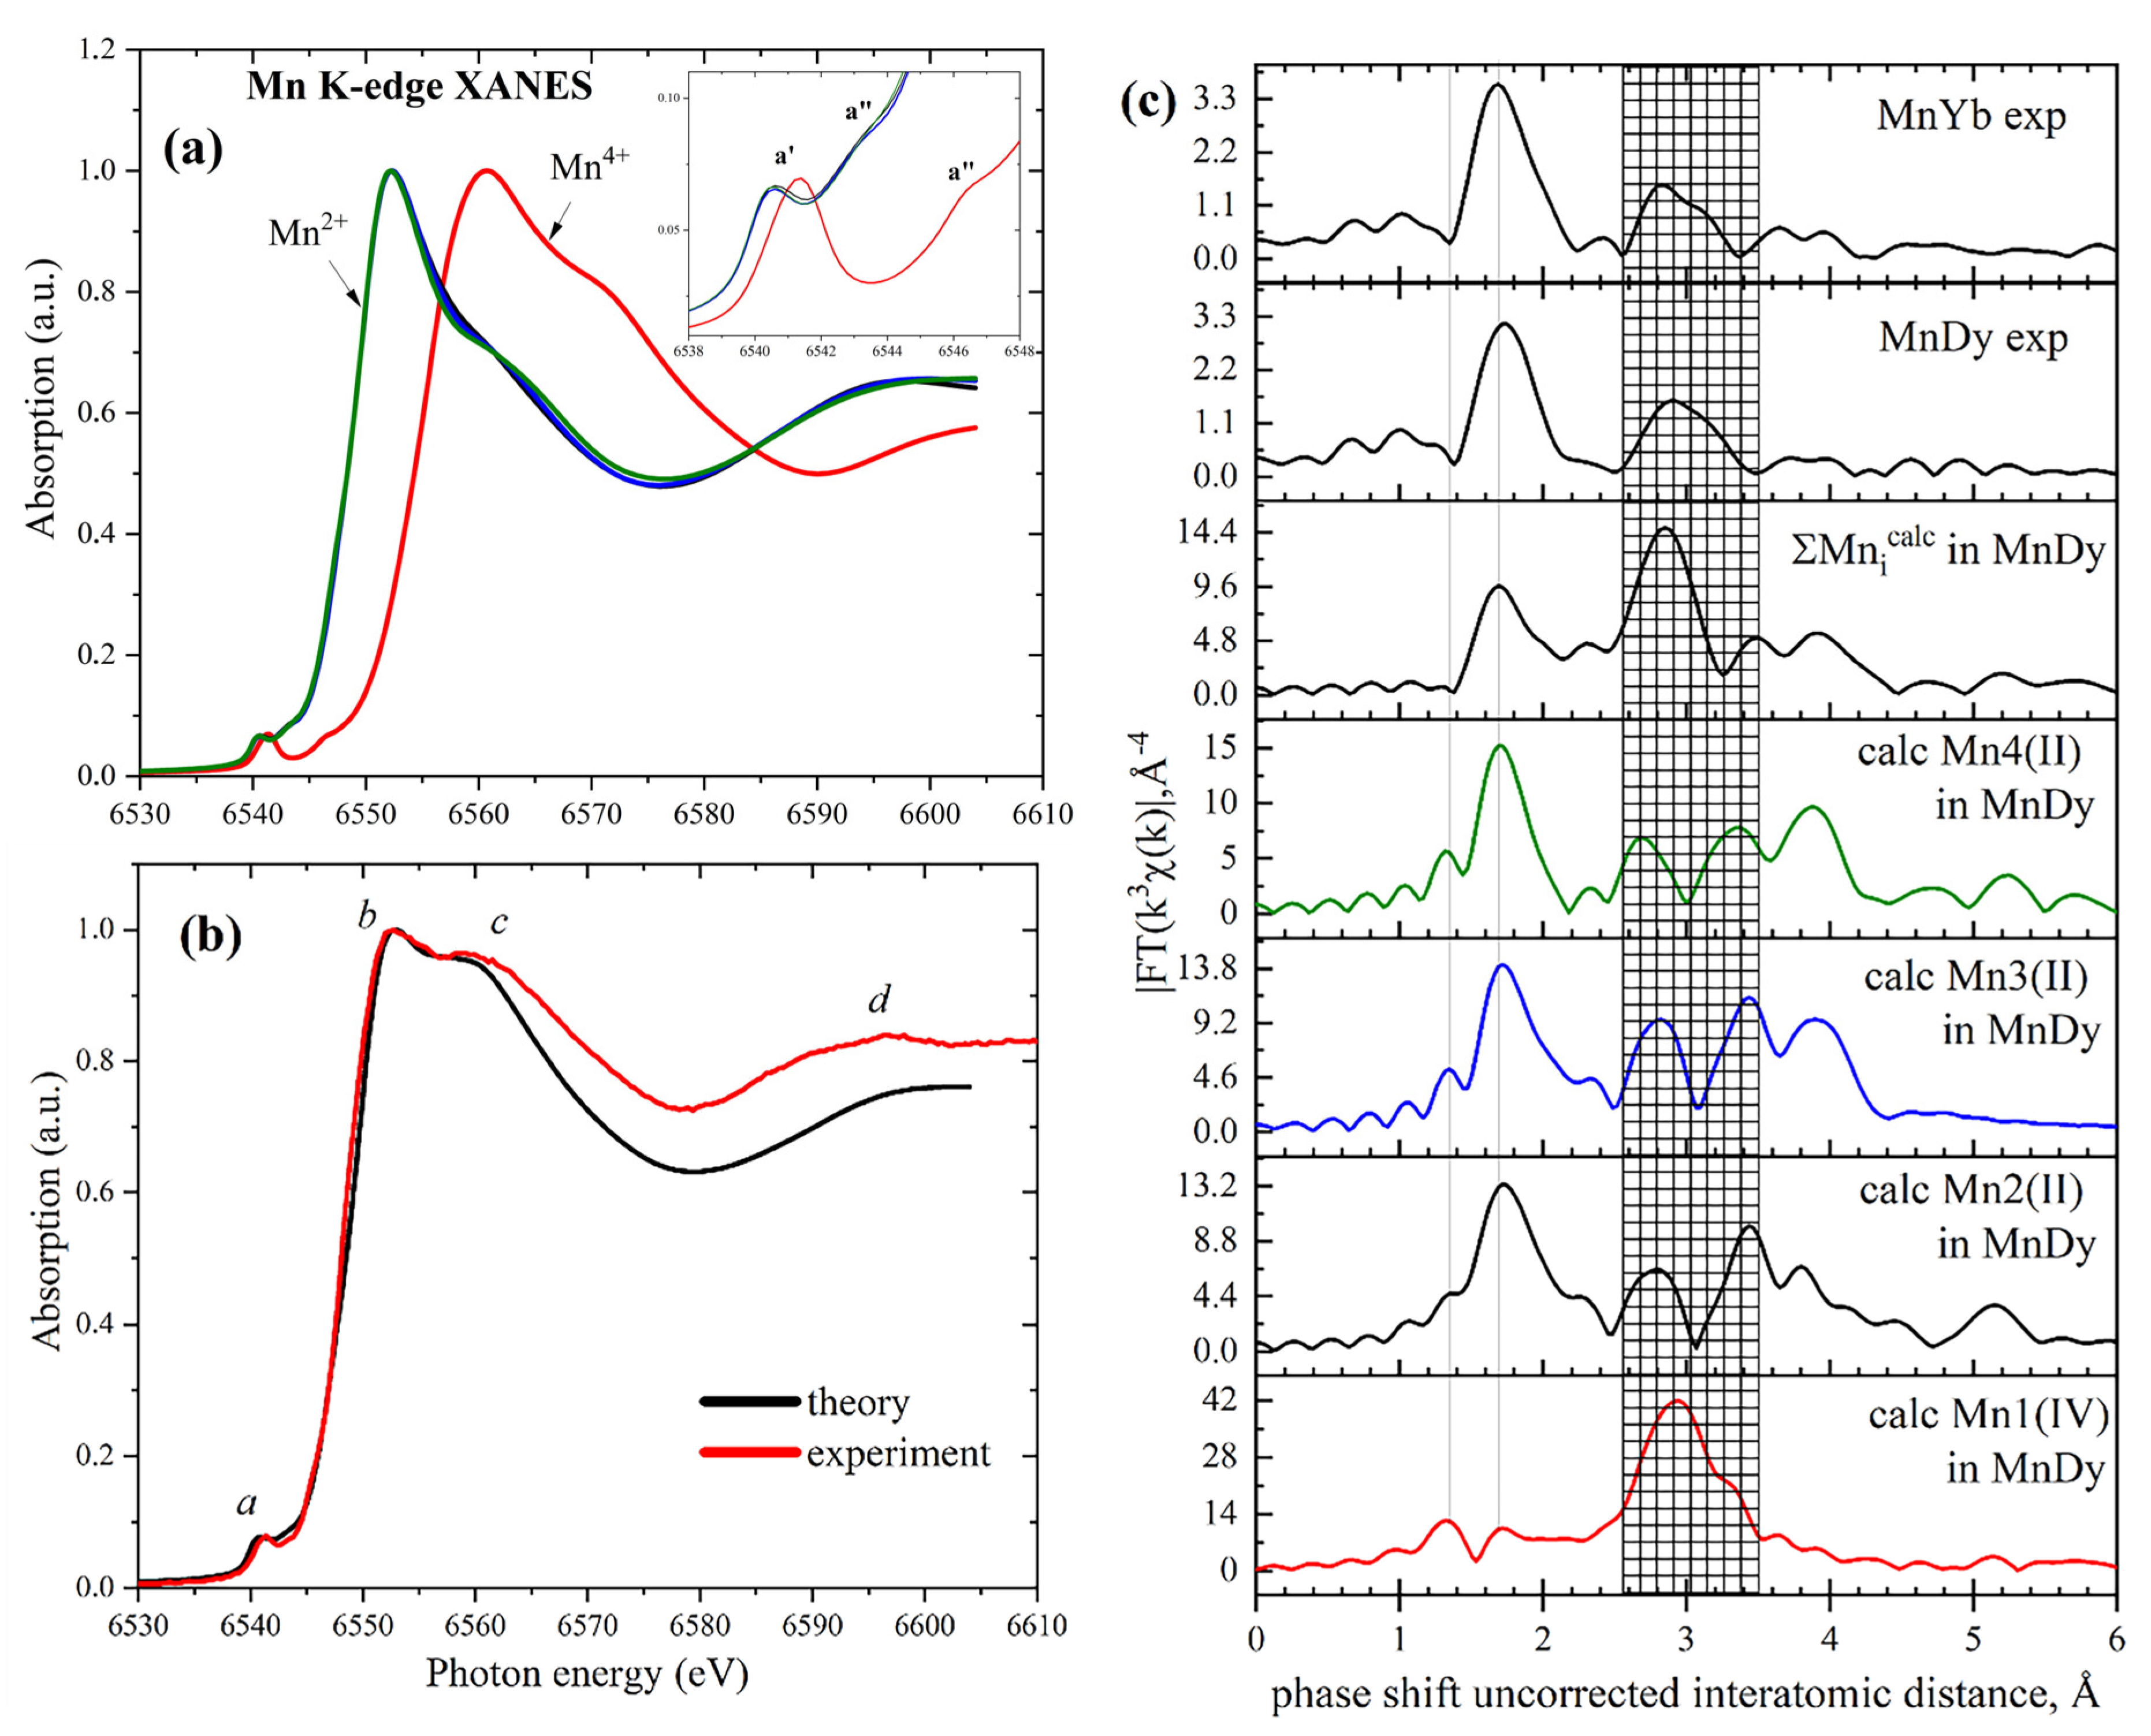
To verify the atomic structure around the absorbing atom, we compared the experimental Mn K-edge spectra measured at the P64 beamline [22] of the PETRA-III synchrotron (see Section S.2 for the experimental details) with a multiple scattering theoretical simulation using FDMNES code [23]. Figure 2a,b show the comparison of the experimental Mn K-edge XANES spectrum with the theoretical spectra of the {MnII3MnIVDyIII3} coordination complex calculated under the Green’s formalism in the muffin-tin approach. For the calculation of XAS spectra, the geometrical structure of the {MnII3MnIVDyIII3} coordination complex derived directly from XRD data has been used (atomic coordinates are presented in the Supporting Information). Due to the presence of heavy Dy atoms, both dipole and quadrupole approximations as well as relativistic effects have been included in the calculated model. The theoretical XAS spectra calculated for each of the four Mn ions have been normalized to the intensity of the main line and are shown in Figure 2a. The spectrum of the higher oxidized Mn4+ ion (red curve) is shifted to the higher energies relative to the other three spectra of Mn2+ ions. The inset in Figure 2a shows that the feature a in the theoretical spectra of Mn2+ and Mn4+ ions splits into two main contributions, a′ and a″, with the distinct energy difference given by the core-hole potential. The weighted total spectrum of the spectra of the four Mn atoms is shown in Figure 2b together with the experimental one. The pre-edge feature a at ~6539–6544 eV is observed in both experimental and theoretical spectra and originates from local and non-local transitions of Mn ions in a distorted octahedral environment. Local transitions are typical for complexes with octahedral symmetry around the absorbing atom, and they involve electronic transitions from the 1s core levels to the empty 3d levels. In case of broken inversion symmetry, the metal 3d and 4p states mix and direct dipole transitions into the 4p character of the 3d band, which can appear as non-local transitions. Features b and c can be attributed to the transitions of the 1s core electron to the 4p1/2 and 4p3/2 unoccupied levels with a contribution from the Mn4+ absorption line. The higher energy region d refers to the transitions to the unoccupied hybrid metal–ligand states. It is worth noting that the Mn K-edge XANES spectrum in Figure 2b calculated in a multiple scattering mode shows very good agreement with the experimental spectrum, which proofs the correctness of the used atomic model for the {MnII3MnIVDyIII3} coordination complex.
For materials without long-range order, such as molecules, the Fourier analysis of the extracted EXAFS oscillations is often the only practical way to gain insight into the local environment around Mn ions. The module of Fourier-transformed Mn K-edge EXAFS being a prototype of the partial pair distribution function of atoms around the absorbing atom provides information about the distances between Mn and the atoms of the nearest coordination shells with the accuracy of the phase correction (which is calculated by FEFF and accounted for in the fitting). Figure 2c shows the module of the Fourier transform (MFT) of the experimental Mn K-edge EXAFS spectrum. The uncorrected MFT phase of K-edge EXAFS for the {MnII3MnIVDyIII3} coordination complex shows two peaks at 2.2 and 2.6 Å, corresponding to Mn-O and Mn-N coordination shells, respectively. The prominent peaks at the distances around 3.1 and 3.6 Å are related to the Mn-Dy and Mn-Mn coordination shells. It is clearly seen that the Fourier transforms (FTs) of the experimental EXAFS spectra of the {MnII3MnIVDyIII3} and {MnII3MnIVYbIII3} coordination complexes are similar and coincide with the FTs calculated by EXAFS for each of the four types of Mn atoms averaged over them (Mnicalc). The shape of the FT peak at 3.0 Å is mainly determined by scattering from metal atoms—three Mn and three Dy—around Mn1(IV) at a close distance from each other (3.1–3.2 Å). Unlike tetravalent manganese, around divalent manganese atoms (Mn2, Mn3, and Mn4), the Mn and Dy/Yb atoms have a wide range of interatomic distances, varying from 3.2 to 3.98 Å (for example, Mn4-Mn1 at 3.2 Å, Mn4-Dy3 at 3.56 Å, Mn4-Mn1 at 3.58 Å, and Mn-Dy3 at 3.99 Å). As a result, two peaks appear on the FTs at 2.8 and 3.4 Å, with a noticeably smaller amplitude compared to a similar but single peak at 3.0 Å around Mn1.

2.3. Mn L2,3—Edge XAS

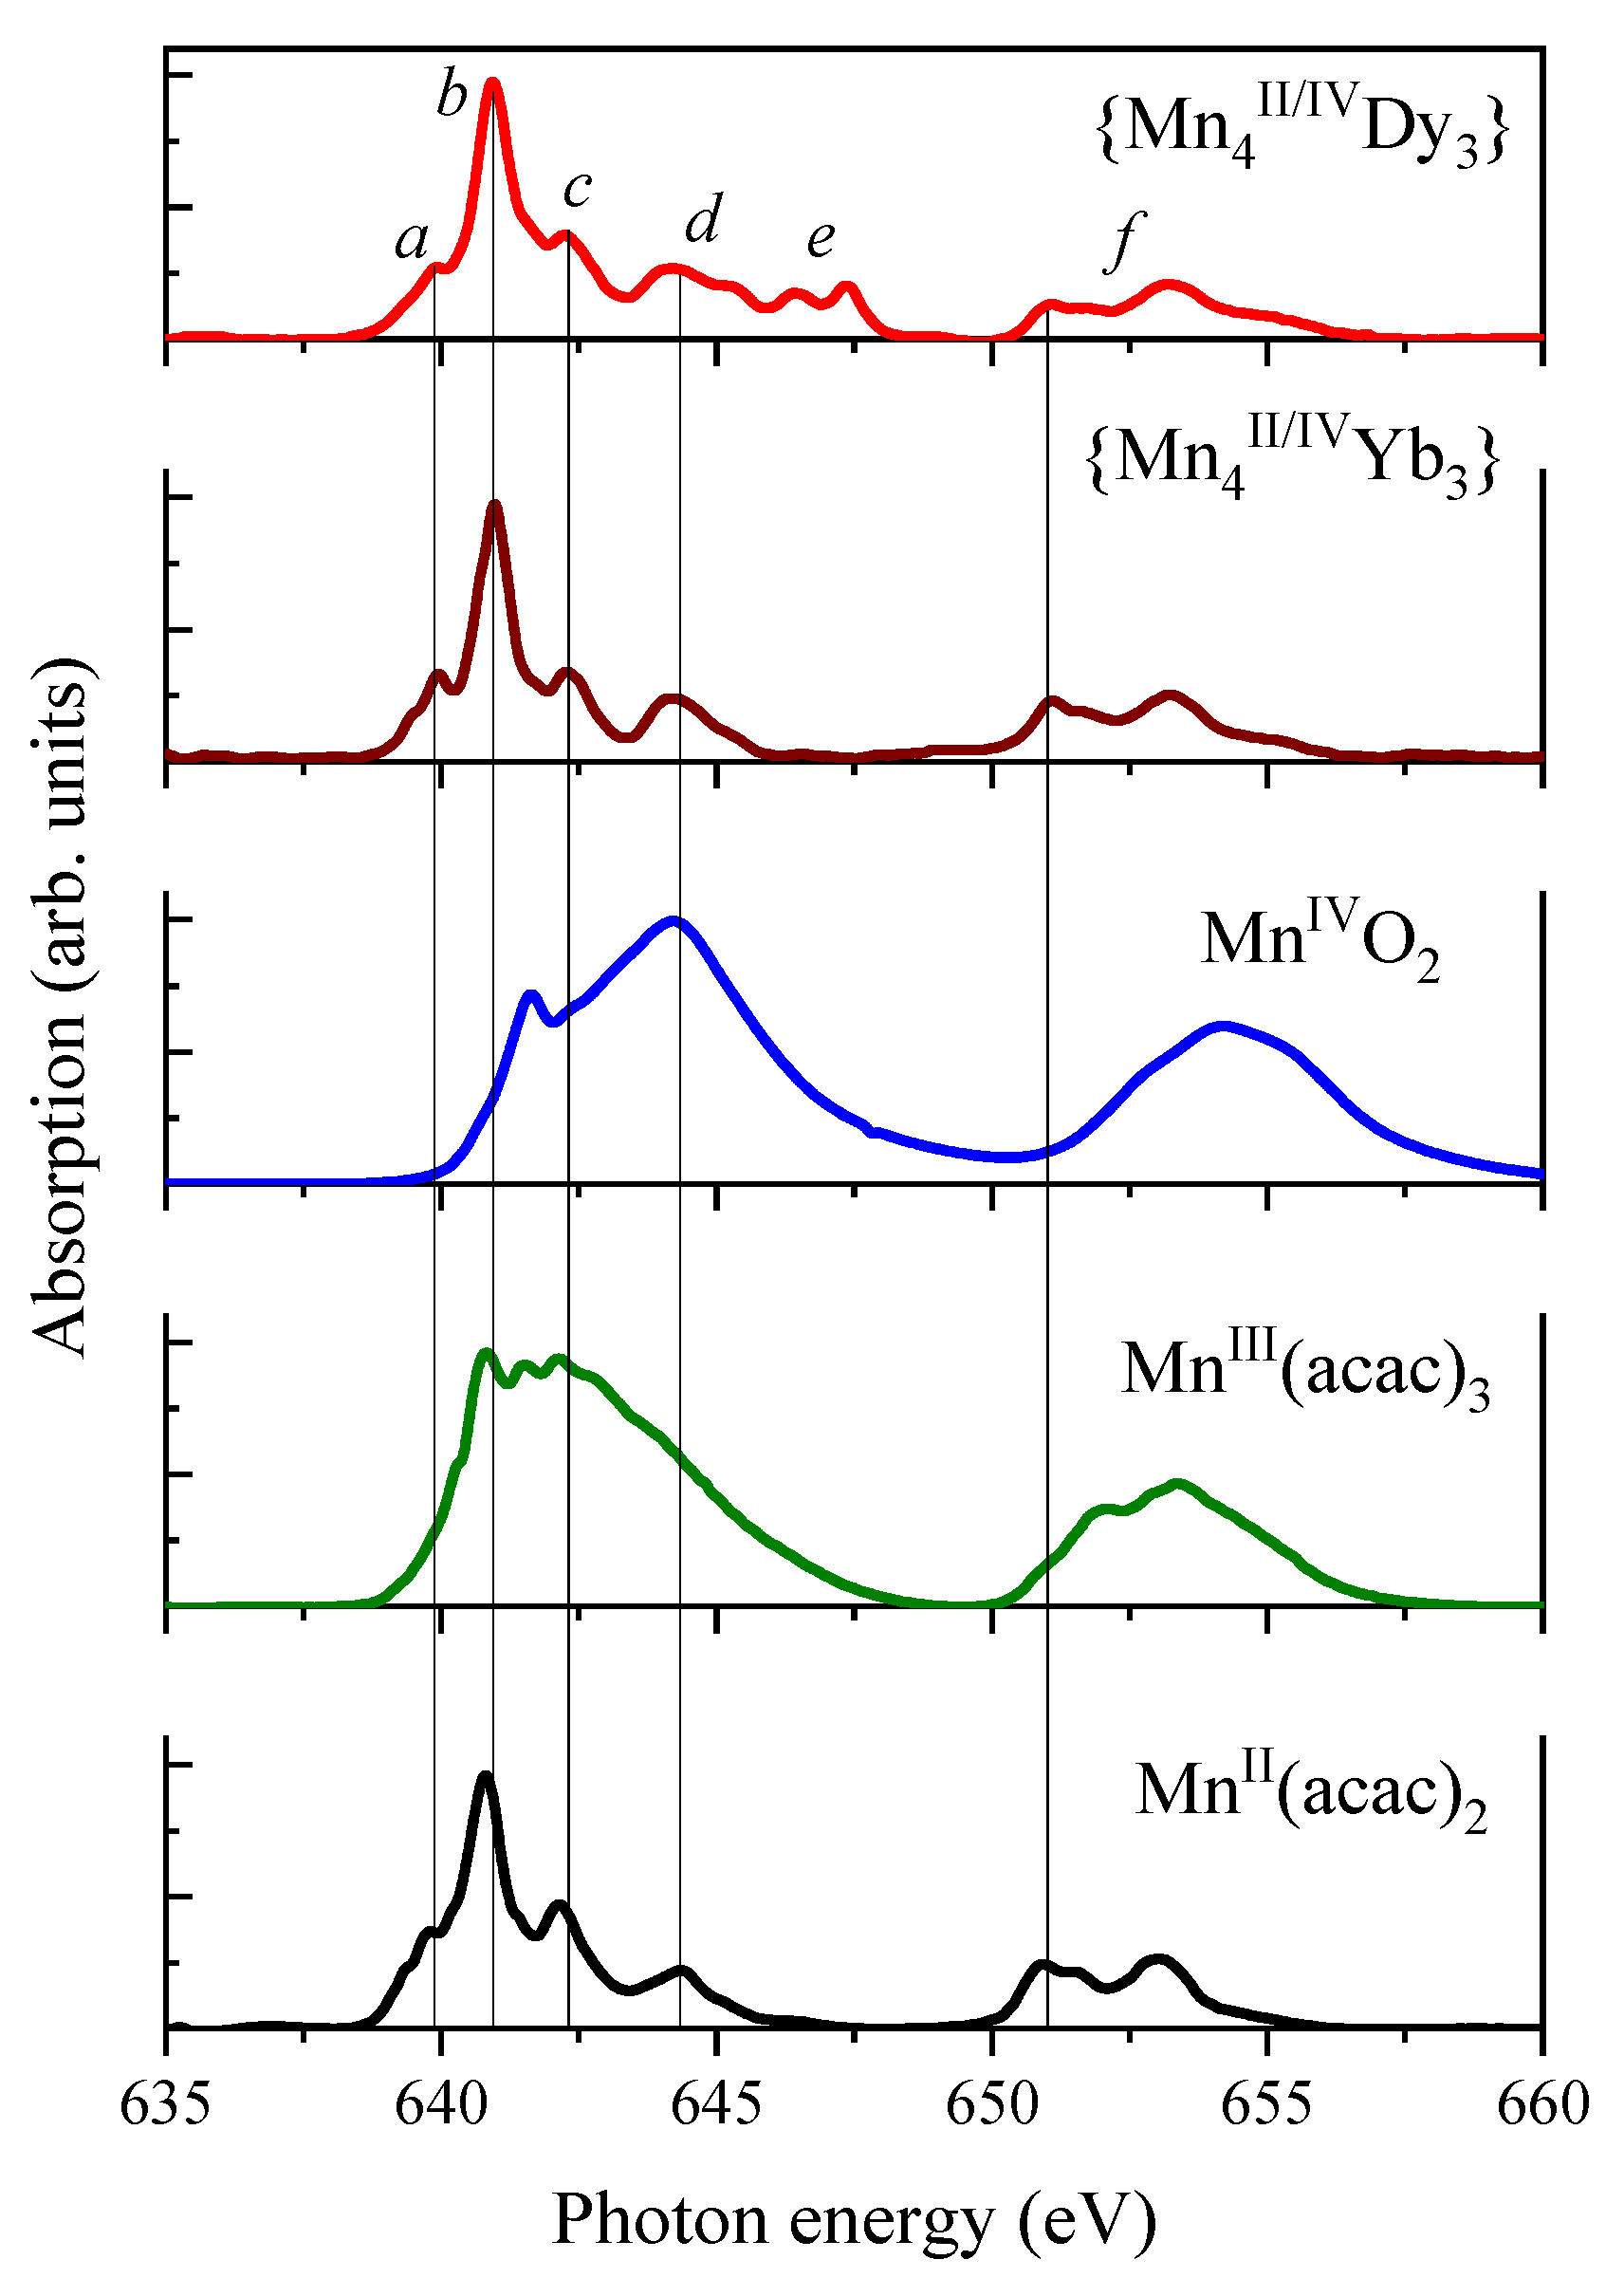
L2,3 XAS has been applied to probe excitations into unoccupied states with mainly the Mn 3d character of {MnII3MnIVDyIII3} and {MnII3MnIVYbIII3} coordination complexes and the reference Mn-based compounds, as shown in Figure 3. The two main features at 640.9 eV (b) and 653.2 eV (f) originate from the resonance excitation of the 2p3/2 (L3) and 2p1/2 (L2) core levels of Mn ions. The peak position and shape of L2,3 XAS spectra directly depend on the local geometry and electronic structure around Mn ions, providing information on their valence states. Figure 3 shows a comparison of the Mn L2,3-edge XAS spectra of the {MnII3MnIVDyIII3} coordination complex with those of the reference Mn compounds with a similar organic environment and various Mn valence states: Mn2+acetylacetonate (Mn(acac)2), Mn3+acetylacetonate (Mn(acac)3), and Mn4+ oxide (MnO2) (all samples were purchased from Sigma Aldrich). All spectra were measured at the RGBL beamline of the BESYY II synchrotron (Berlin, Germany) [24] under the same experimental conditions (see Section S.2 in the Supporting Information for details). Although our Mn L2,3-edge XAS spectra are generally consistent with previous reports, plotting the spectra of oxides together delivers systematic information on the valence, spin states, and covalence of the materials. The Mn L2,3-edge XAS spectrum of the {MnII3MnIVDyIII3} coordination complex appears to be very similar to the spectrum of the Mn2+ compound (features ad) despite the region at around 647 eV (feature e). The presence of Mn4+ ions increases the overall background and contributes to the position of the white line and to the shape of the feature d at 643 eV on the spectrum of the {MnII3MnIVDyIII3} coordination complex.
As is expected, the resulting XAS spectra of the {MnII3MnIVDyIII3} and {MnII3MnIVYbIII3} coordination complexes, in general, show good agreement with the experimental spectra of Mn2+ and Mn4+ compounds. However, the XAS spectrum of the {MnII3MnIVDyIII3} complex has additional peaks around 647 eV, which do not appear either in the spectrum of the {MnII3MnIVYbIII3} coordination complex or in the spectrum of the presented Mn compounds. The difference between the two studied complexes is in the type of the lanthanide atom—compared to the Dy3+ ([Xe]4f96s2), Yb3+ ([Xe]4f146s2) has a fully occupied f-shell. Consequently, these additional peaks can appear due to the hybridization of unoccupied Mn and Dy orbitals, even though these states are often considered to be very localized. The profound evidence of the hybridization-driven or combined hybridization/superexchange-driven magnetic exchange interaction in 3d-4f compounds has been previously reported elsewhere [16,25,26]. To identify such an interaction based on the contribution of different atomic orbitals, a density of states (DOS) analysis by two different methods—multiple scattering theory and DFT—has been performed, and the results are presented below.
Atomic multiplet calculations with incorporated crystal field theory are often used for the theoretical calculation of the L2,3 and M4,5 absorption spectra of metals to analyze experimental data [27,28]. Multiplet calculations of Mn ions in different oxidation states and in different symmetries have been reported earlier [29]. Based on the previous results, the peaks ae of the 2p3/2 transition can be assigned to the multiplet Mn 3d level splitting by the crystal field. The 2p1/2 multiplet peaks are not observed clearly because additional Auger decay processes smear their detailed structures.
XAS spectra can be approximated by Fermi’s golden rule, which refers to the transition probability of the excited core electron to the unoccupied states of the absorbing atom.
I X A S   ~   f Φ f | e   ^ r | Φ i 2 δ E f E i ω  
where indexes i and f refer to initial and final states; ħꞷ is the incident photon energy; Φi and Φf are the initial and final state wave functions; e   ^ r is the electric operator; and δ represents the electronic density of unoccupied states.
This equation states that to calculate the transition probability of the absorption of an X-ray photon, one must multiply the square modulus of an element of the perturbation matrix between two states by the density of states for a certain transition energy. Such a prediction of the absorption spectrum is often associated with a large amount of computation of the eigenstates of the set of possible final states, transition probabilities, and density of states. However, this provides a good first step in understanding the origin of the XAS peaks and allows for a high-quality image of the spectrum. Thus, it is possible to qualitatively describe the XAS spectrum by comparing the XAS peaks and the predicted densities of the final states.
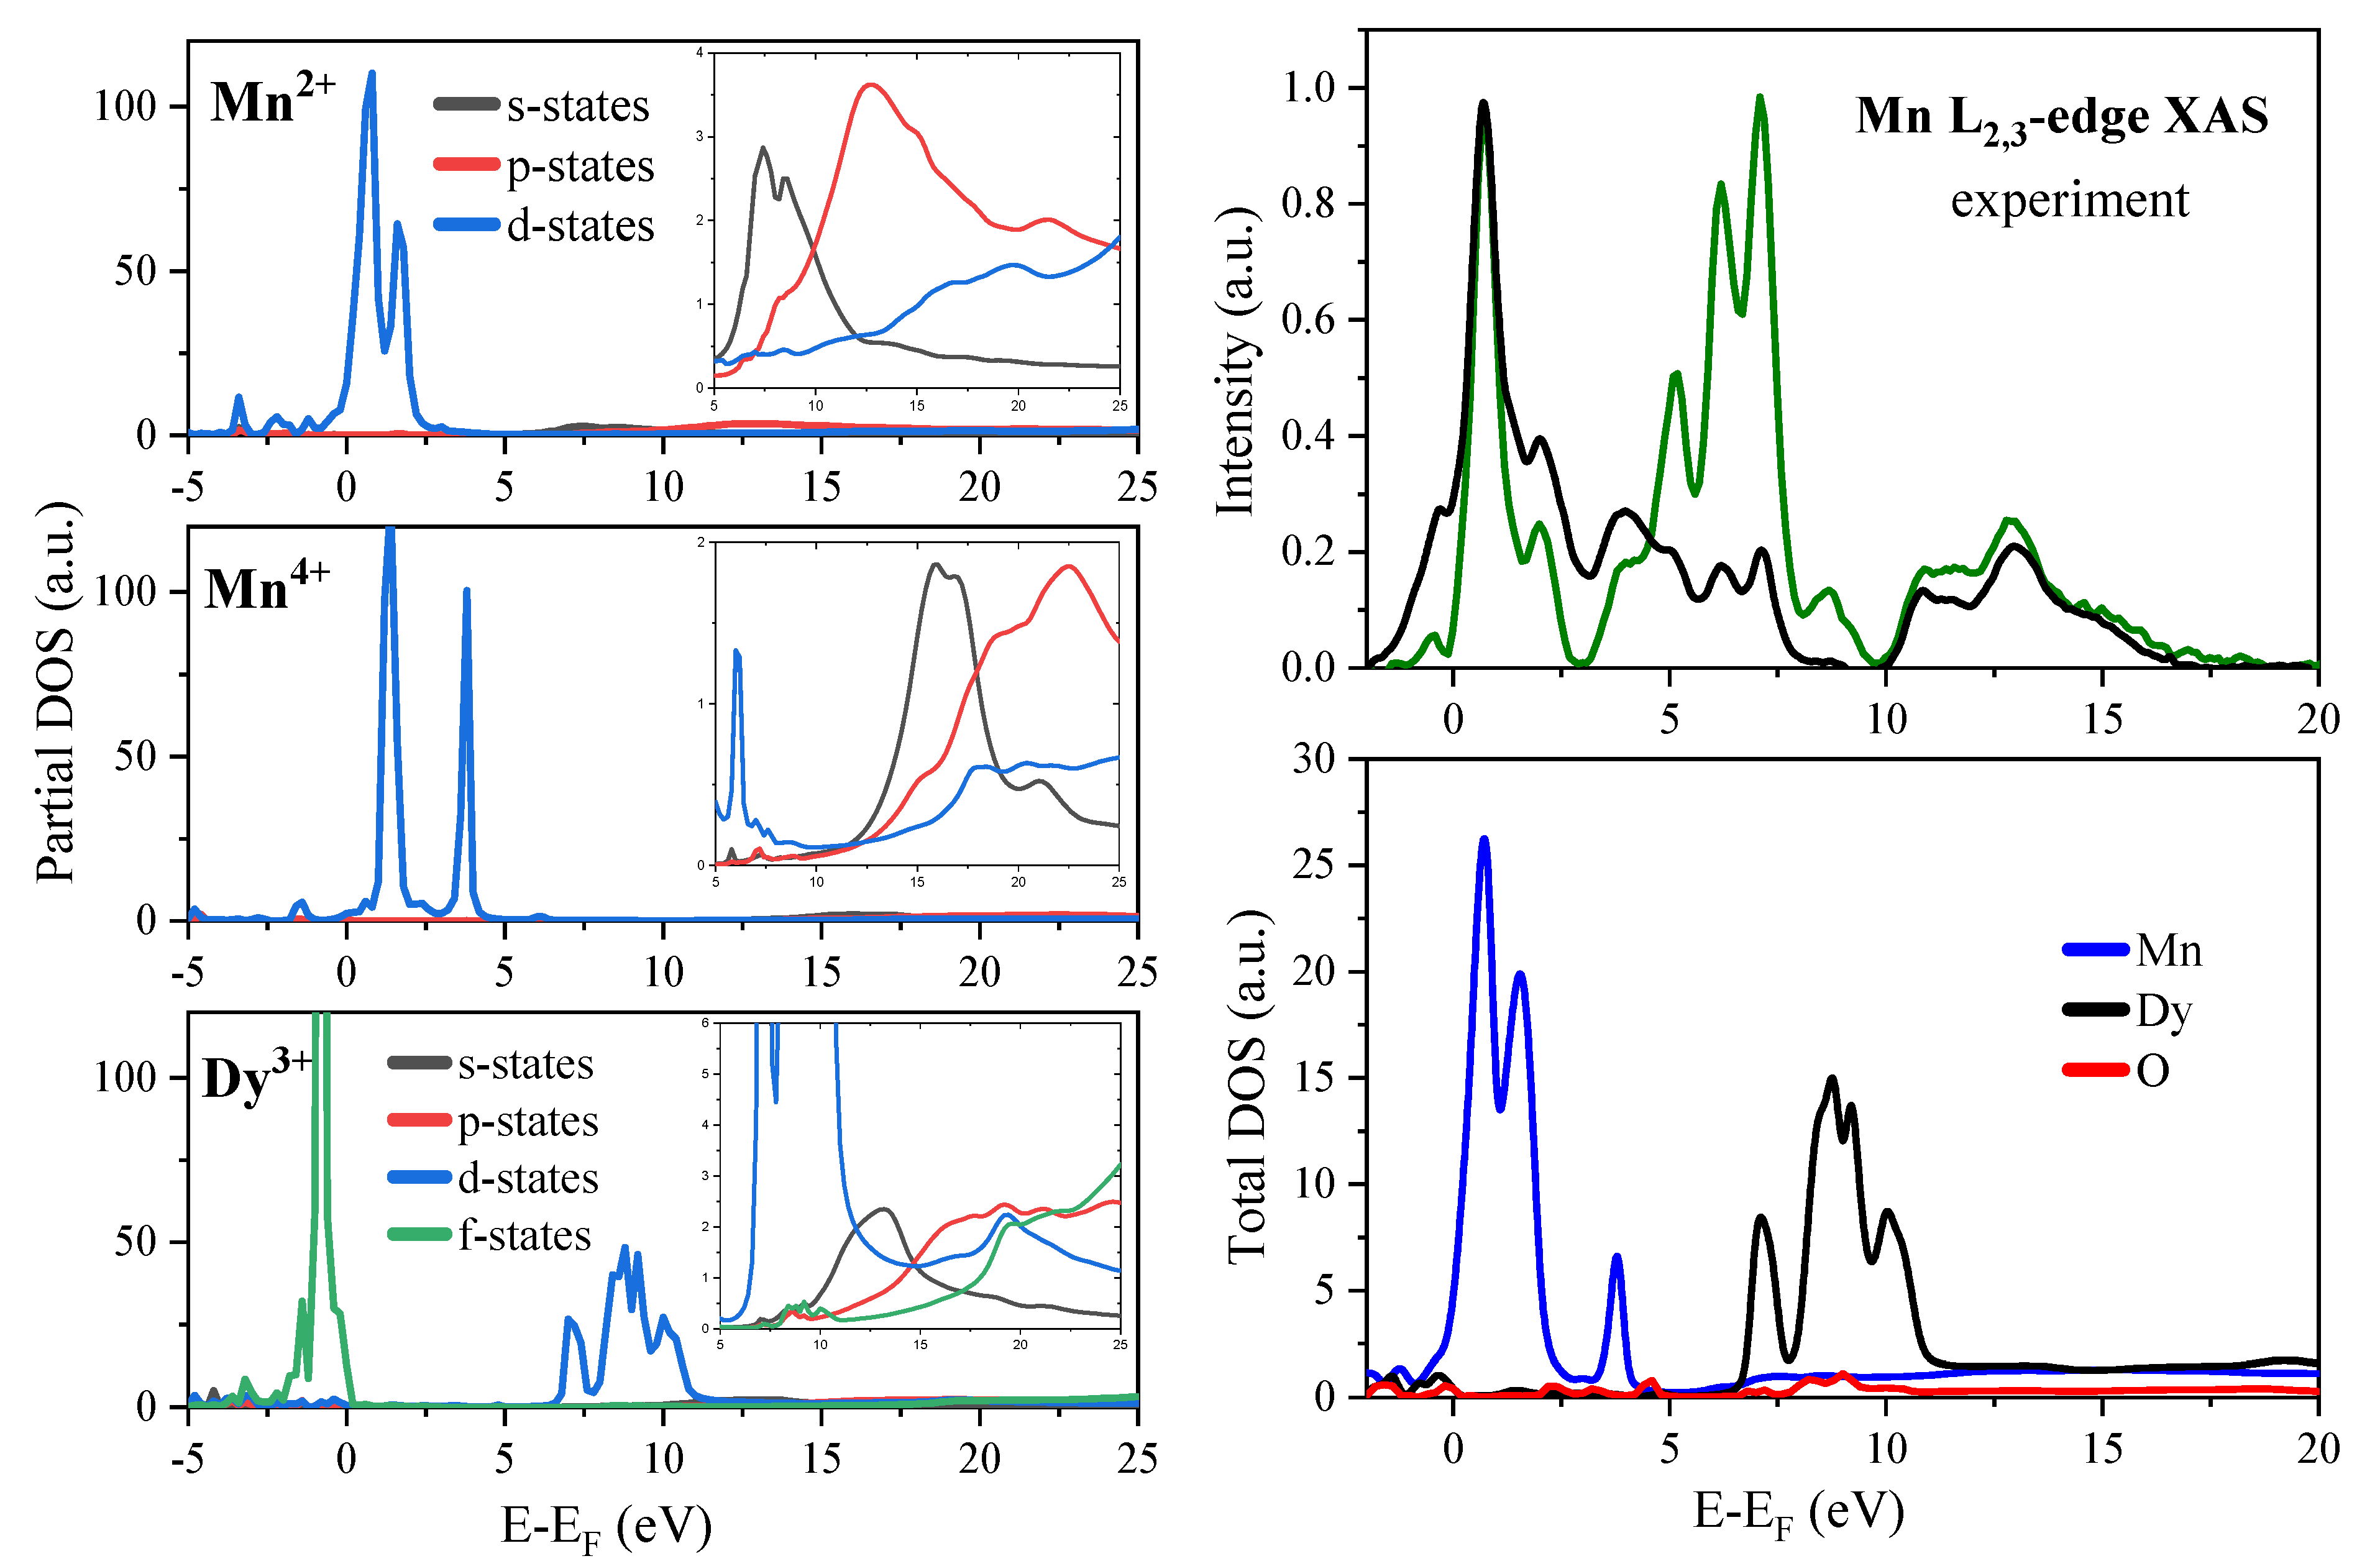
The origin of features in experimental XAS spectra was interpreted using the total and partial DOS calculated with the FDMNES 2019.11.26 software. The density of states analysis was used to obtain insight into the electronic structure and possible interactions in the studied {MnII3MnIVDyIII3} coordination complex. As XAS spectra probe the unoccupied electronic states of the absorbing atom, we show the density of states that represent the electronic states of Mn and Dy atoms above the Fermi level. While the correct energy position and intensities of peaks on X-ray absorption spectra cannot simply be reproduced by DOS spectra, we are able to track the unoccupied electron orbitals, transitions to which contribute to spectral features. From Figure 4, one can see that the Mn L3-edge rises from the dipole-allowed 2p-3d transitions above the Fermi level. At the energies of 5–10 eV above the Fermi level, the unoccupied states are dominated by s- and p-characters of Mn electronic states influenced by the contribution of the p-states of the surrounding oxygen atoms and sharp peaks at 8–10 eV of the Dy 4d character. The Fermi level in all theoretical calculations presented in this paper corresponds to the highest occupied energy level.
In the right panel of Figure 4, we compare the experimental spectrum with the Mn and Dy total density of states. The intense peaks on the experimental spectrum originate primarily from the hybridization of Mn s-, p-, and d-orbitals with d-states of Dy. Since Mn and Dy atoms are bridged by oxygen atoms, the presence of oxygen electronic states is also evident. Based on the presented analysis of the projected densities of states, we can assume the presence of an intra-molecular interaction between Mn and Dy ions via the nearest oxygen atoms.

2.4. Electronic Structure

The left panel of Figure 5 shows partial densities of states of Mn and Dy ions. All theoretical spectra in Figure 5 were shifted so that the calculated energy value of the HOMO orbital corresponds to zero. Our DFT computational results are very similar to the ones obtained by the FDMNES calculations. At energies around 5–10 eV above the HOMO-LUMO levels, the main contribution to the hybridization of electronic states is made by s-, p-, and some d-states of Mn, O p-states, and Dy d-unoccupied states. Near the HOMO level, the Mn 3d and Dy 4f characters predominate. In the right panel of Figure 5, the experimental XAS spectrum of the {MnII3MnIVDyIII3} coordination complex is compared with the total densities of states (TDOS) of the Mn and Dy atoms. The experimental spectrum is shifted so that its L3 line corresponds to the position of the unoccupied states of the Mn atoms. As seen from the partial DOS, molecular orbitals near the Fermi level are mainly localized on the 3d states of the Mn4+ ion and the 4f states of Dy, as well as on the surrounding oxygen atoms, suggesting a possible interaction between the Mn and Dy states via oxygen atoms.
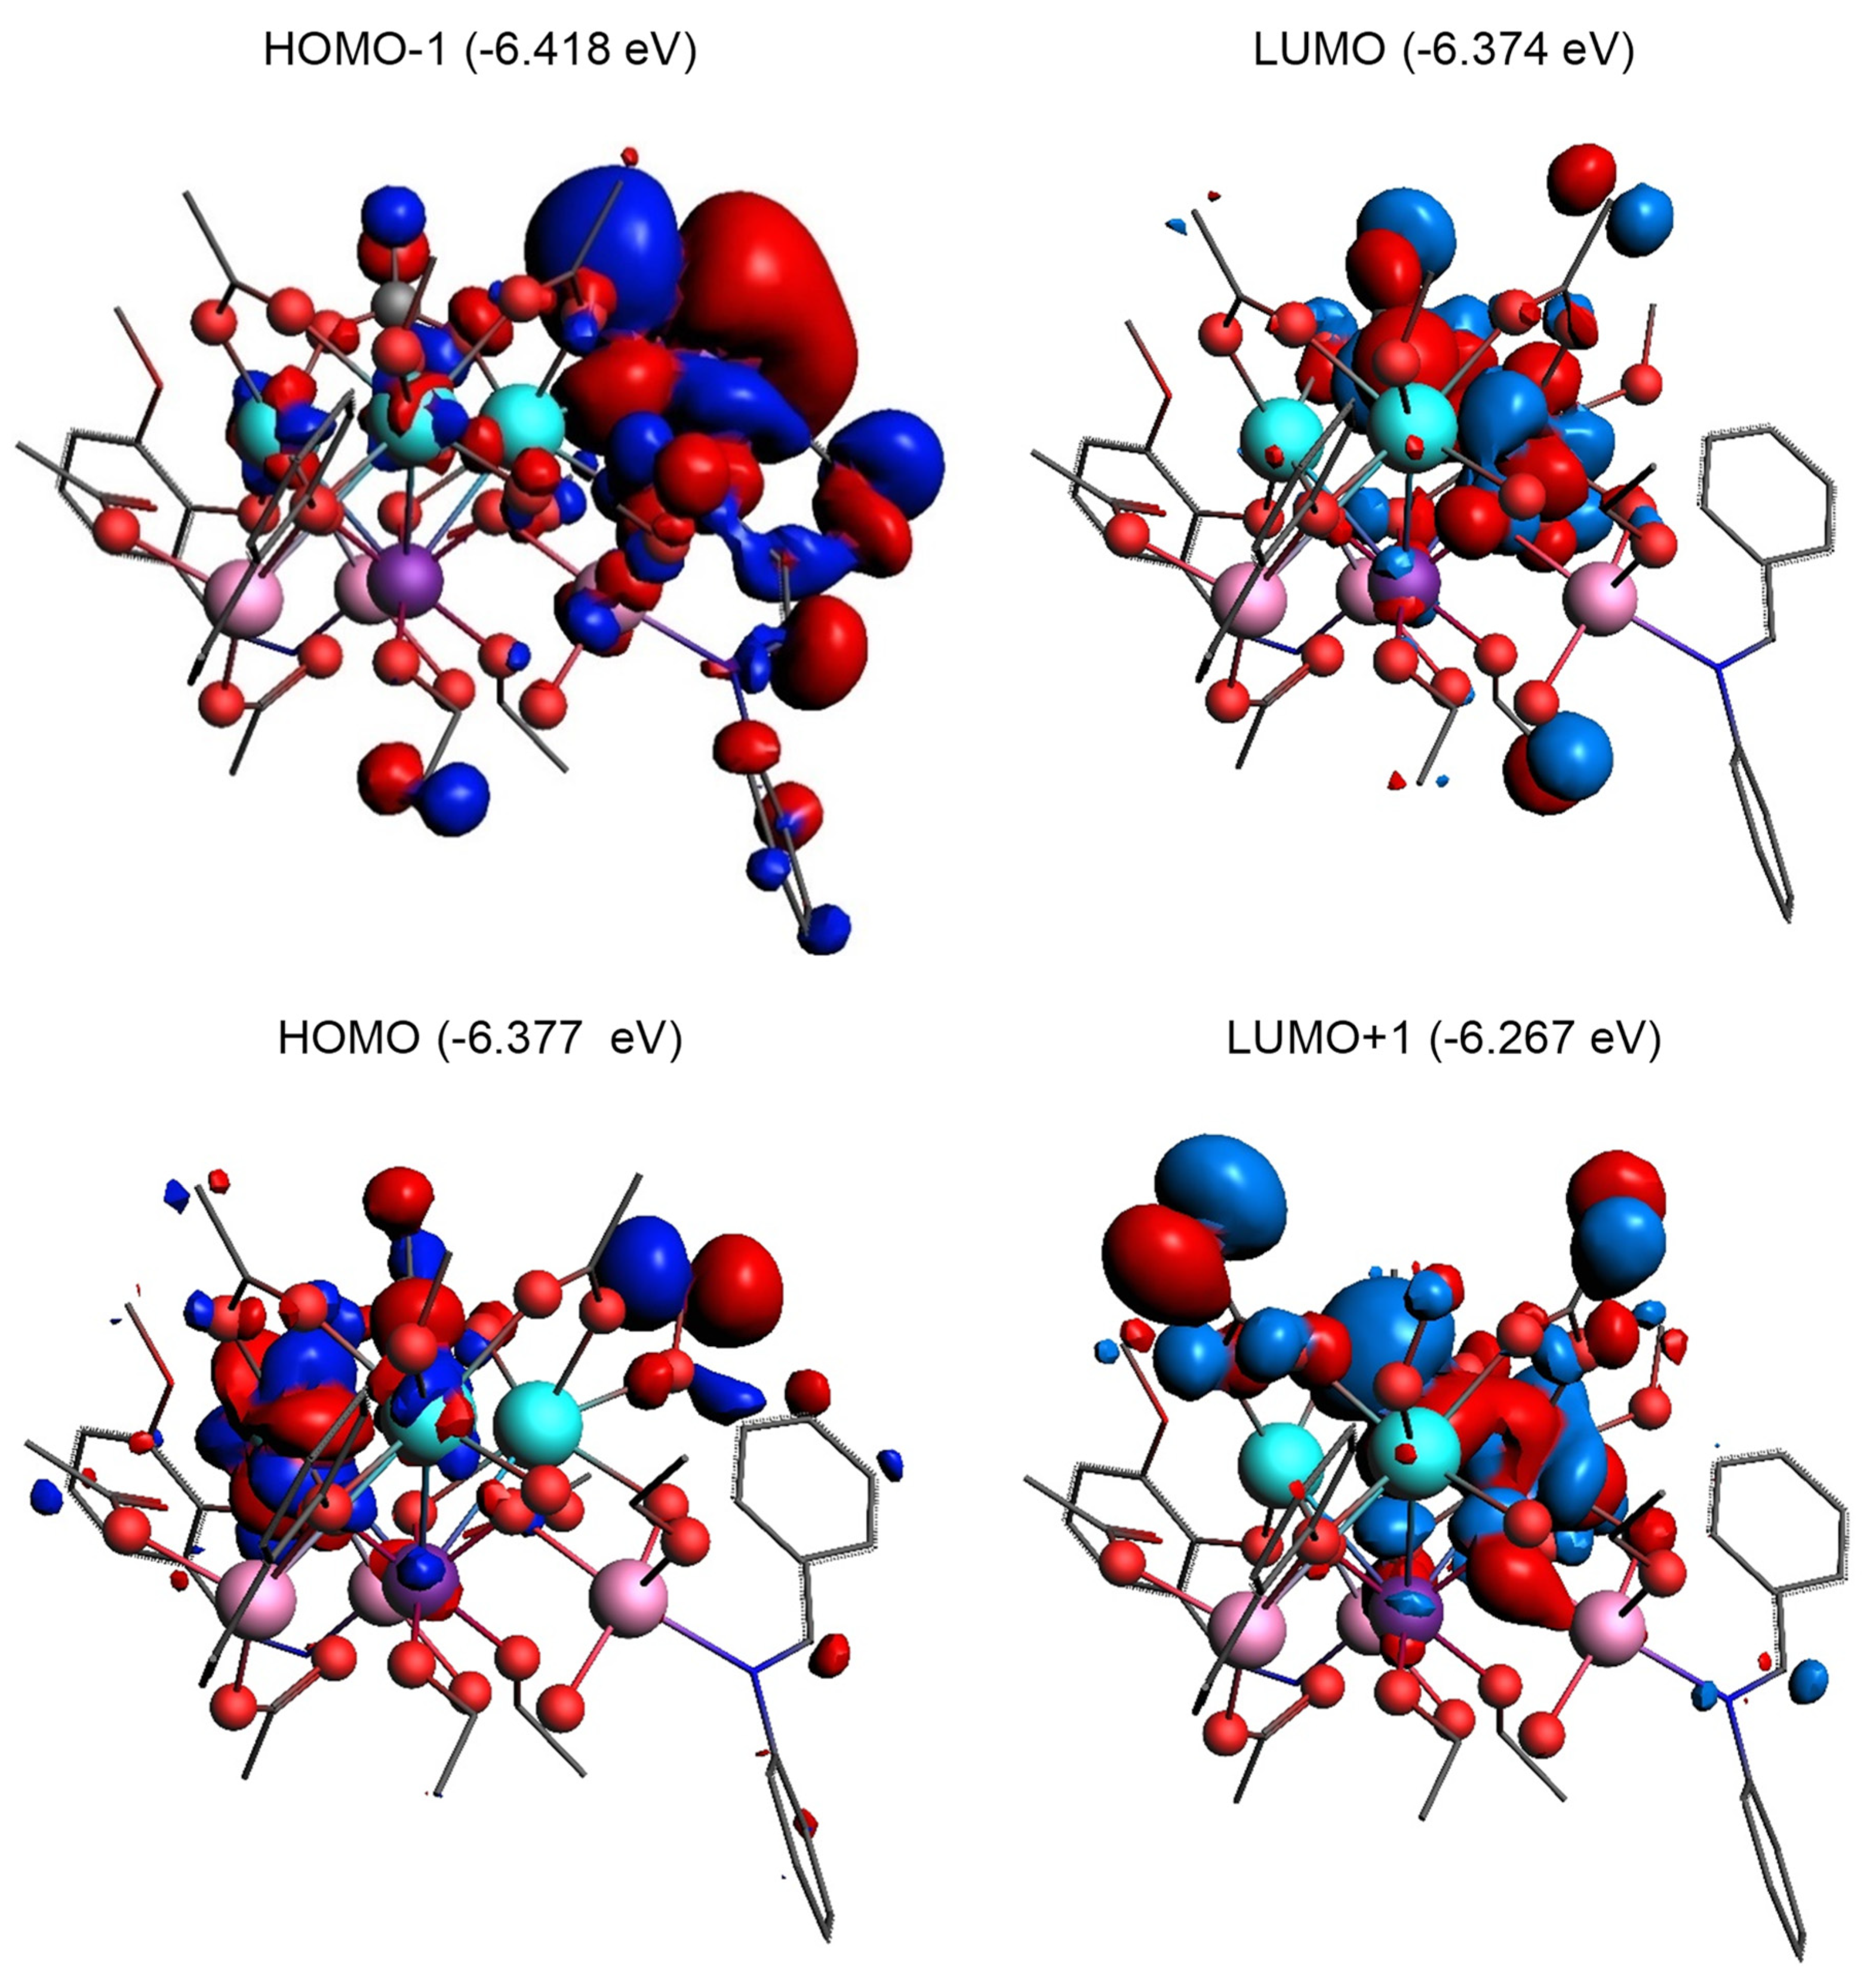
A contribution of the individual atoms to the HOMO-1, HOMO, LUMO, and LUMO-1 molecular orbitals are presented in Figure 6. The detailed composition of the frontier MOs as well as the selected MOs contributing to the spectral features in the energy range 0–4 eV above the Fermi energy can be found in Tables S3 and S4 in the Supporting Information.
It is known that the magnetic exchange between different metal centers can occur through various mechanisms [30], often competing, such as direct exchange, superexchange, ligand-mediated exchange, and others. Ultimately, the magnetic properties depend on the mechanism for the propagation of spin information from a particular metal center to neighboring atoms. More specifically, magnetism is inherently caused by non-local effects that can be triggered through chemical bonds or space. Following the geometry of the studied complexes, two mechanisms of interaction between Mn ions are relevant—the concept of double exchange for eg electrons and superexchange for t2g electrons between two neighboring Mn ions bound by one O2− ion [31]. It should be noted that in our {MnII3MnIVDyIII3} coordination complex, the angle between tetravalent manganese and each of the three divalent ions is 90°, which, according to Goodenough [32], is generally subsidiary to direct AFM exchange interactions between t2g orbitals on Mn sites. As shown in [33,34,35], for the case of a metal–oxygen–metal bond angle of 90°, the Anderson superexchange interaction (when an electron is efficiently transferred from one metal ion to another metal ion) is much weaker than the superexchange interaction (where two electrons are transferred from an oxygen ion ligand, one to each of the neighboring metal ions). When the Mn-O-Mn bond angle is 90°, d-orbitals connect with orthogonal p-orbitals, making it impossible for an electron in one d-orbital to reach a d-orbital elsewhere. In this case, the superexchange occurs through the Coulomb exchange on the binding oxygen. In the case of materials in which both delocalized (s and p) and localized (d and f) electrons contribute to the magnetic properties (e.g., rare earth systems), the Rudermann–Kittel–Kasui–Yoshida (RKKY) model is the currently accepted mechanism [36]. This refers to the mechanism of the coupling of nuclear magnetic moments or localized internal spins of d- or f-shell electrons in a metal by interactions through the conduction of 6s and 5d electrons. Interactions between 3d and rare earth metals in such systems are usually realized through d electrons directly or mediated by oxygen atoms. In the studied {MnII3MnIVDyIII3} coordination complex, the Mn4+-O2−-Dy3+ bond angles are 100° and the Mn2+-O2−-Dy3+ bond angles are equal to 107° and 132°, which can be a prerequisite for the AFM (angles closed to 90°) superexchange interaction.
To investigate magnetism in the {MnII3MnIVDyIII3} coordination complex from the first principles, the spin density distribution was analyzed using DFT. Here, we show the results of the Mulliken population analysis that gives for each atom (a) the total charge (Z minus electrons); (b) the net spin polarization (number of spin-up minus spin-down electrons); (c) the atomic electron valence density (integrated) per l-value for each spin. These atomic charges cannot be interpreted as formal oxidation states. However, in many cases, qualitative conclusions about the atomic interactions can be drawn from the analysis of the charge and spin densities that we present here. Figure 7 shows the spin density distribution in the {MnII3MnIVDyIII3} complex. The charge and spin density analysis results for the selected atoms labeled in Figure 7 are compiled in Table 1.
Due to polarization effects, the sign of the spin density at the Dy1 atom is positive compared to the negative values for the Dy2 and Dy3 atoms. The spin density on Mn14+ is negative, while the rest of the Mn atoms have a positive spin density. The absolute value of the spin density on the Mn4+ ion is about 50% smaller than on each of the Mn2+ ions. The integral values of spin densities for the Mn and Dy atoms have the opposite signs, which confirms the AFM nature of magnetism in the complex.
The McConnell I mechanism describes the exchange interaction between molecules, radicals, and atoms based on their spin polarization to predict the nature of the ferromagnetic (FM) or AFM magnetic interaction between π-bonded paramagnetic moieties [30,37]. In the case of the {MnII3MnIVDyIII3} complex, the mechanism can be adapted to explain how spin polarization is transferred between the metal centers, though it takes a different form due to the presence of metal–ligand interactions and the nature of the metal centers. Since the spin populations in Table 1 on the Mn and Dy atoms have opposite signs, the magnetic interaction between them should be ferromagnetic based on the McConnell I mechanism, while our XMCD study (see the corresponding Section below) shows antiferromagnetic coupling between Mn and Dy atoms. Spin polarization in the {MnII3MnIVDyIII3} complex is mediated through the ligands that bridge the Mn and Dy ions. This process can be understood as being analogous to the McConnell I mechanism, where spin polarization propagates through bonds, except here it occurs through ligand-mediated exchange and superexchange interactions.

2.5. Mn RXES

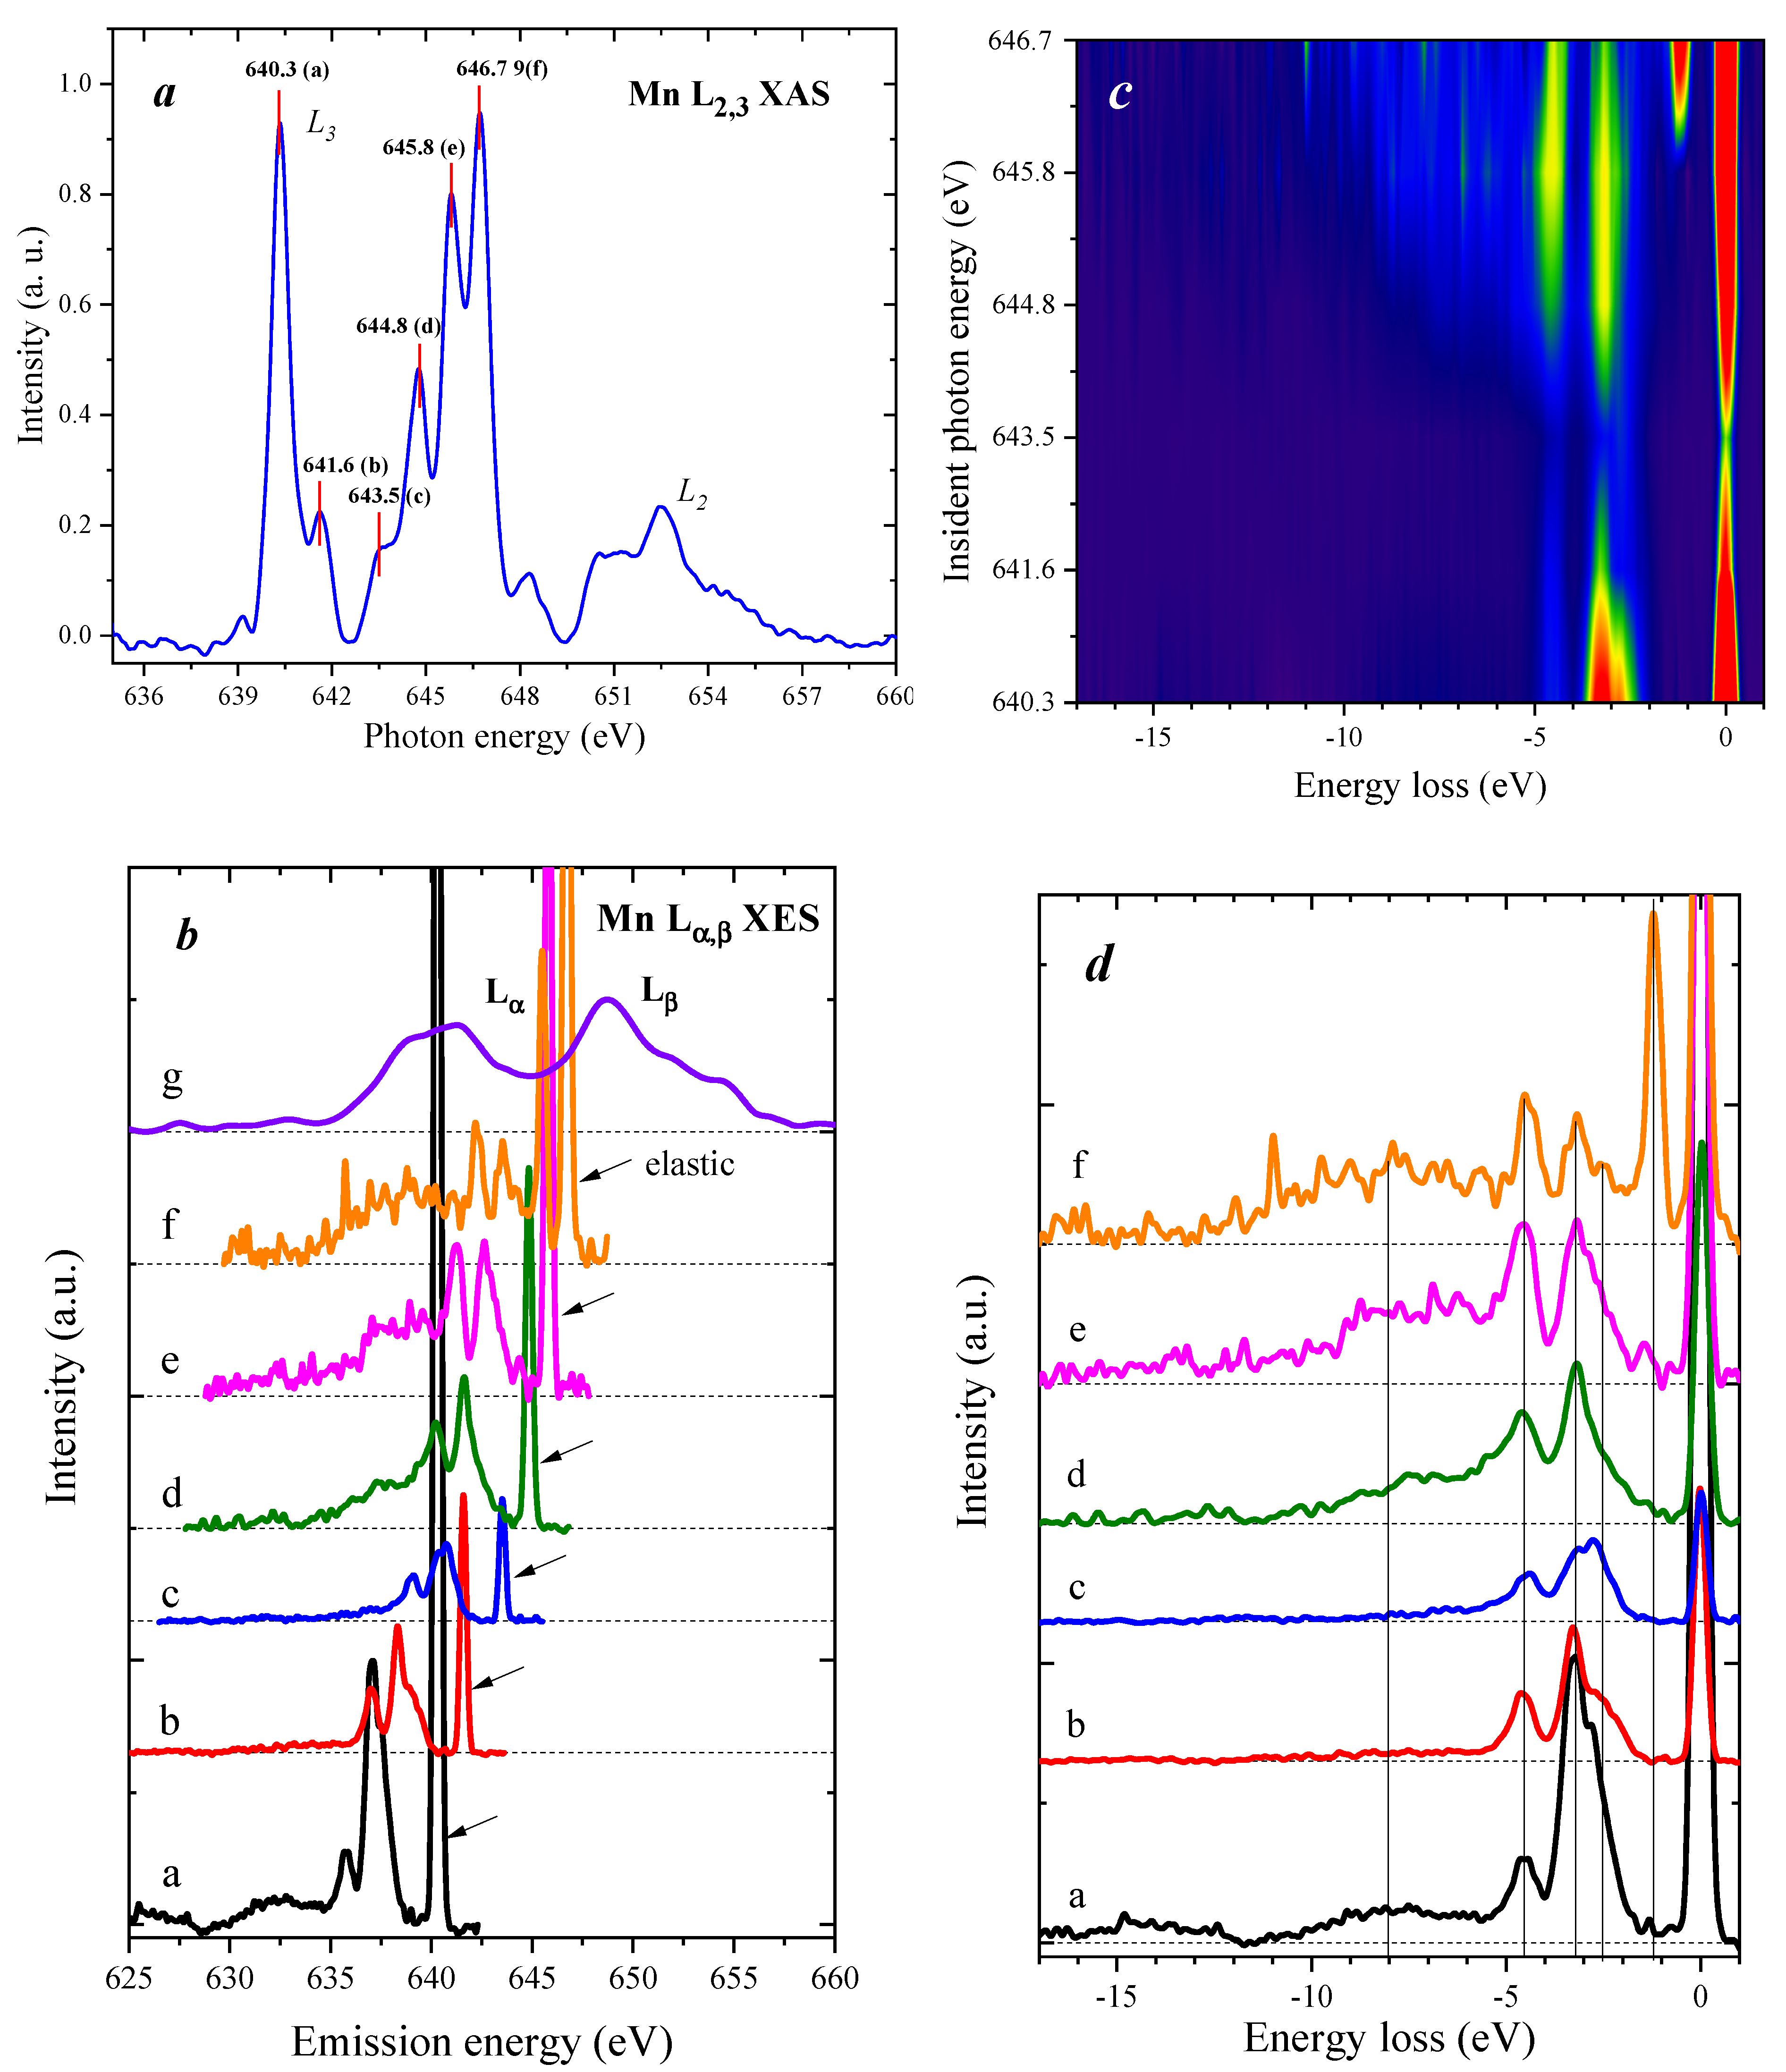
RXES spectra across the Mn L3 absorption edge were collected at the U41-PEAXIS beamline [38] using the end station PEAXIS of BESSY II (Berlin, Germany) by changing the incident X-ray photon energy and detecting the inelastically scattered photon energy through an X-ray emission spectrometer (see Section S.3 in the Supporting Information for details of the experiment). Excitation energies were selected to correspond to the most intense transitions on the XAS spectrum (see Figure 8a). Figure 8b shows the Mn Lαβ XES spectra of the {MnII3MnIVDyIII3} coordination complex excited at various energies indexed from (a) to (g) given in Figure 8a. One can notice that the relative intensity of the peaks in the region of 645–647 eV is much higher compared to the spectrum of the same {MnII3MnIVDyIII3} coordination complex measured at the BESSY and APS synchrotron facilities (see Figure S1 in the Supporting Information). Based on the experimental parameters of the beamline instruments (see Table S2 in the Supporting Information), we address this variation mainly through the difference in the instrumental resolution. A similar improvement in resolution can be seen in the pre-edge region of XAS. We scaled the integrated intensity of the individual RXES spectrum to the intensity of the XAS peaks that corresponds to each excitation energy.
The line shape of RXES spectra strongly depends on the excitation energy. According to the energy position, the spectral peaks can be classified as a contribution from the following processes: the elastic scattering peak, the d-d excitations, the O 2p → Mn 3d charge transfer transitions, and the non-resonant Lα,β X-ray emission lines. The spectra from (a) to (f) contain only Lα transitions since the excitation energy is below the binding energy of the 2p3/2 level. The d-d transitions for spectra (a)–(f) lie up to 5 eV below the elastic lines and represent a local electronic excitation between different d-states due to the transferred energy difference between the incoming and the emitted photons. The charge-transfer features appear at the lower energy region, and their intensities increase with an increase in the excitation energy. The spectrum (g) is recorded at the excitation energy above the L2,3 thresholds and represents a non-resonant XES spectrum in which the non-resonant Lα,β X-ray emission lines rise with the constant energy of the emitted photoelectrons. Due to an overlap of the different contributions of the non-resonant Lα,β emission, the spectrum (g) is about 25 eV wide. The wide feature around 637 eV is usually assigned to the O 2p → Mn 3d charge transfer excitation. Here, L−1 stands for a hole in the O 2p states that suggests a strong admixture between the O 2p and Mn 3d states [39]. The intensity of the elastic peak changes with the energy of the incident photon. Spectra (a) and (f) have very strong elastic lines which can be associated with the antibonding state and the larger number of 3d electrons in the intermediate state [40].
To clarify the effect of the final state on the spectra, they are displayed as energy loss spectra by setting the elastic line energy to 0 eV in Figure 8c,d. One can clearly see that the peaks corresponding to crystal-field d-d excitations between the t2g and eg states remain at the same relative energy positions and show the splitting of the t2g and eg levels by the octahedral crystal field, whereas their relative intensities vary from one spectrum to another, reflecting the number of excited d electrons. It should be noted that the {MnII3MnIVDyIII3} coordination complex contains Mn ions in the oxidation states 2+ and 4+; therefore, the d-d transition peaks correspond to both types of Mn ions and can even overlap. Thus, the spectrum (f) exhibits the best energy-resolved d-d transitions for Mn ions and shows a new enhanced peak at around −1.2 eV of the energy loss. This can be, for instance, associated with a transition to the higher energy d band of the Mn4+ ion. To discern the contribution of each atom to the RXES spectra, theoretical calculations using, for example, the configuration interaction approach will be performed, but that is beyond the scope of this article.

2.6. Magnetochemical Properties

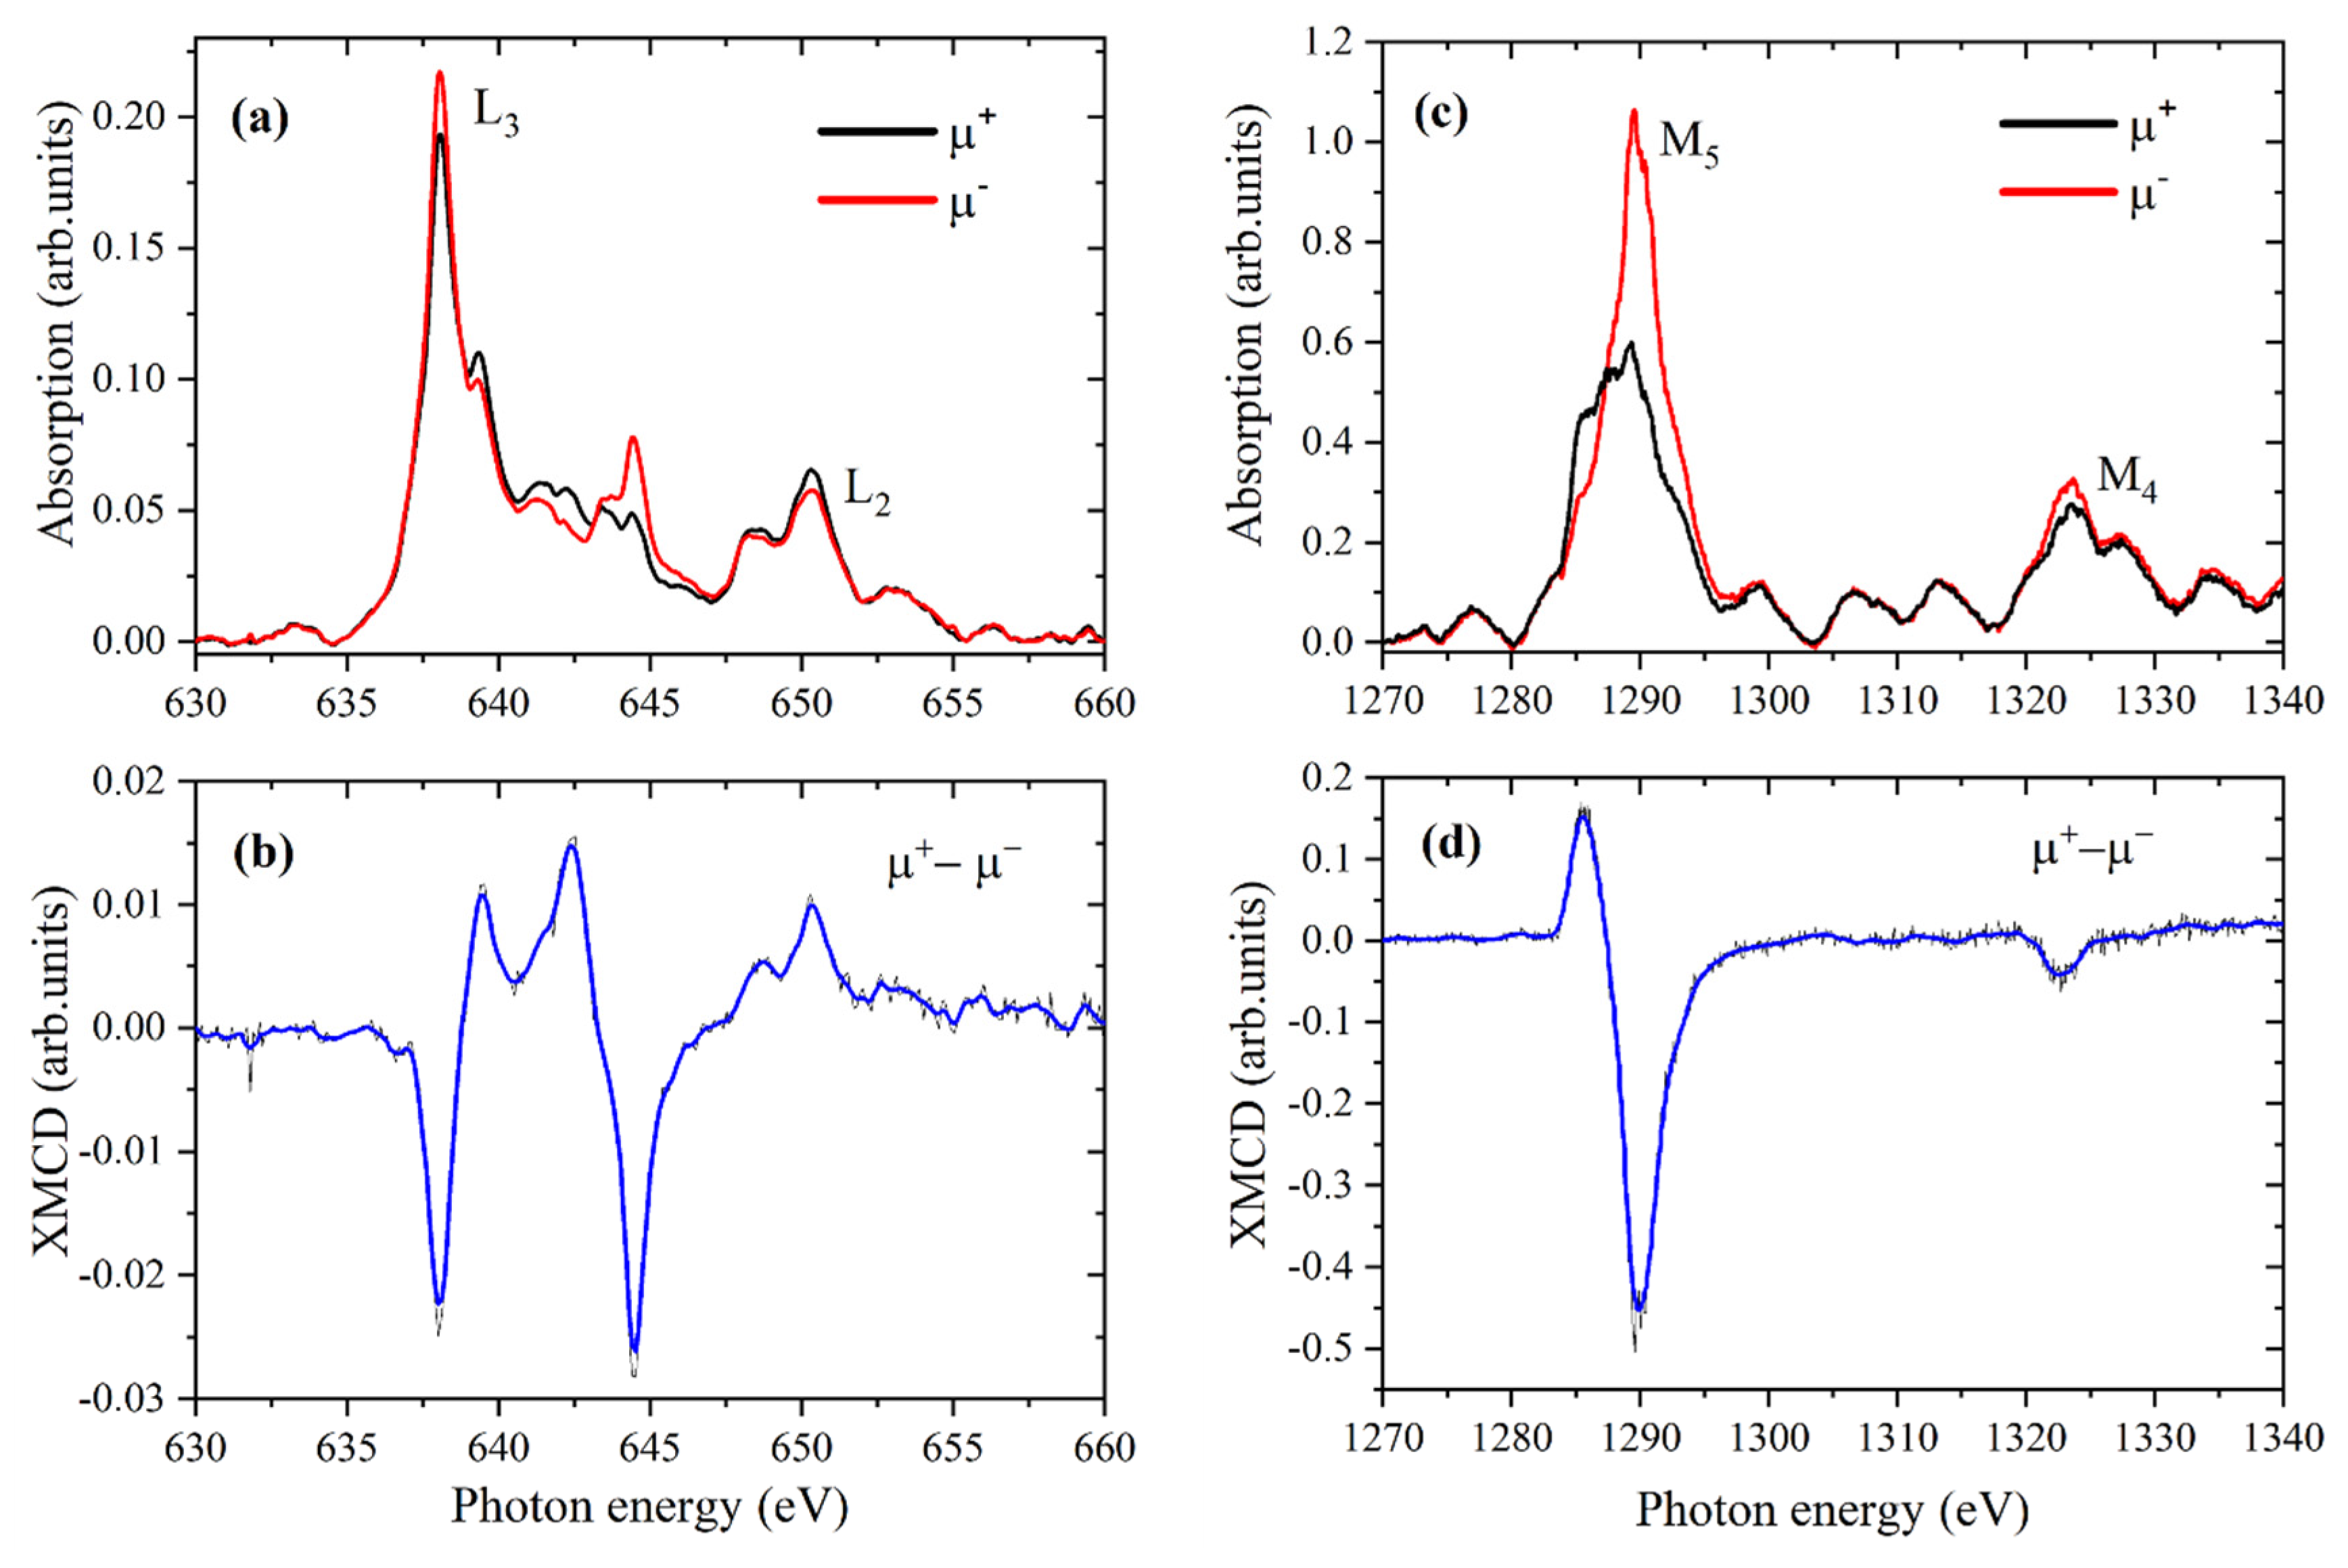
First, we collected the polarization-dependent XAS spectra of the {MnII3MnIVDyIII3} coordination complex in a powdered form (see Figure 9). XAS spectra have been measured in both the total electron yield (TEY) and total fluorescence yield (TFY) modes at the external magnetic field H = 5T and the temperature of 6K at the Mn L2,3, Dy, and Yb M4,5 edges. It should be noted that XAS spectra obtained in the TFY mode suffer from the self-absorption and surface-charge effects, so we only present the results of the TEY measurements. We observed a strong influence of sample charging/discharging effects on the TEY spectra of the powdered samples due to their non-conducting nature, while in the difference XMCD spectra, such artifacts are well compensated. In addition, due to its surface sensitivity, a TEY mode is more suitable for measuring the signal of molecules deposited on the surface.
The Mn L2,3 XAS spectrum (see Figure 9a) arising due to the 2p → 3d transition of one of the core electrons has two prominent peaks at 638 eV (Mn L3 edge) and 650 eV (Mn L2 edge). The corresponding XMCD signal (see Figure 9b) is negative at the L3 edge and positive at the L2 edge due to the inverse spin polarization of the 2p3/2 → 3d and 2p1/2 → 3d transitions, reflecting the preferential population of spin-up and spin-down electrons at the L3 and L2 edges, respectively. Moreover, neglecting the energy dependence of the radial matrix elements, the spectra L2 and L3 can be considered as a direct display of the DOS spectra for 3d3/2 and 3d5/2 energy levels. The XMCD spectra at the L2,3 edges are mainly determined by the strength of the spin–orbit coupling of the initial 2p core states and the spin polarization of the final empty 3d3/2 and 3d5/2 states. At the same time, the exchange splitting of the 2p core states, as well as the spin–orbital coupling of the valence 3d states, are of minor importance for the L2,3 edge XMCD spectra of 3d-transition metals [41]. The Mn L3 edge XMCD spectrum has a negative sharp peak at 639 eV, which indicates that the magnetic moment of the Mn ions aligns antiparallel to H. A positive feature on the high-energy side of the main peak at 642 eV can be assigned to the spin-flip singlet state, which arises as a result of the transition of the spin-down core electron to the unoccupied spin-up Mn d-state. This transition is allowed because the selection rule ∆S = 0 becomes broken by the strong 2p spin–orbit interaction. Another reason for this XMCD signal shape may be associated with the AFM interaction of the spins of the Mn2+ ions with the Mn4+ ion due to the indirect exchange interaction through the binding O2− ions [42,43]. The spins of the Mn2+ ions are oriented antiparallel to the external magnetic field, and the spins of the Mn4+ ion are parallel to it. Then, at an energy of around 644 eV, another prominent negative resonance appears.
XAS spectra of {MnII3MnIVDyIII3} and {MnII3MnIVYbIII3} coordination complexes were measured at the M5 and M4 edges of rare earth atoms and show the characteristic features of the Dy3+ and Yb3+ ions reported earlier [44]. The XAS and XMCD spectra of Dy and Yb at the M5 and M4 edges correspond to 3d5/2 → 4f and 3d3/2 → 4f transitions and exhibit opposite behavior to the spin population. Both the Dy M5 and M4 lines show a negative XMCD signal due to the parallel coupling between spin and orbital moments for these transitions. The spectral shape of the Dy M4,5 edge is in good agreement with the previously reported results for Dy-based compounds and corresponds to the Dy3+ oxidation state [45,46]. The Dy M5 XMCD spectrum is asymmetric and splits into two peaks—a weaker positive peak at lower energies and a stronger negative peak at higher energies associated with a reversal of the magnetization direction. The M4 XMCD signal is almost ten times less intense than the M5 line and consists of a symmetrical negative peak without a clear structure.
Both the Mn and Dy XMCD spectra are strongly dichroic, indicating the presence of magnetic moments on both the Mn and Dy ions. According to the absolute intensity of the XMCD signal at the Mn L3 and Dy M5 edges, the magnetic moment on Dy ions is approximately ten times larger than on Mn ions. The opposite sign of the XMCD signals at the Dy M5 and Mn L3 edges confirms the presence of AFM coupling between the Dy and the Mn ions.
One of the most important roles of the Schiff base anchoring ligands is to properly bind the magnetic molecules to the substrate without introducing any distortions that could influence their magnetic properties. To verify these possible changes, the XMCD spectra of the {MnII3MnIVDyIII3} coordination complex deposited on the gold substrate were measured (see Figure 10).
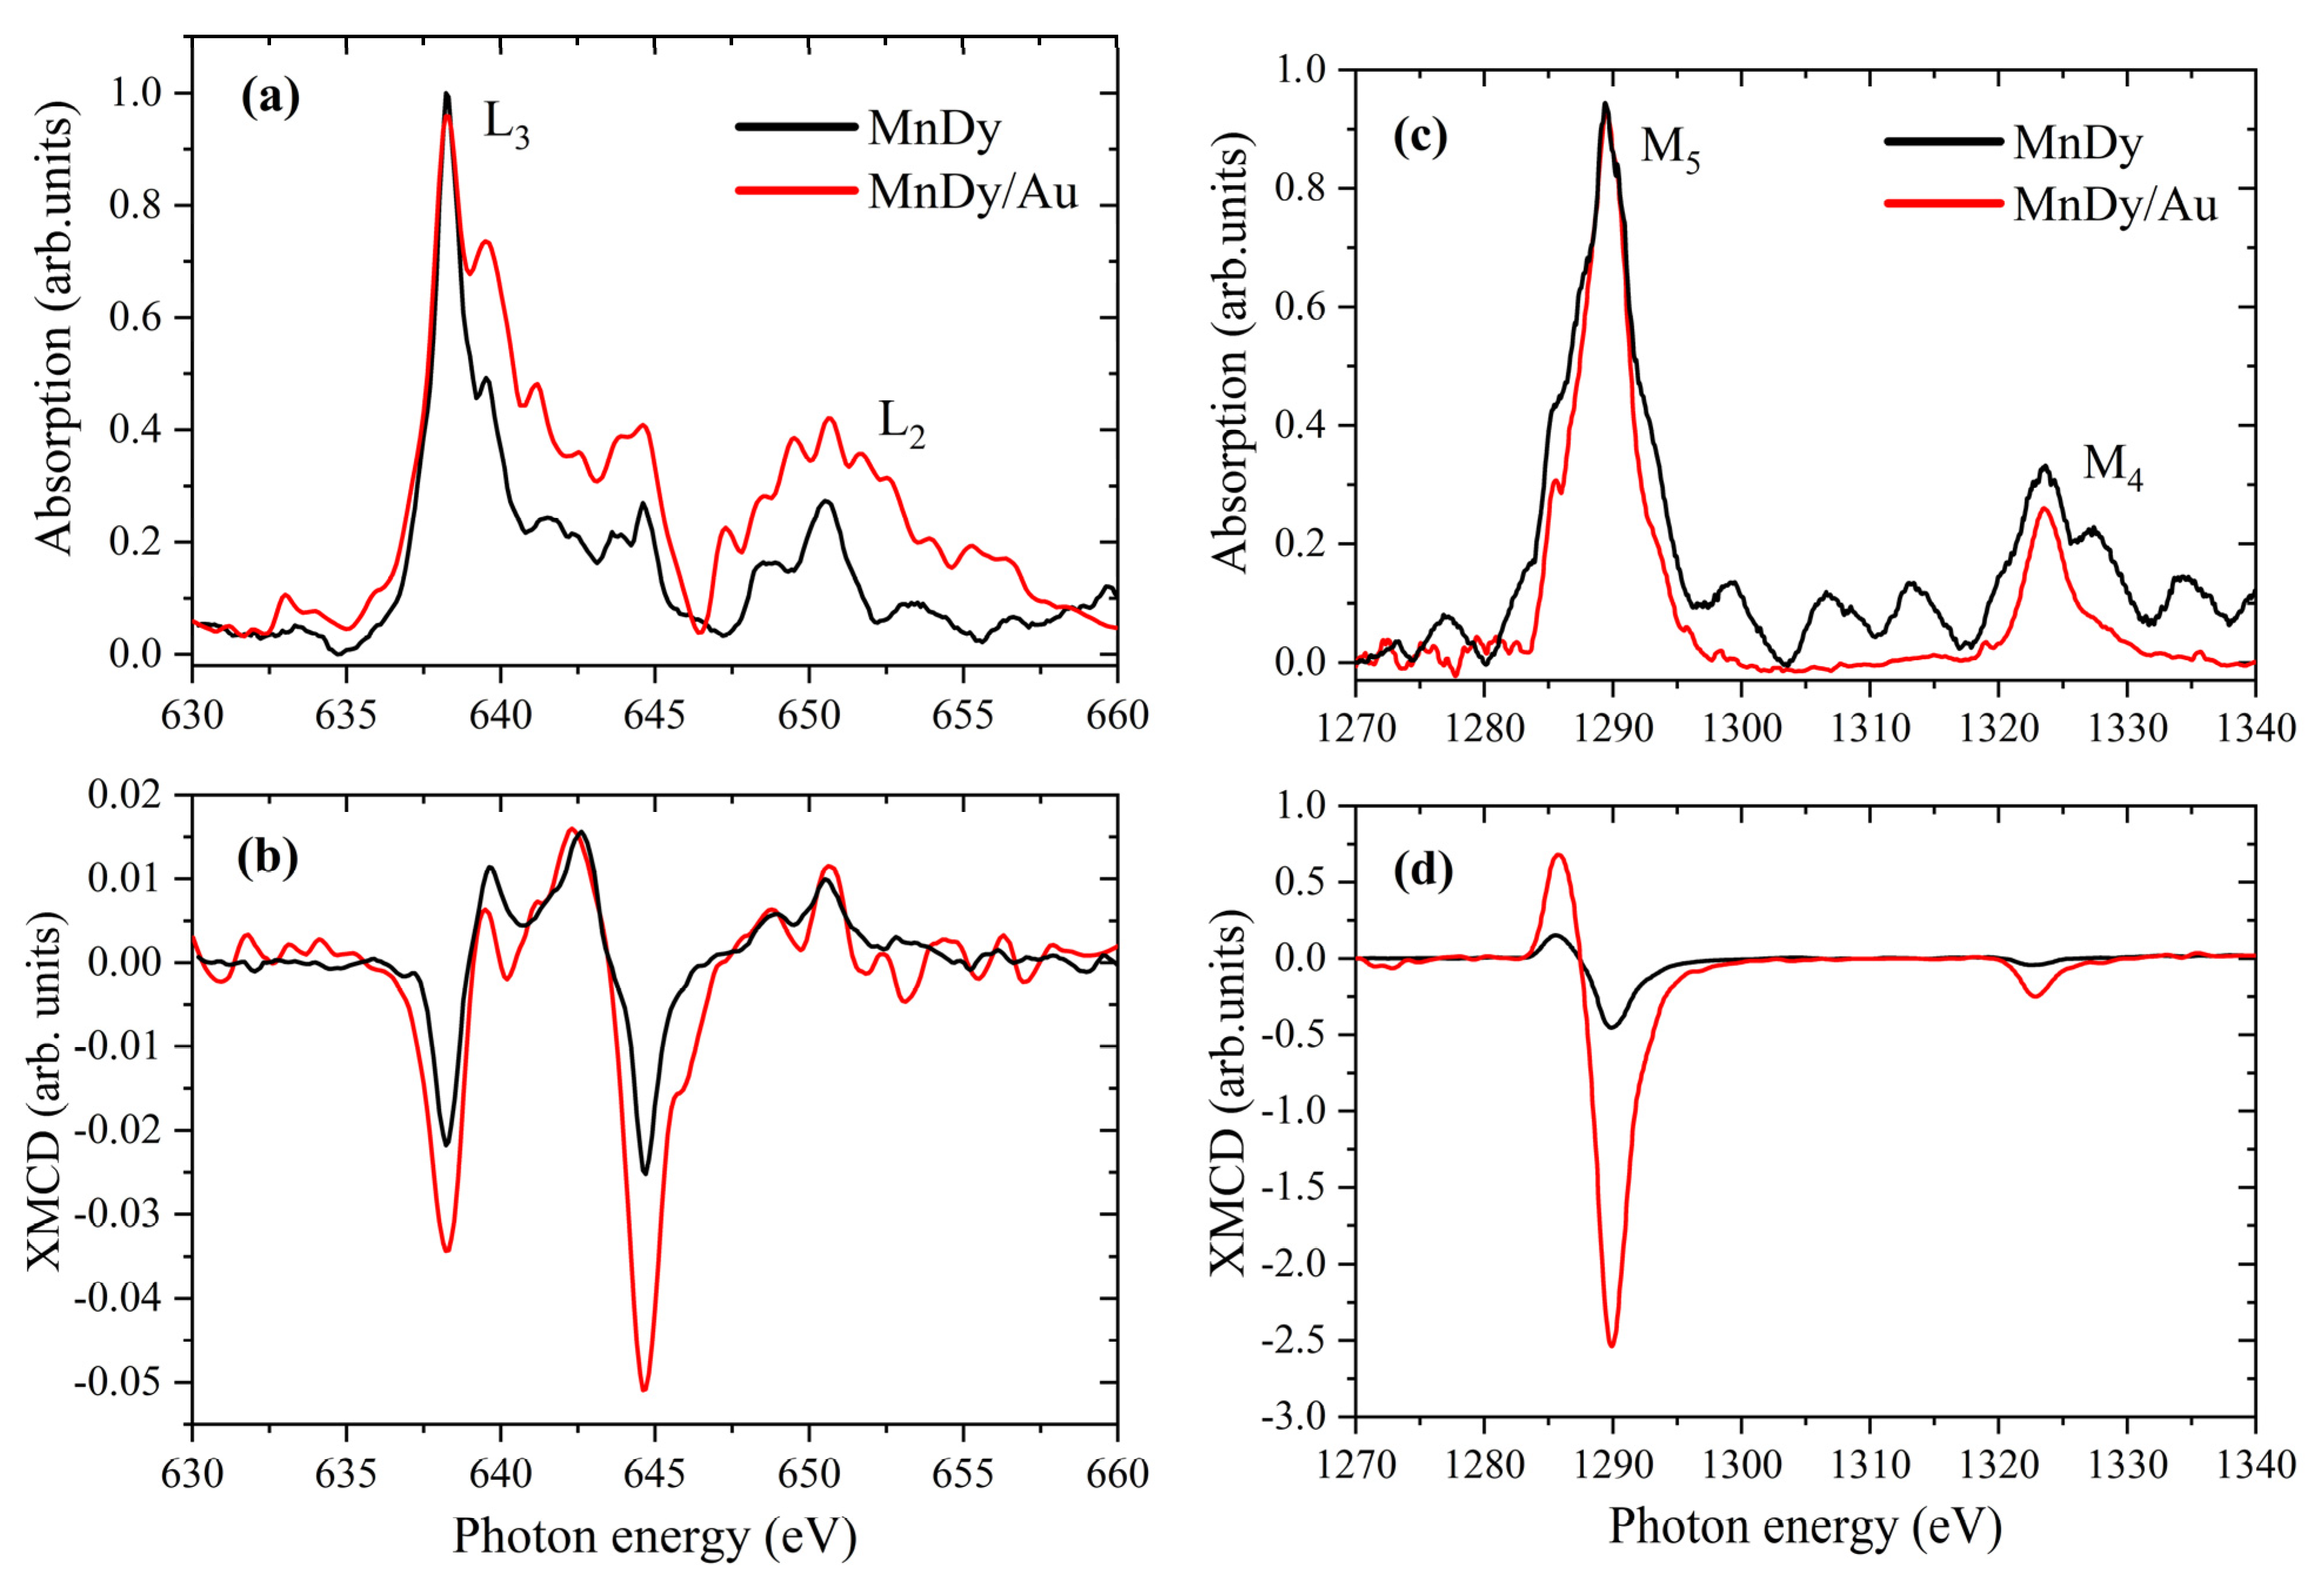
Figure 11a–c shows a comparison of the Mn and Dy XAS ((a) and (c)) and XMCD ((b) and (d)) spectra of the {MnII3MnIVDyIII3} coordination complex before (black curve) and after their deposition on the Au substrate (red curve). Except for the difference in the noise level due to the low signal-to-noise ratio in the case of deposited molecules, there are no other changes in the shape of the spectrum caused by changes in the local structure around the absorbing atom. The XAS spectra were normalized to the intensity of the white line, while the XMCD spectra show real intensity. The increase in the XMCD signal from the deposited molecules can be explained by the uncompensated alignment of the dipole magnetic moments of atoms along the magnetization direction due to misorientation and the higher conductivity of the Au substrate compared to the undeposited molecules.
To understand the influence of different lanthanide atoms on the magnetic properties of {MnII3MnIVLnIII3} coordination complexes, we performed an element-specific XMCD analysis for the {MnII3MnIVYbIII3} coordination complex and compared the result with the above-described data for the {MnII3MnIVDyIII3} coordination complex. Based on the EXAFS study (see above) of both coordination complexes, we can conclude that they have very similar atomic structures, except for a small difference in the distance between the Mn and Ln atoms.
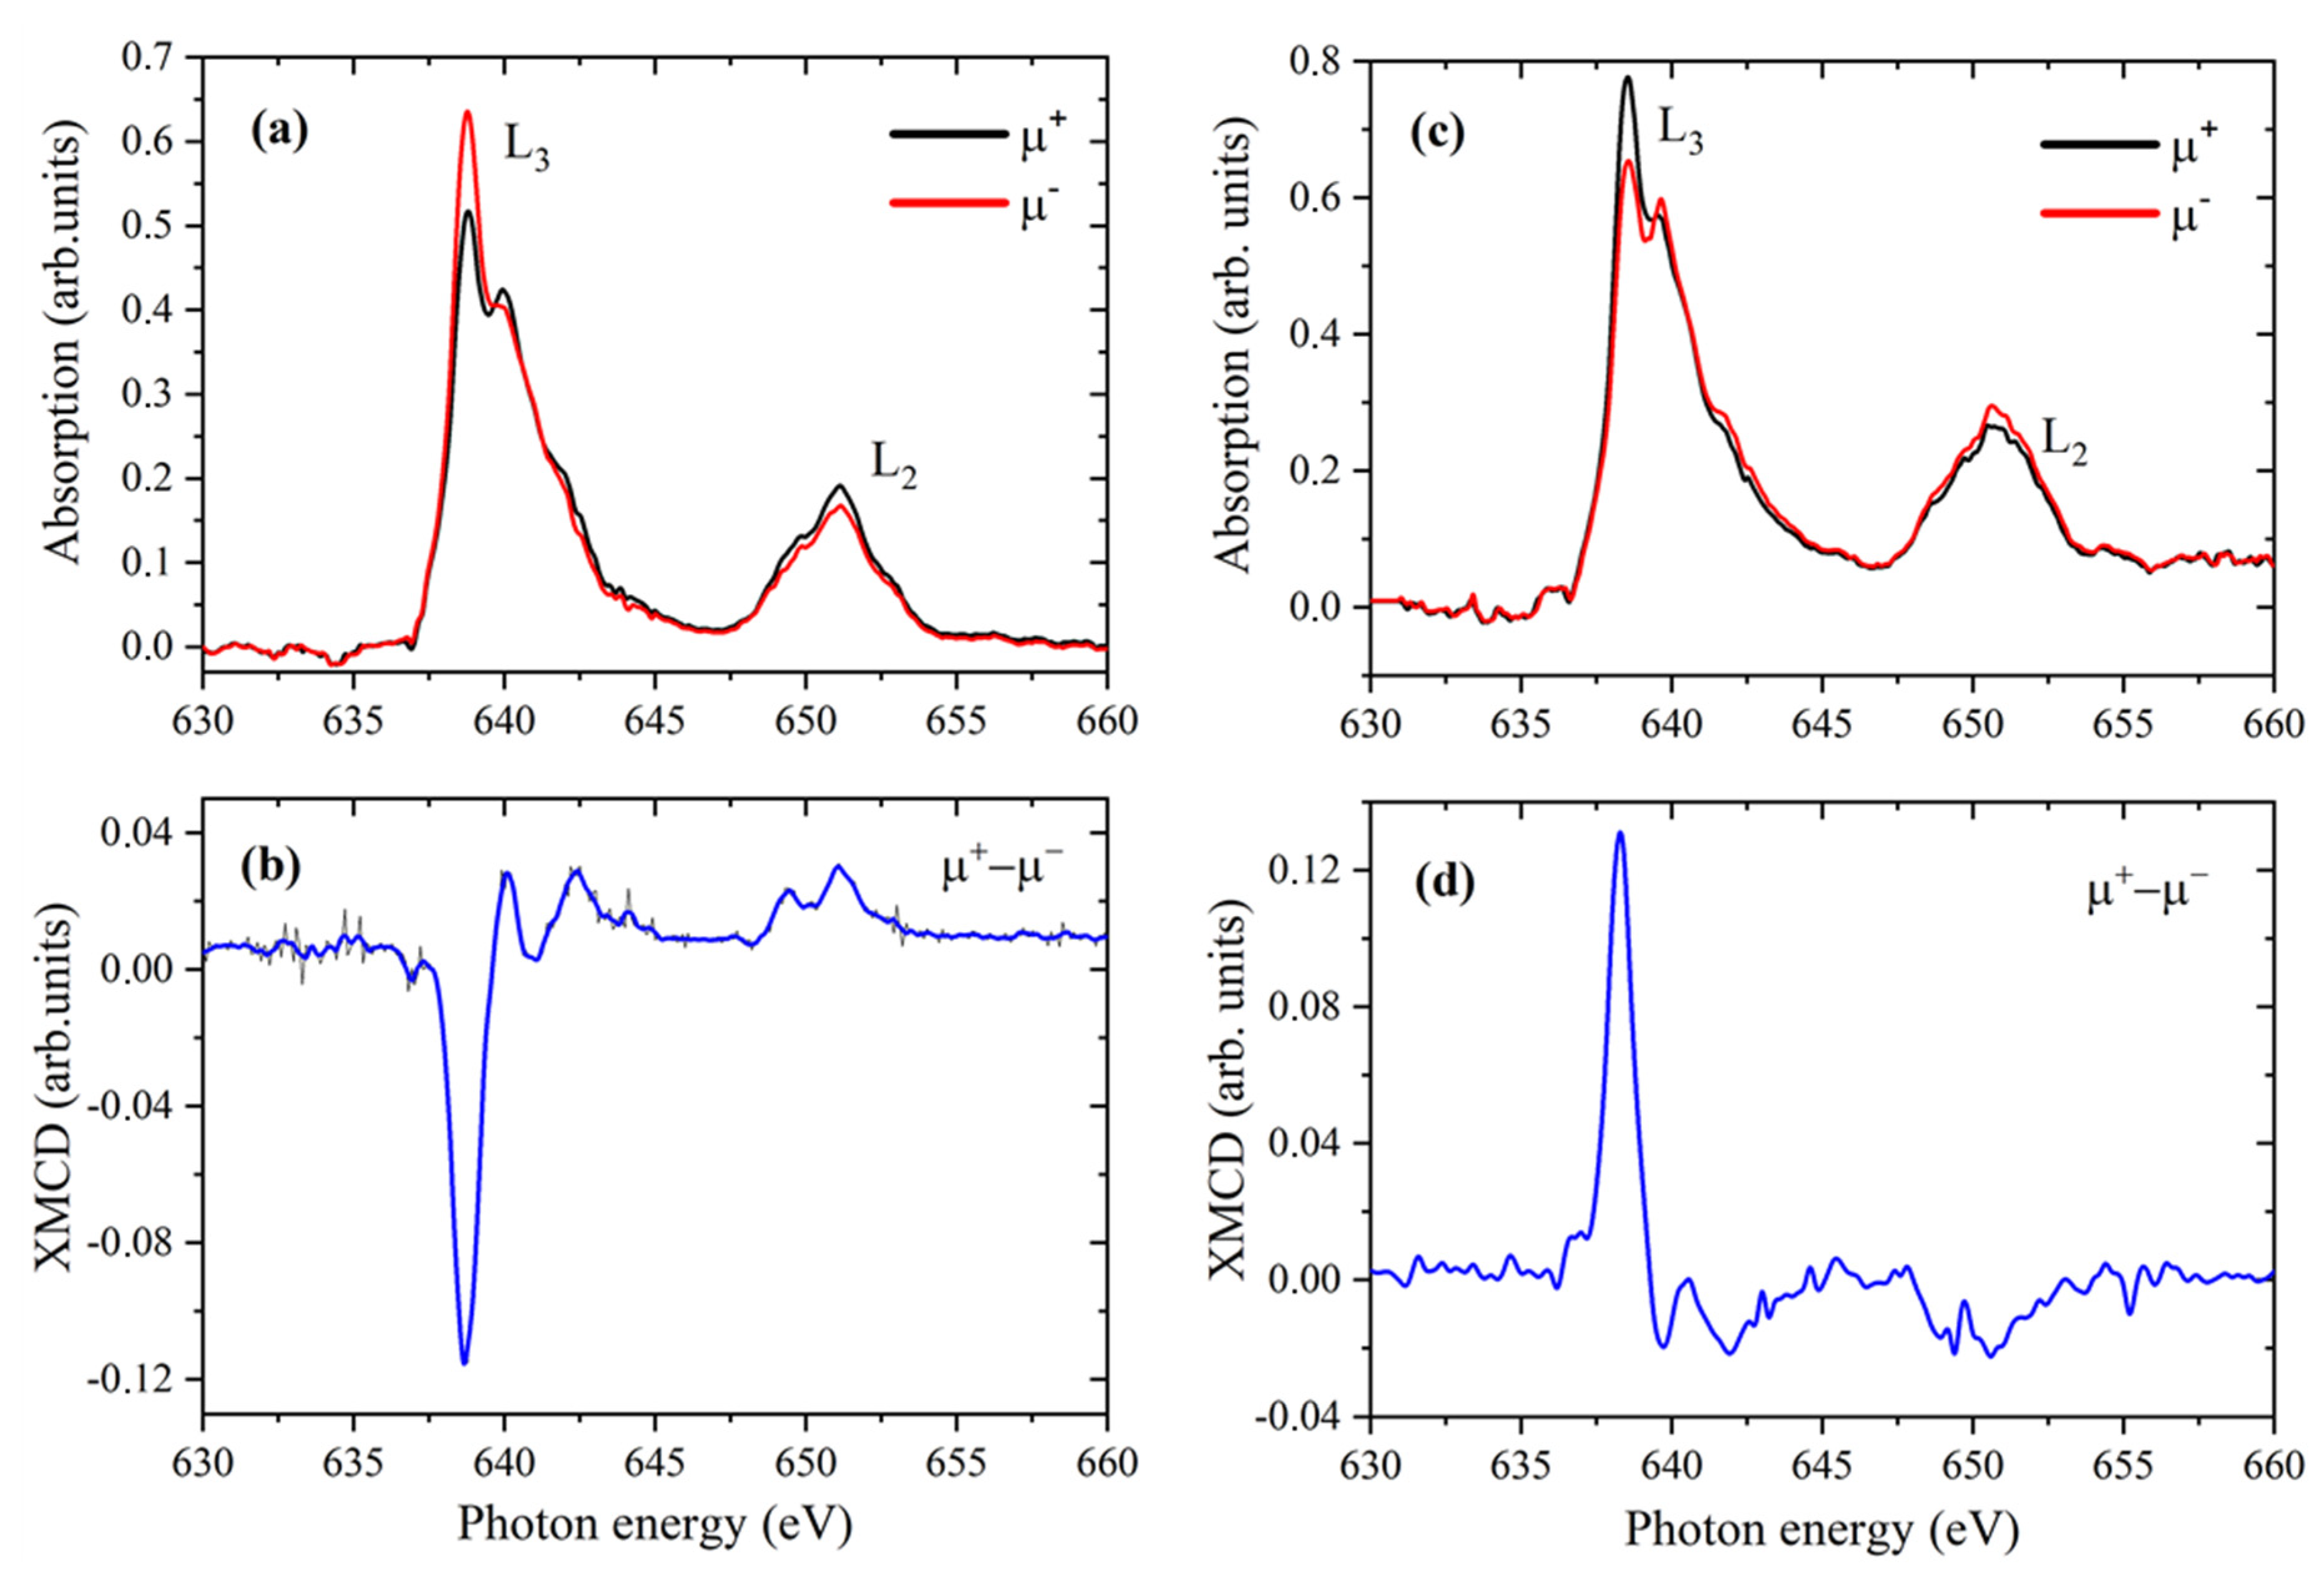
Figure 12 shows the Mn L2,3 XAS and XMCD spectra of the {MnII3MnIVYbIII3} coordination complexes deposited on the Au substrate and measured at the magnetic field of 5T and −5T. The XCMD spectra in Figure 12b,d represent dichroic specular features, confirming the presence of magnetic dichroism and not experimental artifacts. The comparison of the XAS and XMCD spectra across Mn L2,3-edges for the {MnII3MnIVDyIII3/Au} and {MnII3MnIVYbIII3/Au} coordination complexes, depicted in Figure 13a,b, shows the presence of additional features at 645 eV in the XAS spectrum of the {MnII3MnIVDyIII3/Au} coordination complex, which make a significant contribution to the XMCD signal.
The Yb M4,5-edge XAS of the {MnII3MnIVYbIII3} complex represents a simple absorption spectrum of Yb3+, which consists of just one ΔJ = −1 line according to Hund’s rule corresponding to the 3d104f13 (2F7/2) → 3d94f14 (2D5/2) transition (see Figure 13). In the presence of a magnetic field, both initial states split into Zeeman states, as shown in the energy level diagram in [44]. If all Zeeman states are equally populated, then all the three groups corresponding to the left-polarized, right-polarized, and linearly polarized states will exhibit equal contributions to the absorption cross section. In this case, no effect of the magnetic field will be present in the XAS spectrum because the magnetic field splitting (~1 meV) is much smaller than the experimental line width. It is interesting to notice that while the XMCD signal on the Yb atom is small compared to Dy, the XMCD at the Mn L3 edge increases for the {MnII3MnIVYbIII3} complex.
Orbital (mL) and spin (mS) magnetic moments of Mn and Dy ions in the {MnII3MnIVDyIII3} coordination complex can be estimated using XMCD sum rules [47,48,49]. To apply the sum rule to the L2,3 XAS spectra of 3d elements, the L3 and L2 edges must be well separated in energy and contain pure 2p3/2 and 2p1/2 characters, respectively. Unfortunately, the values derived from the sum rules for Mn atoms contain large errors [50] because the 2p-3d Coulomb interaction results in mixing the j = 3/2 and j = 1/2 states. In our case, the requirement that the L3 and L2 edges contain pure contributions of the corresponding characteristics 2p3/2 and 2p1/2 is not satisfied, since the L3/L2 integral intensity ratio is equal to 3.7. This value is significantly different from 2, which indicates the mixing of the two edges and the electronic configuration of the Mn atoms in the high state. Several approaches have been developed to estimate the correction factors to the sum rule analysis [51,52,53,54]. It has been suggested that the sum rule significantly underestimates the spin magnetic moment on Mn due to the large jj coupling [55], and, therefore, the magnetic spin moment extracted using the sum rule should be multiplied by a correction factor. Previous studies [55,56] indicate a correction factor of 1.5, which we used in our analysis. We assumed that the average contribution of the magnetic dipole term TZ is negligible for Mn atoms because the measured specimens are in powder form. In general, the TZ term reflects an anisotropy of the spin moment and can be induced either by the anisotropic charge distribution or in systems with strong spin orbital interactions. The first contribution is enhanced at surfaces and interfaces, whereas it is zero in cubic systems. The spin–orbit interaction is small in 3d metals and becomes larger in 4d and 5d metals.
From DFT calculations, we also found that the number of valence electrons for the Mn and Dy atoms in the {MnII3MnIVDyIII3} coordination complex is slightly different from the direct average for a single ion. Thus, averaging over the formal oxidation state of four Mn and three Dy ions gives the number of holes nh 5.5 and 5 for Mn and Dy, respectively. As follows from our DFT simulations, nh is approximately 4.8 for both Mn and Dy atoms. This can be explained by hybridization between the d-states of Mn, f-states of Dy, and p-states of O, which should be considered when applying the XMCD sum rules.
As the XMCD signal across the Dy M4,5 edges is related to the 3d initial state and 4f final state, it directly measures the magnetic polarization in the 4f shell of Dy ions. As the spin–orbit coupling between the M4 and M5 edges for heavy rare earth elements such as Dy increases, the 3d5/2–3d3/2 mixing becomes small and the sum rule analysis is well applicable. Previously, it was found that the correction factor due to the mixing of 3d states for Dy is 0.923, which introduces an error in determining the expectation value of the spin magnetic moment of less than 10% [46]. The spin sum rule does not only have a contribution from the 3d5/2–3d3/2 mixing; it is also affected by the magnetic dipole term TZ (see equations in Section S.3 of the Supporting Information). Since rare earth elements have strong spin–orbit coupling, the contribution of the TZ term usually cannot be omitted [57]. However, in the case of rare earth compounds in powder form, the contribution of TZ is practically insignificant, since the average contribution will be reduced to zero due to the rotation of the grains in the powder, making the sum rule analysis more reliable than, for example, the sum rule analysis of thin film samples.
Table 2 summarizes the values of mL, mS, the sum (mL + mS) and ratio (mL/mS) of 3d and 4f electrons for the Mn L2,3, and the Dy M4,5 edges at 6 Kelvin. The effective orbital and spin moments were determined considering all relevant corrections and for Mn atoms found to be −0.18 µB and 1.57 µB, respectively. For Dy atoms, the values are 2.15 µB and −1.47 µB.
It can be seen from the table that for the Mn atoms, the predominant contribution is given by the spin magnetic moment, while the Dy atoms have a remarkably high orbital moment, which is not quenched by the ligand field and has the same order of magnitude as the spin moment. The orbital and spin moments are aligned in the opposite directions for both Mn and Dy atoms. According to Hund’s third rule, the orbital and spin moments for shells that are more than half-filled should be parallel. However, several studies have reported the expected violation of Hund’s third rule due to the hybridization between ligands [58,59,60,61]. The spin and orbital moments on the Mn and Dy atoms are directed antiparallel to each other, indicating an AFM interaction between these atoms. The exchange interaction between 4f electrons of rare earth elements and 3d electrons of iron is not direct but occurs by an indirect mechanism via oxygen ions [62]. This interaction is enhanced in the presence of Dy3+ ions with non-zero orbital angular momentum.

3. Experimental and Computational Details

3.1. X-Ray Absorption Spectroscopy

One of the most powerful methods for studying element-specific local atomic and electronic structures, which can directly probe the charge density of metals, is X-ray absorption spectroscopy (XAS). XAS spectra can be divided into two regions relative to the absorption edge: the nearest to the edge jump region, about 10–150 eV above (depending on the system), is called an X-ray absorption near-edge structure (XANES), and the other is called an extended X-ray absorption fine structure (EXAFS), which represents oscillatory data and extends up to hundreds of electron-volts above the edge. Furthermore, 1s (or K-edge) XANES spectra of metals can be further split into the following: (1) the pre-edge region arising due to dipole-forbidden quadruple-allowed 1s-3d excitations, which are more intense in cases of a system with a broken symmetry and are characterized by the admixture of p and d states around the Fermi level due to the interaction with ligands; (2) the main rising edge which receives a strong contribution from the 1s to 4p transition in the absorber atom, and (3) near-edge characteristic features above the edge which mainly originate from the hybridization of the absorber p states with ligands and can be described in terms of the multiple scattering of the excited electron from the nearest atoms.
In most of the cases, experimental K-edge spectra can be successfully simulated using such methods as multiple scattering theory, finite difference method, and density functional theory, which are based on the one-electron approximation with parametric descriptions of the exchange and correlation interaction with other electrons in the system. XAS spectra above the L-edge of transition metals and the M-edge of 4d metals both have a more complicated nature and can be described in terms of the crystal field and spin–orbital interactions of the metal atom with surrounding ligands; these also carry information about their local symmetry. The energy position of the main absorption line is very sensitive to the oxidation state of the absorbing atom. The XAS L-edge has the advantage of directly probing the unoccupied 3d orbitals of the metal using dipole-allowed 2p-3d transitions [63]. Compared to K-edge spectroscopy, it also has a higher spectral sensitivity (smaller core-hole lifetime broadening), but is technically more complicated due to the more restricted sample environment and strong X-ray-induced sample damage for sensitive molecular complexes and biological samples. L-edge XAS spectra of 3d transition metal systems typically show distinct changes in spectral shape with changes in the oxidation state of the metal. For high-spin metal complexes, the L-edge spectrum shifts toward higher energies with an increasing formal metal oxidation state and shows significant changes in the spectral shape [64].
We employed XAS across the K- and L-edges of the manganese and M-edges of lanthanides to extract the local atomic and electronic structures of {MnII3MnIVDyIII3} and {MnII3MnIVYbIII3} coordination complexes. This knowledge helps us to classify the electron interactions and understand the origin of magnetism in the studied complexes.

3.2. X-Ray Resonant Emission Spectroscopy

X-ray resonant emission (RXES) is an X-ray spectroscopy technique used to study the electronic structure of materials with an improved energy and momentum resolution which, compared to X-ray absorption and non-resonant emission spectroscopy, do not depend on the core-hole lifetime. RXES technique can also be described as a direct resonance inelastic scattering which measures both the energy and momentum change in the X-ray photons inelastically scattered off matter. The energy and momentum lost by the X-ray photon are transferred to various low-energy intrinsic excitations of the material under study, and thus RXES provides information about those excitations [65]. For 3d transition metal (TM) elements, REXS signals are dominated by the strong excitations within the 3d states, called “d-d excitations” [66]. These transitions between different d-orbitals range from dispersive collective excitations (orbitons and magnons) to the localized intra-atomic transitions. According to the dipole selection rules, the direct transitions between d-orbitals are optically forbidden in XAS, whereas in RXES, these transitions are strong and dipole-allowed. This can be explained by the fact that in RXES, such transitions take place by means of the second-order process and involve dipole-allowed 2p → 3d excitations and 3d → 2p relaxations. The detailed structure of d-d excitations varies for the different compounds and depends on such characteristics as electron correlation, the strength of the crystal-field splitting, and spin–orbit coupling. Another process that can be detected by RXES is a metal-to-ligand (MLCT) and ligand-to-metal (LMCT) charge transfer. Charge transfer (CT) is a process that originates in metal−ligand orbital mixing and forms a chemical bond between the metal center and its ligands. According to the previous 2p RXES studies of Mn-based compounds, the energy loss features up to 6 eV away from the elastic line are generally assigned to d−d excitations, while the larger energy losses at 8–12 eV are categorized as the CT transitions. Usually, the CT features are not as clearly resolved as the d−d transitions because of their general low intensity and broadness.

3.3. Density Functional Theory

To verify the contribution of the different atomic orbitals to the interaction and bond formation, we performed first-principles density functional theory (DFT) calculations using the DFT-D3(BJ) dispersion-corrected PBE exchange-correlation functional [67,68] within the generalized gradient approximation (GGA) implemented in the Amsterdam Density Functional (ADF 2019.01) program [69,70,71]. All-electron TZ2P basis sets of Slater-type orbitals were used for calculations [72]. Scalar relativistic effects were included by the ZORA formalism in the Dirac equation [73] due to the presence of heavy Dy ions.
The partial (or projected) density of states (pDOS) has been calculated to provide information on the number and character of one-electron levels (molecular orbitals) as a function of the orbital energy. The δ-function peaks in the pDOS curves corresponding to the energies of the molecular orbitals are widened by a Lorentzian curve with the 0.25 eV width [74,75]. It should be noticed that the calculated pDOS by DFT is a useful tool for understanding the physics and chemistry of the studied system, but it does not provide correct quantitative information.

3.4. X-Ray Magnetic Circular Dichroism

We employed X-ray magnetic circular dichroism (XMCD) at the Mn L2,3 edges and Dy and Yb M4,5 edges to probe the atom-specific magnetic properties. XMCD measurements are performed at the 4IDC beamline of the Advanced Photon Source (Chicago, IL, USA) using circular polarized X-rays and applying a magnetic field to the sample. The details of the XMCD experiment are described in Section S.2 in the Supporting Information. The circular left-polarized photons carry angular momentum, which excites a primary fraction of spin-down electrons, while the circularly right-polarized photons carry the opposite momentum, exciting a greater fraction of spin-up electrons. This leads to the preferential absorption of spin-down and spin-up electrons at the L3 and L2 edges, respectively. The M4,5 edge XAS spectra of rare earth elements involve the 4f electrons and correspond to 3d → 4f transitions. XMCD spectra are represented as the difference between the absorption spectra corresponding and the spin-up and spin-down electrons taken in a magnetic field; information on the magnetic properties of the atom, such as the spin and orbital magnetic moment, can be obtained. The resulting XMCD spectrum provides predominant spin information based, among other things, on the sign of the final spectrum [63].

4. Conclusions

In this work, we present a detailed experimental and theoretical study of the atomic, electronic, and magnetic structure of {MnII3MnIVLnIII3} coordination complexes with Ln = DyIII, YbIII. 3d-4f molecular magnets have been studied regarding their magnetic anisotropy and interaction with the substrate, opening the way for the novel strategy of using charge neutral, S-functionalized organic ligands as transporters for highly unstable inorganic structures with appealing properties to be deposited on metallic substrates. We applied experimental and theoretical XAS to extract information about the local symmetry and contribution of Mn, Dy, and O atoms to the electronic interaction in the {MnII3MnIVDyIII3} coordination complexes. Our RXES analysis reveals an influence of Mn atoms with the different oxidation states on the charge transfer and electron transition processes. DFT calculations have identified spin polarization at the Dy and Mn ligands and demonstrated that the Dy-Mn antiferromagnetic interaction results from the superexchange interaction through the oxygen–ion bridges. The results of an in-depth study of magnetism in the {MnII3MnIVDyIII3} and {MnII3MnIVYbIII3} coordination complexes demonstrate that XMCD is a powerful tool for determining the sign and strength of the exchange coupling between Dy and Mn ions. The extracted spin and orbital moments confirm the antiferromagnetic alignment of Mn and Dy atoms.

Supplementary Materials

The following supporting information can be downloaded at: https://www.mdpi.com/article/10.3390/inorganics12110286/s1, Table S1: Selected bond length of {MnII3MnIVDyIII3} and {MnII3MnIVYbIII3} complexes; Table S2: The incident photon flux and the overall energy resolution for the soft X-ray experiments; Table S3: A detailed composition of HOMO-1, HOMO, LUMO, and LUMO+1 molecular orbitals for the {MnII3MnIVDyIII3} complex; Table S4: A detailed composition of selected molecular orbitals in the energy range 0–3 eV above the Fermi level for the {MnII3MnIVDyIII3} complex; Figure S1: Mn L2,3 XAS spectra of {MnII3MnIVDyIII3} and {MnII3MnIVYbIII3} coordination complexes measured at the different beamlines; Figure S2: Dy M4,5 XAS spectra of the Dy2O3 oxide and the {MnII3MnIVDyIII3} complex as powder and after deposition on Au(111) substrate; Figure S3: XAS spectra beyond the Mn L2,3 and Dy M4,5 edges of the {MnII3MnIVDyIII3} complex in an external magnetic field of B = 5T and at a temperature of T = 6K. References [76,77] are cited in the supplementary materials.

Author Contributions

Conceptualization, V.M.; methodology, V.M.; validation, V.M., investigation, V.M., data curation, V.M., T.A. and I.A.; writing—original draft preparation, V.M. and T.A.; writing—review and editing, V.M., T.A., I.A. and P.F.; supervision, P.F.; funding acquisition, P.F. All authors have read and agreed to the published version of the manuscript.

Funding

V.M. and P.F. acknowledge the support of the European Research Council under the European Union’s Seventh Framework Programme (FP/2007-2013) ERC Grant Agreement n. 609920. This research project for T.A. and I.A. has been supported by the Russian German Laboratory at BESSY II.

Data Availability Statement

The original contributions presented in the study are included in the article/Supplementary Materials, further inquiries can be directed to the corresponding author.

Acknowledgments

The authors acknowledge Kirill Monakhov and his group at the Institute for Surface Engineering for providing {MnII3MnIVLnIII3} coordination complexes and discussing the results. The authors acknowledge DESY (Hamburg, Germany), a member of the Helmholtz Association HGF, for the provision of experimental facilities. Parts of this research were carried out at PETRA-III, and we would like to thank Wolfgang Calibe and Aleksandr Kalinko for their assistance in using the P64 beamline. This research used resources of the Advanced Photon Source, a U.S. Department of Energy (DOE) Office of Science User Facility operated for the DOE Office of Science by Argonne National Laboratory under Contract No. DE-AC02-06CH11357. We would like to thank Richard Rosenberg for his assistance during the experiment. XAS measurements were carried out at the U41-PEAXIS and RGBL beamlines at the BESSY II electron storage ring operated by the Helmholtz-Zentrum Berlin für Materialien und Energie. The authors thank Klaus Lieutenant and Anna Makarova for their assistance during the experiments.

Conflicts of Interest

Author Victoria Mazalova was employed by the company TWK-SENSORIK GmbH. The remaining authors declare that the research was conducted in the absence of any commercial or financial relationships that could be construed as a potential conflict of interest. Data collection and processing, as well as the preparation of this article, were done during VM’s work at CFEL, DESY.

References

  1. Layfield, R.A. Organometallic single-molecule magnets. Organometallics 2014, 33, 1084–1099. [Google Scholar] [CrossRef]
  2. Kowalska, J.K.; Nayyar, B.; Rees, J.A.; Schiewer, C.E.; Lee, S.C.; Kovacs, J.A.; Meyer, F.; Weyhermüller, T.; Otero, E.; DeBeer, S. Iron L2,3-Edge X-ray Absorption and X-ray Magnetic Circular Dichroism Studies of Molecular Iron Complexes with Relevance to the FeMoco and FeVco Active Sites of Nitrogenase. Inorg. Chem. 2017, 56, 8147–8158. [Google Scholar] [CrossRef] [PubMed]
  3. Ishii, T.; Ogasawarab, K.; Sakanec, G. Exploring spin states and ligand field splitting in metal complexes: A theoretical analysis of spin–orbital interactions and magnetic properties. Dalton Trans. 2024, 53, 7175–7189. [Google Scholar] [CrossRef] [PubMed]
  4. Chantarangkul, C.; Patigo, A.; McMurtrie, J.C.; Clérac, R.; Rouzières, M.; Gómez-Coca, S.; Ruiz, E.; Harding, P.; Harding, D.J. Thermal Jahn–Teller Distortion Changes and Slow Relaxation of Magnetization in Mn(III) Schiff Base Complexes. Inorg. Chem. 2024, 63, 12858–12869. [Google Scholar] [CrossRef]
  5. Kim, H.; Yoon, G.; Park, I.; Park, K.-Y.; Lee, B.; Kim, J.; Park, Y.-U.; Jung, S.-K.; Lim, H.-D.; Ahn, D.; et al. Anomalous Jahn–Teller behavior in a manganese-based mixed-phosphate cathode for sodium ion batteries. Energy Environ. Sci. 2015, 8, 3325–3335. [Google Scholar] [CrossRef]
  6. Écija, D.; Urgel, J.I.; Seitsonen, A.P.; Auwärter, W.; Barth, J.V. Lanthanide-Directed Assembly of Interfacial Coordination Architectures–From Complex Networks to Functional Nanosystems. Acc. Chem. Res. 2018, 51, 365–375. [Google Scholar] [CrossRef]
  7. Liddle, S.T.; Mills, D.P.; Natrajan, L.S. The Lanthanides and Actinides; World Scientific Publishing Europe Ltd.: London, UK, 2021. [Google Scholar]
  8. Bünzli, J.-C.G. Review: Lanthanide coordination chemistry: From old concepts to coordination polymers. J. Coord. Chem. 2014, 67, 3706–3733. [Google Scholar] [CrossRef]
  9. Pineda, E.M.; Chilton, N.; Marx, R.; Dörfel, M.; Sells, D.O.; Neugebauer, P.; Jiang, S.-D.; Collison, D.; van Slageren, J.; McInnes, E.J.L.; et al. Direct measurement of dysprosium(III)˙˙˙dysprosium(III) interactions in a single-molecule magnet. Nat. Commun. 2014, 5, 5243. [Google Scholar] [CrossRef]
  10. Natterer, F.D.; Yang, K.; Paul, W.; Willke, P.; Choi, T.; Greber, T.; Heinrich, A.J.; Lutz, C.P. Reading and writing single-atom magnets. Nature 2017, 543, 226. [Google Scholar] [CrossRef]
  11. Guo, Y.-N.; Xu, G.-F.; Wernsdorfer, W.; Ungur, L.; Guo, Y.; Tang, J.; Zhang, H.-J.; Chibotaru, L.F.; Powell, A.K. Strong Axiality and Ising Exchange Interaction Suppress Zero-Field Tunneling of Magnetization of an Asymmetric Dy2 Single-Molecule Magnet. J. Am. Chem. Soc. 2005, 133, 11948–11951. [Google Scholar] [CrossRef]
  12. Woodru, D.N.; Winpenny, R.E.P.; Layfield, R.A. Lanthanide Single-Molecule Magnets. Chem. Rev. 2013, 113, 5110–5148. [Google Scholar] [CrossRef] [PubMed]
  13. Ghosh, P.; Sharma, R.K.; Chouryala, Y.N.; Mudring, A.-V. Size of the rare-earth ions: A key factor in phase tuning and morphology control of binary and ternary rare-earth fluoride materials. RSC Adv. 2017, 7, 33467–33476. [Google Scholar] [CrossRef]
  14. Dey, A.; Acharya, J.; Chandrasekhar, V. Heterometallic 3d–4f Complexes as Single-Molecule Magnets. Chem. Asian J. 2019, 14, 4433–4453. [Google Scholar] [CrossRef] [PubMed]
  15. Andruh, M.; Costes, J.-P.; Diaz, C.; Gao, S. 3d#4f Combined Chemistry: Synthetic Strategies and Magnetic Properties. Inorg. Chem. 2009, 48, 3342–3359. [Google Scholar]
  16. Khan, A.; Lan, Y.; Kostakis, G.E.; Anson, C.E.; Powell, A.K. Using the flexible ligand bis(2-hydroxyethyl)amino–tris (hydroxymethyl)methane (“bis–tris”) to access a family of 3d–4f MnIII4Ln4 complexes. Dalton Trans. 2012, 41, 8333–8339. [Google Scholar] [CrossRef]
  17. Sessoli, R.; Powell, A.K. Strategies towards single molecule magnets based on lanthanide ions. Coord. Chem. Rev. 2009, 253, 2328–2341. [Google Scholar] [CrossRef]
  18. Glaser, T. Rational design of single-molecule magnets: A supramolecular approach. Chem. Commun. 2011, 47, 116–130. [Google Scholar] [CrossRef]
  19. Pointillart, F.; Bernot, K.; Sessoli, R.; Gatteschi, D. Effects of 3d–4f Magnetic Exchange Interactions on the Dynamics of the Magnetization of DyIII-MII-DyIII Trinuclear Clusters. Chem. Eur. J. 2007, 13, 1602–1609. [Google Scholar] [CrossRef]
  20. Bhunia, A.; Gamer, M.T.; Ungur, L.; Chibotaru, L.F.; Powell, A.K.; Lan, Y.; Roesky, P.W.; Menges, F.; Riehn, C.; Niedner-Schatteburg, G. From a Dy(III) Single Molecule Magnet (SMM) to a Ferromagnetic [Mn(II)Dy(III)Mn(II)] Trinuclear Complex. Inorg. Chem. 2012, 51, 9589–9597. [Google Scholar] [CrossRef] [PubMed]
  21. Ueltzen, K.; Schmitz, S.; Moors, M.; Glöß, M.; Börner, M.; Werner, I.; Warneke, Z.; Warneke, J.; Abel, B.; Monakhov, K.Y. Synthesis, Structure, and Surface Adsorption Characteristics of a Polynuclear MnII,IV–YbIII Complex. Inorg. Chem. 2021, 60, 10415–10425. [Google Scholar] [CrossRef]
  22. Caliebe, W.A.; Murzin, V.; Kalinko, A.; Görlitz, M. High-flux XAFS-beamline P64 at PETRA III. AIP Conf. Proc. 2019, 2054, 060031. [Google Scholar]
  23. Bunau, O.; Joly, Y. Self-consistent aspects of X-ray absorption calculations. J. Phys. Condens. Matter 2009, 21, 345501. [Google Scholar] [CrossRef] [PubMed]
  24. Fedoseenko, S.I.; Vyalikh, D.V.; Iossifov, I.F.; Follath, R.; Gorovikov, S.A.; Püttner, R.; Schmidt, J.S.; Molodtsov, S.L.; Adamchuk, V.K.; Gudat, W.; et al. Commissioning results and performance of the high-resolution Russian-German Beamline at BESSY II. Nucl. Instrum. Methods Phys. Res. A 2003, 505, 718–728. [Google Scholar] [CrossRef]
  25. Wang, H.-S.; Zhang, K.; Song, Y.; Pan, Z.-Q. Recent advances in 3d-4f magnetic complexes with several types of non-carboxylate organic ligands. Inorg. Chim. Acta 2021, 521, 120318. [Google Scholar] [CrossRef]
  26. Saha-Dasgupta, T. Double perovskites with 3d and 4d/5d transition metals: Compounds with promises. Mater. Res. Express 2020, 7, 014003. [Google Scholar] [CrossRef]
  27. Ikeno, H.; de Groot, F.M.F.; Stavitski, E.; Tanaka, I. Multiplet calculations of L2,3 X-ray absorption near-edge structures for 3d transition-metal compounds. J. Phys. Condens. Matter 2009, 21, 104208. [Google Scholar] [CrossRef]
  28. de Groot, F. Coord. Multiplet effects in X-ray spectroscopy. Chem. Rev. 2005, 249, 31–63. [Google Scholar]
  29. Peng, G.; de Groot, F.M.F.; Haemaelaeinen, K.; Moore, J.A.; Wang, X.; Grush, M.M.; Hastings, J.B.; Siddons, D.P.; Armstrong, W.H.; Mullins, C.; et al. High-resolution manganese X-ray fluorescence spectroscopy. Oxidation-state and spin-state sensitivity. J. Am. Chem. Soc. 1994, 116, 2914–2920. [Google Scholar] [CrossRef]
  30. Coey, J.M.D. Magnetism and Magnetic Materials; Cambridge University Press: Cambridge, UK, 2010. [Google Scholar]
  31. Ling, C.D.; Neumeier, J.J.; Argyriou, D.N. Observation of Antiferromagnetism in Marokite CaMn2O4. J. Solid State Chem. 2001, 160, 167–173. [Google Scholar] [CrossRef]
  32. Goodenough, J.B. Magnetism and The Chemical Bond; Wiley: Cambridge, MA, USA, 1963. [Google Scholar]
  33. Reitsma, A.J.W.; Feiner, L.F.; Oles, A.M. Orbital and spin physics in LiNiO2 and NaNiO2. New J. Phys. 2005, 7, 121. [Google Scholar] [CrossRef]
  34. Mostovoy, M.V.; Khomskii, D.I. Orbital Ordering in Frustrated Jahn-Teller Systems with 90° Exchange. Phys. Rev. Lett. 2002, 89, 227203. [Google Scholar] [CrossRef] [PubMed]
  35. Pal, S.; Lal, S. Orbital and spin ordering physics of the Mn3O4 spinel. Phys. Rev. B 2017, 96, 075139. [Google Scholar] [CrossRef]
  36. Blundell, S.J. Magnetism in condensed Matter. Oxford Master series. In Condensed Matter Physics; Oxford University Press: Oxford, UK, 2010. [Google Scholar]
  37. Rawson, J.M.; Luzon, J.; Palacio, F. Magnetic exchange interactions in perfluorophenyl dithiadiazolyl radicals. Coord. Chem. Rev. 2005, 249, 2631–2641. [Google Scholar] [CrossRef]
  38. Schulz, C.; Lieutenant, K.; Xiao, J.; Hofmann, T.; Wong, D.; Habicht, K. Characterization of the soft X-ray spectrometer PEAXIS at BESSY II. J. Synchrotron Rad. 2020, 27, 238–249. [Google Scholar] [CrossRef]
  39. Butorin, S.M.; Guo, J.-H.; Magnuson, M.; Kuiper, P.; Nordgren, J. Low-energy d-d excitations in MnO studied by resonant X-ray fluorescence spectroscopy. Phys. Rev. B 1996, 54, 4405–4408. [Google Scholar] [CrossRef]
  40. Kuepper, K.; Klingeler, R.; Reutler, P.; Büchner, B.; Neumann, M. Excited and ground state properties of LaSrMnO4: A combined X-ray spectroscopic study. Phys. Rev. B 2006, 74, 115103. [Google Scholar] [CrossRef]
  41. Ebert, H. Magneto-optical effects in transition metal systems. Rep. Prog. Phys. 1996, 59, 1665. [Google Scholar] [CrossRef]
  42. Goering, E.; Gold, S.; Schutz, G. Ho-Fe-Garnet soft XMCD measurements below and above the compensation temperature. J. Sync. Rad. 2001, 8, 422–424. [Google Scholar] [CrossRef]
  43. Brice-Profeta, S.; Arrio, M.A.; Tronc, E.; Menguy, N.; Letard, I.; Cartier dit Moulin, C.; Noguès, M.; Chanéac, C.; Jolivet, J.-P.; Sainctavit, P. Magnetic order in γ-Fe2O3 nanoparticles: A XMCD study. J. Magn. Magn. Mater. 2005, 288, 354–365. [Google Scholar] [CrossRef]
  44. Goedkoop, J.B.; Thole, B.T.; van der Laan, G.; Sawatzky, G.A.; de Groot, F.M.F.; Fuggle, J.C. Calculations of magnetic X-ray dichroism in the 3d absorption spectra of rare-earth compounds. Phys. Rev. B 1988, 37, 2086–2093. [Google Scholar] [CrossRef]
  45. Thole, B.T.; van der Laan, G.; Fuggle, J.C.; Sawatzky, G.A.; Karnatak, R.C.; Esteva, J.M. 3d X-ray-absorption lines and the 3d94fn+1 multiplets of the lanthanides. Phys. Rev. B 1985, 32, 5107–5118. [Google Scholar] [CrossRef] [PubMed]
  46. Tripathi, S. XMCD Investigation at M4,5 Edges of the Rare Earth Elements in High-Performance Permanent Magnet. PhD Thesis, Universität Stuttgart, Stuttgart, Germany, 2018. [Google Scholar]
  47. Thole, B.T.; Carra, P.; Sette, F.; van der Laan, G. X-Ray circular dichroism as a probe of orbital magnetization. Phys. Rev. Lett. 1992, 68, 1943. [Google Scholar] [CrossRef] [PubMed]
  48. Carra, P.; Thole, B.T.; Altarelli, M.; Wang, X. X-Ray circular dichroism and local magnetic fields. Phys. Rev. Lett. 1993, 70, 694. [Google Scholar] [CrossRef]
  49. Chen, C.T.; Idzerda, Y.U.; Lin, H.J.; Smith, N.V.; Meigs, G.; Chaban, E.; Ho, G.H.; Pellegrin, E.; Sette, F. Experimental Confirmation of the X-Ray Magnetic Circular Dichroism Sum Rules for Iron and Cobalt. Phys. Rev. Lett. 1995, 75, 152–155. [Google Scholar] [CrossRef]
  50. Piamonteze, C.; Miedema, P.; de Groot, F.M.F. Accuracy of the spin sum rule in XMCD for the transition-metal L edges from manganese to copper. Phys. Rev. B 2009, 80, 184410. [Google Scholar] [CrossRef]
  51. Edmonds, K.W.; Farley, N.R.S.; Johal, T.K.; van der Laan, G.; Campion, R.P.; Gallagher, B.L.; Foxon, C.T. Ferromagnetic moment and antiferromagnetic coupling in (Ga,Mn)As thin films. Phys. Rev. B 2005, 71, 064418. [Google Scholar] [CrossRef]
  52. O’Brien, W.L.; Tonner, B.P. Oxygen-induced exchange-coupling reversal at the Mn-Co interface. Phys. Rev. B 1998, 58, 3191. [Google Scholar] [CrossRef]
  53. Yonamoto, Y.; Yokoyama, T.; Amemiya, K.; Matsumura, D.; Ohta, T. Magnetism of an ultrathin Mn Film on Co(100) and the effect of oxidation studied by X-ray magnetic circular dichroism. Phys. Rev. B 2001, 63, 214406. [Google Scholar] [CrossRef]
  54. Bannerjee, S.; O’Brien, W.L.; Tonner, B.P. Unusual magnetic phases in MnCo ultrathin alloy films. J. Magn. Magn. Mater. 1999, 267, 198–199. [Google Scholar] [CrossRef]
  55. Tanemura, Y.; Tanaka, A.; Jo, T. Effect of Coulomb Interaction on the X-Ray Magnetic Circular Dichroism Spin Sum Rule in 3 d Transition Elements. J. Phys. Soc. Jpn. 1996, 65, 1053. [Google Scholar]
  56. Duerr, H.A.; van der Laan, G.; Spanke, D.; Hillebrecht, F.U.; Brookes, N.B. Electron-correlation-induced magnetic order of ultrathin Mn films. Phys. Rev. B 1997, 56, 8156. [Google Scholar] [CrossRef]
  57. Schütz, G.; Goering, E.; Stoll, H. Synchrotron Radiation Techniques Based on X-ray Magnetic Circular Dichroism. In Handbook of Magnetism and Advanced Magnetic Materials; John Wiley & Sons, Ltd.: Hoboken, NJ, USA, 2007. [Google Scholar]
  58. Galanakis, I.; Alouani, M.; Oppeneer, P.M.; Dreyssé, H.; Eriksson, O. Tuning the orbital moment in transition metal compounds using ligand states. J. Phys. Condens. Matter 2001, 13, 4553. [Google Scholar] [CrossRef]
  59. Galanakis, I.; Oppeneer, P.M.; Ravindran, P.; Nordström, L.; James, P.; Alouani, M.; Dreysse, H.; Eriksson, O. Sign reversal of the orbital moment via ligand states. Phys. Rev. B 2001, 63, 172405. [Google Scholar] [CrossRef]
  60. Oppeneer, P.M.; Galanakis, I.; Grechnev, A.; Eriksson, O. Unusual magnetism and magnetocrystalline anisotropy of CrPt3. J. Magn. Magn. Mater. 2002, 240, 371–373. [Google Scholar] [CrossRef]
  61. Tyer, R.; van der Laan, G.; Temmerman, W.M.; Szotek, Z.; Ebert, H. Systematic theoretical study of the spin and orbital magnetic moments of 4d and 5d interfaces with Fe films. Phys. Rev. B 2003, 67, 104409. [Google Scholar] [CrossRef]
  62. Levy, P.M. Rare-Earth-Iron Exchange Interaction in the Garnets. I. Hamiltonian for Anisotropic Exchange Interaction. Phys. Rev. 1964, 135, A155. [Google Scholar] [CrossRef]
  63. de Groot, F.; Kotani, A. Core Level Spectroscopy of Solids; CRC Press: Boca Raton, FL, USA, 2008. [Google Scholar]
  64. Kubin, M.; Guo, M.; Kroll, T.; Loechel, H.; Kaellman, E.; Baker, M.L.; Mitzner, R.; Gul, S.; Kern, J.; Foehlisch, A.; et al. Probing the oxidation state of transition metal complexes: A case study on how charge and spin densities determine Mn L-edge X-Ray absorption energies. Chem. Sci. 2018, 9, 6813–6829. [Google Scholar] [CrossRef]
  65. Ament, L.J.P.; van Veenendaal, M.; Devereaux, T.P.; Hill, J.P.; van den Brink, J. Resonant inelastic X-ray scattering studies of elementary excitations. Rev. Mod. Phys. 2011, 83, 705–767. [Google Scholar] [CrossRef]
  66. Ghiringhelli, G.; Matsubara, M.; Dallera, C.; Fracassi, F.; Tagliaferri, A.; Brookes, N.B.; Kotani, A.; Braicovich, L. Resonant inelastic X-Ray scattering of MnO: L2,3 edge measurements and assessment of their interpretation. Phys. Rev. B 2006, 73, 035111. [Google Scholar] [CrossRef]
  67. Perdew, J.P.; Burke, K.; Ernzerhof, M. Generalized Gradient Approximation Made Simple. Phys. Rev. Lett. 1996, 77, 3865. [Google Scholar] [CrossRef]
  68. Grimme, S.; Ehrlich, S.; Goerigk, L. Effect of the damping function in dispersion corrected density functional theory. J. Comput. Chem. 2011, 32, 1456–1465. [Google Scholar] [CrossRef] [PubMed]
  69. ADF 2020, SCM, Theoretical Chemistry, Vrije Universiteit, Amsterdam, The Netherlands. Available online: http://www.scm.com (accessed on 14 July 2020).
  70. te Velde, G.; Bickelhaupt, F.M.; Baerends, E.J.; Fonseca Guerra, C.; van Gisbergen, S.J.A.; Snijders, J.G.; Ziegler, T. Chemistry with ADF. J. Comput. Chem. 2001, 22, 931–967. [Google Scholar] [CrossRef]
  71. Fonseca Guerra, C.; Snijders, J.G.; te Velde, G.; Baerends, E.J. Towards an order-N DFT method. Theor. Chem. Acc. 1998, 99, 391–403. [Google Scholar] [CrossRef]
  72. van Lenthe, E.; Baerends, E.J. Optimized Slater-type basis sets for the elements 1–118. J. Comput. Chem. 2003, 24, 1142–1156. [Google Scholar] [CrossRef]
  73. van Lenthe, E.; Baerends, E.J.; Snijders, J.G. Relativistic regular two-component Hamiltonians. J. Chem. Phys. 1993, 99, 4597–4610. [Google Scholar] [CrossRef]
  74. McConnell, H.M. Ferromagnetism in Solid Free Radicals. J. Chem. Phys. 1963, 39, 1910. [Google Scholar] [CrossRef]
  75. Yoshizawa, K.; Hoffman, R. The role of orbital interactions in determining ferromagnetic coupling in organic molecular assemblies. J. Am. Chem. Soc. 1995, 117, 6921–6926. [Google Scholar] [CrossRef]
  76. Crocombette, J.P.; Thole, B.T.; Jollet, F. The importance of the magnetic dipole term in magneto-circular X-ray absorption dichroism for 3d transition metal compounds. J. Phys. Condens. Matter 1996, 8, 4095. [Google Scholar] [CrossRef]
  77. Krishnamurthy, V.V.; Keavney, D.J.; Haskel, D.; Lang, J.C.; Srajer, G.; Sales, B.C.; Mandrus, D.G.; Robertson, J.L. Temperature dependence of Eu 4f and Eu 5d magnetizations in the filled skutterudite EuFe4Sb12. Phys. Rev. B 2009, 79, 014426. [Google Scholar] [CrossRef]
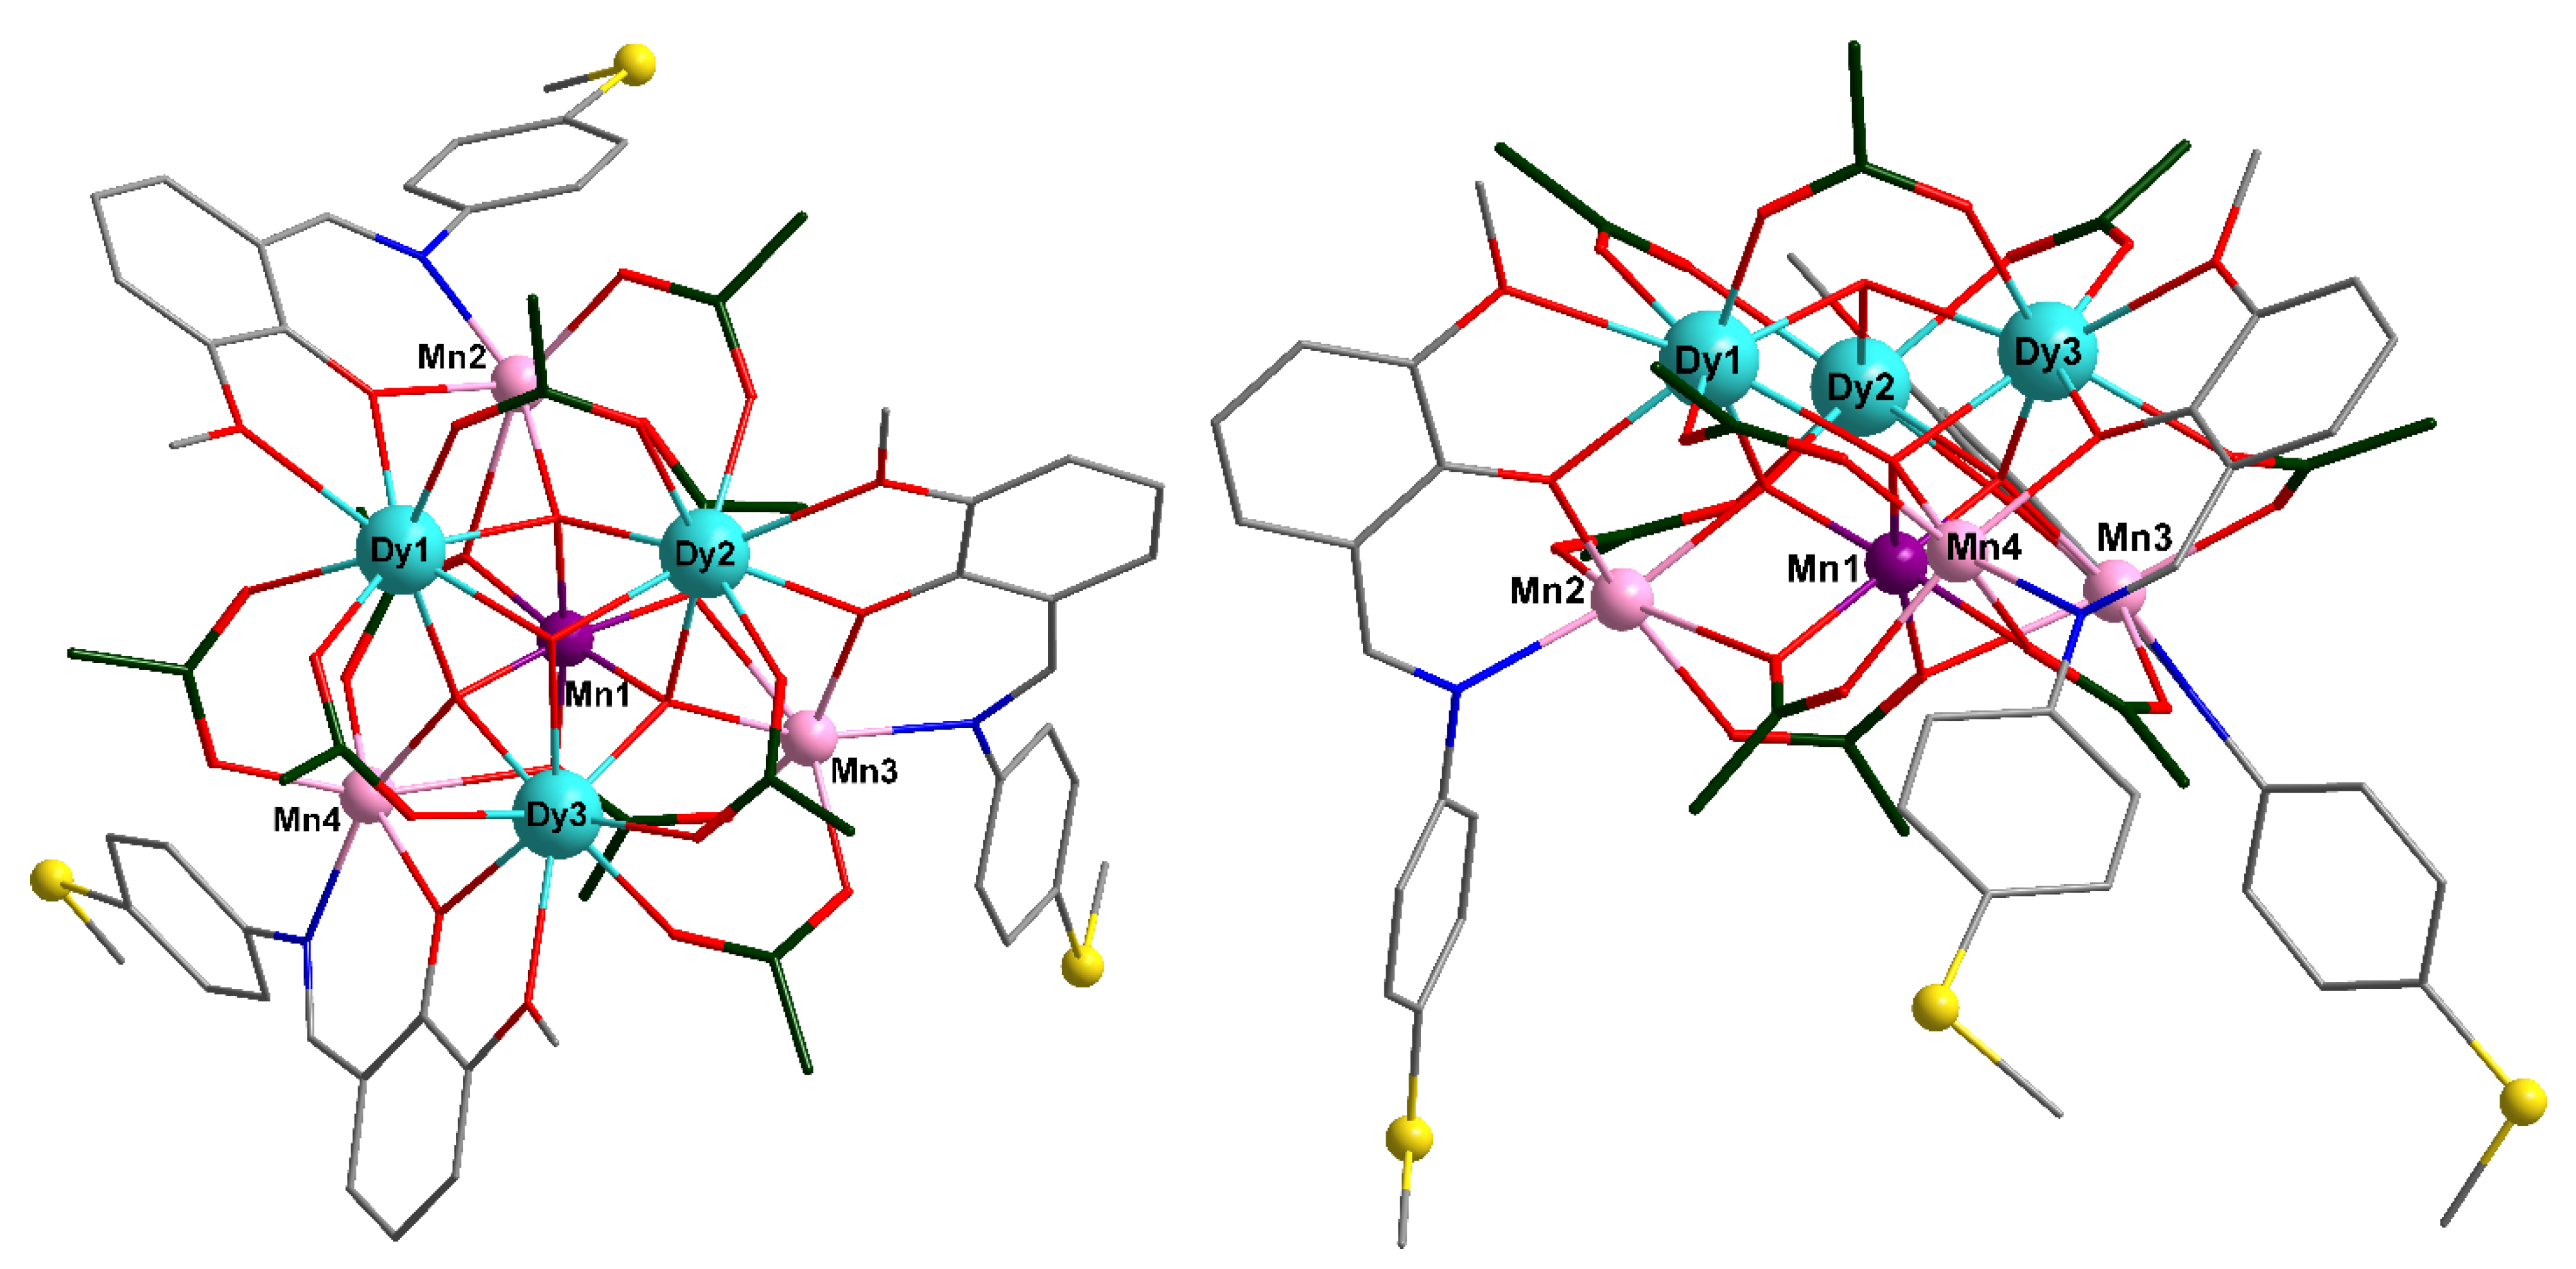
Figure 1. Molecular structure of the {MnII3MnIVDyIII3} coordination complex. Color code: C of acetates, green; C of the Schiff base ligand L∙SMe, gray; Dy, turquoise; MnII, pink; MnIV, purple; N, blue; O, red and S, yellow. H atoms and solvent molecules are omitted for clarity.
Inorganics 12 00286 g001
Figure 2. (a) Theoretical Mn K-edge XANES spectra of four manganese atoms of the {MnII3MnIVDIII3} coordination complex; (b) comparison of the experimental Mn K-edge spectrum with a total spectrum of all four nonequivalent Mn atoms; (c) Fourier transforms of Mn K-edge k3 weighed EXAFS. Mn1…Mn4 are the numbers of the Mn atoms according to Figure 1.
Inorganics 12 00286 g002
Figure 3. Comparison of the experimental Mn L2,3 XAS spectra of {MnII3MnIVDyIII3} and {MnII3MnIVYbIII3} coordination complexes with ones for Mn(acac)2, Mn(acac)3, and MnO2 reference compounds.
Inorganics 12 00286 g003
Figure 4. (left): partial density of states for Mn2+ and Mn4+ atoms ((top) and (middle) panels) and Dy atoms ((bottom) panel); (right): the experimental Mn L2,3 XAS spectra of the {MnII3MnIVDyIII3} coordination complex measured at the PEAXIS (green line) and 4IDC (black line) beamlines (top) and the calculated total density of states spectra for Mn and Dy atoms (bottom). The Fermi level is set at 0 eV.
Inorganics 12 00286 g004
Figure 5. (left): partial density of states averaged for all four Mn atoms in the molecule. The position of the LUMO level is marked with vertical lines; (right): total density of states for Mn and Dy atoms in the molecule. The experimental spectrum (top right) is shifted to the LUMO level. The Fermi level is marked with a vertical line.
Inorganics 12 00286 g005
Figure 6. DFT calculated HOMO-1, HOMO, LUMO, and LUMO + 1 molecular orbitals (an isosurface value is 0.01). Blue and red isosurfaces refer to the positive and negative spins, respectively.
Inorganics 12 00286 g006
Figure 7. The assignment of atoms in the {MnII3MnIVDyIII3} coordination complex (left) and the spin density distribution (right) corresponding to the data presented in Table 1. Blue and red surfaces on the right picture refer to the positive and negative spin density, respectively.
Inorganics 12 00286 g007
Figure 8. (a) XAS spectrum of the {MnII3MnIVDyIII3} coordination complex with excitation energies for RXES measurements marked by the red vertical lines; (b) Selected RXES spectra measured at various excitation energies; (c) The reconstructed RXES map; (d) RXES spectra plotted as energy loss spectra by setting the energy of the elastic peak to 0 eV.
Inorganics 12 00286 g008
Figure 9. Left panel: Mn L2,3-edges XAS (a), XMCD (b), and Dy M4,5-edges XAS (c); XMCD (d) of the {MnII3MnIVDyIII3} complexes. Labels µ+ and µ stand for the left and right directions of the photon helicity. Positive direction of the applied magnetic field is collinear with the photon propagation direction. XMCD spectra measured at the 5T magnetic field and T = 6 K.
Inorganics 12 00286 g009
Figure 10. Mn L2,3-edges XAS (a), XMCD (b), and Dy M4,5-edges XAS (c); XMCD (d) of the {MnII3MnIVDyIII3} coordination complexes deposited on the Au substrate. Labels µ+ and µ stand for the left and right directions of the photon helicity. In (b,d), the measured spectra are indicated in black and their averaged values in blue.
Inorganics 12 00286 g010
Figure 11. Comparison of Mn L2,3-edge (left panel) and Dy M4,5-edge (right panel) XAS (a,c) and XMCD (b,d) spectra of free and deposited on the Au substrate {MnII3MnIVDyIII3} coordination complexes.
Inorganics 12 00286 g011
Figure 12. Mn L2,3-edge XAS and XMCD of the {MnII3MnIVYbIII3} coordination complexes deposited on the Au substrate measured at the magnetic field of 5T (left panel) and −5T (right panel). Labels (a,c) and (b,d) correspond to the XAS and XMCD spectra, respectively.
Inorganics 12 00286 g012
Figure 13. Comparison of Mn L2,3-edges (left panel) and Dy M4,5-edges (right panel) XAS (a,c) and XMCD (b,d) spectra of {MnII3MnIVDyIII3} and {MnII3MnIVYbIII3} coordination complexes deposited on the Au substrate.
Inorganics 12 00286 g013
Table 1. DFT charge and spin density distribution on Mn and Dy atoms in the {MnII3MnIVDyIII3} coordination complex. “↑” corresponds to the spins “up” and “↓” to the spins “down” directions.
AtomChargeSpin DensitySpin
Direction
SPDF
Dy11.98474.93801.05422.97840.41497.0291
1.04912.96980.38722.1327
Dy21.9749−4.88511.04592.97270.36192.1895
1.05572.98090.39427.0244
Dy31.9668−4.88731.04592.97230.36942.1853
1.05522.97770.40397.0235
Mn11.4304−2.59100.95943.15091.37900.0000
1.00363.21013.86660.0000
Mn21.16554.49221.08863.23294.84180.0000
1.04253.16030.46830.0000
Mn31.15474.57391.08943.24074.87950.0000
1.03773.16480.43320.0000
Mn41.15134.60541.09343.24124.89250.0000
1.03883.16170.42120.0000
O1−1.0543−0.02531.95392.54440.01630.0000
1.95102.57350.01530.0000
O2−1.0545−0.05201.95402.53050.01680.0000
1.95092.58670.01570.0000
O3−1.0597−0.01941.95382.5495 0.01680.0000
1.95022.57390.01550.0000
Table 2. Results of the sum rule analysis of the experimental XMCD spectra of the Mn L2,3 and Dy M4,5 edges for the {MnII3MnIVDyIII3} coordination complex. The values of the orbital moment (mL), spin moment (mS), total magnetic moment (mL + mS), and the orbital-to-spin moment ratio (mL/mS) in units of Bohr magneton (μB)/atom are presented.
Orbital mL
B/atom)
Spin mS
B/atom)
Total (mL + mS)
B/atom)
Ratio mL/mS
Mn−0.181.571.39−0.12
Dy2.15−1.470.68−1.46
Disclaimer/Publisher’s Note: The statements, opinions and data contained in all publications are solely those of the individual author(s) and contributor(s) and not of MDPI and/or the editor(s). MDPI and/or the editor(s) disclaim responsibility for any injury to people or property resulting from any ideas, methods, instructions or products referred to in the content.