Article

Mesoporous Titania Nanoparticles for a High-End Valorization of Vitis vinifera Grape Marc Extracts

1
Faculty of Chemical Engineering and Biotechnologies, National University of Science and Technology Politehnica Bucharest, 011061 Bucharest, Romania
2
National Institute of R&D for Biological Sciences, 060031 Bucharest, Romania
3
“Ilie Murgulescu” Institute of Physical Chemistry, Romanian Academy, 202 Splaiul Indepedentei, 060021 Bucharest, Romania
*
Author to whom correspondence should be addressed.
Current address: Department of Chemistry and Manchester Institute of Biotechnology, The University of Manchester, Manchester M1 7DN, UK.
Inorganics 2024, 12(10), 263; https://doi.org/10.3390/inorganics12100263
Submission received: 15 August 2024 / Revised: 30 September 2024 / Accepted: 1 October 2024 / Published: 3 October 2024
(This article belongs to the Special Issue New Advances into Nanostructured Oxides, 2nd Edition)

Abstract

:
Mesoporous titania nanoparticles (NPs) can be used for encapsulation polyphenols, with applications in the food industry, cosmetics, or biomedicine. TiO2 NPs were synthesized using the sol-gel method combined with solvothermal treatment. TiO2 NPs were characterized through X-ray diffraction, FTIR spectroscopy, the N2 adsorption method, scanning and transmission electron microscopy, and thermal analysis. The sample prepared using Pluronic F127 presented a higher surface area and less agglomerated NPs than the samples synthesized with Pluronic P123. Grape marc (GM), a by-product from wine production, can be exploited for preparing extracts with good antioxidant properties. In this regard, we prepared hydroethanolic and ethanolic GM extracts from two cultivars, Feteasca Neagra (FN) and Pinot Noir. The extract components were determined by spectrometric analyses and HPLC. The extract with the highest radical scavenging activity, the hydroethanolic FN extract, was encapsulated in titania (FN@TiO2) and compared with SBA-15 silica support. Both resulting materials showed biocompatibility on the NCTC fibroblast cell line in a 50–300 µg/mL concentration range after 48 h of incubation and even better radical scavenging potential than the free extract. Although titania has a lower capacity to host polyphenols than SBA-15, the FN@TiO2 sample shows better cytocompatibility (up to 700 µmg/mL), and therefore, it could be used for skin-care products.

Graphical Abstract

1. Introduction

An effective carrier for biologically active molecules should meet the following conditions: a high specific surface area and pore volume, tunable pore size, good biocompatibility and no toxicity, and the possibility to adjust the interactions between biologically active molecules and the support. The most used inorganic matrix for the encapsulation of biologically active compounds is mesoporous silica, which presents outstanding porosity (up to 1200 m2/g specific surface area and 1.5 cm3/g pore volume), good biocompatibility depending on particle size and shape, surface properties, concentration, etc. [1,2,3]. Silica nanoparticles are generally assessed as safe and biocompatible by the US Food and Drug Administration (FDA) and have been employed as additives in cosmetics and foods [4].
Among functional inorganic materials, nanostructured titania is of particular interest due to its remarkable features: good chemical and thermal stability, low cost, biocompatibility, resistance to photochemical erosion, and excellent optical and electrical properties. Titania is used intensively in environmental applications to remove pollutants from both air and water [5]. Titania, which has already been successfully applied as an implant material or in cosmetic formulations, can also be employed as a carrier for biologically active compounds [6]. For example, in 2012, mesoporous titania was tested as a carrier for ibuprofen [7].
Titania exhibits photocatalytic properties under UV irradiation but has a lower adsorption capacity than mesoporous silica, so by combining the properties of both silica and titania, titania–silica composites have been successfully applied as photocatalysts for environment purification [8], as well as for biomedical applications [9]. Titania nanoparticles (NPs) are poorly soluble in biological fluids and thus pose challenges when used in biomedical applications. However, titania NPs have been applied in photodynamic therapy for the tumors’ treatment [10,11]. There are reports that showed that titania NPs help to neutralize bacterial or fungal strains [12].
Unlike silica, mesoporous titania exhibits lower porosity values (up to 250 m2/g specific surface area and 0.4 cm3/g pore volume) and a lower concentration of surface OH groups that can be involved in functionalization reactions, but it could interact with biologically active substances through donor–acceptor bonds.
Typically, mesoporous titania is produced by the soft-templated sol-gel method based on the hydrolysis and condensation reactions involving the cooperative assembly of titanium precursor, usually, titanium isopropoxide or titanium butoxide, with the structure directing agent in the presence of a complexation agent that slows down the rate of hydrolysis and condensation reactions. The sol-gel process of Ti precursors differs from that of silicon alkoxides because of their higher chemical reactivity, resulting from the lower electronegativity of titanium and its ability to spontaneously enhance the coordination number with water molecules, with the hydrolysis rate of titanium alkoxide being five times faster than silicates, hindering the cooperative assembly of inorganic species with surfactant molecules [13].
Red Vitis vinifera L. grape marc (GM) resulting from winemaking is an affordable source of polyphenols, including anthocyanins, flavonoids, stilbenes, flavan-3-ols, and phenolic acids, which have antioxidant, anti-inflammatory, antidiabetic, and cardioprotective properties, antiproliferative effects [14], and potent broad virucidal activity [15]. For instance, Balea et al. [16] reported that Feteasca Neagra extract prepared in 70% ethanol from fermented grape pomace exhibited antiproliferative activity on A549 lung carcinoma, MDA-MB-231 human breast adenocarcinoma, and B164A5 murine melanoma, with the best results being obtained for the last cell line.
There are studies on phenolic compounds in wines. For example, malvidin glycosides are formed during wine maturation [17]. Goldberg et al. [18] highlighted that climate influences the concentration of quercetin, as wines originating from areas with a warmer climate and greater exposure to sunlight had a higher concentration of quercetin. The presence of p-coumaric acid in wines seems to be more random than that of quercetin, with this phenolic acid being important because it acts as a precursor of flavonols, flavan-3-ols, and trihydroxy stilbenes [17].
Lately, the demand for natural extracts with antioxidant properties for cosmetics and nutraceuticals is of growing interest and the use of an abundant waste such as grape marc from wine production can contribute to the sustainability of this field [19]. Wasilewski et al. [20] reported a shower gel formulation enriched with compounds extracted from grape pomace, which was safe for utilization as natural cosmetics.
The recovery of biologically active substances from GM is done by extraction, with the yield and chemical profile depending on the type of solvent, the extraction technique and its parameters, and the quality of the grape pomace, which in turn is strongly influenced by the climate, etc. [21,22,23].
Herein, we report the synthesis of a series of mesoporous titania NPs by combining the sol-gel process and solvothermal treatment using two metal precursors, titanium(IV) isopropoxide and titanium(IV) butoxide, and two nonionic surfactants, the triblock copolymer EO20-PO70-EO20 (Pluronic P123) or EO99-PO70-EO99 (Pluronic F127), in various molar ratios, 2-propanol or n-butanol, as the solvent and acetic acid was used to delay the hydrolysis rate of the metallic alkoxide. Titania NPs with the best features were used to encapsulate a hydroethanolic extract prepared from red grape marc, and the resulting material was compared with the material obtained by incorporating the same extract in mesoporous SBA-15 silica. We also evaluated the chemical profile of several ethanolic or hydroethanolic extracts prepared from the red grape marc from two varieties: Feteasca Neagra and Pinot Noir.

2. Results

2.1. Obtaining and Characterization of Mesoporous Matrices

A series of mesoporous titania nanoparticles were synthesized by the sol-gel method assisted by solvothermal treatment using as a template agent either the triblock copolymer, EO20-PO70-EO20 (Pluronic P123) or the nonionic surfactant EO99-PO70-EO99 (Pluronic F127). The scheme showing the steps of obtaining the titania samples can be seen in Figure 1, while Table 1 lists the titanium precursor, the solvent, the molar ratio between the titanium precursor and template agent used in the synthesis of titania NPs, and how the samples are denoted. Titania samples obtained after solvothermal treatment and purified through Soxhlet extraction (samples labeled Sn_E) or calcined at 400 °C (samples labeled Sn_C) were characterized by wide-angle powder X-ray diffraction (XRD), FTIR spectroscopy, thermal analysis, scanning electron microscopy, transmission electron microscopy, and porosity evaluation based on N2 adsorption–desorption isotherms.

2.1.1. X-ray Diffraction

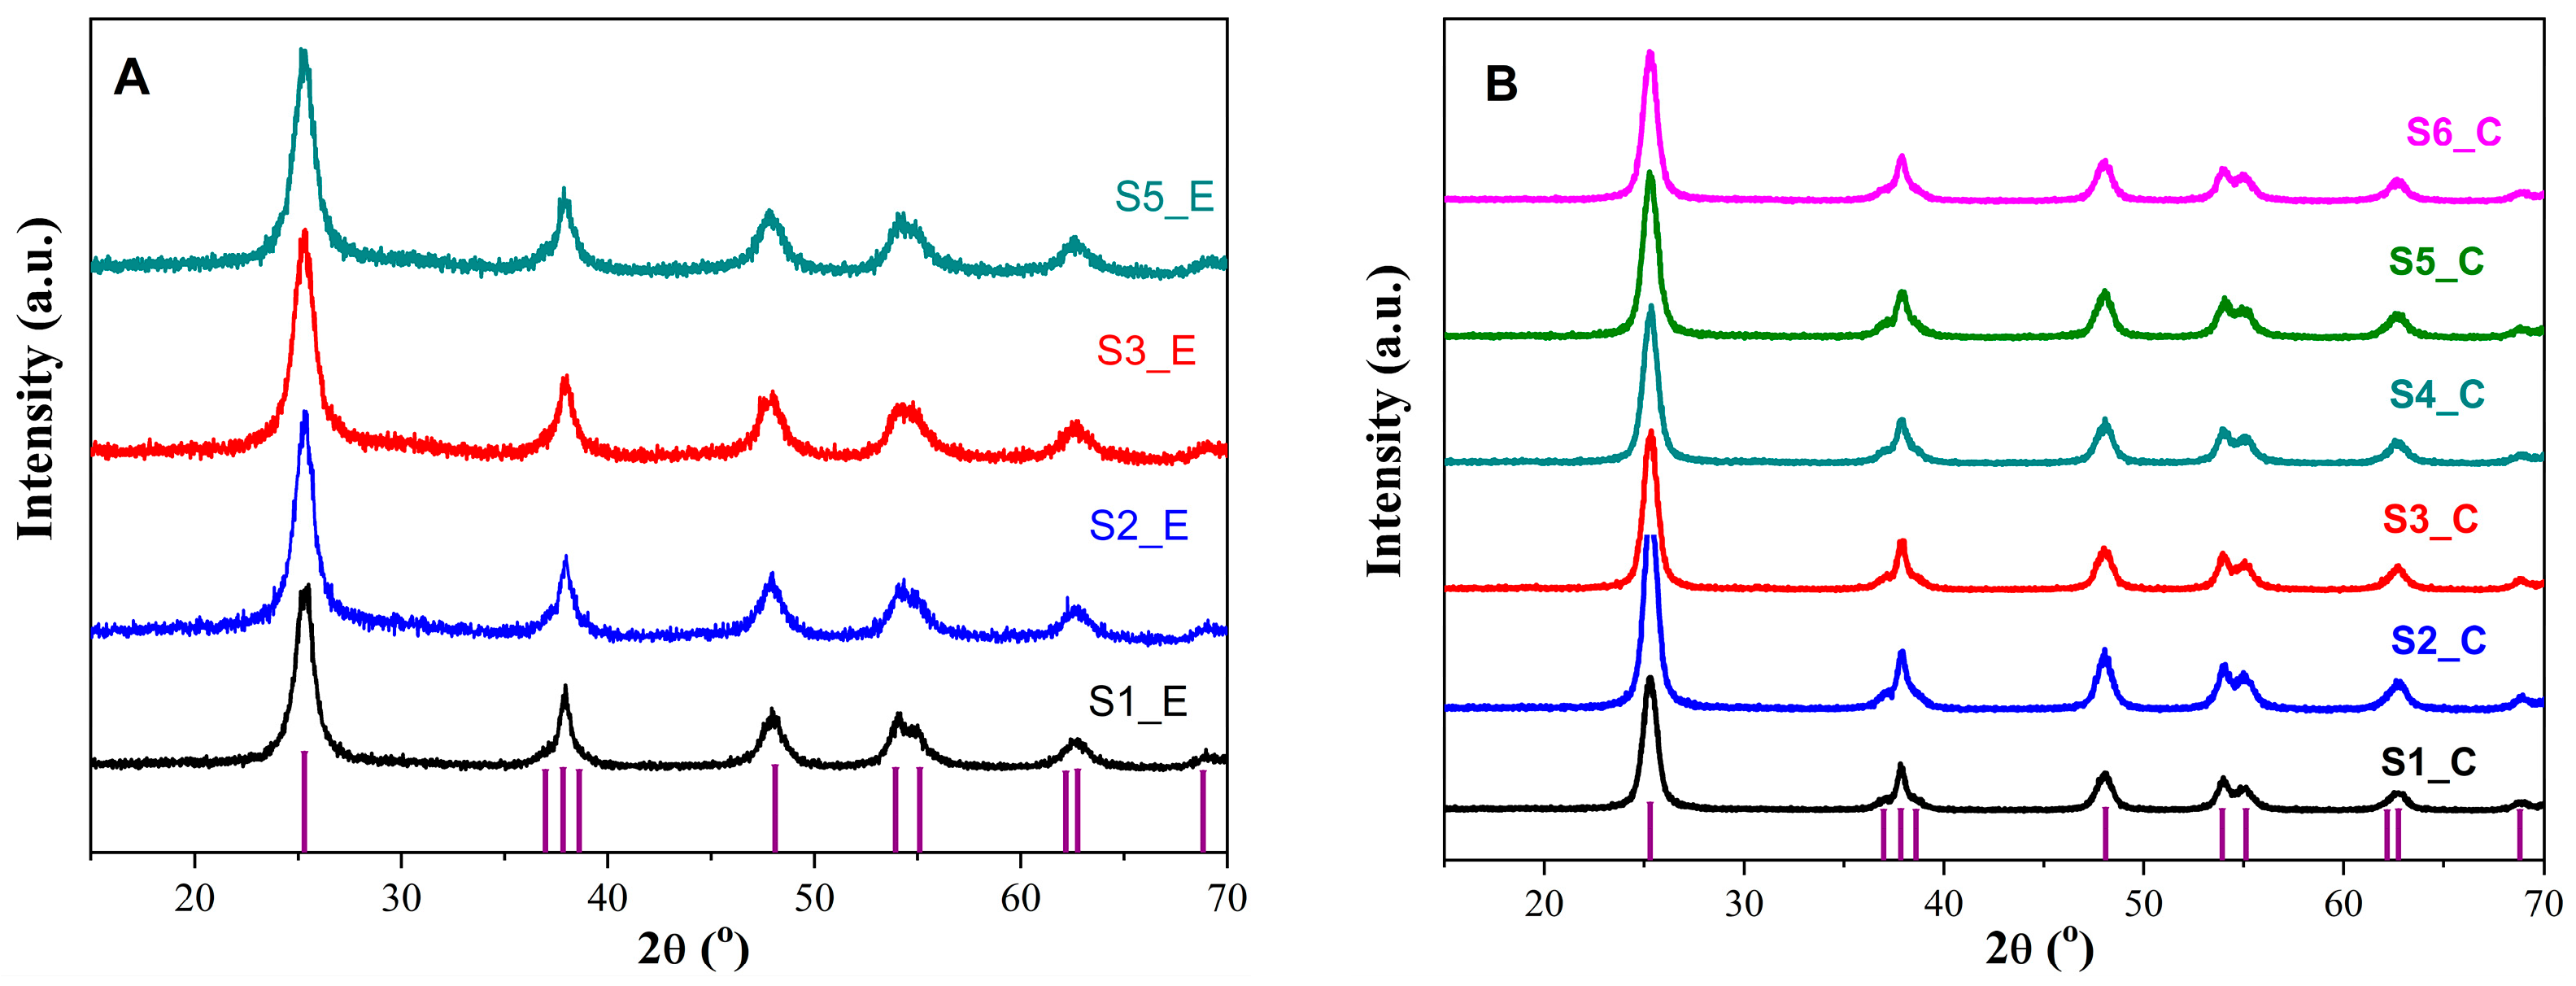
The XRD patterns of the titania samples demonstrated the formation of an anatase crystalline phase, having tetragonal symmetry for all samples irrespective of the structure directing agent, titanium precursor, or quantity of the surfactant used in the synthesis. The thermal treatment determined the preservation of the anatase phase (JCPDS no. 21-1272) and an increase in its crystallinity, with a crystallite size of D101 = 8 nm, calculated using Rigaku PDXL software version 1.8 from the most intense diffraction peak at 2θ = 25.27° for uncalcined materials (Figure 2A), and D101 = 10 nm for the samples obtained at 400 °C (Figure 2B).

2.1.2. Morphology of Mesoporous Inorganic Matrices

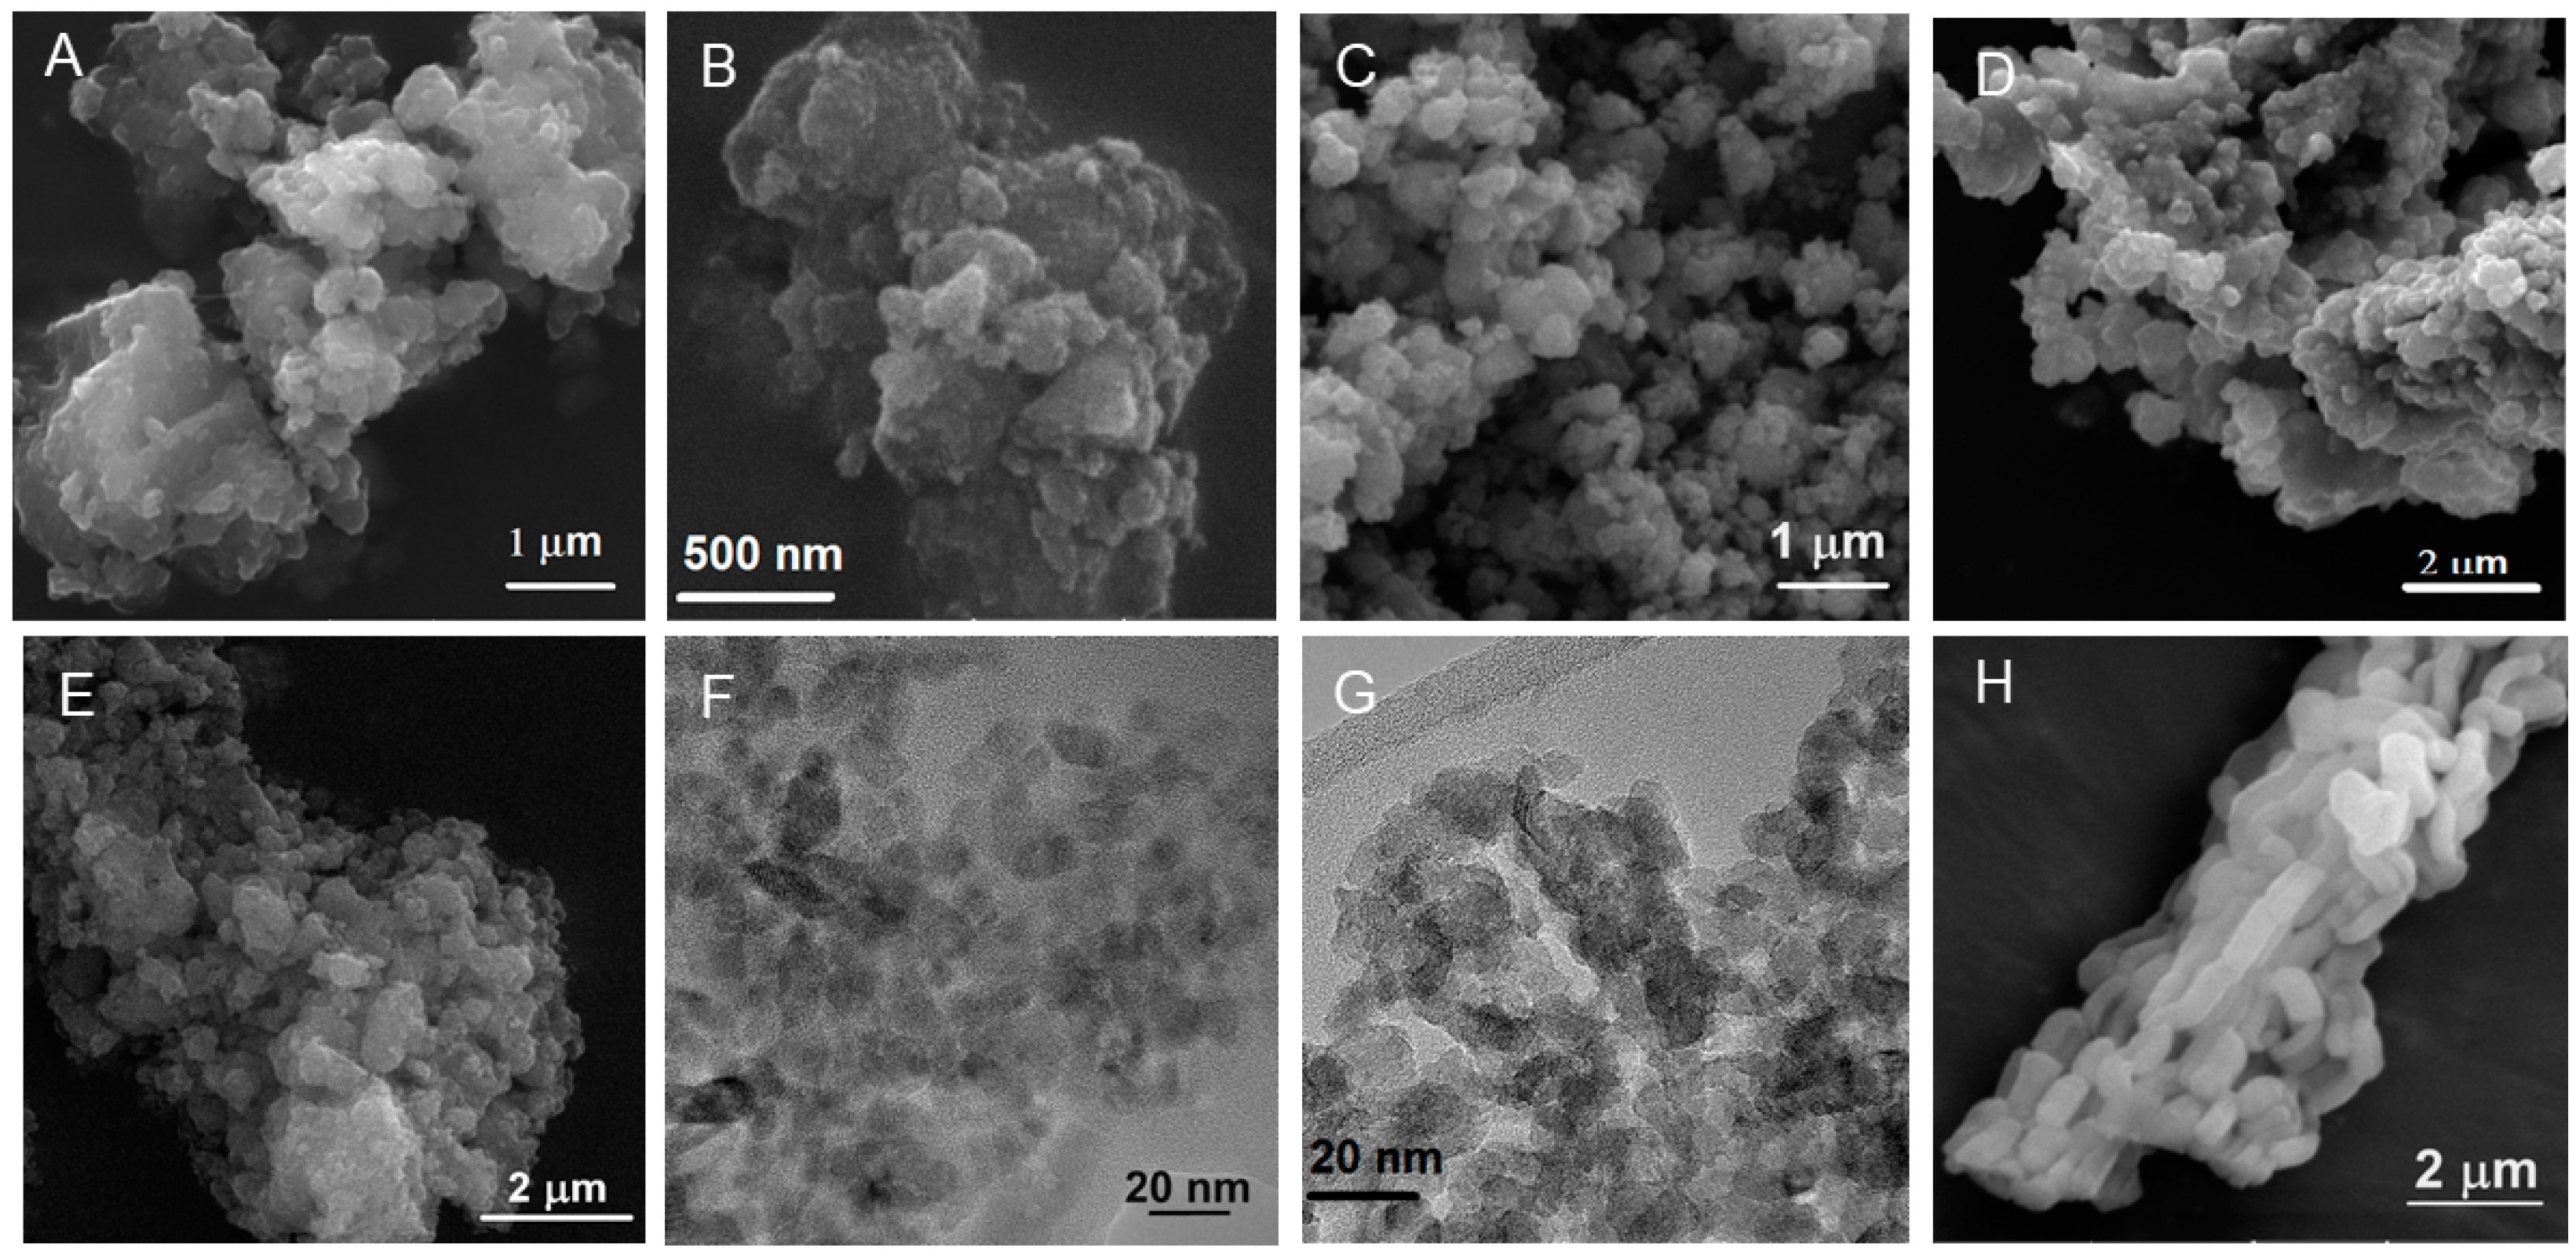
The morphology of titania samples was investigated by scanning and transmission electron microscopy (Figure 3). The use of titanium(IV) butoxide as a precursor yielded more agglomerated nanoparticles (Figure 3A,B,D) than in the case of titanium(IV) isopropoxide (Figure 3C,E). TEM investigation demonstrated the crystalline nature of TiO2 NPs and the interparticle pores formation (Figure 3F,G). Titania samples present polyhedral nanoparticles with around 10 nm dimension, which are agglomerated. The particle sizes of the calcined S3_C (Figure 3F) and S5_C (Figure 3G) samples observed on the TEM investigation were consistent, with the crystallite size found based on XRD analyses. Mesoporous SBA-15 silica presents rod-type particles with an average diameter of 447 nm and a length/diameter ratio in the range of 2.04–2.20 (Figure 3H).

2.1.3. FTIR Spectroscopy

In the FTIR spectra of the titania samples isolated after solvothermal treatment (S3 and S5), one can notice the characteristic bands of methyl and methylene groups in the range of 2850–2930 cm−1, as well as the ether bridge vibrations ranging in the 1410–1530 cm−1 domain that demonstrate the presence of the polymer on the surface of titanium dioxide nanoparticles (Figure 4). The extraction process in ethyl alcohol for 24 h did not completely remove the structure directing agent, as its characteristic vibrations were still present but less intense in the FTIR spectra of the samples purified by extraction, S1_E and S3_E (Figure 4). The calcining step at 400 °C caused the removal of the template agent regardless of the polymer type (Figure 4—spectrum of S3_C sample). In the FTIR spectra of all TiO2 samples, irrespective of the stage in which the samples were analyzed, one can notice the specific bands of Ti–O and Ti–O–Ti bonds at 677 cm−1 and 466 cm−1, respectively [24], as well as the stretching modes of vibration of hydroxyl groups with the lowest transmittance value at 3420 cm−1 and the bending band of adsorbed water molecules at 1634 cm−1. The stretching vibrations of -OH groups are less intense in the case of the calcined S3_C sample than in the spectra of the other NPs isolated after solvothermal treatment, S3 and S5, or after Soxhlet extraction, S1_E and S3_E (Figure 4).

2.1.4. Thermal Analysis

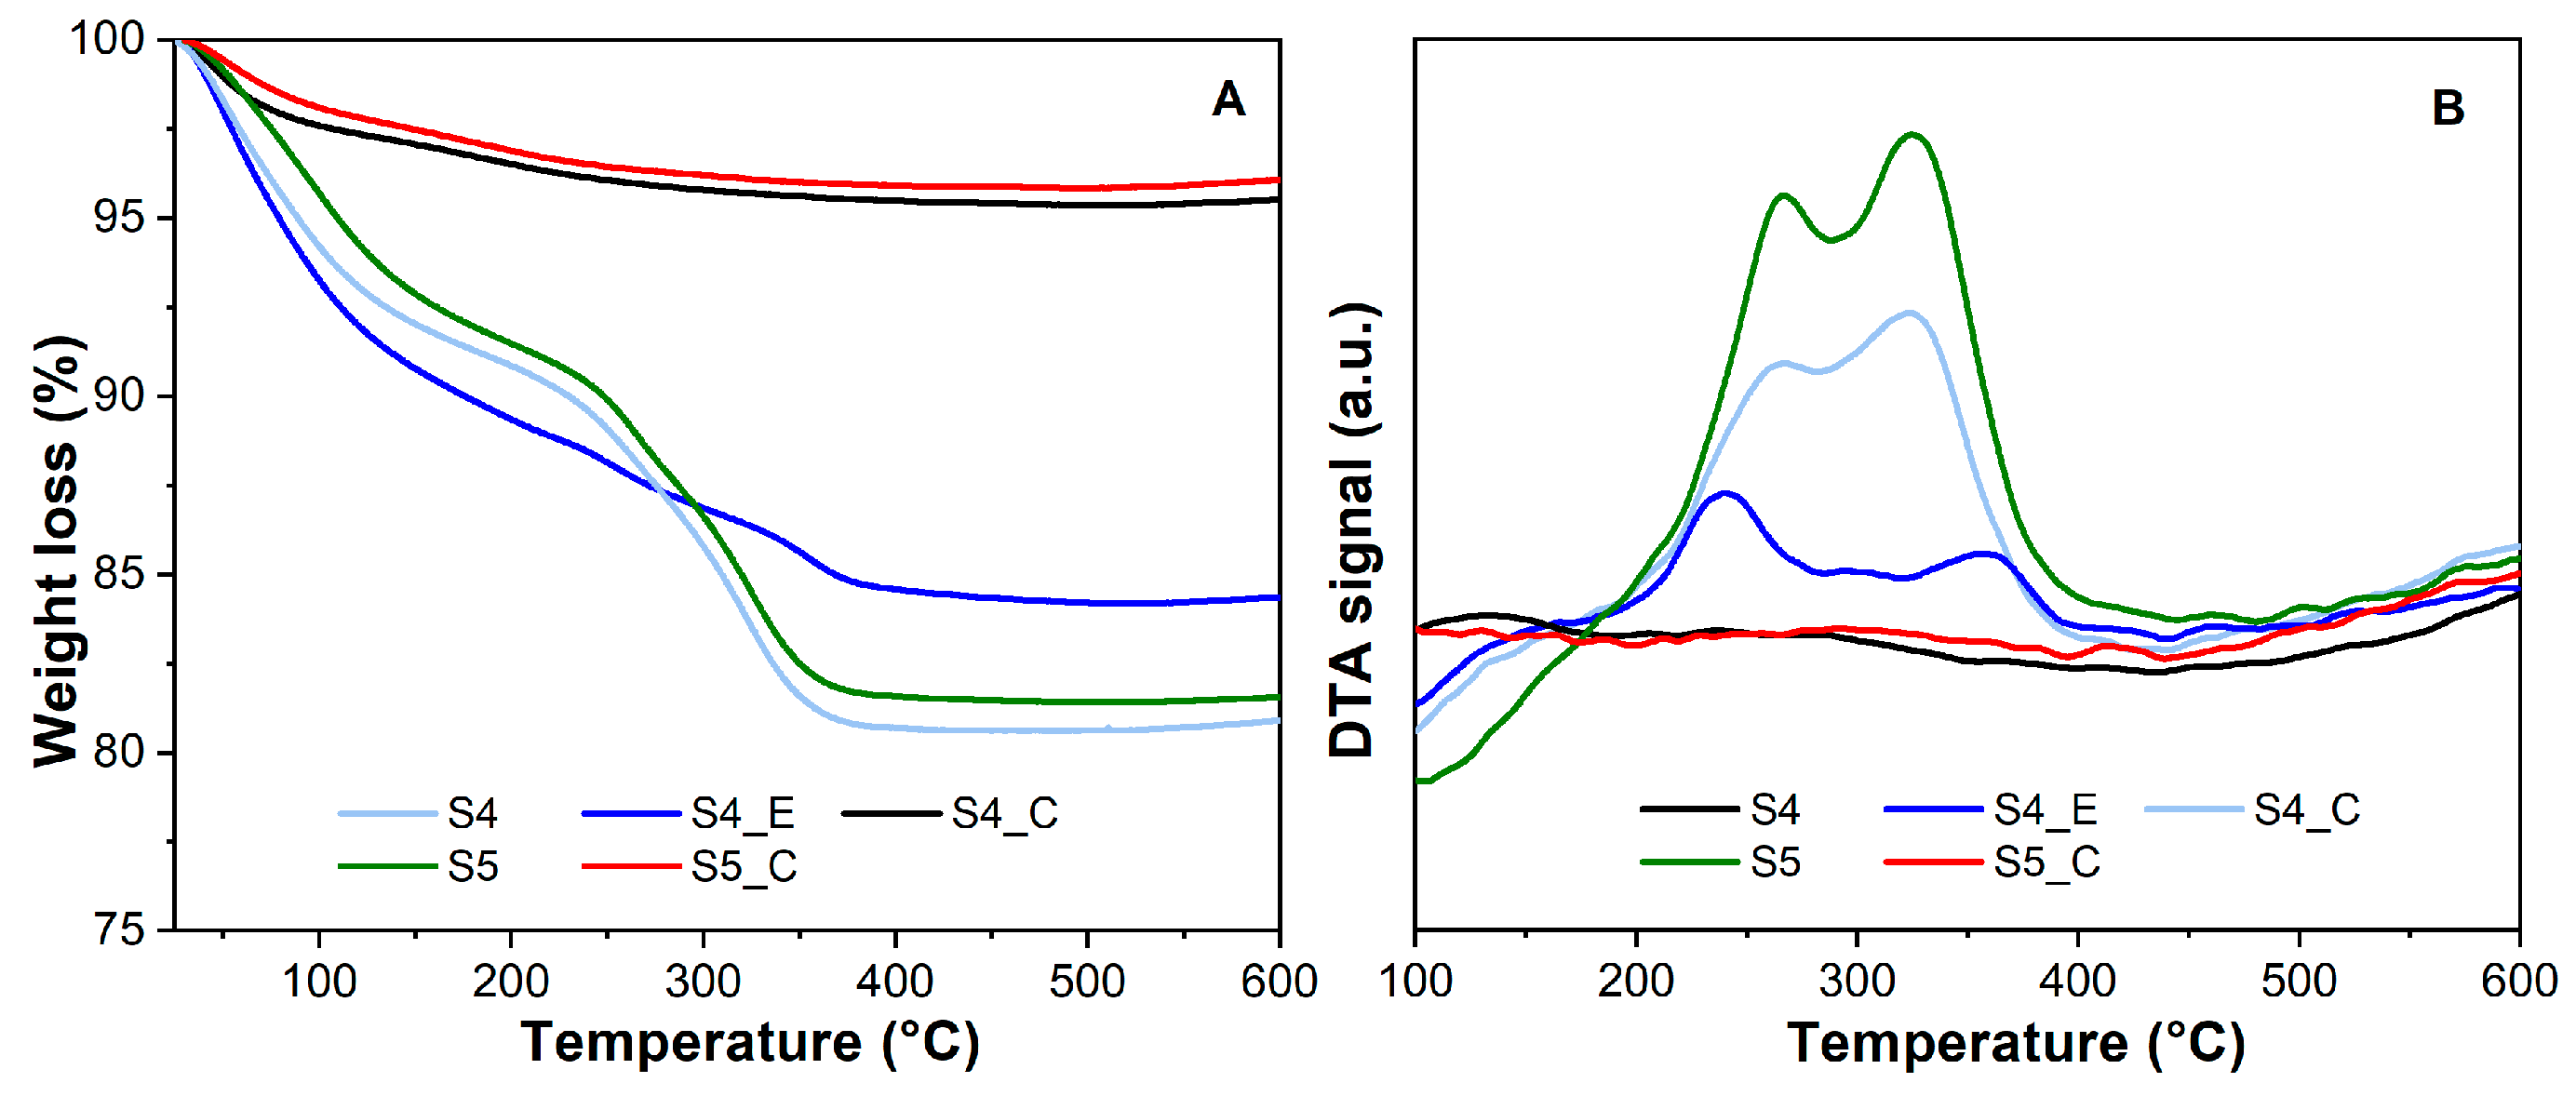
The copolymers decompose in steps up to 400 °C. The extraction process was not very efficient, a content of about 10% (wt.) copolymer remained in the materials purified by Soxhlet extraction (Figure 5A). In agreement with FTIR spectra, the DTA-TG analysis showed that the thermal treatment at 400 °C for 3 h completely removed the surfactant, as no effect was recorded on the DTA traces of the calcined samples (Figure 5B).

2.1.5. Evaluation of the Porosity for Mesoporous Inorganic Matrices

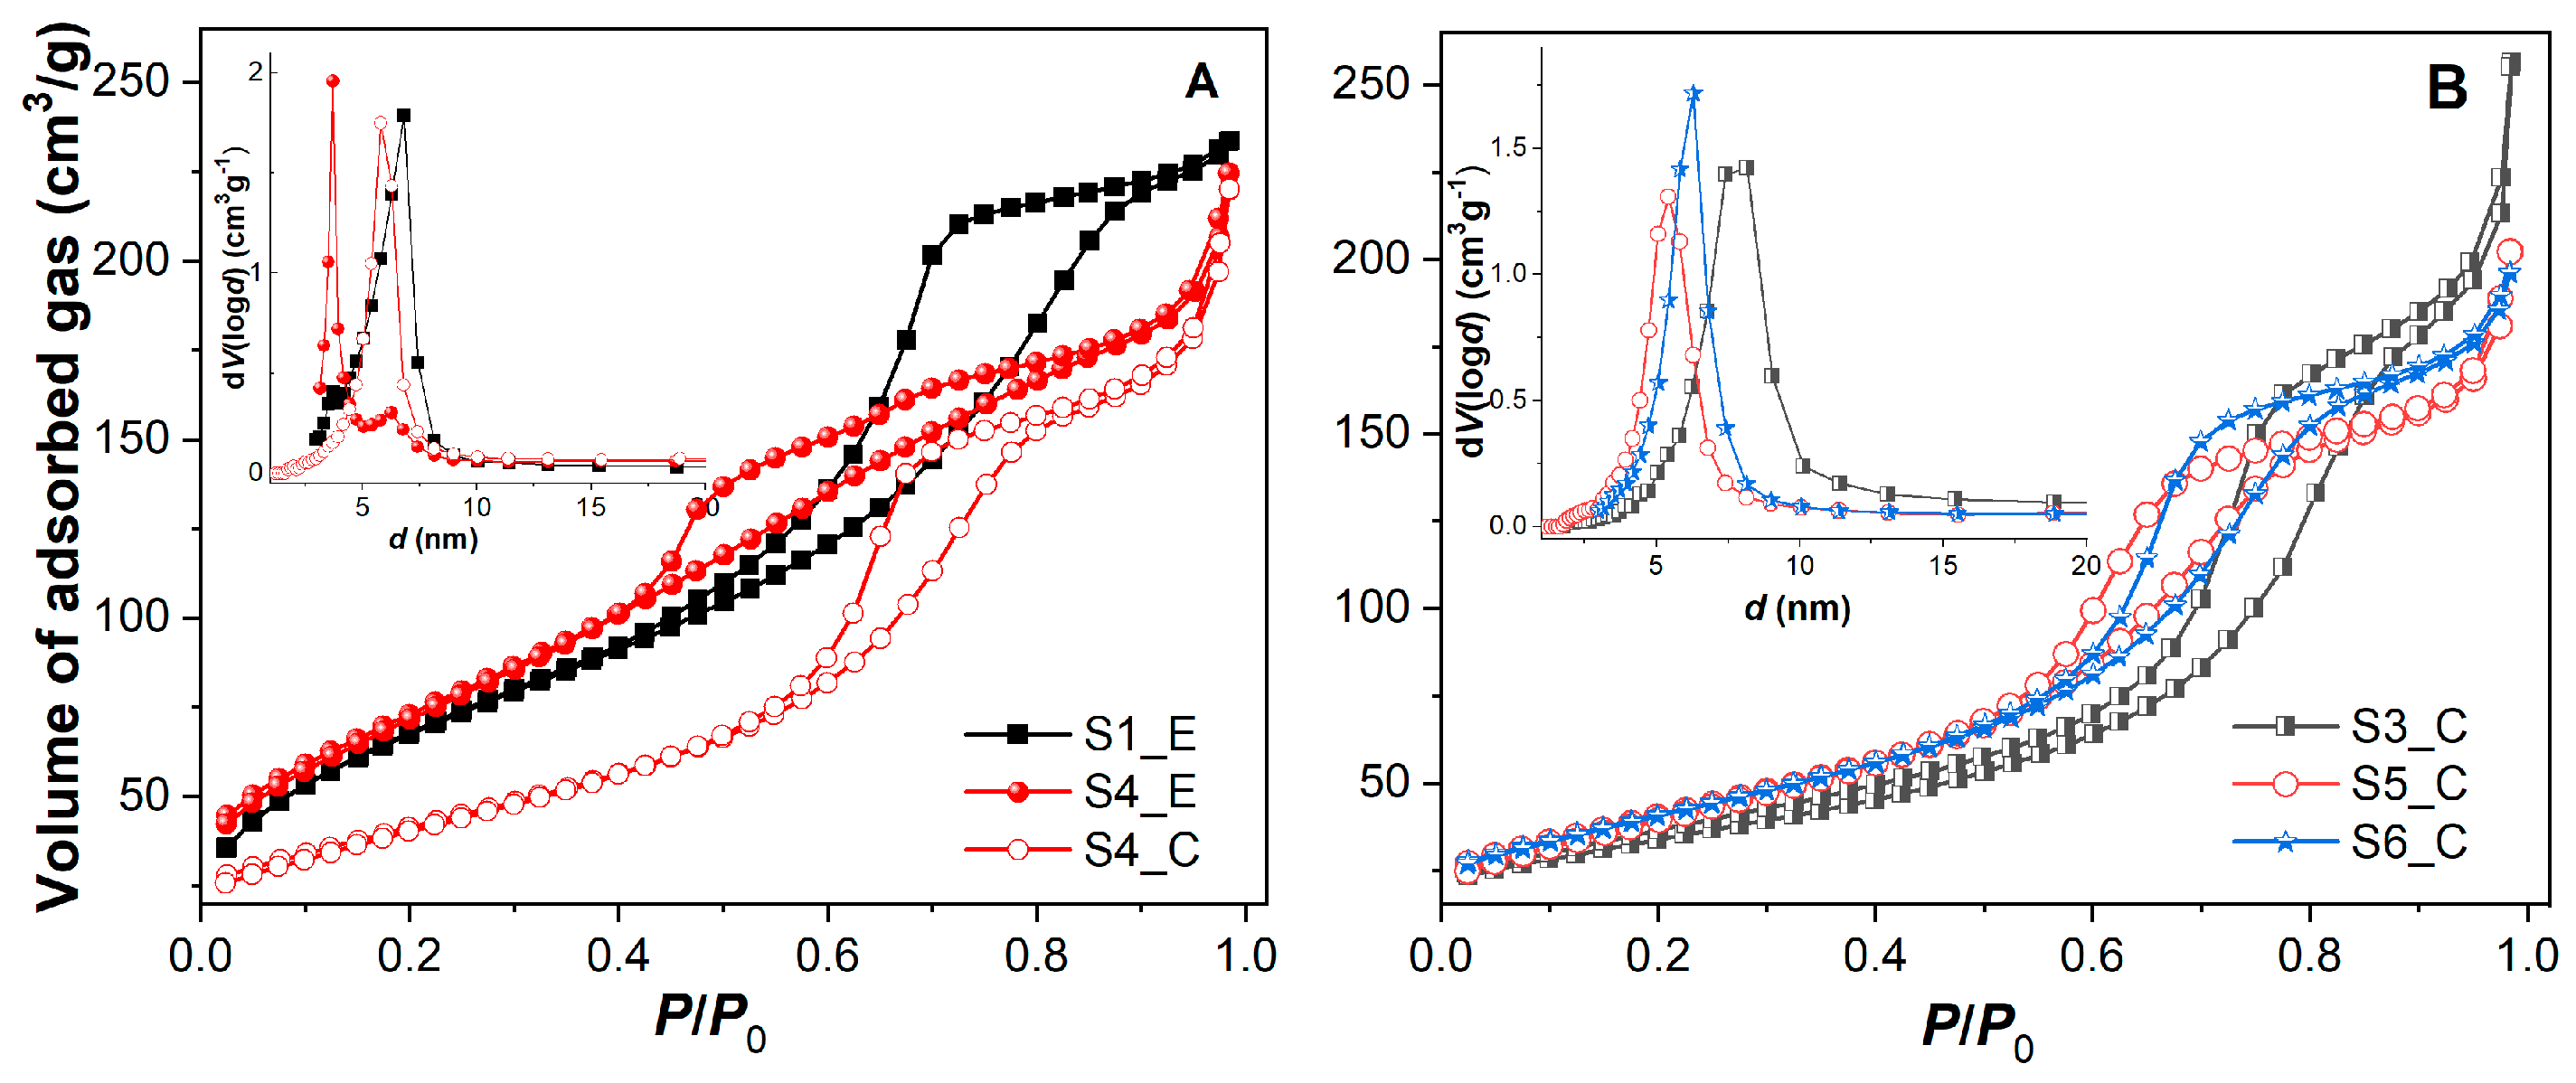
The textural properties of the titania samples were determined from nitrogen adsorption–desorption isotherms, recorded at liquid nitrogen temperature, that are type IV with hysteresis at P/P0 > 0.5, characteristic for mesoporous materials with wormlike pores. The porosity of the titania samples is mainly due to interparticle pores, evidenced by a sharp increase in the volume of adsorbed gas in the region of high P/P0 values (Figure 6A,B and Figure S1). Table 2 gathered the parameters determined from nitrogen adsorption–desorption isotherms: specific surface area, SBET, determined by applying BET theory, total pore volume measured at relative pressure, P/P0 = 0.985, and average pore diameter, dBJH, calculated from the desorption branch of the isotherms with BJH method. The uncalcined titania samples have a higher specific surface area, SBET, than the calcined materials (312 and 274 m2/g for S2_E and S4_E, respectively, and 154 m2/g in the case of S4_C), probably because of the contribution of remaining copolymer on titania nanoparticles surface (Table 2). When Ti(OnBu)4 was used as the precursor in the synthesis, this resulted in higher values of average pore size (6.3 nm for S6_C in comparison with 5.4 nm for S5_C for which Ti(OiPr)4 was used), although the specific surface area and total pore volume did not change significantly (153 m2/g and 0.33 cm3/g for S5_C and 153 m2/g and 0.31 cm3/g for S6_C-Table 2). The use of the copolymer F127 instead of Pluronic P123 for titania nanoparticles synthesis did not have an important contribution to the porosity of the resulting materials. A higher copolymer quantity introduced in the synthesis led to a diminution of the pore size (7.4 nm and 5.8 nm for S3_C and S4_C, respectively, Table 2). SBA-15 silica had higher porosity than all titania NPs with the following textural features: SBET = 984 m2/g, V = 1.31 cm3/g, and the average diameter of the mesopores computed from the desorption branch of isotherm, dBJH = 6.3 nm.

2.2. Obtaining and Characterization of Red GM Extracts

The polyphenols extraction was carried out using Vitis vinifera L. red grape marc (GM) from two cultivars, Feteasca Neagra (FN) and Pinot Noir (PN), from the Research Station for Viticulture Murfatlar (Constanta County, Romania). The extracts were obtained by conventional technique at reflux using FN and PN grape pomace samples collected after wine production in 2018 or 2019 and ethanol or 50% ethanol aqueous solution as solvent.
For all extracts, the following data were determined by UV-vis methods: the total polyphenols index (TP) expressed as gallic acid (GA) equivalents based on the chemical reaction between phenolic substances and Folic Ciocâlteu reagent, the total flavonoids index (TF) expressed as quercetin (Q) equivalents, based on the chemical reaction between flavonoids and the aqueous solution of AlCl3, and the total anthocyanin pigments (TA) expressed as cyanidin-glucoside (CG) equivalents using the method described by Lee et al. [25]. All these data are presented in Table 3. The radical scavenging activity (RSA) was expressed as Trolox (T) equivalents using two assays: DPPH and ABTS.
Upon first glance at the data in Table 3, one can observe that the type of red GM and the harvest year strongly influenced the quantity of phenolic compounds in the extracts. The extract richest in polyphenols is the hydroethanolic FN extract prepared from Feteasca Neagra GM collected in 2019. Both GMs used in this study from 2018 were very poor in phytocompounds, probably because the climate has altered the quality of these wastes. For all extracts prepared from GMs collected in 2018, we obtained very low yields (in the range of 0.4–6.5%) and TP index values (47.09–147.71 mgGA/g extract). Regarding the solvent, the 50% ethanol aqueous solution was more effective in the recovery of polyphenols (147.71 for FN(E-W) vs. 71.02 mgGA/g extract for FN(E) extract) than absolute ethanol, which was better at extracting flavonoids (12.31 and 5.06 mgQ/g extract for FN(E) and FN(E-W), respectively, or 13.34 and 11.94 mgQ/g extract for PN(E) and PN, respectively.
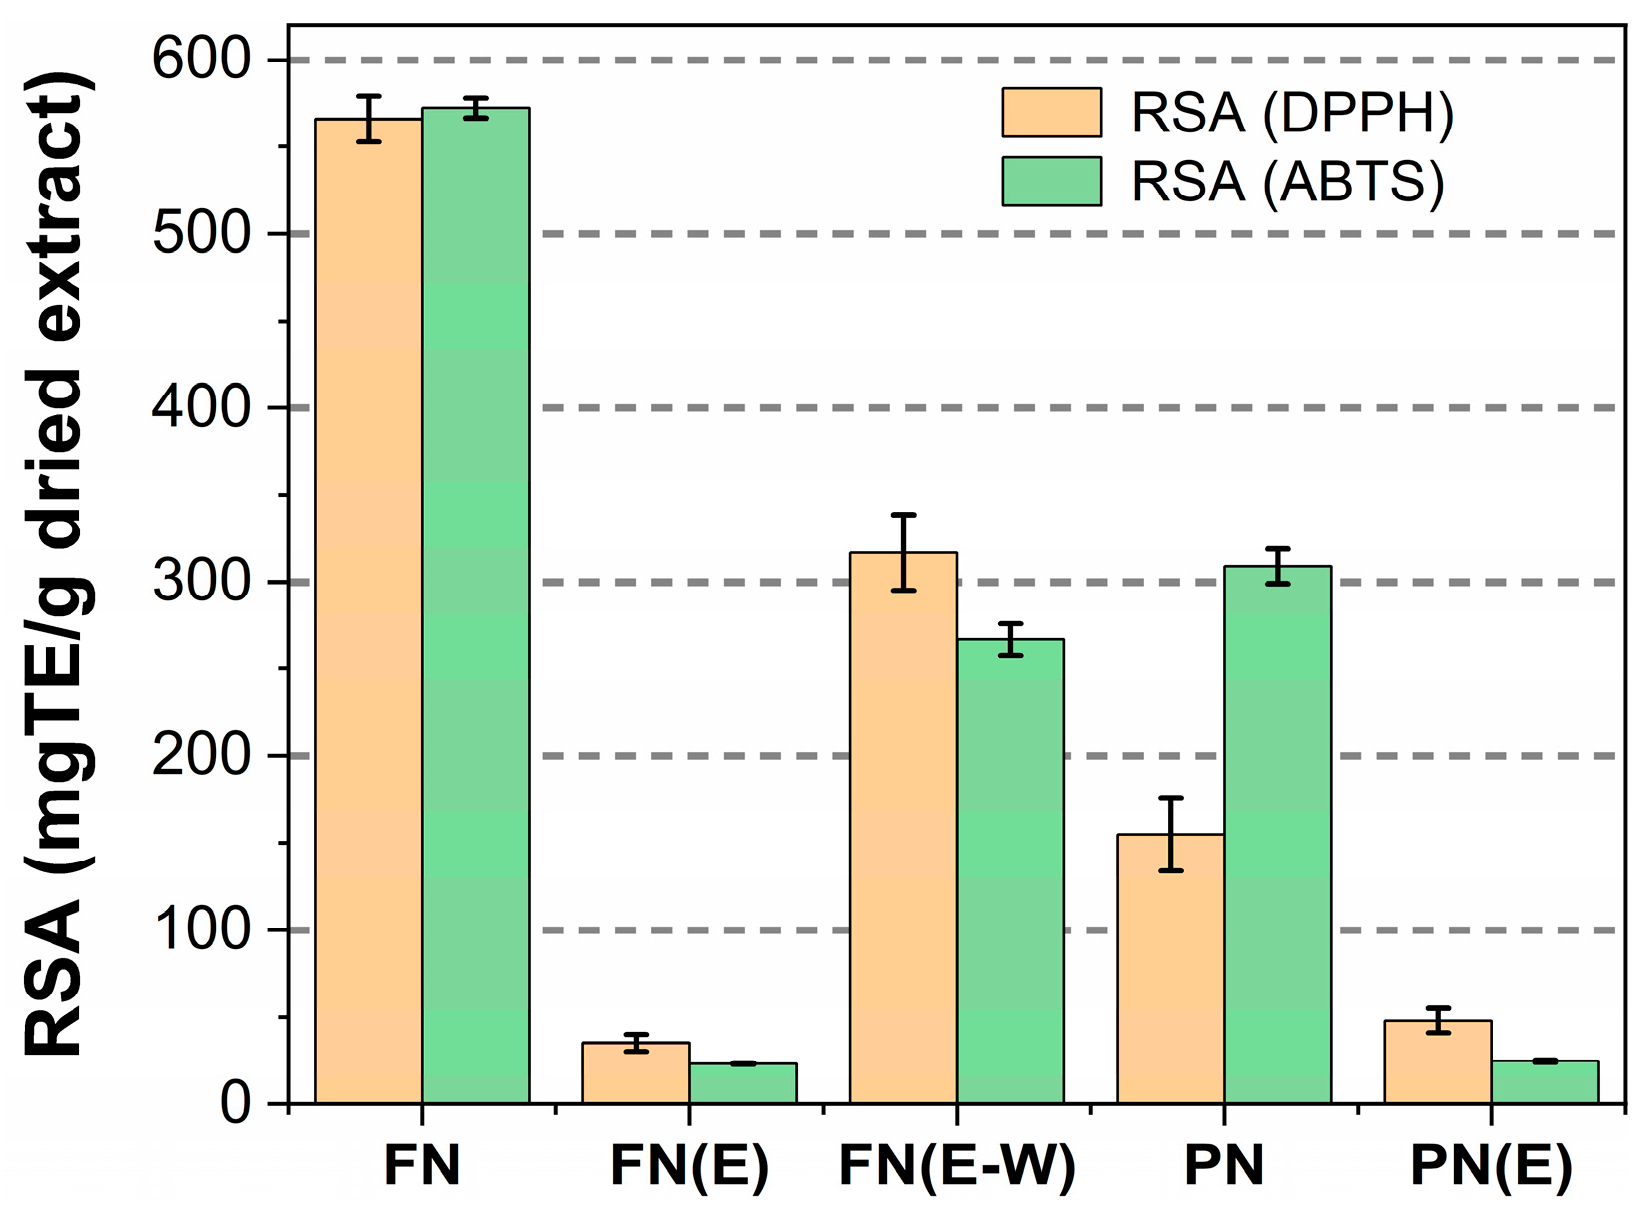
Figure 7 shows the radical scavenging activity (RSA) expressed as Trolox equivalents (TE) using two assays: DPPH and ABTS. The FN sample prepared from GM collected in 2019 has the highest value for antioxidant activity assessed by both DPPH and ABTS assays, (566.00 ± 13.08 and 572.37 ± 5.78 mgTE/g extract, respectively), followed by the other hydroethanolic FN extract obtained from GM collected in 2018 (316.92 ± 21.6 and 267.11 ± 9.04 mgTE/g extract, respectively). Both ethanolic extracts prepared from GMs collected in 2018 had weak radical scavenging activity (35.18 ± 4.88 and 47.89 ± 7.12 mgTE/g extract for FN(E) and PN(E), respectively), which could be correlated with the low amount of polyphenols, though the FN(E) sample has the highest index of TA (20.42 ± 4.26 mgCG/g extract)—Table 3.
Phenolic substances present in the extracts were quantified using reverse-phase high-performance liquid chromatography and the data are listed in Table 4. The chromatograms can be seen in Figure S2. We identified in all the extracts the following phenolic acids: gallic, protocatechuic, vanillic, and syringic acids from the class of flavonoids, rutin and quercetin, and catechin (except for the FN(E) sample) and (-) epicatechin (except the extracts prepared in absolute ethanol) from the flavan-3-ol class. The only extract in which delphinidin (0.593 ± 0.010 mg/g extract) and the esterified phenolic acid—caftaric acid (0.050 mg/g extract)—were quantified was FN(E-W), while p-coumaric acid was found only in the FN(E) sample. Being poorly soluble in water but soluble in ethanol, trans-resveratrol was quantified in higher amounts in the ethanolic extracts: FN(E) and PN(E) (Table 4).

2.3. Characterization of Materials Containing FN Extract

The hydroethanolic FN extract with the best antioxidant potential (572.37 mgTrolox/g extract) was selected to be encapsulated into mesoporous SBA-15 silica with an ordered pore framework with hexagonal symmetry determined by small-angle X-ray diffraction (Figure S3) and in S5_C titania nanoparticles through the impregnation method, followed by solvent evaporation under low pressure (3 mbar) according to the procedure described elsewhere [26].
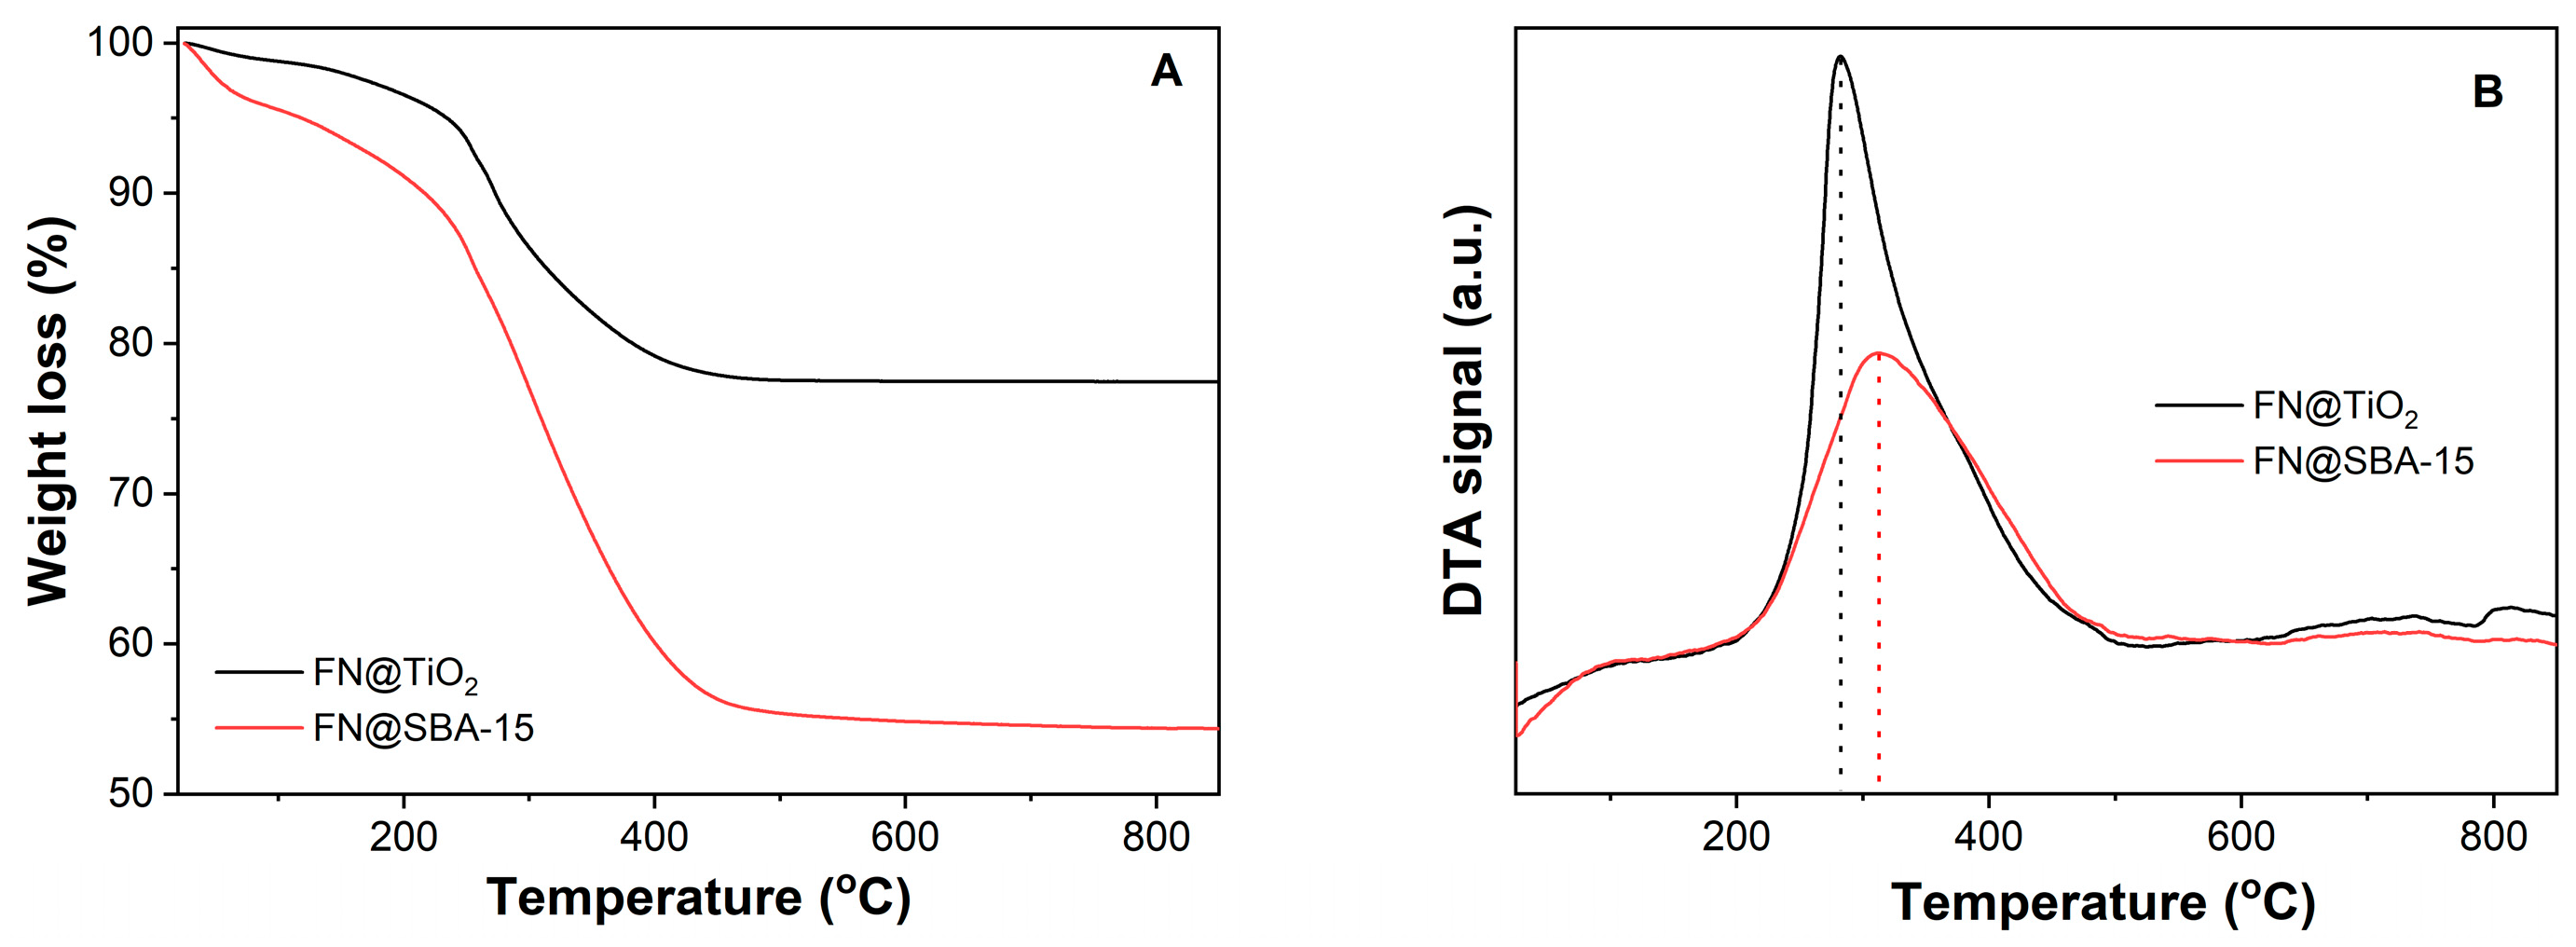
The resulting materials containing FN extract were analyzed by TG-DTA analysis to evaluate the amount of phenolic compounds incorporated in mesoporous inorganic matrices. The main feature influencing the quantity of phenolic compounds that can be encapsulated in the mesopores of inorganic matrices is the total pore volume. The extract amount from the considered inorganic supports was computed based on the weight loss for materials containing extract, taking into account the weight loss of hydroxyl groups during the support heating, and the removal of moisture, which corresponds to the first endothermic event of the DTA curve for each sample subjected to the analysis (Figure 8). As expected, the quantity of encapsulated phenolic substances was lower in the case of FN@TiO2, 20% (wt) (Figure 8A) than for FN@SBA-15 material, 39% (wt) (Figure 8B). Another observation from the thermal analyses is that the temperature at which the polyphenol decomposition rate reached the maximum, 312 °C, was higher in the case of FN@SBA-15 (Figure 8B, black dash-dot curve) than 281 °C for FN@TiO2 (Figure 8A, red dash-dot line), which could be explained by the bigger exposure of biologically active compounds to oxidation in the case of their embedding in mesoporous titania since its mesopores are interparticle pores, and the polyphenols were on the titania NPs’ surfaces, unlike in the case of the SBA-15 matrix, which has cylindrical channels of mesopores.
The sharp decrease in the porosity of materials with encapsulated extract demonstrated the presence of phytocompounds in the mesopores of the inorganic matrices (Figure S4). In the case of FN@SBA-15 material, the values of SBET and V decreased from 984 m2/g and 1.31 cm3/g, respectively, for SBA-15, to 209 m2/g and 0.36 cm3/g, respectively. In the case of FN@TiO2, practically all pores were filled with FN extract (V = 0.01 cm3/g), though the extract quantity was lower than in the case of FN@SBA-15.
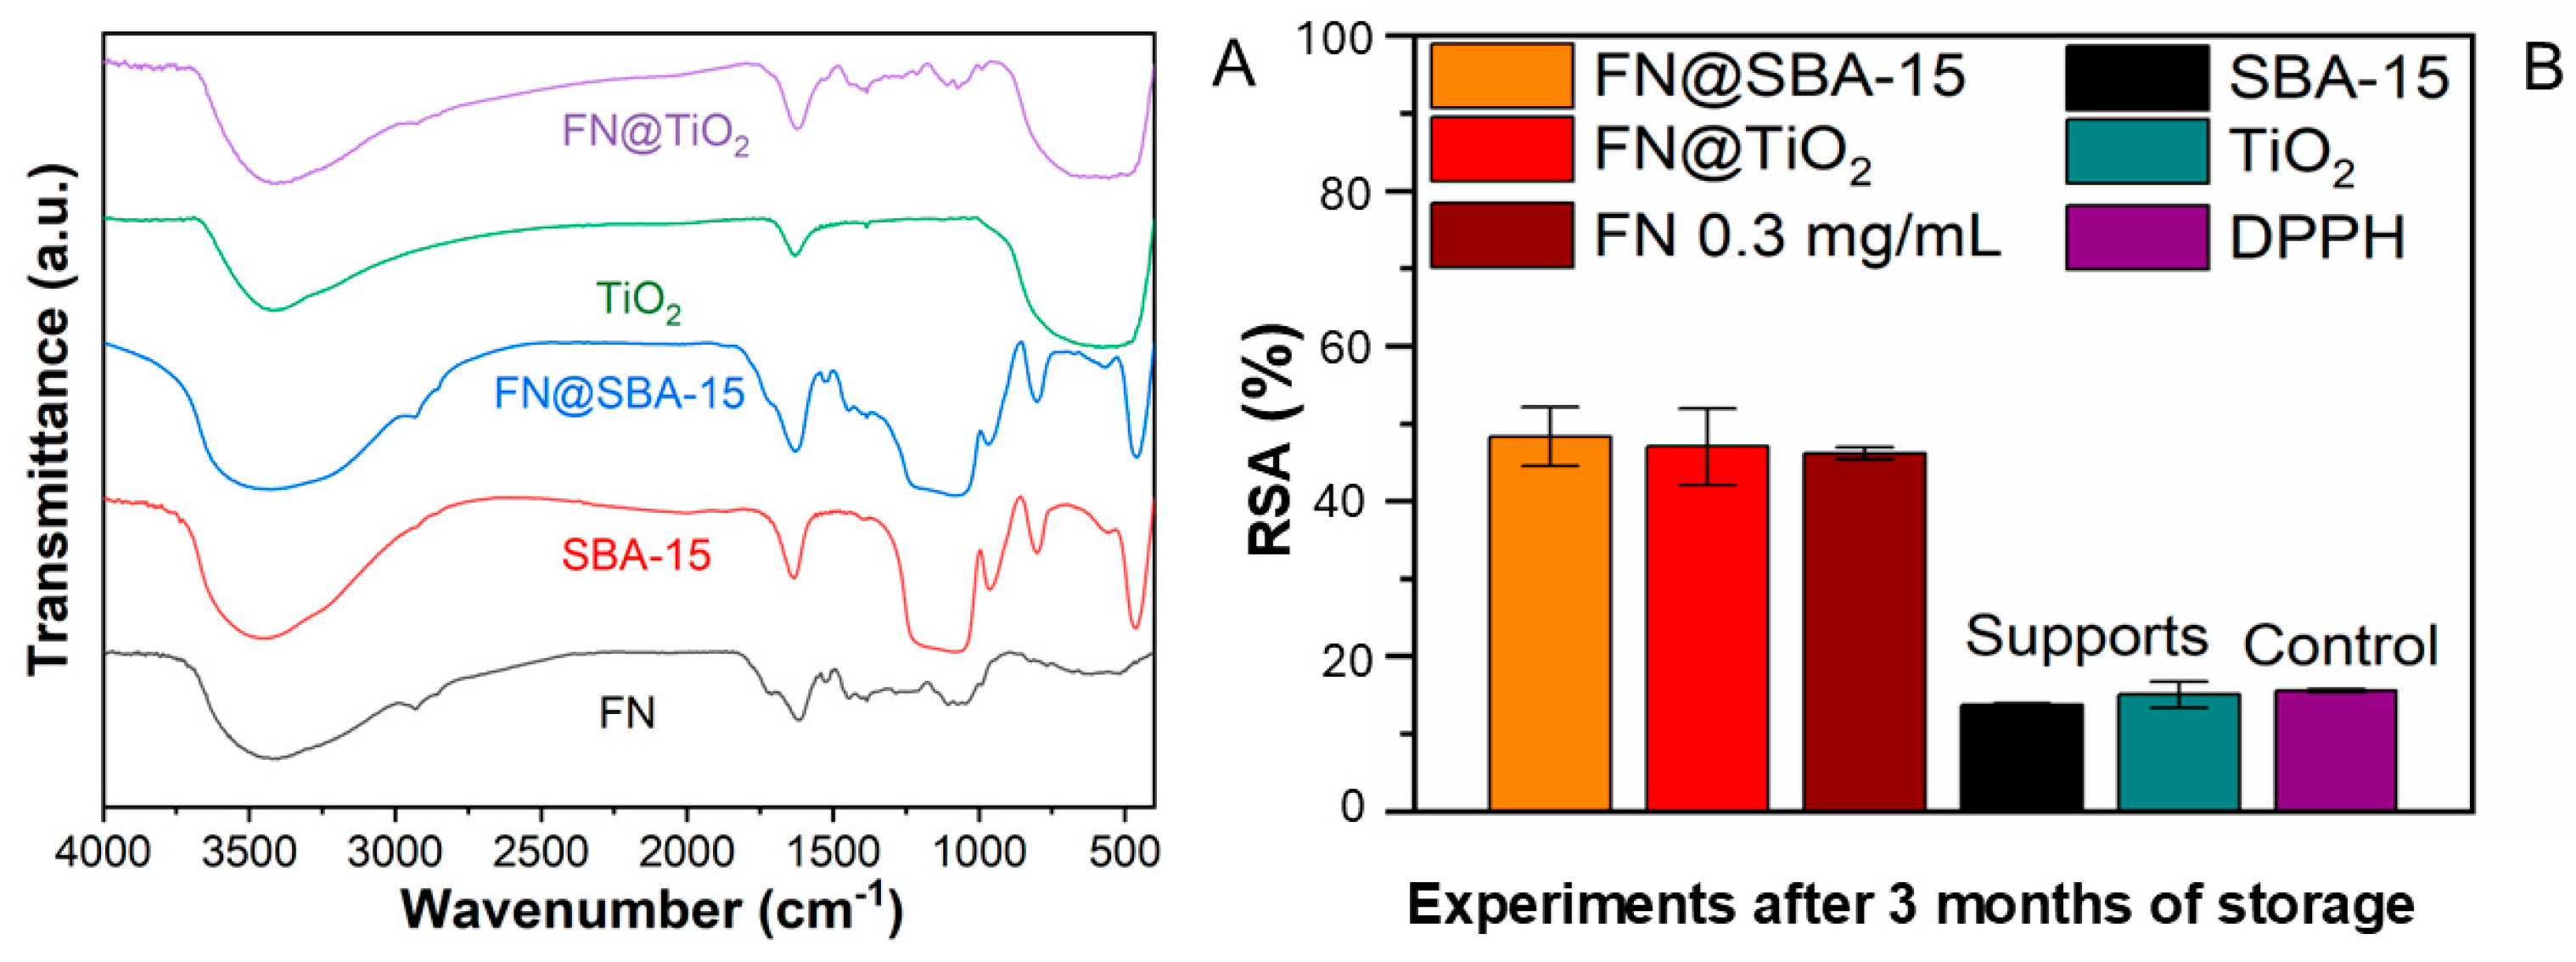
FTIR spectroscopy highlighted the presence of phenolic components in the spectra of the FN extract and FN@SBA-15 and FN@TiO2 samples (Figure 9A) through the presence of the asymmetric stretching vibrations of C=O bonds belonging to the carboxylic groups at 1726 cm−1, asymmetric and symmetric stretching bands of C–H bonds of methylene groups at 2929 cm−1 and 2843 cm−1, respectively. The stretching vibration of C–O bonds overlapped with the deformation band of O–H groups linked on aromatic rings from 1391 cm−1 and the vibration mode of aromatic C–H bonds at 1100 cm−1, the last band being superimposed the very intense asymmetrical stretching band of the Si–O–Si bonds of the SBA-15 matrix in the case of FN@SBA-15 material. In all the spectra, including that of mesoporous inorganic matrices, the broad band with the minimum transmittance at 3470 cm−1 due to hydroxyl groups, which belong either to the phenolic substances or the inorganic matrices, and the bending vibration of adsorbed water at 1627 cm−1 can be observed [27].
Spectrometric determinations of radical scavenging activity (DPPH method) for materials containing FN extract showed the preservation of this property over time (Figure 9B). The antioxidant potential was also determined for the FN extract after three months of storage in dark conditions, in a refrigerator, and for mesoporous inorganic matrices, which showed no contribution to the radical scavenging potential of FN@TiO2 and FN@SBA-15.

2.4. Assessment of Cytocompatibility of the Polyphenolic Extract, Materials Containing Extract, and Corresponding Mesoporous Supports

The cytocompatibility of FN and PN extracts, FN extract encapsulated in SBA-15 and TiO2, and the corresponding inorganic materials was assessed on NCTC clone L929 murine fibroblasts cell line at 24 h and 48 h incubation times using MTT assay. All samples were tested in triplicate.
Both extracts, FN and PN, are biocompatible at concentrations lower than 300 µg/mL, either after 24 h or 48 h of incubation. PN extract showed lower cytotoxicity than FN extract at 700 µg/mL concentration, and in the case of FN extract, cell viability decreased to 35.86% at 24 h and 19.47% after 48 h, while for PN extract, cytotoxic effects were observed only after 48 h of incubation (69.17% cell viability). Cell viability decreased sharply at a treatment dose of 1000 µg/mL for both FN and PN extracts to 15.64% and 47.71%, respectively after 24 h and 7.59% and 15.64%, respectively, after 48 h of incubation (Figure 10A).
The FN extract encapsulated in TiO2 NPs, FN@TiO2, showed biocompatible behavior for all tested concentrations, between 50 µg/mL and 700 µg/mL, with cell viability values in the range of 104.22–82.89%. TiO2 NPs also showed no cytotoxic effect on NCTC fibroblasts at concentrations up to 700 µg/mL (Figure 10B). FN@SBA-15 showed cytocompatibility at concentrations in the range of 50–300 µg/mL after both incubation periods. At high concentrations, 500 and 700 µg/mL of FN@SBA-15, the cell viability decreased to 75.95% and 72.91%, respectively. SBA-15 support presents no cytotoxicity at the tested concentrations (Figure 10C).

3. Discussion

Antioxidants are very important for cellular health because they help neutralize free radicals and thus can prevent various inflammation-based diseases. In recent years, many interdisciplinary research groups have studied their biological effects on human health, their recovery from various sources, including plant waste [28,29,30], and how to preserve or enhance their effectiveness by developing new approaches, such as including antioxidants in various formulations with improved features and benefits [26,31,32].
Grape pomace, a by-product from wine production, is a source of antioxidants and antimicrobial agents, especially against foodborne bacteria strains, which can be used in various fields, such as fertilizers, the food industry, cosmetics, and supplements, after their recovery by solid–liquid extraction [33,34,35]. Grape pomace extracts can improve the antibacterial activity of antibiotics because they inhibit biofilm formation and could be used in the treatment of resistant-biofilm-related infections [35]. Until now, this valuable source of antioxidants and antimicrobials has not been very well exploited.
We valorized fermented dried grape marc from two cultivars, Feteasca Neagra and Pinot Noir from Constanta County, Romania, collected in two years, by preparing extracts through conventional extraction technique in non-toxic solvents: 50% ethanol aqueous solution and absolute ethanol for further application in cosmetics. We observed that the quantity of phenolic compounds is very different depending on the variety and the harvest year of the grapes. The extracts obtained from Feteasca Neagra were generally richer in polyphenols and had more total anthocyanins expressed per mass of dried extract than those prepared from Pinot Noir GM, results that are in agreement with the data reported by Balea et al. [16].
Thus, the richest extract in bioactive compounds obtained in this study was the hydroethanolic FN extract with 39.00 ± 0.17 mg GA/g GM, followed by hydroethanolic PN extract with 16.34 ± 0.41 mg GA/g GM, with the TP index values being in the domain of total phenolic content reported by Constantin et al. [36] for the extracts prepared in water at 28 °C from Feteasca Neagra grapes, Galati County, Romania (0.77–83.62 mg/g dried mass). They reported the following distribution of phenolic compounds: 3%, 1%, and 96% in grape pulp, skins, and seeds, respectively. This study and previous results demonstrated that the climatic conditions and cultivar strongly influence the content of phenolic compounds in not only wines but also in fermented GM, and thus, if exploited, the quality of extracts. For instance, we reported for a polyphenolic extract prepared in the same way as the PN sample in this study, but using GM collected in 2020, values for TP of 43.16 mgGA/g GM and RSA of 689.09 mgTE/g extract, which are 2.6 and 2.2 times higher, respectively, than those of the hydroethanolic PN extract from reference [26]. If we compare the ethanolic FN(E) extract with our previous results from an extract obtained from the same GM variety but collected in 2017, the TP index and antioxidant potential are 3.9 and 3.4 times lower for the FN(E) sample than for the FN extract (GM from 2017) [23]. Previously, we also prepared and characterized Cabernet Sauvignon extract for which the TP index was 265.21 ± 4.97 mg GA/g extract and the RSA value was 344 mgTE/g extract (DPPH assay), with both values being lower than those of FN extract (295.46 mg GA/g extract and 566.00 mgTE/g extract, respectively) discussed here.
With respect to the TA index expressed as CG equivalents per mass of dry extract, all the extracts prepared from Feteasca Neagra had higher TA index values, especially the ethanolic extract (20.42 for FN(E) vs. 7.35 and 3.56 mgCG/g for FN and FN(E-W), respectively) than extracts obtained from Pinot Noir (2.86 and 4.29 mgCG/g for PN(E) and PN, respectively). Also, for the Pinot Noir extracts, for the preparation of which we used GM collected in 2020, we determined a lower value of the TA index, 4.52 mgCG/g extract, [23] than for Feteasca Neagra extracts.
Nevertheless, bioactive substances derived from plants are susceptible to degradation. Hence, one approach to enhance their chemical stability and thus their shelf-life is to encapsulate bioactive compounds in various carriers. In this regard, Castro et al. [37] proposed formulations for a grape seed extract using microdispersion based on soy lecithin and pectin with a very good yield of the entrapment and controlled delivery of the extract polyphenols. Raschip et al. [38] reported the embedding of Feteasca Neagra and Merlot extracts in ice-templated 3D xanthan–PVA composites. They showed that the polymeric films containing Feteasca Neagra extract presented a high antioxidant potential, while the Merlot extract embedded in xanthan–PVA composites exhibited a better antibacterial potential against Gram-positive or Gram-negative bacterial strains than the samples containing FN extract or samples without extract. By microencapsulation through the freeze-drying method of grape pomace extracts in sodium alginate with gum Arabic coated with gelatin, an improved in vitro bioaccessibility of polyphenols was demonstrated [39].
Reports on polyphenols, like quercetin- or resveratrol-based delivery systems for cancer therapy have emerged in recent years [40,41,42]. For example, functional lipid–polymer nanoparticles with high biocompatibility have been developed as carriers for bioactive substances from Curcuma zedoaria and Platycodon grandiflorum to treat breast cancer metastases [43], in addition to quercetin-loaded lipid nanoparticles with improved release properties for anticancer therapy, thus mitigating the side-effects of chemotherapy [40].
Among carriers, mesoporous inorganic materials, especially silica, have been used for embedding various extracts, the resulting extract-loaded materials exhibiting improved stability, radical scavenging potential or anti-inflammatory properties, and desirable biocompatibility [23,44,45]. Usually, mesoporous silica nanoparticles increase the solubility of poorly water-soluble bioactive compounds due to their nanoconfinement in mesopores in amorphous state, improving their bioavailability [46].
In our previous papers, we showed the improved properties of the extracts when loaded on supports based on mesoporous MCM-41 silica, depending on the surface functionalization [47,48]. For example, we reported that the hydroethanolic Pinot Noir extract (GM collected in 2020) presented better anti-inflammatory properties when encapsulated in fucoidan-coated aminopropyl functionalized MCM-41 silica than that of corresponding free extract or reference drugs [26]. We carried out a stability study of polyphenolic extract from wild bilberries free and encapsulated in mesoporous silica. During the accelerated degradation study, the free extract lost a part of the polyphenols, while when it was incorporated in mesoporous silica, better stability in time was observed [48].
Herein, for the first time, we tested mesoporous SBA-15 silica as a carrier for phenolic compounds, which has a larger pore volume and wider pore diameter than MCM-41. We demonstrated that SBA-15 silica has desirable cytocompatibility, being suitable for use as a matrix for the incorporation of bioactive compounds (with the FN@SBA-15 sample having a high content of polyphenols, 39% wt.). The FN@SBA-15 formulation showed non-toxic effects up to 300 µg/mL on NCTC fibroblast cells (Figure 10C). Also, the encapsulation of FN extract in SBA-15 support did not alter the radical scavenging properties of the extract (Figure 9B). Also, liposomal formulations of sea buckthorn and grape pomace extracts showed an enhanced antioxidant activity of extracts due to the protective effect of liposomes against acidic degradation [49].
The use of titania NPs is approved by the Food and Drug Administration and the EU Commission in cosmetics and sunscreen formulations [11,50]. The challenge in using TiO2 NPs for biomedical applications is related to their poor solubility in water and biological fluids, but titania can be used for topical applications.
Previously, we reported the use of titania NPs as support for common sage and wild thyme extracts [51]. TiO2 NPs, used to incorporate these extracts, were obtained by sol-gel method, followed by an aging step of the reaction mixture at reflux using Pluronic P123 as a template agent. Finally, titania was calcined at 450 °C. In this study, we report the synthesis of a series of titania nanoparticles synthesized through the sol-gel technique combined with a solvothermal treatment, showing the parameters that influence the textural features of NPs.
We demonstrated that both Pluronic P123 and Pluronic F127 can be used for mesopore formation. By using this method, we obtained smaller pore diameters ranging from 3.7 to 7.4 nm versus 10.5 nm and higher SBET in the range of 126–312 m2/g (Table 2) compared to 115 m2/g [51], 112 m2/g for a sample also prepared in the presence of Pluronic F127 in ethanol [52], or 39 m2/g [53]. The use of Pluronic F127 led to less aggregated TiO2 NPs, the formed spherical agglomerates having nanometric size (100–400 nm). In this study, we selected the titania sample obtained in the presence of F127 copolymer, which was thermally treated at 400 °C/3 h to encapsulate the hydroethanolic FN sample, the resulting sample being denoted as FN@TiO2. The biocompatibility of titania support and FN@TiO2 was assessed on NCTC fibroblasts, and the results demonstrated no cytotoxic effects of either titania NPs or the FN@TiO2 sample for all tested concentrations, in the range of 50–700 µg/mL after 24 h and 48 h incubation time periods (Figure 10B). As in the case of FN@SBA-15 sample, titania nanoparticles containing FN extract preserved the radical scavenging capacity of the extract (Figure 9B). Our findings are in agreement with the literature data that showed a good in vitro biocompatibility of titania nanostructures on various cell lines [54,55,56].
Regarding the morphology of titania NPs prepared in the presence of both Pluronic F127 and P123, small crystals of 10 nm average size with polyhedral shape were obtained. Samsudin et al. observed that Pluronic F127 acts as a crystallographic controlling agent favoring the formation of {0 0 1} anatase facet that finally led to truncated octahedral bipyramidal particles, while the {1 0 1} facets led to the formation of almost spherical particles [53]. During TEM investigation, a similar particles shape was observed of titania NPs synthesized in the presence of either Pluronic F127 or Pluronic P123, so both triblock copolymers probably favor the formation of the {0 0 1} anatase facet.

4. Materials and Methods

All chemicals utilized for the red GM polyphenolic extracts preparation and analyses, as well as for the synthesis of the mesoporous inorganic matrices, are provided in the Supplementary Materials.

4.1. Obtaining of Mesoporous Inorganic Matrices

The first step of the synthesis of titania nanoparticles consisted of dissolving 1.25 g of the structure directing agent (Pluronic P123 or Pluronic F127) in 50 mL of solvent (2-propanol or n-butanol) at 40 °C, under magnetic stirring. Then, 1.5 mL of glacial acetic acid were added dropwise to slow down the hydrolysis reaction of the titanium precursor. A volume of Ti(IV) isopropoxide or Ti(IV) n-butoxide was poured into the reaction mixture kept at 40 °C, under magnetic stirring. After 1 h, in the resulting solution, 1 mL of deionized water was dropped to promote the hydrolysis and condensation reactions of titanium alkoxide. The reaction mixture was maintained under magnetic stirring at 40 °C for 24 h. Then, the resulting mixture was transferred into a reactor under autogenous pressure for a solvothermal treatment carried out at 100 °C for 24 h. After cooling, the solid was separated by centrifugation, washed with corresponding solvent, water, and ethanol, and then dried at 60 °C. The removal of the structure directing agent was carried out by Soxhlet extraction in ethanol for 24 h. Then, a part of each sample was calcined at 400 °C for 3 h with a heating rate of 0.5 °C/min.
Mesoporous SBA-15 silica was synthesized by an established procedure [57] starting with 2.5 g of Pluronic P123 dissolved at room temperature in 92.8 mL aqueous solution of hydrochloric acid (prepared by adding 13.8 mL HCl 37% (wt) in 79 mL deionized water), and then tetraethyl orthosilicate (5.9 mL) was added to the solution of the structure directing agent. The resulting mixture was stirred at 35 °C for 24 h and then was solvothermally treated in statical conditions under autogenous pressure for another 24 h at 100 °C. The solid was filtered off, washed 3 times with 25 mL ethanol and 3 times with 50 mL deionized water, and dried at room temperature overnight. Finally, SBA-15 silica was thermally treated at 550 °C for 5 h.

4.2. Materials Characterization

The materials were investigated through X-ray diffraction in the range of 2θ = 10–70° and at a scanning rate of 2°/min and 0.01° step (Miniflex 2, Rigaku Holdings Corporation, Tokyo, Japan), FTIR spectroscopy using 64 scans, a resolution of 2 cm−1 in 4000–400 cm−1 range (KBr pellets technique; Bruker Tensor 27, Bruker Corporation Optik GmbH, Bremen, Germany), thermogravimetric analysis coupled with differential thermal analysis carried out in air flow (50 mL/min), with a heating rate of 10°/min in the temperature range of 20−850 °C (DTA-TG, Mettler Toledo GA/SDTA851e, Greifensee, Switzerland), scanning electron microscopy (Tescan Vega 3 LMH microscope, Brno, Czech Republic), and transmission electron microscopy (FEI TECNAI F30 G2 S-TWIN, Hillsboro, OR, USA), as well as N2 adsorption–desorption isotherms recorded at liquid nitrogen temperature after outgassing of the samples at 120 °C for 17 h (Quantachrome Autosorb iQ2, Quantachrome Instruments, Boynton Beach, FL, USA).

4.3. Extracts Preparation

The grape marc (GM) samples were collected after fermentation stage during winemaking process. The fermented GM was dried in fresh air, in a thin layer, at ambient temperature on metallic mesh. Every 24 h, the GM was aerated by turning to facilitate the evaporation of water and ethylic alcohol and to avoid the development of bacteria and fungi because of the moisture. The dry GM was grounded in a food processor to increase the contact surface between vegetal waste and solvent.
For all extracts, a maceration step of 18 h was carried out at room temperature, under magnetic stirring before the three steps of 60 min, performed by refluxing the mixture containing red GM (3 g) and solvent (18 mL), adding on each stage a new solvent volume, and keeping the same ratio between the vegetal waste mass and solvent volume (1/6 g/mL). All three fractions obtained after extraction were put together, and then the solvent was completely evaporated using a DLAB RE100-Pro rotary evaporator (DLAB SCIENTIFIC Co., Ltd., Beijing, China).

4.4. Characterization of Polyphenolic Extracts

Total polyphenols index, total flavonoids content, total amount of anthocyanins, and radical scavenging potential (DPPH and ABTS assays) were determined using UV-vis spectroscopy (Shimadzu UV-1800 spectrophotometer, Shimadzu Corporation, Kyoto, Japan), the methods being described in reference [23]. The components of the extracts from twenty-three standard substances (see Supplementary Materials) were quantified by reverse-phase HPLC-PDA (Shimadzu Nexera X2 with SPD-M30A detector) operating in the wavelength range of 250–600 nm and using a Nucleoshell® C18 column 4.6 × 100 mm (2.7 µm) (Macherey-Nagel GmbH & Co. KG, Düren, Germany). The details of the HPLC method were provided elsewhere [23].

4.5. Cytocompatibility Evaluation

The cytocompatibility of FN and PN extracts, as well as of nanoparticles containing FN extract compared to that of mesoporous inorganic matrices in which FN extract was incorporated, was evaluated on NCTC clone L929 murine fibroblasts obtained from the European Collection of Authenticated Cell Cultures. The samples were sterilized under UV irradiation for 2 h, and then stock suspensions/solutions of 1 mg/mL were prepared in culture medium, which contained 10% fetal bovine serum and 1% antibiotics. The stock solutions/suspensions were incubated at 37 °C for 24 h in humid atmosphere containing 5% carbon dioxide. After 24 h, the stock suspensions were dispersed in ultrasounds for at least 1 h, and the extract solutions were filtered off through 0.22 µm Millipore membrane. Mouse NCTC fibroblast cells were seeded in sterile 96-well culture plates (4 × 10⁴ cells/mL) in culture medium. Fibroblasts were treated with the tested samples and incubated for 24 h and 48 h. The in vitro testing of biocompatibility of the samples was carried out at the following concentrations: 100, 300, 700, and 1000 µg/mL for the free FN and PN extracts and 50, 100, 200, 300, 500, and 700 µg/mL for encapsulated FN extract in TiO2 NPs and SBA-15 silica (FN@TiO2 and FN@SBA-15) and corresponding supports (TiO2 and SBA-15). The determination of cell viability (MTT assay, Sigma-Aldrich, Merck Company, Darmstadt, Germany) was performed after 24 h and 48 h incubation periods of the cells with samples. The experiments were performed according to the procedure described in reference [58]. The spectrophotometric determinations were performed on a Berthold Mithras LB 940 Multimode Plate Reader (Berthold Technologies GmbH & Co., Bad Wildbad, Germany), at 570 nm wavelength. Untreated cells were considered the control with 100% cellular viability, based on which were calculated the cell viability for the samples.
Experiments were performed in triplicate, and the results were presented as mean ± standard deviation. Student’s t-test was performed for the statistical analysis, using two-tailed distribution and two-sample equal variance, in Microsoft 365 Excel software. Statistical differences were considered for p < 0.05.

5. Conclusions

We report the parameters that influenced the morphology of mesoporous titania NPs synthesized by sol-gel method combined with solvothermal treatment. The use of Pluronic F127 as a porogenic agent in the synthesis showed the formation of less agglomerated TiO2 nanoparticles based on SEM and TEM investigation with higher SBET and lower pore diameter (153 m2/g vs. 126 m2/g and 5.4 nm vs. 7.4 nm, respectively) than in the case of Pluronic P123.
We determined the chemical profiles of several extracts prepared from two types of red GM (Feteasca Neagra and Pinot Noir), and we could conclude that it depended on the cultivar and solvent. The extract with the best antioxidant properties, hydroethanolic FN extract prepared from GM collected in 2019, was encapsulated in TiO2 NPs and compared with the resulting material obtained by the incorporation of FN extract in SBA-15 silica support.
We have successfully obtained and characterized materials containing FN extract, FN@TiO2, and FN@SBA-15, with desirable cytocompatibility on NCTC clone L929 murine fibroblasts in the concentration range of 50–300 µg/mL after 24 h and 48 h of incubation time and radical scavenging properties.
A long-term stability study for the FN extract alone and encapsulated in titania nanoparticles must be performed to obtain data regarding shelf-life. Also, further in vivo studies should be carried out for the safe use of the proposed extract-loaded nanoparticles in skincare products.

Supplementary Materials

The following supporting information can be downloaded at: https://www.mdpi.com/article/10.3390/inorganics12100263/s1. Figure S1. N2 adsorption–desorption isotherms for S2_E and S2_C samples recorded at 77 K. Inset the corresponding pore size distribution curves calculated with BJH model from desorption branch; Figure S2. Chromatograms for the following extracts: hydroethanolic FN extract (A), ethanolic FN(E) extract (B), hydroethanolic PN extract (C), and ethanolic PN(E) extract; Figure S3. Small-angle X-ray diffraction of mesoporous SBA-15 silica; Figure S4. N2 adsorption–desorption isotherms for FN@SBA-15 sample (a) and SBA-15 silica (b).

Author Contributions

Conceptualization, D.B.; methodology, A.-M.B., R.T., A.-I.I., M.D., R.-A.M., C.M. and D.B.; validation, A.A.; A.-M.B., R.T., A.-I.I., M.D., R.-A.M., C.M. and D.B.; formal analysis, A.A., A.-M.B., R.T., A.-I.I., M.D., R.-A.M. and C.M.; investigation, A.A.; A.-M.B., R.T., A.-I.I., M.D., R.-A.M. and C.M.; resources, D.B.; R.T., R.-A.M.; data curation, A.A., A.-M.B.; M.D. and C.M.; writing—original draft preparation, A.A.; writing—review and editing, D.B.; supervision, D.B.; project administration, D.B.; funding acquisition, D.B. All authors have read and agreed to the published version of the manuscript.

Funding

This research was funded by UEFISCDI (Romania) project PCCDI no. 85/2018 and project PCE no. 117/2022.

Institutional Review Board Statement

The NCTC clone 929 mouse fibroblast cell line was provided by The European Collection of Authenticated Cell Cultures (ECACC)

Data Availability Statement

The raw data of this paper will be made available by the authors on request.

Conflicts of Interest

The authors declare no conflicts of interest.

References

  1. Manzano, M.; Vallet-Regí, M. Mesoporous Silica Nanoparticles for Drug Delivery. Adv. Funct. Mater. 2019, 30, 1902634. [Google Scholar] [CrossRef]
  2. Castillo, R.R.; Lozano, D.; González, B.; Manzano, M.; Izquierdo-Barba, I.; Vallet-Regí, M. Advances in mesoporous silica nanoparticles for targeted stimuli-responsive drug delivery: An update. Expert Opin. Drug Deliv. 2019, 16, 415. [Google Scholar] [CrossRef] [PubMed]
  3. Janjua, T.I.; Cao, Y.; Yu, C.; Popat, A. Clinical translation of silica nanoparticles. Nat. Rev. Mater. 2021, 6, 1072–1074. [Google Scholar] [CrossRef] [PubMed]
  4. Farjadian, F.; Roointan, A.; Mohammadi-Samani, S.; Hosseini, M. Mesoporous Silica Nanoparticles: Synthesis, Pharmaceutical Applications, Biodistribution, and Biosafety Assessment. Chem. Eng. J. 2019, 359, 684–705. [Google Scholar] [CrossRef]
  5. Mao, T.; Zha, J.; Hu, Y.; Chen, Q.; Zhang, J.; Luo, X. Research Progress of TiO2 Modification and Photodegradation of Organic Pollutants. Inorganics 2024, 12, 178. [Google Scholar] [CrossRef]
  6. Aw, M.S.; Addai-Mensah, J.; Losic, D. A multi-drug delivery system with sequential release using titania. Chem. Commun. 2012, 48, 3348–3350. [Google Scholar] [CrossRef]
  7. Ghenadi, E.; Nichele, V.; Signoretto, M.; Cerrato, G. Structure-Directing Agents for the Synthesis of TiO2-Based Drug-Delivery Systems. Chem. Eur. J. 2012, 18, 10653–10660. [Google Scholar]
  8. Inada, M.; Enomoto, N.; Hojo, J. Fabrication and structural analysis of mesoporous silica–titania for environmental purification. Microporous Mesoporous Mater. 2013, 182, 173–177. [Google Scholar] [CrossRef]
  9. Georgescu, D.; Brezoiu, A.M.; Mitran, R.A.; Berger, D.; Matei, C.; Negreanu-Pîrjol, B.S. Mesostructured silica–titania composites for improved oxytetracycline delivery systems. Comptes Rendus Chim. 2017, 20, 1017–1025. [Google Scholar] [CrossRef]
  10. Behnam, M.A.; Emami, F.; Sobhani, Z.; Dehghanian, A.R. The application of titanium dioxide (TiO2) nanoparticles in the photo-thermal therapy of melanoma cancer model. Iran. J. Basic Med. Sci. 2018, 21, 1133–1139. [Google Scholar]
  11. Mansoor, A.; Khurshid, Z.; Khan, M.T.; Mansoor, E.; Butt, F.A.; Jamal, A.; Palma, P.J. Medical and Dental Applications of Titania Nanoparticles: An Overview. Nanomaterials 2022, 12, 3670. [Google Scholar] [CrossRef] [PubMed]
  12. Kubacka, A.; Diez, M.; Rojo, D. Understanding the antimicrobial mechanism of TiO2-based nanocomposite films in a pathogenic bacterium. Sci. Rep. 2014, 4, 4134. [Google Scholar] [CrossRef]
  13. Zhang, R.; Elzatahry, A.A.; Al-Deyab, S.S.; Zhao, D. Mesoporous titania: From synthesis to application. Nano Today 2012, 7, 344–366. [Google Scholar] [CrossRef]
  14. Drosou, C.; Kyriakopoulou, K.; Bimpilas, A.; Tsimogiannis, D.; Krokida, M. A comparative study on different extraction techniques to recover red grape pomace polyphenols from vinification byproducts. Ind. Crops Prod. 2015, 75, 141–149. [Google Scholar] [CrossRef]
  15. Iacono, E.; Di Marzo, C.; Di Stasi, M.; Cioni, E.; Gambineri, F.; Luminare, A.G.; De Leo, M.; Braca, A.; Quaranta, P.; Lai, M.; et al. Broad-spectrum virucidal activity of a hydroalcoholic extract of grape pomace. Bioresour. Technol. Rep. 2024, 25, 101745. [Google Scholar] [CrossRef]
  16. Balea, S.S.; Pârvu, A.E.; Pârvu, M.; Vlase, L.; Dehelean, C.A.; Pop, T.I. Antioxidant, Anti-Inflammatory and Antiproliferative Effects of the Vitis vinifera L. var. Feteasca Neagra and Pinot Noir Pomace Extracts. Front. Pharmacol. 2020, 11, 990. [Google Scholar] [CrossRef]
  17. Robards, K.; Prenzler, P.D.; Tucker, G.; Swatsitang, P.; Glover, W. Phenolic compounds and their role in oxidative processes in fruits. Food Chem. 1999, 66, 401–436. [Google Scholar] [CrossRef]
  18. Goldberg, D.M.; Tsang, E.; Karumanchiri, A.; Soleas, G.J. Quercetin and p-coumaric acid concentrations in commercial wines. Am. J. Enol. Vitic. 1998, 49, 142–151. [Google Scholar] [CrossRef]
  19. Hoss, I.; Rajha, H.N.; El Khoury, R.; Youssef, S.; Manca, M.L.; Manconi, M.; Louka, N.; Maroun, R.G. Valorization of Wine-Making By-Products’ Extracts in Cosmetics. Cosmetics 2021, 8, 109. [Google Scholar] [CrossRef]
  20. Wasilewski, T.; Hordyjewicz-Baran, Z.; Zarebska, M.; Stanek, N.; Zajszły-Turko, E.; Tomaka, M.; Bujak, T.; Nizioł-Łukaszewska, Z. Sustainable Green Processing of Grape Pomace Using Micellar Extraction for the Production of Value-Added Hygiene Cosmetics. Molecules 2022, 27, 2444. [Google Scholar] [CrossRef]
  21. Moro, K.I.B.; Bender, A.B.B.; da Silva, L.P.; Penna, N.G. Green Extraction Methods and Microencap-sulation Technologies of Phenolic Compounds from Grape Pomace: A Review. Food Bioprocess Technol. 2021, 14, 1407–1431. [Google Scholar] [CrossRef]
  22. Okur, P.S.; Okur, I. Recent Advances in the Extraction of Phenolic Compounds from Food Wastes by Emerging Technologies. Food Bioprocess Technol. 2024. [Google Scholar] [CrossRef]
  23. Brezoiu, A.-M.; Matei, C.; Deaconu, M.; Stanciuc, A.-M.; Trifan, A.; Gaspar-Pintiliescu, A.; Berger, D. Polyphenols extract from grape pomace. Characterization and valorisation through encapsulation into mesoporous silica-type matrices. Food Chem. Toxicol. 2019, 133, 110787. [Google Scholar] [CrossRef] [PubMed]
  24. Nithya, N.; Bhoopathi, G.; Magesh, G.; Balasundaram, O.N. Synthesis and characterization of yttrium doped titania nanoparticles for gas sensing activity. Mater. Sci. Semicond. Process. 2019, 99, 14–22. [Google Scholar] [CrossRef]
  25. Lee, J.; Durst, R.W.; Wrolstad, R.E. Determination of Total Monomeric Anthocyanin Pigment Content of Fruit Juices, Beverages, Natural colorants and Wines by the pH- differential method: Collaborative Study. J. AOAC Int. 2005, 88, 1269–1278. [Google Scholar] [CrossRef]
  26. Deaconu, M.; Abduraman, A.; Brezoiu, A.-M.; Sedky, N.K.; Ionită, S.; Matei, C.; Ziko, L.; Berger, D. Anti-Inflammatory, Antidiabetic, and Antioxidant Properties of Extracts Prepared from Pinot Noir Grape Marc, Free and Incorporated in Porous Silica-Based Supports. Molecules 2024, 29, 3122. [Google Scholar] [CrossRef] [PubMed]
  27. Socrates, G. Infrared and Raman Characteristic Group Frequencies, 3rd ed.; John Wiley & Sons Ltd.: Chichester, UK, 2001. [Google Scholar]
  28. Wu, Y.; Gao, H.; Wang, Y.; Peng, Z.; Guo, Z.; Ma, Y.; Zhang, R.; Zhang, M.; Wu, Q.; Xiao, J.; et al. Effects of Different Extraction Methods on Contents, Profiles, and Antioxidant Abilities of Free and Bound Phenolics of Sargassum Polycystum from the South China Sea. J. Food Sci. 2022, 87, 968–981. [Google Scholar] [CrossRef]
  29. Pandey, K.B.; Rizvi, S.I. Role of red grape polyphenols as antidiabetic agents. Integr. Med. Res. 2014, 3, 119–125. [Google Scholar] [CrossRef]
  30. Denny, C.; Lazarini, J.G.; Franchin, M.; Melo, P.S.; Pereira, G.E.; Massarioli, A.P.; Moreno, I.A.M.; Paschoal, J.A.R.; Alencar, S.M.; Rosalen, P.L. Bioprospection of Petit Verdot grape pomace as a source of anti-inflammatory compounds. J. Funct. Foods 2014, 8, 292–300. [Google Scholar] [CrossRef]
  31. Szewczyk, A.; Brzezinska-Rojek, J.; Osko, J.; Majda, D.; Prokopowicz, M.; Grembecka, M. Antioxidant-Loaded Mesoporous Silica—An Evaluation of the Physicochemical Properties. Antioxidants 2022, 11, 1417. [Google Scholar] [CrossRef]
  32. Tsali, A.; Goula, A.M. Valorization of grape pomace: Encapsulation and storage stability of its phenolic extract. Powder Technol. 2018, 340, 194–207. [Google Scholar] [CrossRef]
  33. Machado, T.O.X.; Portugal, I.; de A. C. Kodel, H.; Droppa-Almeida, D.; Dos Santos Lima, M.; Fathi, F.; Oliveira, B.P.P.; de Albuquerque-Júnior, R.L.C.; Claudio Dariva, C.; Souto, E.B. Therapeutic potential of grape pomace extracts: A review of scientific evidence. Food Biosci. 2024, 60, 104210. [Google Scholar]
  34. Almanza-Oliveros, A.; Bautista-Hernández, I.; Castro-López, C.; Aguilar-Zárate, P.; Meza-Carranco, Z.; Rojas, R.; Michel, M.R.; Martínez-Ávila, G.C.G. GrapePomace—Advances in Its Bioactivity, Health Benefits, and Food Applications. Foods 2024, 13, 580. [Google Scholar] [CrossRef]
  35. Sateriale, D.; Forgione, G.; Di Rosario, M.; Pagliuca, C.; Colicchio, R.; Salvatore, P.; Paolucci, M.; Pagliarulo, C. Vine-Winery Byproducts as Precious Resource of Natural Antimicrobials: In Vitro Antibacterial and Antibiofilm Activity of Grape Pomace Extracts against Foodborne Pathogens. Microorganisms 2024, 12, 437. [Google Scholar] [CrossRef]
  36. Constantin, O.E.; Skrt, M.; Poklar Ulrih, N.; Râpeanu, G. Anthocyanins profile, total phenolics and antioxidant activity of two Romanian red grape varieties: Feteascǎ neagrǎ and Bǎbeascǎ neagrǎ (Vitis vinifera). Chem. Pap. 2015, 69, 1573–1581. [Google Scholar] [CrossRef]
  37. Castro, M.L.; Azevedo-Silva, J.; Valente, D.; Machado, A.; Ribeiro, T.; Ferreira, J.P.; Pintado, M.; Ramos, O.L.; Borges, S.; Baptista-Silva, S. Elevating Skincare Science: Grape Seed Extract Encapsulation for Dermatological Care. Molecules 2024, 29, 3717. [Google Scholar] [CrossRef]
  38. Raschip, I.E.; Fifere, N.; Dinu, M.V. A Comparative Analysis on the Effect of Variety of Grape Pomace Extracts on the Ice-Templated 3D Cryogel Features. Gels 2021, 7, 76. [Google Scholar] [CrossRef] [PubMed]
  39. Martinović, J.; Ambrus, R.; Planinić, M.; Šelo, G.; Klarić, A.-M.; Perković, G.; Bucić-Kojić, A. Microencapsulation of Grape Pomace Extracts with Alginate-Based Coatings by Freeze-Drying: Release Kinetics and In Vitro Bioaccessibility Assessment of Phenolic Compounds. Gels 2024, 10, 353. [Google Scholar] [CrossRef] [PubMed]
  40. Ariraman, S.; Seetharaman, A.; Babunagappan, K.V.; Sudhakar, S. Quercetin-loaded nanoarchaeosomes for breast cancer therapy: A ROS mediated cell death mechanism. Mater. Adv. 2024, 5, 6944–6956. [Google Scholar] [CrossRef]
  41. Zu, Y.; Zhang, Y.; Wang, W.; Zhao, X.; Han, X.; Wang, K.; Ge, Y. Preparation and in vitro/in vivo evaluation of resvera-trol-loaded carboxymethyl chitosan nanoparticles. Drug Deliv. 2016, 23, 981–991. [Google Scholar] [CrossRef]
  42. Vieira, I.R.S.; Tessaro, L.; Lima, A.K.O.; Velloso, I.P.S.; Conte-Junior, C.A. Recent Progress in Nanotechnology Improving the Therapeutic Potential of Polyphenols for Cancer. Nutrients 2023, 15, 3136. [Google Scholar] [CrossRef]
  43. Shi, J.; Zhang, R.; Wang, Y.; Sun, Y.; Gu, X.; An, Y.; Chai, X.; Wang, X.; Wang, Z.; Lyu, Y.; et al. Herb-Nanoparticle Hybrid System for Improved Oral Delivery Efficiency to Alleviate Breast Cancer Lung Metastasis. Int. J. Nanomed. 2024, 19, 7927–7944. [Google Scholar] [CrossRef] [PubMed]
  44. Budiman, A.; Rusdin, A.; Wardhana, Y.W.; Puluhulawa, L.E.; Cindana Mo’o, F.R.; Thomas, N.; Gazzali, A.M.; Aulifa, D.L. Exploring the Transformative Potential of Functionalized Mesoporous Silica in Enhancing Antioxidant Activity: A Comprehensive Review. Antioxidants 2024, 13, 936. [Google Scholar] [CrossRef]
  45. Deaconu, M.; Prelipcean, A.M.; Brezoiu, A.M.; Mitran, R.A.; Seciu-Grama, A.M.; Matei, C.; Berger, D. Design of scaffolds based on zinc-modified marine collagen and bilberry leaves extract-loaded silica nanoparticles as wound dressings. Int. J. Nanomed. 2024, 19, 7673–7689. [Google Scholar] [CrossRef] [PubMed]
  46. Trendafilova, I.; Popova, M. Porous Silica Nanomaterials as Carriers of Biologically Active Natural Polyphenols: Effect of Structure and SurfaceModification. Pharmaceutics 2024, 16, 1004. [Google Scholar] [CrossRef]
  47. Brezoiu, A.-M.; Bajenaru, L.; Berger, D.; Mitran, R.-A.; Deaconu, M.; Lincu, D.; Guzun, A.S.; Matei, C.; Moisescu, M.G.; Negreanu-Pirjol, T. Effect of Nanoconfinement of Polyphenolic Extract from Grape Pomace into Functionalized Mesoporous Silica on its Biocompatibility and Radical Scavenging Activity. Antioxidants 2020, 9, 696. [Google Scholar] [CrossRef]
  48. Brezoiu, A.-M.; Deaconu, M.; Mitran, R.-A.; Sedky, N.K.; Schiets, F.; Marote, P.; Voicu, I.-S.; Matei, C.; Ziko, L.; Berger, D. The Antioxidant and Anti-Inflammatory Properties of Wild Bilberry Fruit Extracts Embedded in Meso-porous Silica-Type Supports: A Stability Study. Antioxidants 2024, 13, 250. [Google Scholar] [CrossRef]
  49. Popovici, V.; Boldianu, A.-B.; Pintea, A.; Caraus, V.; Ghendov-Mosanu, A.; Subotin, I.; Druta, R.; Sturza, R. In Vitro Antioxidant Activity of Liposomal Formulations of Sea Buckthorn and Grape Pomace. Foods 2024, 13, 2478. [Google Scholar] [CrossRef] [PubMed]
  50. Bousiakou, L.G.; Dobson, P.J.; Jurkin, T.; Marić, I.; Aldossary, O.; Ivanda, M. Optical, structural and semiconducting properties of Mn doped TiO2 nanoparticles for cosmetic applications. J. King Saud Univ.-Sci. 2022, 34, 101818. [Google Scholar] [CrossRef]
  51. Brezoiu, A.M.; Prundeanu, M.; Berger, D.; Deaconu, M.; Matei, M.; Oprea, O.; Vasile, E.; Negreanu-Pîrjol, T.; Mun-tean, D.; Danciu, C. Properties of Salvia officinalis L. and Thymus serpyllum L. Extracts Free and Embedded into Mesopores of Silica and Titania Nanomaterials. Nanomaterials 2020, 10, 820. [Google Scholar] [CrossRef]
  52. Shi, Y.; Chen, S.; Sun, H.; Shu, Y.; Quan, X. Low-temperature selective catalytic reduction of NOx with NH3 over hierarchically macro-mesoporous Mn/TiO2. Catal. Commun. 2013, 42, 10–13. [Google Scholar] [CrossRef]
  53. Samsudin, E.M.; Abd Hamid, S.B.; Juan, J.C.; Basirun, W.J. Influence of triblock copolymer (pluronic F127) on enhancing the physico-chemical properties and photocatalytic response of mesoporous TiO2. Appl. Surf. Sci. 2015, 355, 959–968. [Google Scholar] [CrossRef]
  54. Wang, Y.; Zhang, F.; Chen, S.; Osaka, A.; Chen, W. Facile synthesis, characterization, and in vitro biocompatibility of free-standing titania hollow microtubes. Int. J. Appl. Ceram. Technol. 2024, 21, 3897–3905. [Google Scholar] [CrossRef]
  55. Torres-Romero, A.; Cajero-Juárez, M.; Nuñez-Anita, R.E.; Contreras-García, M.E. Ceria-Doped Titania Nanoparticles as Drug Delivery System. J. Nanosci. Nanotechnol. 2020, 20, 3971–3980. [Google Scholar] [CrossRef] [PubMed]
  56. Sahare, P.; Alvarez, P.G.; Yanez, J.M.; Luna-Bárcenas, G.; Chakraborty, S.; Paul, S.; Estevez, M. Engineered titania nanomaterials in advanced clinical applications. Beilstein J. Nanotechnol. 2022, 13, 201–218. [Google Scholar] [CrossRef] [PubMed]
  57. Zhao, D.; Feng, J.; Huo, Q.; Melosh, N.; Fredrickson, G.H.; Chmelka, B.F.; Stucky, G.D. Triblock Copolymer Syntheses of Mesoporous Silica with Periodic 50 to 300 Angstrom Pores. Science 1998, 279, 548. [Google Scholar] [CrossRef]
  58. Gavrila, A.I.; Zalaru, C.M.; Tatia, R.; Seciu-Grama, A.-M.; Negrea, C.L.; Calinescu, I.; Chipurici, P.; Trifan, A.; Popa, I. Green Ex-traction Techniques of Phytochemicals from Hedera helix L. and In Vitro Characterization of the Extracts. Plants 2023, 12, 3908. [Google Scholar]
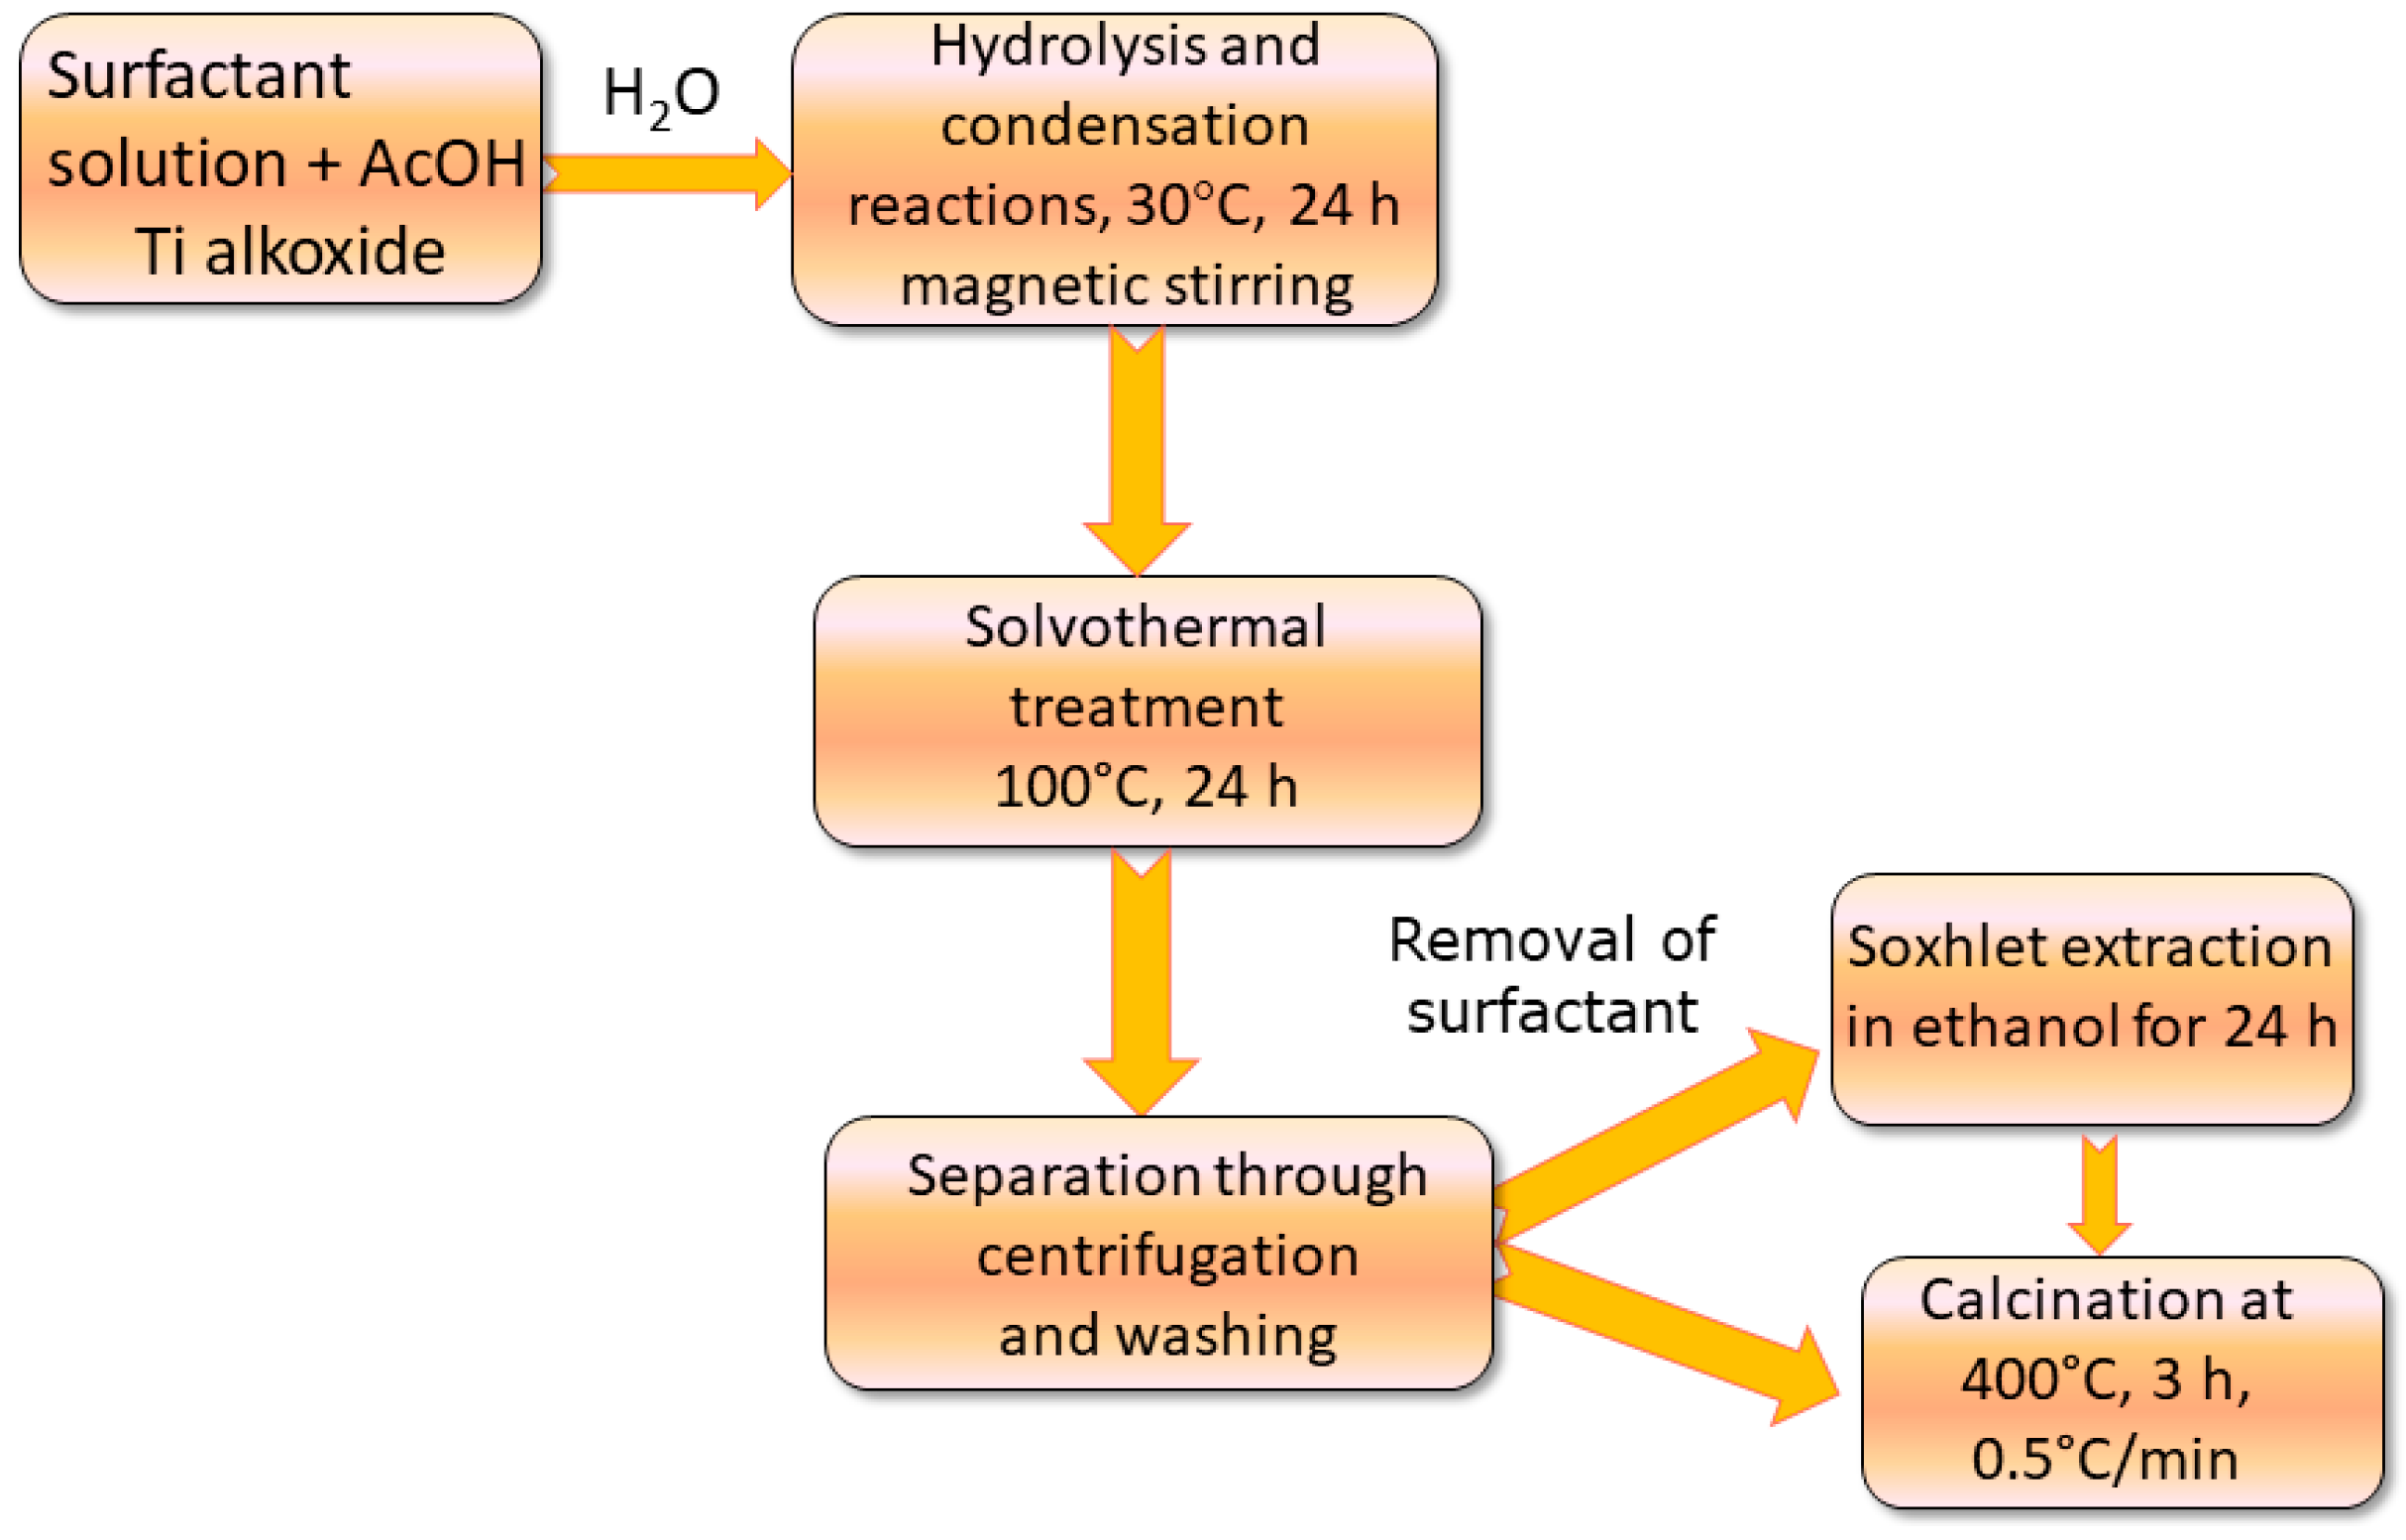
Figure 1. Main steps of the titania samples preparation.
Inorganics 12 00263 g001
Figure 2. XRD patterns of titania samples obtained after solvothermal treatment and purified by Soxhlet extraction (A) and for TiO2 samples calcined at 400 °C, 3 h. (B) The JCPDS no. 21-1272 for anatase phase is shown as reference.
Inorganics 12 00263 g002
Figure 3. SEM micrographs for the following samples: S1_E (A) and S6-E (B) purified by Soxhlet extraction, S5_C (C), S2_C (D) and S4_C (E) titania samples obtained at 400 °C, TEM images of S3_C (F) and S5_C (G) calcined samples, and SEM image of SBA-15 silica (H).
Inorganics 12 00263 g003
Figure 4. FTIR spectra of the following samples: S1_E and S3_E obtained after Soxhlet extraction, S3 and S5 isolated after solvothermal treatment, and S3_C calcined at 400 °C.
Inorganics 12 00263 g004
Figure 5. (A) TG analyses performed in synthetic air for S4 and S5 samples isolated after solvothermal treatment, S4_E purified by Soxhlet extraction and S4_C and S5_C calcined at 400 °C, 3 h. The TG curves for calcined samples were included to evaluate the content of hydroxyl groups attached to the titania surface that was subtracted when the content of the polymer was determined. (B) Corresponding DTA curves.
Inorganics 12 00263 g005
Figure 6. Nitrogen adsorption–desorption isotherms recorded at liquid nitrogen temperature of S1_E and S4_E samples purified by Soxhlet extraction and S4_C (A), S3_C, S5_C, and S6_C calcined at 400 °C (B). The corresponding pore distribution curves calculated with BJH model from desorption branch of the isotherms are inserted in both figures. All samples were outgassed in vacuum at 120 °C for 17 h.
Inorganics 12 00263 g006
Figure 7. Radical scavenging activity expressed as Trolox equivalents per mass of the dried extract using DPPH and ABTS methods.
Inorganics 12 00263 g007
Figure 8. TG analyses of FN@TiO2 and FN@SBA-15 samples (A) and the corresponding DTA curves (B) performed in air flow.
Inorganics 12 00263 g008
Figure 9. FTIR spectra of FN extract, SBA-15 matrix, FN@SBA-15 material, TiO2 support, and FN@TiO2 sample (A). Radical scavenging activity assessed by DPPH assay for FN@TiO2 and FN@ SBA-15 in comparison with FN extract alone and corresponding inorganic matrices, TiO2 and SBA-15, in the same quantities as in the FN-loaded supports (B).
Inorganics 12 00263 g009
Figure 10. Cell viability of normal L929 cells for the free hydroethanolic PN and FN grape pomace extracts (A) and FN extract encapsulated in TiO2 (B) and SBA-15 matrices compared to the corresponding supports, TiO2 and SBA-15, assessed using MTT assay (C). Results are presented as average value of three replicates ± standard deviation (n = 3). # (p < 0.05) shows significant differences between the fibroblasts incubated with samples in comparison to control. Treatments with samples of cells are not considered toxic when cell viability is higher than 80%.
Inorganics 12 00263 g010
Table 1. Synthesis conditions for mesoporous titania obtaining.
SampleSolventTitania
Precursor
Template AgentTi Precursor/Template Agent
Molar Ratio
S1n-butanolTi(OnBu)4P1231/0.017
S2n-butanolTi(OnBu)4P1231/0.034
S32-propanolTi(OiPr)4P1231/0.017
S42-propanolTi(OiPr)4P1231/0.034
S52-propanolTi(OiPr)4F1271/0.017
S6n-butanolTi(OnBu)4F1271/0.017
Table 2. The textural parameters computed from N2 adsorption–desorption isotherms for mesoporous inorganic matrices.
SampleSBET
(m2/g)
V
(cm3/g)
dBJH
(nm)
S1_E2580.346.8
S2_E3120.433.7
S2_C1420.426.8
S3_C1260.427.4
S4_E2740.303.7
S4_C1540.365.8
S5_C1530.335.4
S6_C1530.316.3
SBA-159841.316.3
Table 3. Solvents used for extraction, yield values, and spectrometric data expressed per gram of dry extract for prepared extracts.
ExtractYear, SolventYield
(%)
TP
(mgGA/g)
TF
(mgQ/g)
TA
(mg CG/g)
FN2019, 50% ethanol13.2295.46 ± 1.3314.82 ± 0.517.35 ± 1.89
FN(E)2018, ethanol0.471.02 ± 0.2212.31 ± 0.6420.42 ± 4.26
FN(E-W)2018, 50% ethanol6.5147.71 ± 8.65.06 ± 0.123.56 ± 0.24
PN2019, 50% ethanol11.8138.49 ± 3.4911.94 ± 0.034.29 ± 0.00
PN(E)2018, ethanol1.347.09 ± 0.9913.34 ± 4.112.86 ± 0.00
All spectrometric measurements were performed in triplicate.
Table 4. Chemical profile of prepared extracts determined by HPLC-PDA analysis.
Phenolic Substance Concentration (mg/g Dried Extract)
FNFN(E)FN(E-W)PNPN(E)
Gallic Acid1.150 ± 0.0040.594 ± 0.0010.437 ± 0.0000.238 ± 0.0080.723 ± 0.000
Protocatechuic acid0.541 ± 0.0010.714 ± 0.0000.078 ± 0.0020.367 ± 0.0011.748 ± 0.001
Catechin0.087 ± 0.001nd5.978 ± 0.0001.164 ± 0.0020.504 ± 0.001
Caftaric acidndnd0.050 ± 0.000ndnd
Vanillic acid1.091 ± 0.0030.826 ± 0.0000. 334 ± 0.0071.424 ± 0.0040.309 ± 0.000
Syringic acid2.492 ± 0.0041.490 ± 0.0000.674 ± 0.0002.043 ± 0.0061.869 ± 0.003
p-Coumaric acidnd0.083 ± 0.000ndnd0.035 ± 0.001
(-) Epicatechin2.755 ± 0.006nd4.757 ± 0.0010.644 ± 0.002nd
Delphinidinndnd0.593 ± 0.010ndnd
Rutin0.582 ± 0.0010.191 ± 0.0010.702 ± 0.0010.427 ± 0.0000.139 ± 0.000
trans-Resveratrol0.023 ± 0.0010.082 ± 0.000ndnd0.080 ± 0.000
Quercetin0.160 ± 0.0010.370 ± 0.0000.133 ± 0.0000.073 ± 0.0010.280 ± 0.000
nd—not determined.
Disclaimer/Publisher’s Note: The statements, opinions and data contained in all publications are solely those of the individual author(s) and contributor(s) and not of MDPI and/or the editor(s). MDPI and/or the editor(s) disclaim responsibility for any injury to people or property resulting from any ideas, methods, instructions or products referred to in the content.