Article

Hydrogen Incorporation in RuxTi1−xO2 Mixed Oxides Promotes Total Oxidation of Propane

1
Key Laboratory for Advanced Materials, Research Institute of Industrial Catalysis, School of Chemistry and Molecular Engineering, East China University of Science and Technology, Shanghai 200237, China
2
Institute of Physical Chemistry, Justus Liebig University, Heinrich-Buff-Ring 17, 35392 Giessen, Germany
*
Authors to whom correspondence should be addressed.
Inorganics 2023, 11(8), 330; https://doi.org/10.3390/inorganics11080330
Submission received: 14 June 2023 / Revised: 31 July 2023 / Accepted: 4 August 2023 / Published: 7 August 2023
(This article belongs to the Special Issue 10th Anniversary of Inorganics: Inorganic Materials)

Abstract

:
A rational synthetic approach is introduced to enable hydrogen insertion into oxides by forming a solid solution of a reducible oxide with a less reducible oxide as exemplified with RuO2 and TiO2 (Ru_x, a mixture of x% RuO2 with (100−x)% TiO2). Hydrogen exposure at 250 °C to Ru_x (Ru_x_250R) results in substantial hydrogen incorporation accompanied by lattice strain that in turn induces pronounced activity variations. Here, we demonstrate that hydrogen incorporation in mixed oxides promotes the oxidation catalysis of propane combustion with Ru_60_250R being the catalytically most active catalyst.

Graphical Abstract

1. Introduction

Strain-induced changes of the catalytic activity of transition metal compounds in thermal catalysis were predicted by theory [1] and attributed to a shift of the metal d band center with strain [2], so that strain engineering has been considered a promising way to tune activity. Strain can be introduced to the catalyst’s material in various ways including epitaxial film growth [3], doping such as Li insertion [4], alloying−dealloying [5], formation of core-shell particles [6] and nano-structuring [7]. In fact, strain engineering has turned out to be an important tool to improve activity in electrocatalysis, most notably for water electrolysis [8,9,10,11,12]. Quite in contrast, in thermal catalysis strain engineering is less often encountered [6,7,13,14], due presumably to missing stability of strain-engineered materials at higher reaction temperatures.
Hydrogenation of the catalyst material might be a convenient way to introduce strain into the host lattice and thereby tune the activity of a catalyst as long as the catalyst material is able to incorporate a sufficient amount of hydrogen into the lattice. For instance, Pd-based catalysts [15,16] were reported to form both absorbed and adsorbed hydrogen that may play an important role in hydrogenation catalysis. Hydrogen interaction with oxides is more intricate than with metals [17] since reducible oxides can face stability problems due to partial or even total reduction up to the metal phase. Exposing hydrogen to oxide surfaces frequently forms surface hydroxyl groups, but it can also incorporate hydrogen into the bulk oxide. Hydrogen exposure to CeO2 was reported to form of hydride species H in bulk CeO2 [18,19,20,21,22], a process that is facilitated by oxygen vacancies. The formation of hydride species H in CeO2 may explain its remarkable catalytic performance in the partial hydrogenation of alkynes to alkenes [23,24,25].
Recently, we reported that H2 exposure at 250 °C to mixed Ru0.3Ti0.7O2 is able to incorporate about 20 mol% hydrogen into the rutile lattice, thereby altering slightly the lattice parameters [26]. This was considered a remarkable finding since RuO2 is not stable under such conditions and transforms readily to metallic Ru, while TiO2 is not able to incorporate hydrogen into the lattice, at least not at 250 °C. Hydrogenation of Ru0.3Ti0.7O2 was shown to increase substantially the catalytic oxidation activity in the total oxidation of propane and HCl oxidation reaction.
In the present study, we systematically vary the composition x of the mixed oxide RuxTi1−xO2 (Ru_x). For various compositions ranging from x = 0.2 to x = 1.0 in steps of 0.1, we explore the hydrogenation behavior at 250 °C and compare the catalytic activity of RuxTi1−xO2 with that of the corresponding hydrogenated catalysts in the total oxidation of propane. Without hydrogen treatment, Ru_x reveals a strict composition−activity correlation of activity in that the higher the Ru concentration the higher the activity; highest activity is achieved with Ru_100. However, when treating Ru_x with hydrogen at 250 °C for 3 h (Ru_x_250R), the highest activity is encountered for compositions where both Ru and Ti have similar concentrations. Ru_60_250R turns out to be the most active propane combustion catalyst exceeding even the activity of Ru_100. The hydrogen-induced activity variation is tentatively attributed to hydrogen-induced strain in the mixed oxide RuxTi1−xO2.

2. Experimental Results

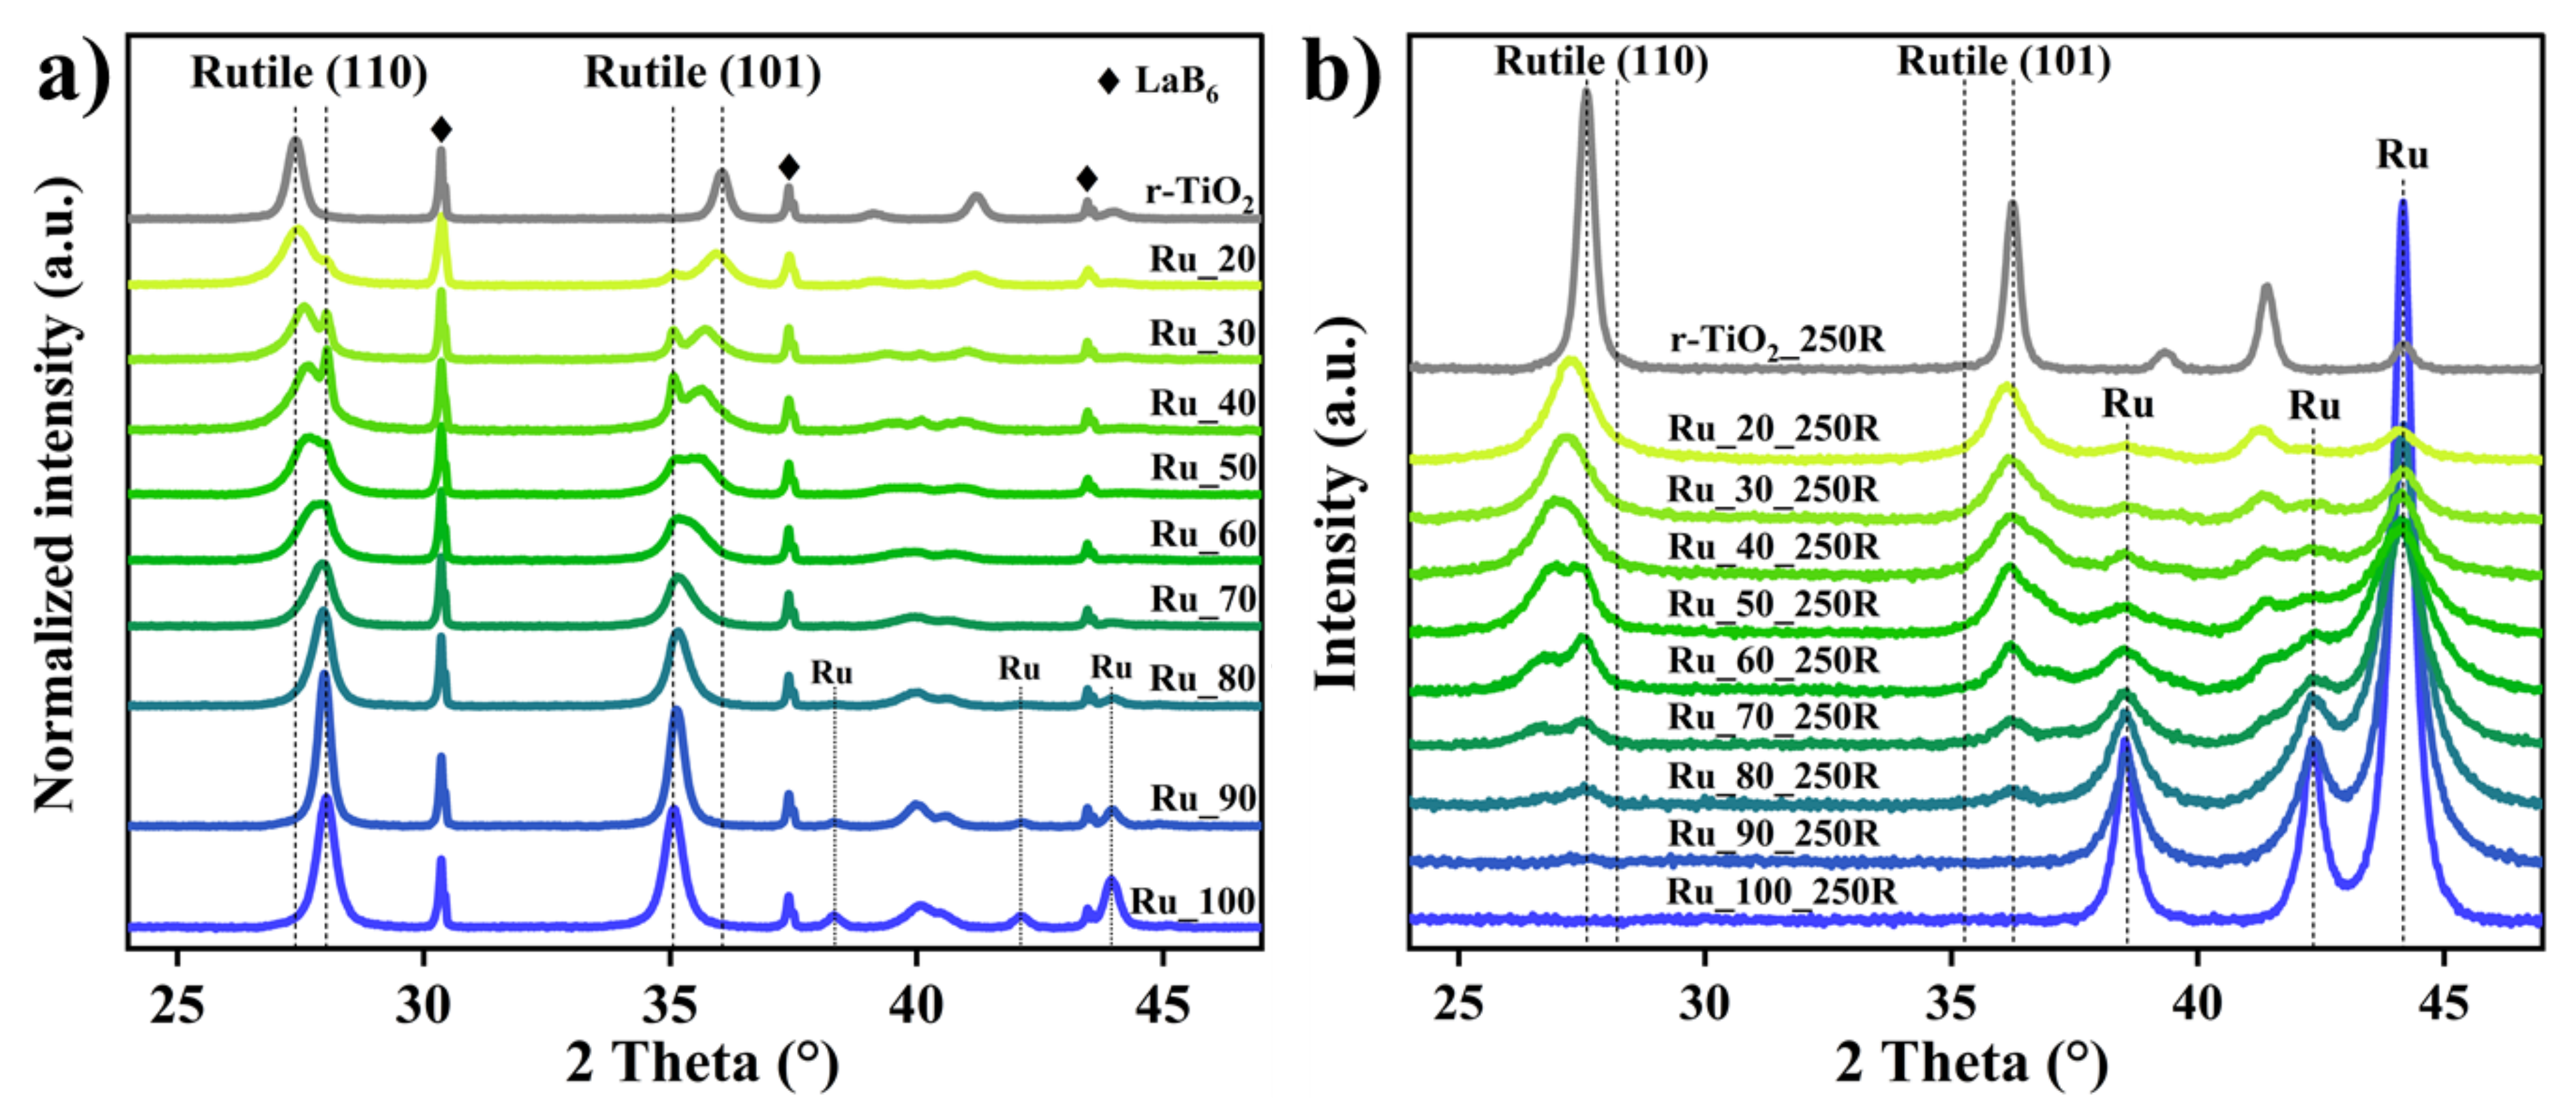
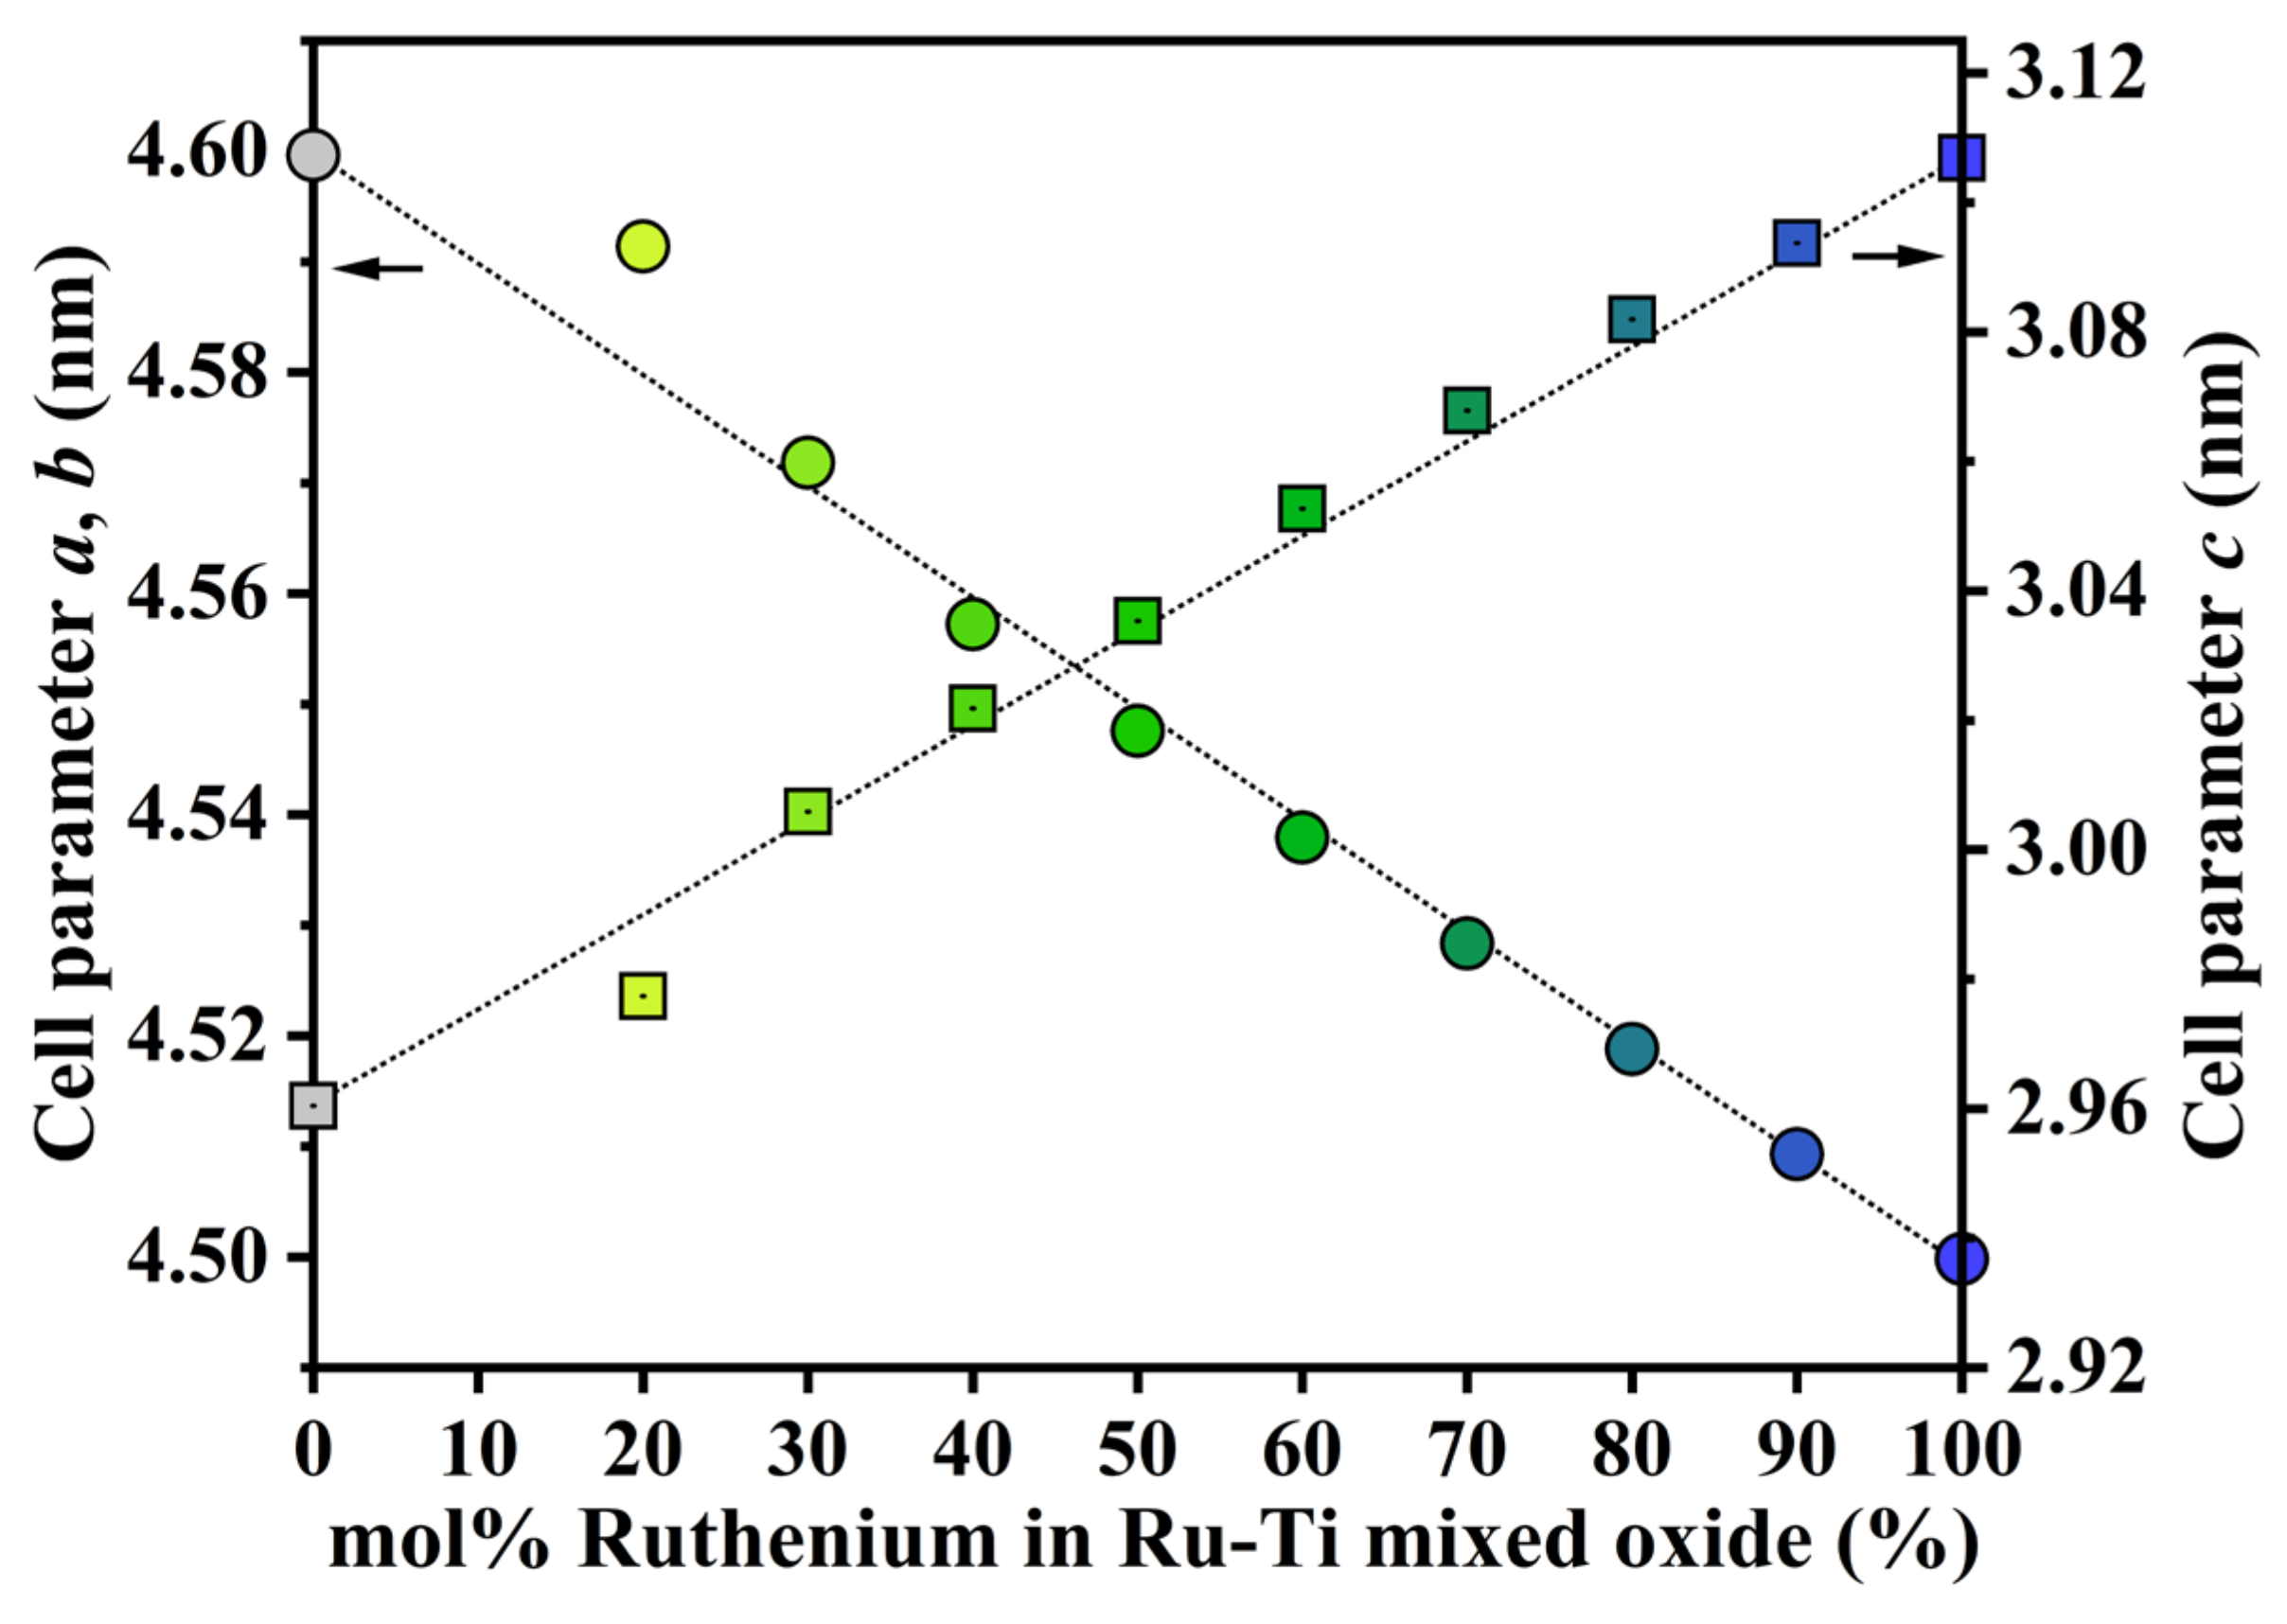
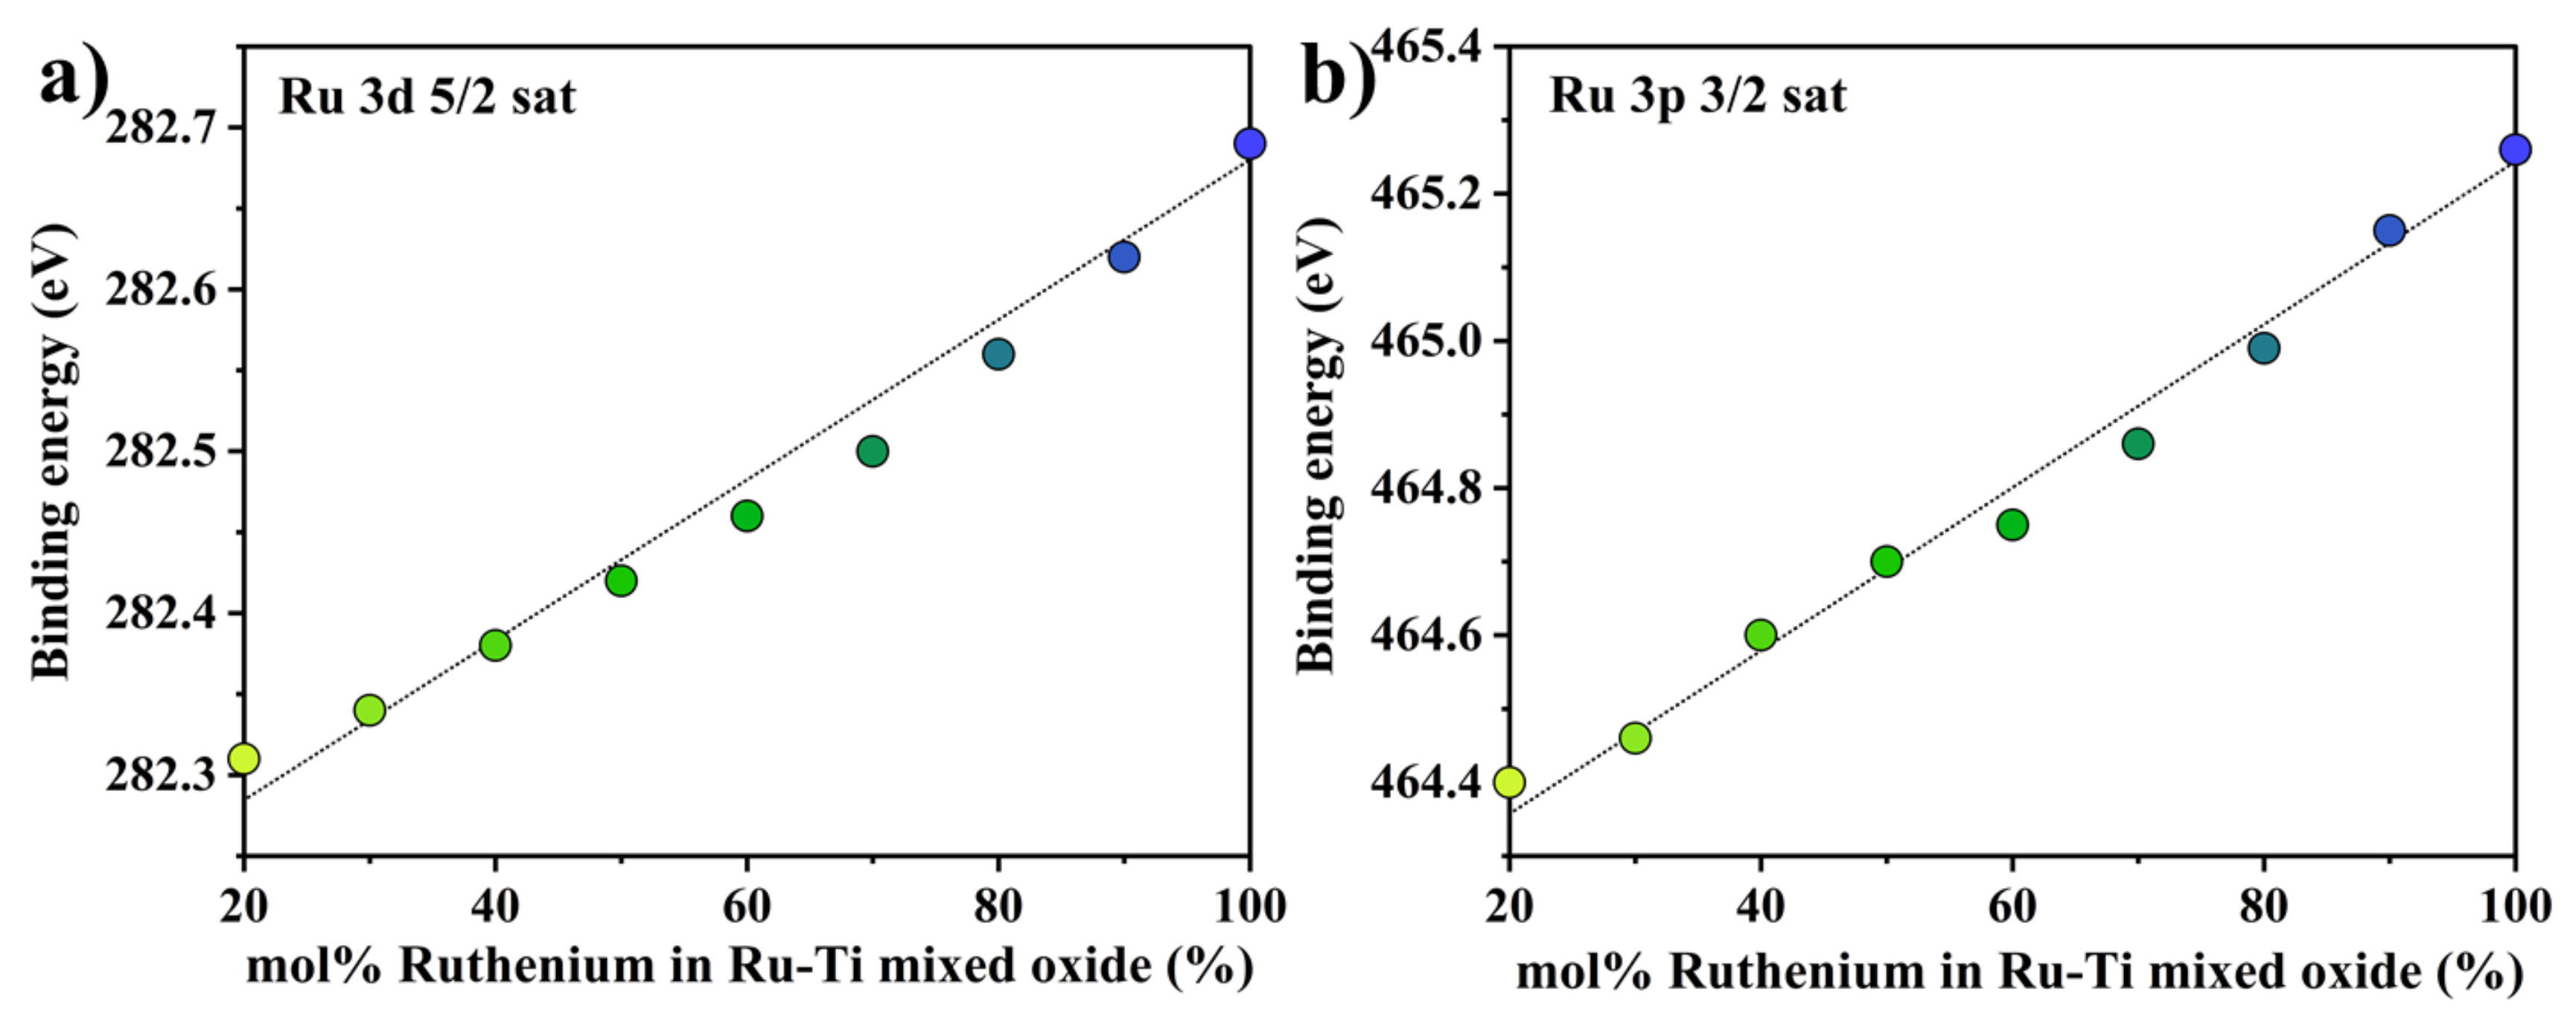
2.1. Characterization of the Fresh Ruthenium−Titanium Mixed Oxide Samples

Figure 1a summarizes the X-ray diffraction (XRD) patterns of freshly prepared ruthenium−titanium mixed oxide catalysts Ru_x with different nominal Ru concentrations, x; the diffraction pattern of pure commercial rutile-TiO2 is overlaid for comparison reasons. The XRD pattern of Ru_100 contains reflections from both a rutile structure and metallic Ru (hcp structure). With the addition of titanium to RuO2, the rutile structure is preserved, and the (110) and the (101) reflections continuously shift towards the reflection of pure rutile TiO2. Above a Ti concentration of 20 mol% no reflections from metallic Ru are discernible. In addition, the rutile related diffraction peaks split into two components with increasing Ti concentration.
The sharp reflections at 28.02° from rutile (110) and 35.07° from rutile (101) do not vary with the Ti concentration and therefore are assigned to the pure RuO2 phase. The position of the broader component in XRD shifts continuously towards rutile TiO2 and is hence ascribed to solid solution RuxTi1−xO2. The coexistence of pure RuO2 and mixed RuxTi1−xO2 in a wide range of compositions evidences a miscibility gap consistent with previous findings based on a similar polymer-assisted preparation method [27] and in agreement with a recent DFT study [28].
In Figure S1, we present the peak deconvolution of the rutile (110) reflection and that of the (101) reflection. For high Ru-content samples like Ru_90, Ru_80 and Ru_70, the (110)/(101) peaks are found to be asymmetric, which clearly points toward a phase separation. For low Ru-content samples this phase separation is pronounced, with two separated reflections corresponding to the RuO2 phase and RuxTi1−xO2 oxide phase, respectively. Therefore, we assume that a pure RuO2 phase exists in the full composition range of Ru–Ti mixed oxides. In the decomposition of the diffraction patterns, we fix the peak position of pure RuO2 and assume that the mixed RuxTi1−xO2 oxide phase crystallizes in the rutile structure. As a main result of the decomposition, the peak position of Ru–Ti solid solution turns out to linearly shift to lower angles with the increasing Ti concentration (cf. Figure S2), in accordance with Vegard’s law [29]. The deconvolution analysis in the present study emphasizes that the prepared samples are not phase pure but facing a miscibility gap.
Together with the analysis of the rutile (101) reflection, we can derive the unit cell parameters a/b and c of the mixed oxide RuxTi1−xO2 as a function of the composition x that are summarized in Figure 2. The linear shift in a/b and c with the nominal composition indicates the fulfillment of Vegard’s law, thus corroborating the formation of a solid solution RuxTi1−xO2 with nominal composition x. Besides, the calculated unit cell volumes for the Ru_x samples (cf. Figure S3) do not vary significantly with the nominal composition x. Note that phase separation becomes more severe for the Ru_20 sample with its solid solution phase starting to deviate from Vegard’s law.
As seen from Figure S1, the FWHM of the RuO2 peak decreases, while that of the mixed oxide increases with Ti concentration. Utilizing the Scherrer equation, this observation translates to an increase of the crystallite size of RuO2, while that of the mixed oxide decreases with increasing Ti concentration (until 50% Ti) (cf. Table 1). In order to consider also the micro-strain in the calculation of the crystallite size, we use the Williamson−Hall method [30], whose results are summarized in Figure S4 and Table S1; the Williamson−Hall plots of RuO2 and the Ru–Ti solid solution phase are exemplified for the Ru_60 sample shown in Figure S5. Since the micro-strain values Δε (≤0.004) of the powder materials are relatively low compared to those described in the literature [31], the values derived from the Scherrer equation are practically not affected by the micro-strain.
From XRD we gain the following structural information of the Ru–Ti mixed oxides: RuO2 nanoparticles and Ru–Ti solid solutions co-exist throughout the entire composition range, while metallic ruthenium is eliminated when more than 20 mol% titanium is incorporated. The Ru–Ti solid solutions fulfill Vegard’s law, thus evidencing that ruthenium and titanium form a solid solution despite phase separation.
While XRD is a bulk characterization method, X-ray photoelectron spectroscopy (XPS) can determine the surface/near-surface compositions of Ru_x catalysts with varying nominal x values (as presented in Figure S6, fitting parameters are compiled in Table S2). From the Ru 3d XP spectra, Ti-rich samples (Ru_40, Ru_30 and Ru_20) show a weak peak at ~288.0 eV whose origin may be attributed to the formed carbonates (O=C=O) from exposure to air or from residual carbon of preparation. It is evident that ruthenium is in the Ru4+ oxidation state in each sample Ru_x; this assignment is corroborated by the pronounced satellite features [32]. No metallic ruthenium is detected on the catalyst surface, proving that the metallic ruthenium species (see in Figure 1a) is encapsulated by the oxide. Buried metallic ruthenium is not expected to participate in the catalytic reaction.
Additionally, the binding energies of Ru3d5/2 and Ru3d3/2 do not vary with the composition, while, surprisingly, the Ru satellite features monotonically shift to lower binding energies with lower ruthenium concentration (see in Figure 3), from 282.69 eV for Ru_100 to 282.34 eV for Ru_30. As the satellite feature is attributed to surface plasmon excitation [33], this shift is correlated to a reduced valence electron density in RuxTi1−xO2.
The O 1s spectrum in Figure S7 depicts two chemical states of near surface oxygen: one is the O2− from the lattice oxygen at ~529 eV, and the other, a shoulder peak at higher binding energy (around 531.8 eV), which is ascribed to the surface OH groups/oxygenated carbon [34]. The integral ratio of OH to the entire surface oxygen is continuously decreasing on lowering the ruthenium concentration, from 39.30% (for Ru_100) to 2.50% (for Ru_50), thus indicating that the incorporation of titanium reduces greatly the amount of surface OH on the catalyst surface.
Since the Ru 3p and Ti 2p XPS features are in the same binding energy region, the surface composition of ruthenium and titanium can be quantified by peak deconvolution. As presented in Table S2 and Figure S8, the Ru 3p region also exhibits satellite features, which behave identically to those in the Ru 3d region; the shifts to lower binding energy further evidence that doping of titanium leads to lower electron density. As compiled in Table 2, the actual surface concentrations deviate quite substantially above a nominal Ru concentration of 60%, while below 50 mol% Ru the surface composition agrees well with the nominal composition.
From these XPS results one may ask whether this deviation of the surface composition from the nominal ones originates from an insufficient control of the composition during synthesis. In order to settle this question, we applied dispersive X-ray spectroscopy (EDS)-scanning electron microscopy (SEM) to gain compositional information of all samples. Since the detection depth from EDS reaches several micrometers, we can consider it as a bulk characterization method. The average composition quantified by EDS summarized in Table 2 indicates that, in the full range (20 ≤ x ≤ 100), our synthesized catalysts agree well with the nominal compositions x, thus excluding the possibilities that the deviation of surface concentration is caused by uncertainties in the synthesis procedure.
Besides, with SEM and TEM we also investigate the morphologies of our catalysts. The Ru_100, SEM images in Figure S9 reveal a dense and rough surface with additional macropores, round small particles agglomerate like a sponge. The particle size gradually becomes smaller with increasing titanium concentration until 1 − x = 50%. This is in agreement with the crystallite size derived from XRD data, indicating that a proper amount of titanium will efficiently decrease the crystallite size of Ru–Ti mixed oxides. Moreover, TEM micrographs confirm that the particle size of mixed oxides decreases with the addition of titanium. Table 2 summarizes also the Krypton physisorption experiments of all as-prepared samples. The Brunauer−Emmett−Teller (BET) surface area varies quite substantially, changing from 9 m2/g (for Ru_100) to 34 m2/g (for Ru_20).

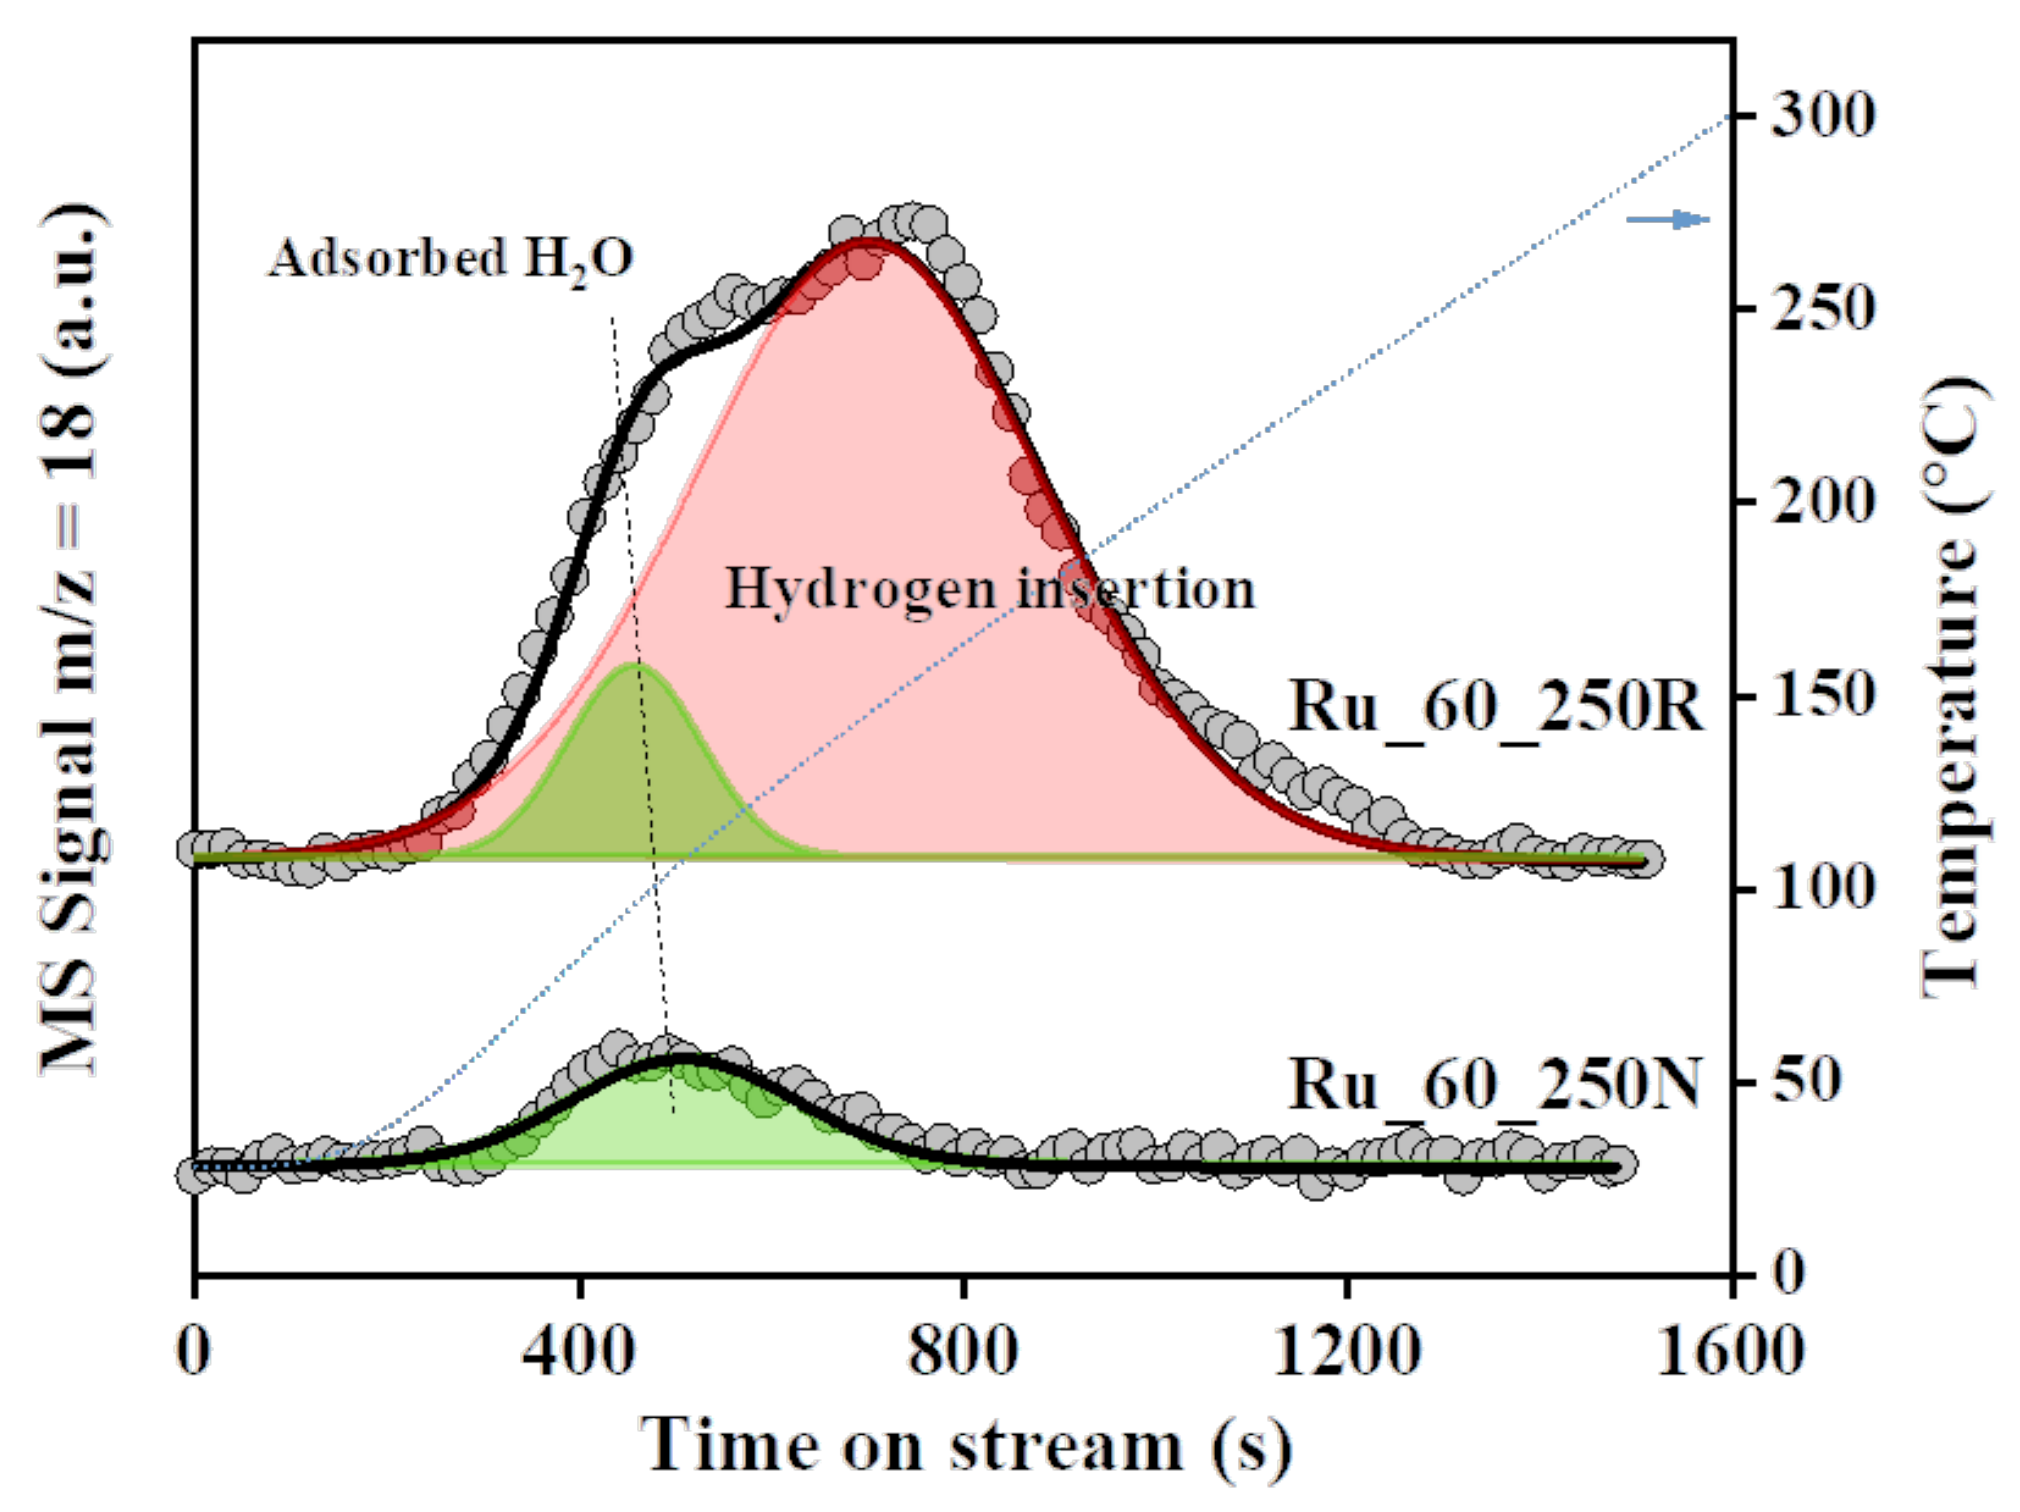
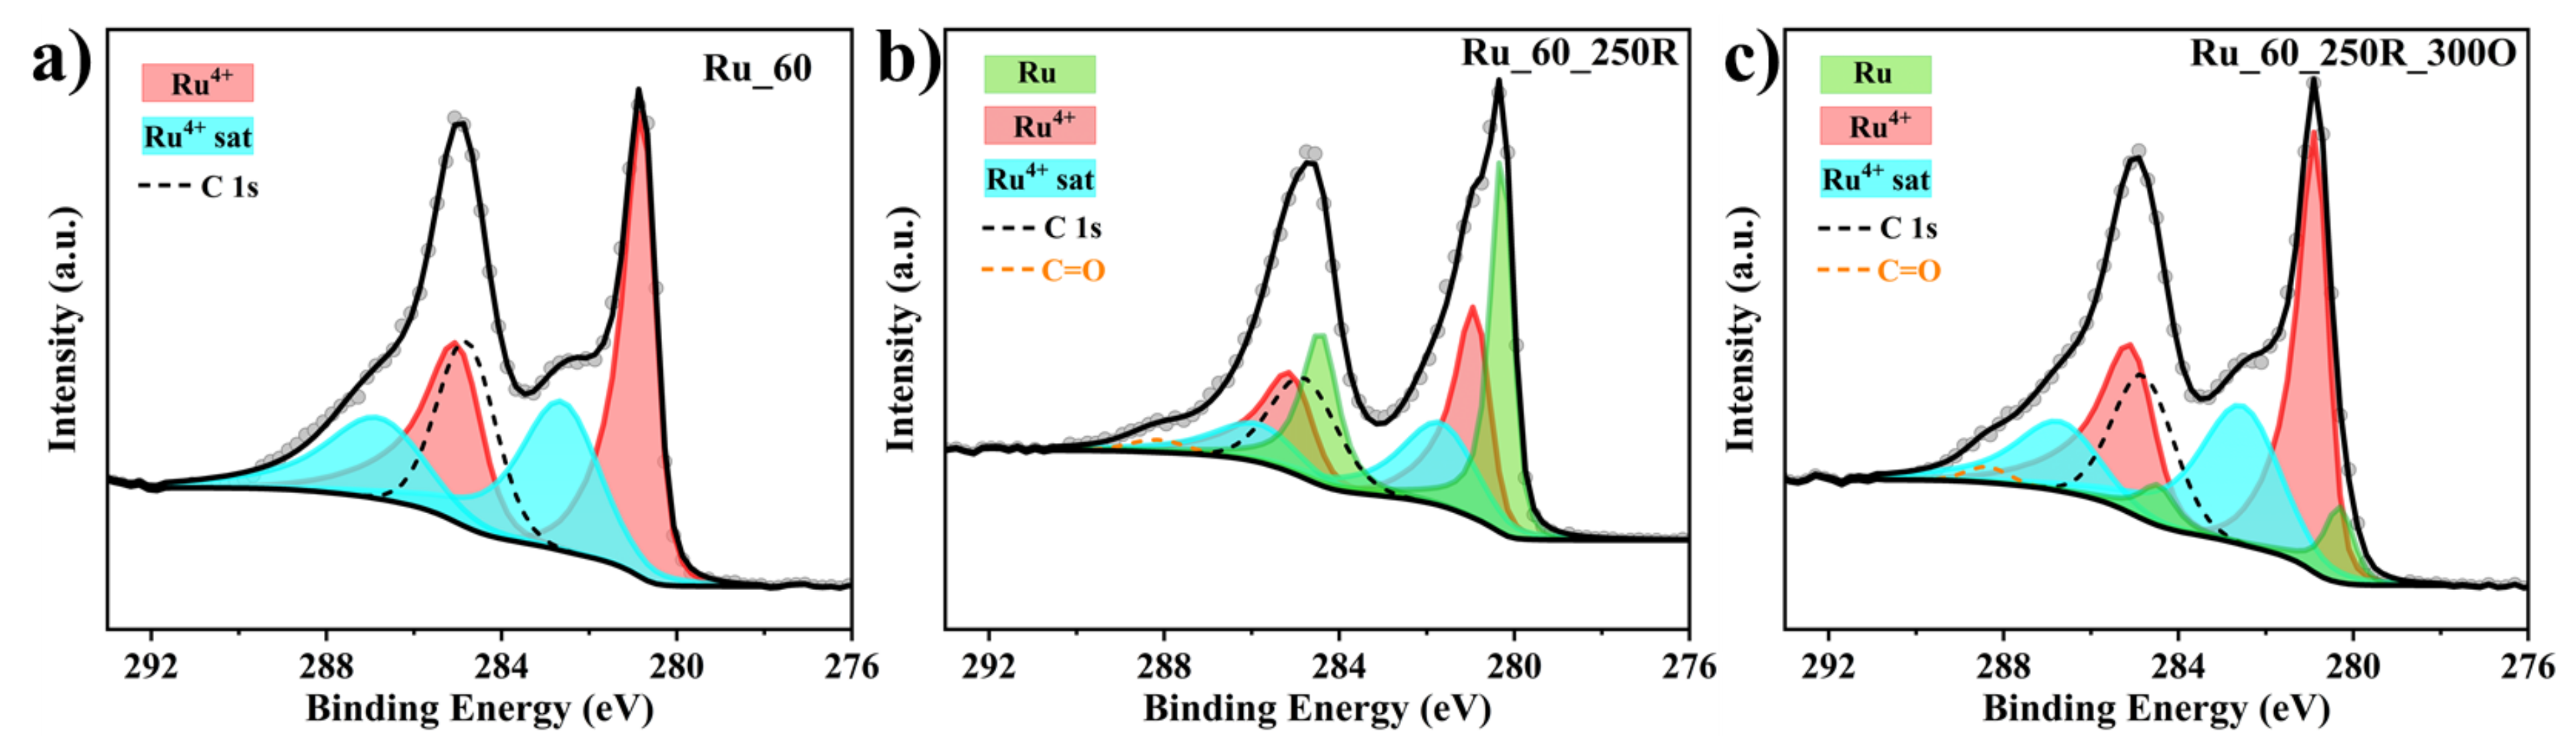
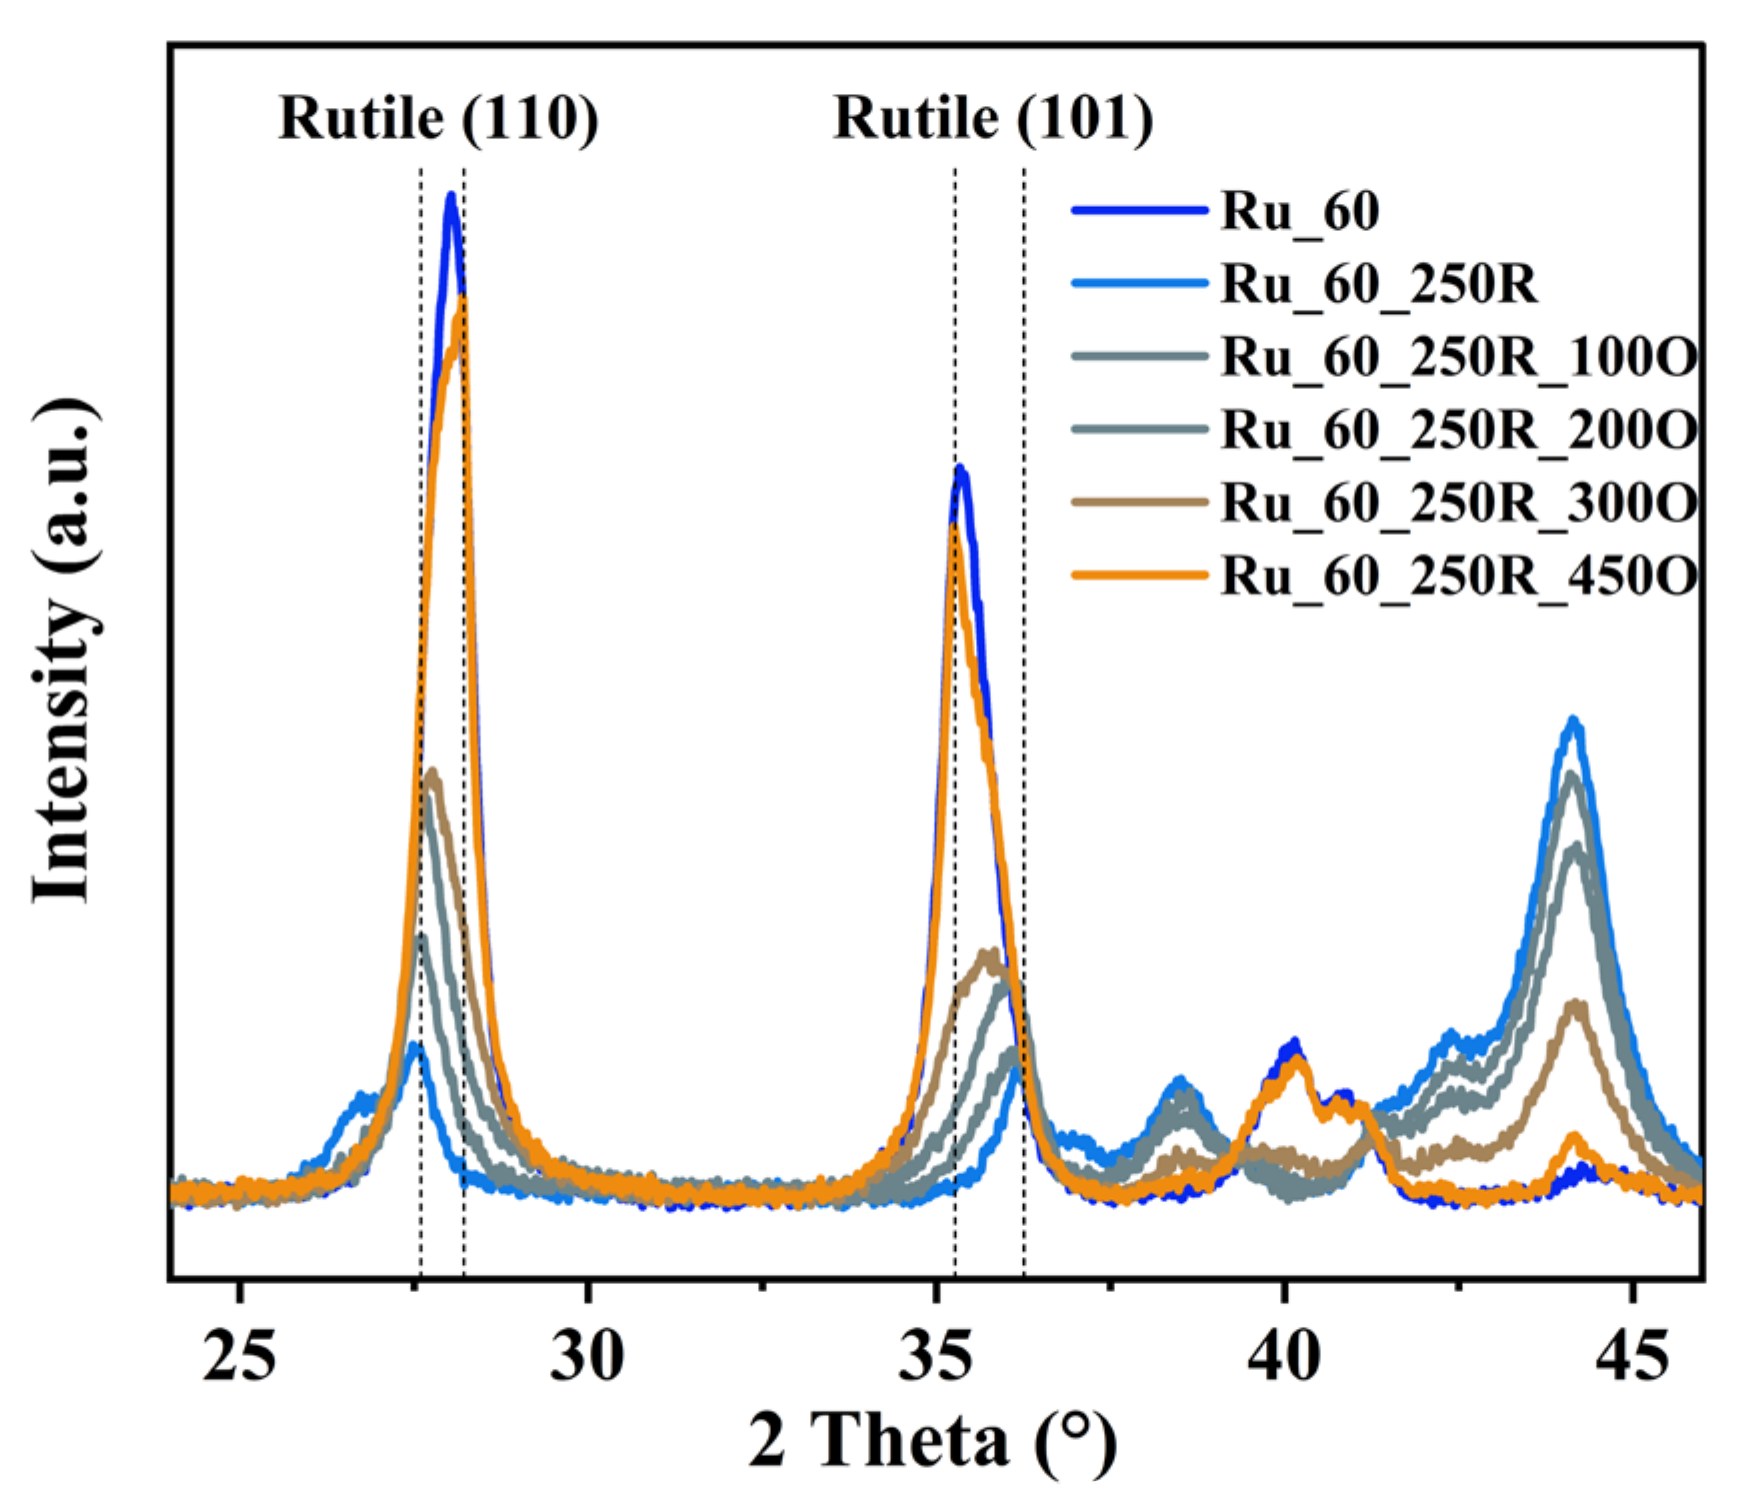
2.2. Hydrogen-Induced Changes of Ruthenium−Titanium Mixed Oxides

We focus on the hydrogen-induced change of the Ru_x samples. The hydrogen treatment consists of an exposure of 4% H2/N2 for 3 h at 250 °C. The specific reduction temperature of 250 °C has been shown to result in a large hydrogen uptake for the case of Ru_30 [26]. As shown in Figure 1b, Ru_00, e.g., pure rutile-TiO2, is not affected by this hydrogen treatment, while Ru_100 is fully transformed to metallic Ru phase, consistent with our previous study [26].
The diffraction peak of RuO2 at 2θ = 28.02° disappears in Figure 1b when exposed to 4% H2/N2 at 250 °C, while the intensity of Ru metal-related diffraction increases. As expected, the metallic Ru diffraction intensity is higher the higher is the Ru content x of Ru_x. This means that the RuO2 particles are easily reduced to metallic ruthenium at a temperature of 250 °C, consistent with previously published studies [35,36].
Quite in contrast, the rutile diffraction peaks of the mixed oxide phases (110) and (101) persist and shift only in position to the lower and higher angles, respectively, upon exposure to 4% H2/N2 at 250 °C. The degree of peak shift depends on the Ru concentration. Close to 50 mol% Ru, the observed shift is the highest. Actually, the shifted diffraction peak of rutile consists of two components, most likely evidencing different hydrogen concentrations in the mixed oxide crystallites. The bulk composition of Ru_x (cf. Table 2) does not change when exposed to H2 at 250 °C (Ru_x_250R). As discussed recently [26], these shifts of the reflections are caused by the incorporation of hydrogen and not by reduction of the metal ions.
The Ru_x_250R samples are subsequently subject to a mild re-oxidation treatment that is conducted at 300 °C and the XRD patterns are presented in Figure S10a, and the changes of macrostrain (position) and micro-strain (FWHM) among the initial, reduced and re-oxidized samples as exemplified by Ru_20, Ru_40, Ru_60 and Ru_80 are compiled in Figure S10b. The rutile structure of Ru_x is restored after re-oxidation treatment, while most but not all of the metallic Ru transforms back to RuO2. For the case of Ru_30_250R, it was shown that full recovery of Ru_30 requires oxidation temperatures of 400 °C [26].
With thermogravimetric-mass spectrometry (TG-MS) the amount of incorporated hydrogen can be quantified by the integrated water signal that is produced by reacting incorporated hydrogen with oxygen during heating of the sample in ambient air. We exemplify this experiment with Ru_60_250R since the catalytic activity of this sample is thoroughly tested. A nitrogen-treated Ru_60_250N sample serves as reference. As summarized in Figure 4, a small mass signal for H2O (m/z = 18) is evident at 80 °C for Ru_60_250N, while, for Ru_60_250R, a broad and strong water signal appears. This water peak of Ru_60_250R contains actually two components, one is associated with water desorption (90 °C) and the other is related to the oxidation of incorporated hydrogen (maximum at 160 °C). Employing a deconvolution procedure, as indicated in Figure 4, the molar fraction of inserted hydrogen is determined to be 35 mol% based on the integrated water difference area of Ru_60_250R and Ru_60_250N. Recently, the molar fraction of inserted hydrogen for Ru_30_250R was found to be 18 mol% [26]. Another hydrogenation experiment for Ru_40_250R (reference Ru_40_250N) is shown in Figure S11 and yields 23 mol% of inserted hydrogen in Ru_40_250R. Given that Ru_100 and pure TiO2 rutile cannot incorporate any hydrogen, the obtained amount of incorporated hydrogen among different Ru_x_250R catalysts (Figure S12) reveals a “volcano” type of the H-fraction with the increase of the Ru concentration in the Ru–Ti mixed oxides. The maximum amount of incorporated hydrogen is encountered at the Ru concentration of 60%.
Figure 5 compares the Ru3d XP spectrum of Ru_60 with those of the hydrogen-treated Ru_60_250R sample and the re-oxidized one, Ru_60_250R_300O. Three Ru components, namely metallic Ru, Ru4+, and the satellite of Ru4+ and two carbon species are considered to fit the spectra. The Ru_60 sample reveals only the Ru4+ component (red) together with the corresponding satellite feature (blue), consistent with the corresponding XRD (pattern Figure 1a) that is composed only of diffraction peaks of the mixed oxide Ru0.6Ti0.4O2 and pure RuO2. Upon hydrogen exposure at 250 °C, a strong metallic Ru peak becomes apparent in the Ru 3d spectrum. The metallic Ru component comes from the reduction of RuO2 towards metallic Ru, as indicated by XRD, while the Ru4+ component originates from Ru in Ru0.6Ti0.4O2. Upon re-oxidation of Ru_60_250R at 300 °C (Ru_60_250R_300O), most of metallic component transforms back to Ru4+. We conclude from these experiments that the Ru4+ oxidation state Ru0.6Ti0.4O2 is preserved, regardless of the applied treatment (hydrogenation, re-oxidation).
Hydrogen reduction of Ru from Ru0.6Ti0.4O2 can, however, be excluded for the following reasons. The reduction treatment at 250 °C preserves the rutile structure, albeit with low intensity (cf. Figure 6). Upon re-oxidation at 450 °C (Ru_60_250R_450O), however, the rutile diffraction peaks of Ru_60 are practically restored. In particular, rutile diffraction peaks shift back to those positions of Ru_60 (with identical intensity), thus evidencing that the mol% of Ru in the mixed rutile structure has been preserved (Vegard’s law).
From HRTEM and element mapping (cf. Figure S13), it is evident that Ru_60 and Ru_60_250R consist mainly of mixed RuxTi1−xO2 oxide whose composition has not changed. For Ru_60 larger RuO2 particles are discernible.
In addition to the Ru 3d spectra (cf. Figure 5), Ti 2p XP spectra are compiled in Figure S14 for Ru_60, the hydrogen treated Ru_60_250R sample and the re-oxidized one, Ru_60_250R_300O. All Ti 2p spectra show only Ti4+, and there is no indication of Ti3+. The overall near-surface composition of Ru_60_250R is collected in Table 2. Corresponding O1s spectra in Figure S15 exhibit two components, one related to O2− and the other assigned to OH/carbonate species. The OH/carbonate feature does not vary when Ru_60 is exposed to hydrogen or is re-oxidized, suggesting that incorporated H does not change the concentration of OH species or carbonate species.
From all these experiments we infer that the reduction process results in the incorporation of hydrogen within in the mixed oxide and both Ru and Ti in the mixed Ru–Ti oxide phase remain in the 4+ oxidation state.

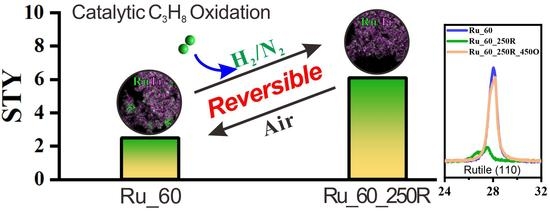
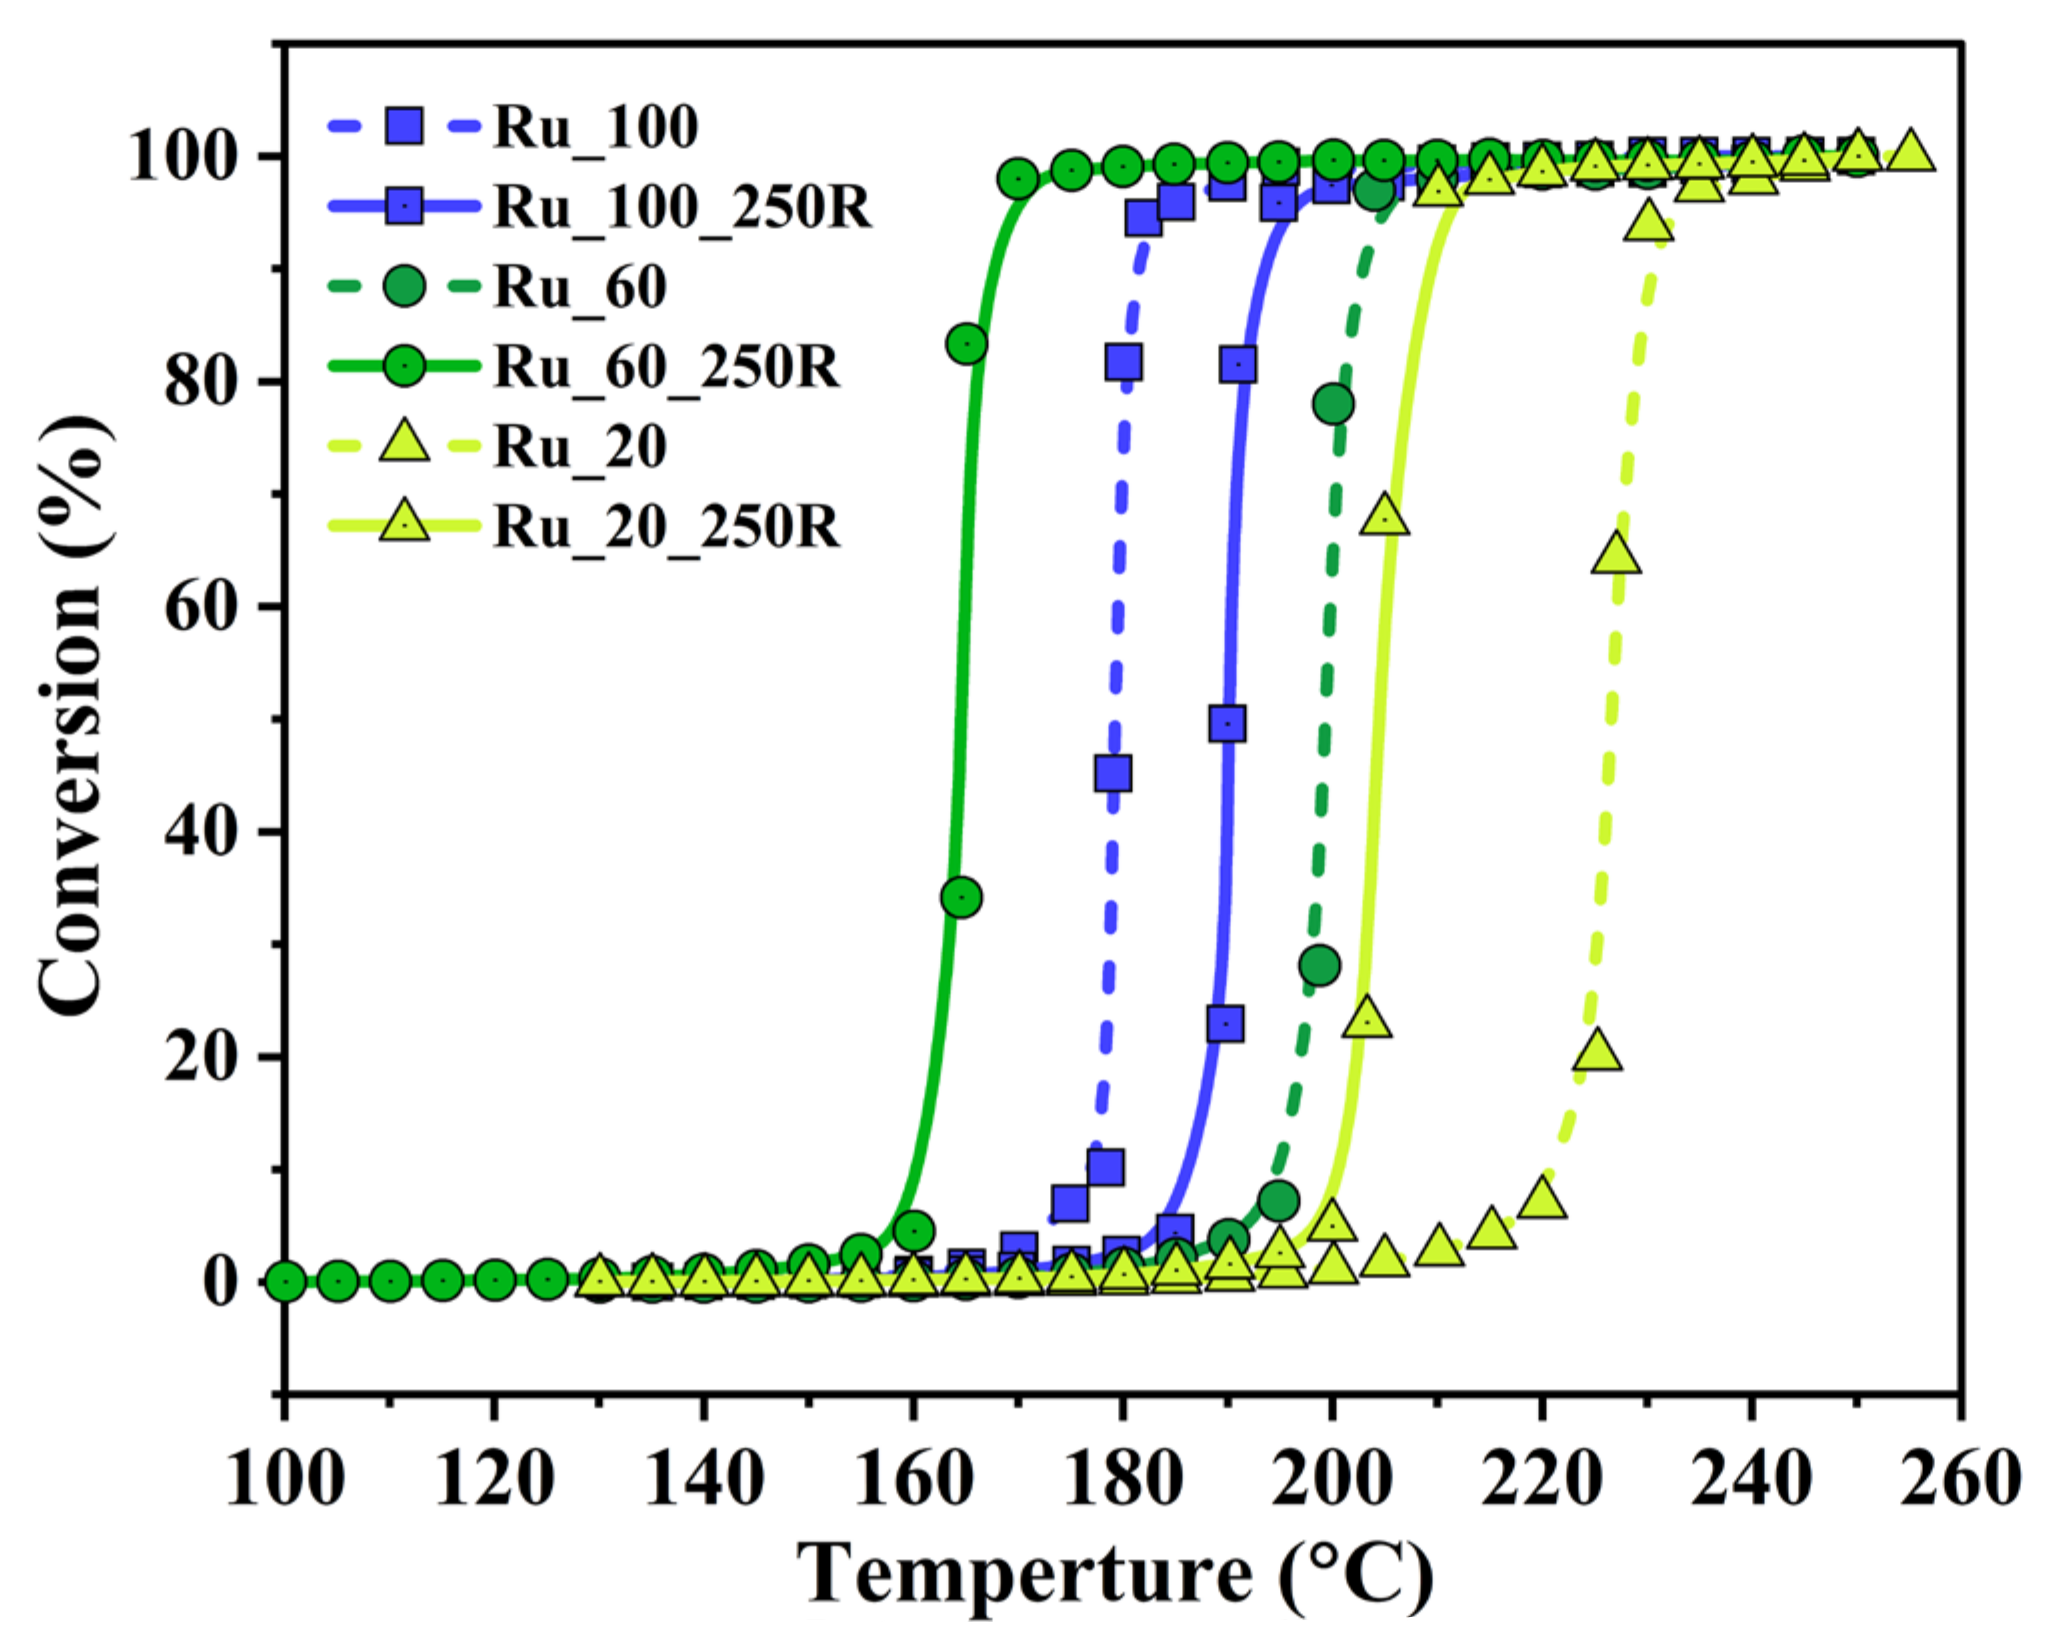
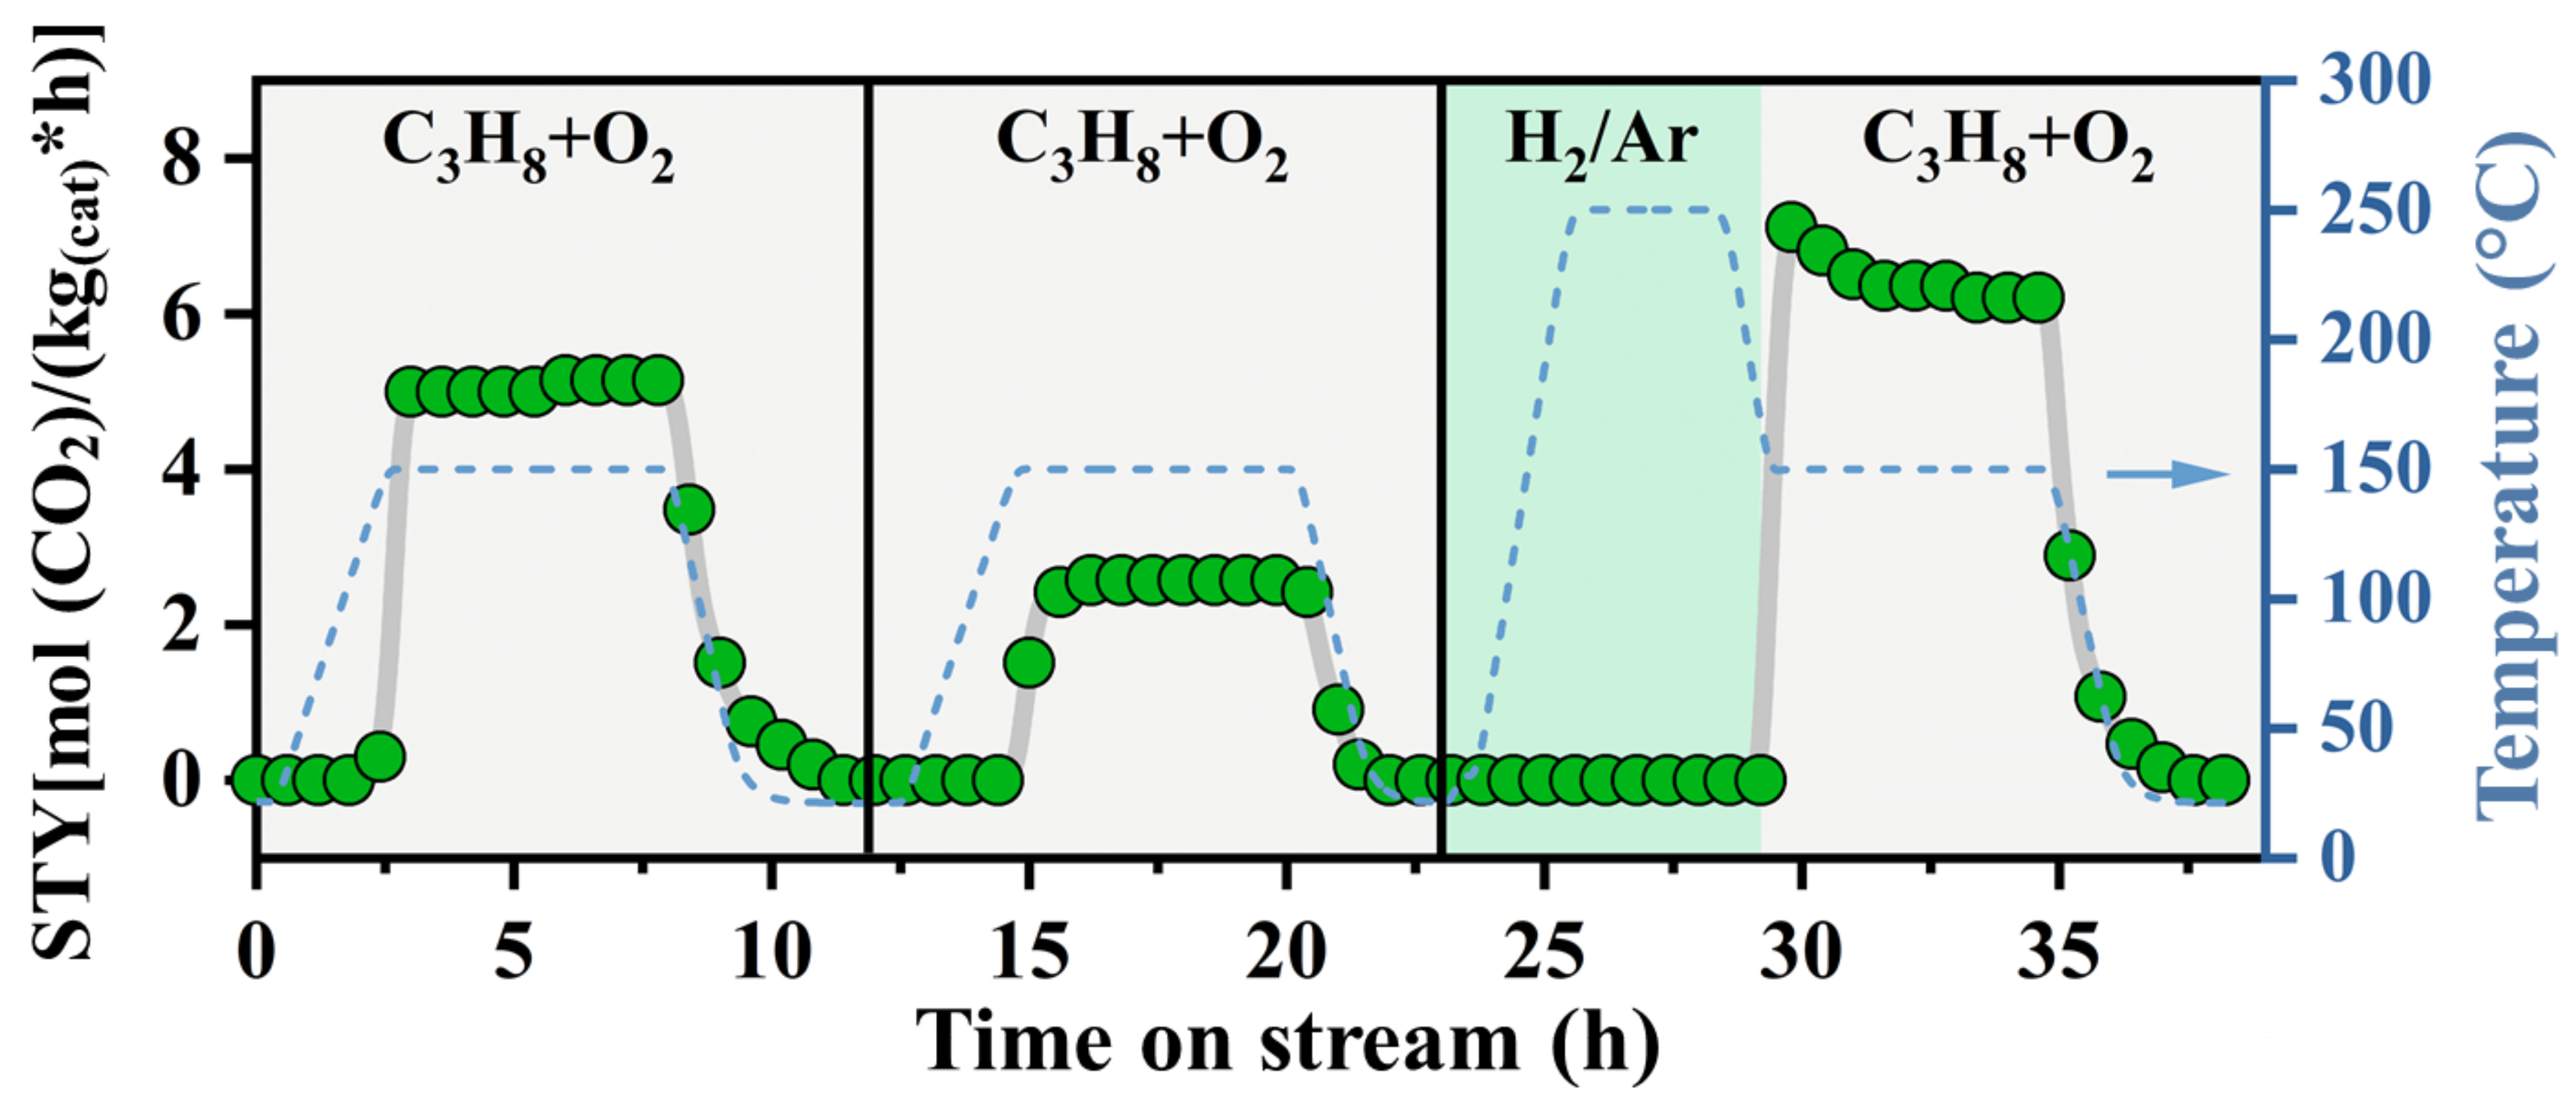
2.3. Catalytic Tests: Propane Combustion

In the following, we conducted catalytic tests of Ru_x and Ru_x_250R for the total oxidation of propane, serving here as a model reaction. The full set of light-off curves is presented in the ESI (cf. Figure S16a,b). Except for Ru_100, the hydrogenated Ru_x_250R sample is more active than Ru_x. The temperature differences for T90 is collected in Figure S16c (T90 is the temperature where 90% conversion is realized). From these conversion data, one can recognize that the Ru_x with x close to 60% exhibits highest activity after hydrogenation, that is even higher than that of Ru_100.
In Figure 7 we exemplify light-off curves for propane combustion of Ru_60, Ru100 and Ru_20 before and after hydrogenation. Ru_100 reveals the highest activity among the non-hydrogenated samples with T90 = 182 °C. Upon hydrogenation, the light-off curve of Ru_100_250R shifts to higher temperatures (T90 = 194 °C). Ru_20 is significantly less active than Ru_100; T90 = 231 °C; upon hydrogenation, T90 decreases to 211 °C for Ru_20_250R. Ru_60 reaches 90% conversion at 203 °C, while 90% conversion is achieved at 168 °C for Ru_60_250R, i.e., 35 °C lower than for Ru_20 and even 14 °C lower than that for Ru_100.
Since the inserted H in RuxTi1−xO2 is a labile species that leaves the sample already at about 100 °C by water formation under ambient atmosphere [26], we performed an additional experiment, where the Ru_60 sample is in situ hydrogenated at 250 °C in the reactor; this procedure allows us to keep the hydrogenation level high in the mixed oxide sample Ru_60. For the catalytic test of propane oxidation, we choose a reaction temperature of 150 °C to avoid full conversion (cf. Figure 8).
Figure 8 indicates that the activity of Ru_60_250R at 150 °C in the first cycle is quite high with a STY value of 5.2 mol ( CO 2 ) · kg ( Cat ) 1 · h 1 , and it declines in the second cycle to 2.4 mol ( CO 2 ) · kg ( Cat ) 1 · h 1 likely due to the removal of incorporated hydrogen [26]. Conducting an in situ hydrogen treatment at 250 °C of Ru_60_250R leads to a re-activation of the catalyst with a steady state STY of 6.1 mol ( CO 2 ) · kg ( Cat ) 1 · h 1 that is even higher than the initial activity during the first cycle. Hydrogen exposure at higher temperature will lead to lower activity of the Ru_60_400R sample (STY = 3.1 mol ( CO 2 ) · kg ( Cat ) 1 · h 1 ) (cf. Figure S17). After in situ hydrogen treatment at 150 °C, Ru_60_400R is reactivated with a higher STY value of 4.7 mol ( CO 2 ) · kg ( Cat ) 1 · h 1 , that is lower than that of Ru_60_250R (cf. Figure S17). Altogether, hydrogen treatment at 250 °C seems to optimize the promotional effect of hydrogen in the total oxidation of propane.

3. Discussion

3.1. Formation of Ru_x and Ru_x_250R

A mixed ruthenium–titanium oxide material with nominal varying concentration x of Ru (Ru_x) is successfully prepared by a conventional sol-gel method. Below x = 70%, Ru_x consists of pure RuO2 and a mixed oxide RuxTi1−xO2. For higher concentration of Ru, in addition, a metallic Ru is formed. The metallic Ru phase is caused by the preparation method. For sol-gel synthesis, O2 cannot penetrate into the polymer network when metal cations nucleate during the calcination stage, thus causing a net reducing environment for the growing particle where the metal cations Ru3+ is reduced to Ru0 [34]. From EDS-SEM and XPS, the bulk and surface compositions for x < 50% are similar and close to the nominal composition of Ru_x, while for x > 50%, the surface composition of Ru is significantly lower than the bulk concentration.
For Ru_x we see a clear linear correlation of the lattice parameters of RuxTi1−xO2 with the composition x of ruthenium. The cell parameters a/b of RuO2 are smaller than those of TiO2 while the c value of RuO2 is larger than that of TiO2, therefore for a mixed oxide, a/b and c cell parameters of the Ru–Ti phase indicate an “anti-symbatic” behavior (Figure 2). In addition, there is a clear linear correlation of the binding energy of the satellite peak in Ru3d with the composition x of ruthenium. (cf. Figure 3) With increasing Ru concentration, the energy of the surface plasmon increases, consistent with the surface plasmon energy being expected to increase in energy with increasing electron density [33].
From XPS, we conclude that both Ti and Ru in Ru_x for x ≤ 70% are in the 4+ oxidation state independent of the composition x. Metallic Ru, if present, is buried, as evidenced by XPS, and does therefore not participate in the catalytic reaction.
Hydrogen exposure to Ru_x at 250 °C (Ru_x_250R) leads to hydrogen incorporation in Ru_x for Ru concentration x = 20% up to 80%. (cf. Figure 1) The extremes Ru_00 (e.g., pure rutile-TiO2) and Ru_100 are not able to incorporate hydrogen: TiO2 is not affected at all by hydrogenation at 250 °C, as reduction to Magneli phases requires much higher temperatures [37,38]. Ru_100 is completely transformed to metallic Ru, and with increasing Ru concentration, more metallic Ru is formed upon hydrogen exposure at 250 °C. However, 18, 23 and 35mol% of hydrogen are inserted in Ru_30_250R [26], Ru_40_250R, (Figure S11) and R_60_250R, (Figure 4), respectively. From Ru 3d XPS data, there is no indication of an oxidation state of ruthenium other than Ru0 and Ru4+. The rutile structure of mixed oxide RuxTi1−xO2 is maintained upon H2 exposure at 250 °C, suggesting that the Ru4+ can be preserved in rutile structure when mixed with less reducible TiO2. Therefore, the peak shifts in XRD (Figure 1b) after reduction treatment are caused by the incorporation of hydrogen in the rutile structure and not by the reduction of the metal ions, which is consistent with literature [26]. The only change observed for mixed RuxTi1−xO2 is a hydrogen-induced shift in the lattice parameters (cf. Figure 2), i.e., the introduction of hydrogen-induced strain into the mixed oxide lattice. Hydrogen absorption in mixed oxide RuxTi1−xO manifests therefore a synergy effect in that Ru enables the activation of H2 while Ti stabilizes Ru4+ against reduction to metallic Ru.
The possible types of inserted hydrogen could be proton, neutral H or hydride H species. Based on the XPS data, there are no changes in the oxidation states of Ru4+ and Ti4+ in the rutile phase (as shown in Figure 5 and Figures S14 and S15). Moreover, from the O 1s spectrum, there is no obvious increase of the OH-related signals, so that we exclude the existence of protons and neutral H in the mixed oxide lattice. Instead, we favor that the incorporated hydrogen is a hydride species Hδ, which is reconciled with the energetic shift of the Ru satellite peak in the Ru3d spectrum and that is correlated with a reduced electron density for exciting the surface plasmon. Obviously, some of the delocalized electrons are localized at Hδ.
Ru_60 can almost be recovered from Ru_60_250R by mild re-oxidation at 450 °C. Re-oxidation at 100 °C starts to remove H-induced changes in strain, both macro- and micro-strain, as reflected by changes in diffraction peak position and FWHM. This behavior was also observed in a previous study of Ru_30, and it was traced to the removal of absorbed hydrogen via water formation [26].

3.2. Improved Oxidation Catalysis of Ru_x_250R in Comparison to Ru_x

The light-off curves of Ru_x and hydrogen inserted Ru_x catalysts are measured for the total oxidation of propane (cf. Figure 7 and Figure S16). These experiments provide compelling evidence that H insertion is beneficial for the oxidation catalysis of propane, with the optimum catalyst being identified with Ru_60_250R. For Ru_100, hydrogenation at 250 °C leads to lower propane combustion activity.
Hydrogen exposure at 250 °C produces a labile hydrogen species in the mixed oxide lattice that can readily be removed by increasing the temperature in the ambient atmosphere (cf. Figure 6). Already a mild re-oxidation at 100 °C restores part of the hydrogen-induced strain in the mixed oxide. From activity experiments in Figure 8, we can conclude that hydrogen is lost during temperature ramping in the first cycle, although the catalyst runs stably at the final reaction temperature of 150 °C. In order to stabilize inserted H during reaction, the surface needs to be continuously supplied by hydrogen from propane activation. Propane dissociation is activated and needs a temperature of at least 100 °C [39,40]. Therefore, during the heating and cooling ramp in the temperature window of 50–100 °C, the catalyst is exposed to a reaction mixture that is not able to supply the surface with hydrogen. The temperature range of 50–100 °C is, however, high enough to consume inserted hydrogen by water formation due to oxygen in the feed. From this discussion, it is clear that higher activities are expected when the Ru_60_250R catalyst is in situ hydrogen-treated in the reactor during temperature ramping. The activity of propane oxidation (cf. Figure 8) is indeed significantly higher and stable when the catalyst is heated under a hydrogen atmosphere first to the specific reaction temperature and then the gas atmosphere is switched to the actual reaction mixtures. Propane decomposition at high temperature can supply the catalyst surface constantly with hydrogen. Therefore, dissolved hydrogen does not experience a driving force to diffuse towards the surface, thus stabilizing the inserted hydrogen in the lattice of the mixed oxide.
We can safely assume that inserted hydrogen does not take place in the catalytic cycle, since we focus here only on the catalytic propane oxidation reaction. The incorporated hydrogen stabilized by the presence of hydrogen at the surface is, however, the key factor to promote the oxidation catalysis. We expect, however, that for catalytic hydrogenation reaction, the beneficial effect of inserted H may be even more pronounced since inserted hydrogen is able participate in the catalytic cycle.
Hydrogen incorporation is accompanied by the development of macro- and micro-strain of Ru_x, as evidenced by the shift and broadening of the rutile diffraction maxima in the powder XRD (cf. Figure 1), while, after mild re-oxidation at 300 °C, the macro- and micro-strain of Ru_x_250R is largely removed, as reflected by the recovery of the peak position and FWHM (cf. Figure S10). Whether H insertion itself or the induced changes of lattice parameters leads to electronic modifications cannot be disentangled at this point and needs to be scrutinized by future ab initio studies. In any case, the electronic structure is affected by H insertion, as corroborated in the observed binding energy shift of the satellite feature in Ru3d (cf. Figure 3). The increased activity can therefore be related to the altered electronic structure of RuxTi1−xO2. A direct correlation of strain with activity is, however, not evident for Ru_x_250R and needs further studies.

4. Materials and Methods

4.1. Materials

Ruthenium (III) trichloride hydrate (RuCl3·xH2O, Ruthenium content: 40.00–49.00%, ReagentPlus®), anhydrous citric acid (C6H8O7, ≥99.5%), ammonia solution (NH4OH, 25%) and titanium butoxide (C16H36O4Ti, 97%) are purchased from Sigma-Aldrich (St. Louis, MO, USA) and used without further purification.

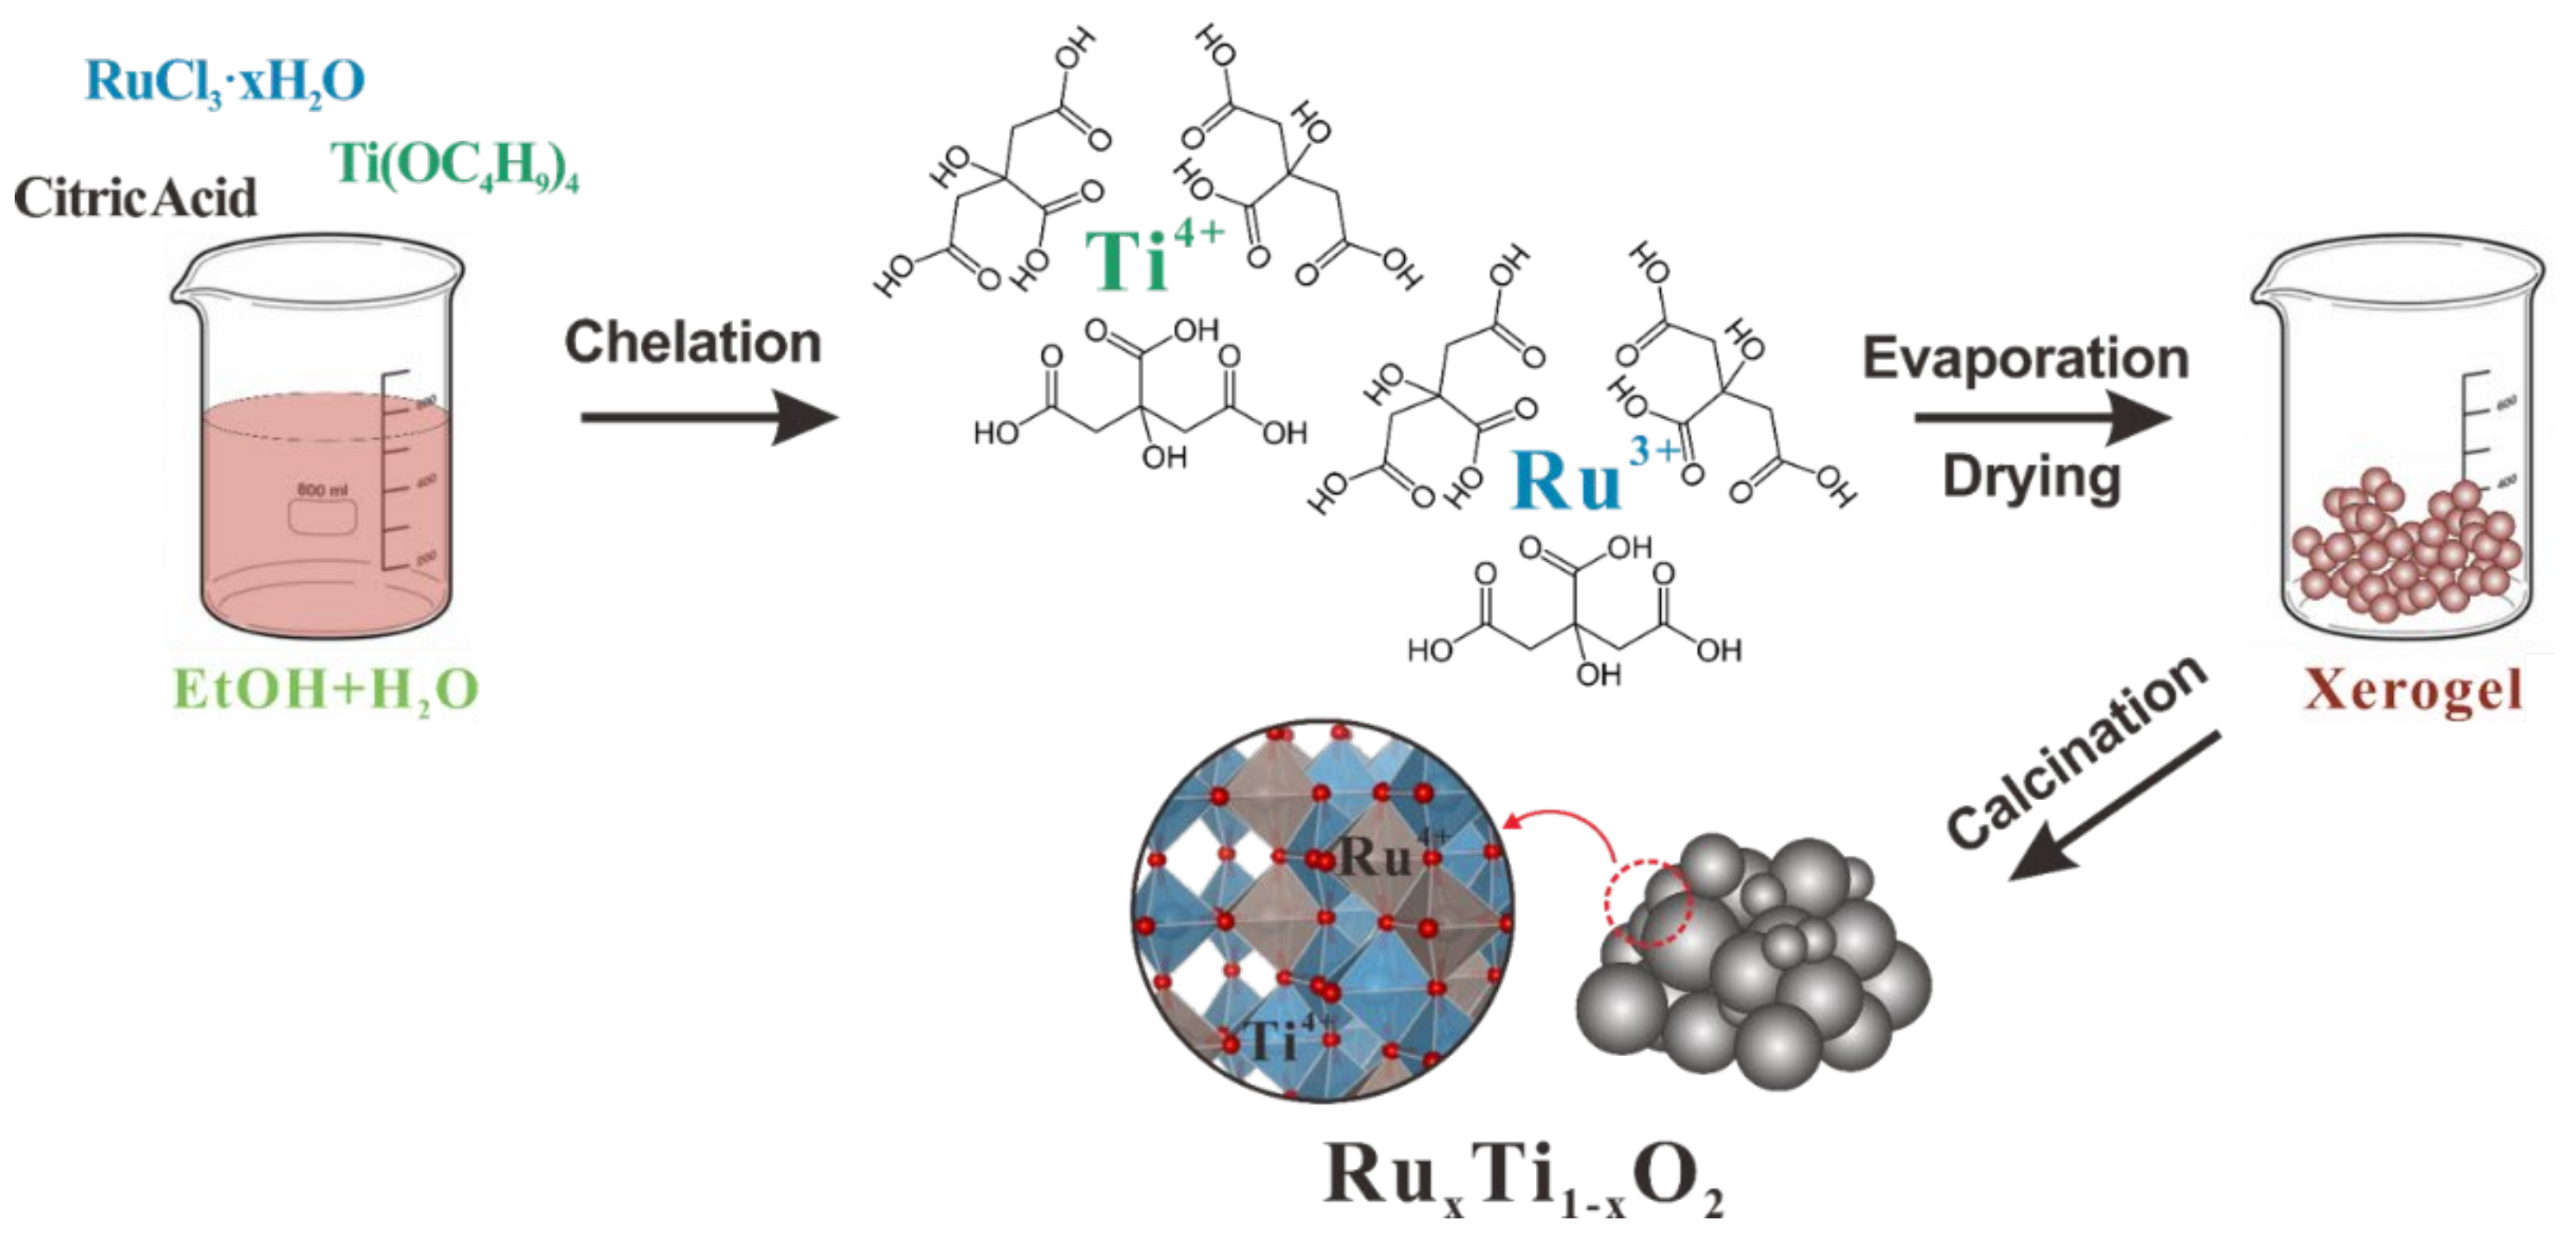
4.2. Catalysts Preparation

Ru–Ti mixed oxide materials with varying compositions are prepared by a conventional citric acid assisted sol-gel method (cf. Figure 9) and are denoted as Ru_x, where x represents the nominal molar percentage of ruthenium varying from 20% to 100%. For the procedural synthesis of Ru_60: 0.024 mol citric acid (anhydrous) is dissolved into 50 mL deionized water, and the solution is stirred and kept at 60 °C. Then, 5 mL anhydrous ethanol containing 0.8 mmol titanium butoxide is quickly injected into the citric acid solution. After thorough mixing, 0.0012 mol RuCl3·xH2O is added to the solution and stirred for another 30 min at 60 °C. The full complexation of the ruthenium and titanium cations is accomplished by slowly heating the mixture to 80 °C, afterwards, the aqueous ammonia solution of 2 mol/L is added dropwise to adjust the pH of the solution to ~6. Finally, the dark brown but transparent solution is evaporated at 90 °C and the obtained dark green gel is dried at 120 °C for 12 h. Subsequently, the dark foamy material is carefully ground before calcination at 450 °C for 4 h in static air at 2 °C/min, and the product is ground again for further catalytic tests and characterizations. Note that, contrary to the commonly used version of the Pechini method, here, no glycol is added. The preparation of the other Ru_x catalysts follows the same procedure but adjusting the molar ratio of the ruthenium and titanium precursors.
Hydrogen insertion experiments are performed as follows: 50 mg of fresh Ru_x powder material is treated at various temperatures under 4 vol% H2/N2 for 3 h, the total flow rate being set to 50 sccm/min. After hydrogen treatment, the catalyst is cooled down to room temperature under the same atmosphere. The obtained catalyst is referred to as Ru_x_yR, where x represents the nominal molar percentage of ruthenium, y represents the reduction temperature. The re-oxidation experiment follows the same procedure while the gas atmosphere is changed to dry air. The catalyst is now denoted as Ru_x_yR_zO, where z stands for the re-oxidation temperature. For comparison, a blank experiment is also conducted by calcining the Ru_x under pure N2 and the catalyst is referred to as Ru_x_yN.

4.3. Catalysts Characterization

Powder XRD patterns are recorded on a Panalytical Empyrean diffractometer (Malvern, UK) equipped with a Cu Kα radiation (40 kV, 40 mA). The correction of the 2θ shift that may originate from different positions of the sample holder is assisted by mixing LaB6 standard powder (NIST) with all the catalysts before measurement. The Scherrer equation is applied to calculate the crystallite size.
Kr physisorption experiments are performed at T = 77 K with an Autosorb 6 instrument (Quantachrome, Ostfildern, Germany), all the catalysts are pre-treated in vacuum for 12 h at 100 °C. The specific surface area is calculated by the BET method. Note that we deliberately used Kr, instead of nitrogen or argon, because the materials we anticipated to exhibit small surface areas, and Kr has a higher sensitivity in this respect.
Scanning transmission electron microscopy (STEM) micrographs are recorded on a ThermoFisher Talos F200X electron microscope (Waltham, MA, USA). SEM images are obtained on a Gemini SEM 560 instrument (Carl Zeiss MicroImaging GmbH, Göttingen, Germany). The average composition of the catalyst is quantified by energy dispersive X-ray spectroscopy (EDS).
XPS spectra are acquired on a PHI VersaProbe II instrument (Feldkirchen, Germany) equipped with a monochromatized Al-Kα line, the photon energy is 1486.6 eV. XPS spectrum data analysis is performed by using a CasaXPS software (Version 2.3.17), and the standard Carbon 1s (at 284.8 eV) is used to re-determine all the binding energy. After calcination, the Ru_x samples do not show any residual chlorine in the XP overview spectra.
A TG-MS experiment is conducted on a STA 409PC thermoscale (Netzsch, Selb, Germany) analyzer coupled with a QMG421 quadrupole mass spectrometer (MS) from Balzers (Balzers, Liechtenstein) with an ionization energy of 70 eV. The catalyst is heated under dry air (30 sccm/min) from 25 to 500 °C, while the heating rate is 10 °C/min. The detailed procedure for calculating the amount of inserted hydrogen is as follows: dry air is applied (30 mL/min) during the TG-MS experiment. Since the flow rate/MS signal of N2 is constant in air (78.1%), we can use the concentration of N2 as reference to obtain the flow rate of H2O (gaseous) by dividing the MS signal of H2O by N2. After having the ratio of H2O/N2, the total H2O volume is determined by integration, from which the molar amount of produced H2O and hence the molar amount of inserted hydrogen are derived; note the sample storage conditions of Ru_x_250R and Ru_x_250N are identical to guarantee accurate data processing.

4.4. Catalytic Tests

The catalytic performance of propane oxidation on the mixed Ru–Ti oxide catalysts is evaluated in a home-made quartz reactor (inner diameter = 6 mm). The feed gas contains 1 vol.% C3H8 (purity: 3.5), 5 vol.% O2 (purity: 4.8) and 94 vol.% N2 (purity: 4.8) and is admitted to reactor with a total mass flow rate of 100 cm3 STP min−1 (sccm). During catalytic measurement, the temperature of a mixture consisting of 20 mg of catalyst and 40 mg of quartz sand is programmed from 25 °C to 250 °C with a heating rate of 1 °C/min. The corresponding weight hourly space velocity is 345000 mL·g−1·h−1. For product analysis, a nondispersive infrared sensor is coupled downstream to detect the volumetric concentration of CO/CO2 and C3H8. The conversion of propane (%) is determined based on the following equation:
X C 3 H 8 = c ( CO 2 ) c max ( CO 2 )   ×   100 %
where c(CO2) is the real-time concentration of CO2 in the outlet gas and cmax(CO2) is the steady-state concentration of CO2 when full conversion is achieved. Propane conversion calculated by the change of the propane concentration is simultaneously conducted to countercheck data accuracy. During the whole temperature range, there is no CO detected and the concentration of CO2 at full conversion state is virtually three times the inlet propane concentration, thus evidencing that the carbon mass is balanced and no other byproduct is formed. Finally, we use space time yield ( mol ( CO 2 ) · kg ( Cat ) 1 · h 1 , molar amount of CO2 per kilogram catalyst and hour, STY) to quantify the activity of the catalyst in total propane oxidation reaction.

5. Conclusions

A rational synthesis approach is introduced to favor hydrogen incorporation in the oxide lattice by mixing a reducible oxide with a less reducible oxide, as exemplified with the solid solution of RuO2 and rutile TiO2. Neither RuO2 nor rutile-TiO2 is able to incorporate hydrogen into the lattice just by hydrogen exposure at elevated temperatures: rutile-TiO2 is not affected at all, while Ru_100 is fully reduced to metallic ruthenium. We show that mixed RuxTi1−xO2 is stable against H2 exposure at 250 °C for compositions 0.2 < x < 0.8 and hydrogen can be incorporated into the lattice. Hydrogen incorporation in mixed oxide RuxTi1−xO2 reveals a synergy effect in that Ru enables the activation of H2, while Ti stabilizes the oxidation state of Ru (Ru4+) against reduction to metallic Ru.
Hydrogen insertion into the rutile lattice of RuxTi1−xO2 is accompanied by a change of the lattice constants (XRD) and increased micro-strain. Hydrogen insertion affects directly or indirectly via macro- and micro-strain the electronic structure of RuxTi1−xO2 that in turn is expected to be responsible for the improved catalytic activity, not only for oxidation catalysis as exemplified with the propane oxidation, but may be equally beneficial for the selective hydrogenation and oxidation of other organic compounds. For propane combustion, we show that the activity of Ru_x is significantly increased by H2 exposure at 250 °C. The optimum catalyst is identified with Ru_60_250R, whose activity is substantially higher than that of Ru_100.
Hydrogen treatment can also be conducted in situ by H2 exposure during temperature ramping and switching to the reaction mixture when the reaction temperature is reached, thus providing an additional parameter to tune the catalytic performance of a mixed oxide catalyst in the reactor. This approach is of general interest in catalysis research and inorganic chemistry to fine-tune properties of (mixed) oxides and may therefore open exciting perspectives for tuning the catalytic activity of mixed oxide catalysts, not only in thermal catalysis but also in electrocatalysis of acidic water splitting at the anode side.

Supplementary Materials

The following supporting information can be downloaded at: https://www.mdpi.com/article/10.3390/inorganics11080330/s1, Figure S1: Decomposition of the (110) and (101) reflection of Ru_x; Figure S2: Peak shift of rutile (110) and (101); Figure S3: Calculated cell volumes of the mixed oxide RuxTi1−xO2 phase; Table S1: Calculation of grain size and micro-strain of Ru–Ti mixed oxide catalysts by the Williamson−Hall method; Figure S4: Calculated crystallite size of RuO2 phase and Ru–Ti solid solution phase; Figure S5: Williamson−Hall plot of RuO2 phase and Ru–Ti solid solution phase as exemplified by Ru_60 sample; Table S2: Optimized fitting parameters for the XPS data deconvolution; Figure S6: Ru 3d XP spectra of Ru_x catalysts; Figure S7: O 1s spectra of Ru_x catalysts; Figure S8: Ru3p and Ti2p spectra of Ru_x catalysts; Figure S9: SEM micrographs for the various Ru_x samples; Figure S10: XRD patterns of Ru_x_250R samples re-oxidized at 300 °C; Figure S11: H2O signal from TG-MS analysis; Figure S12: The calculated amount of incorporated hydrogen when varying the composition x of Ru_x; Figure S13: HAADF-STEM images/element mapping of Ru_60 sample; Figure S14: Ti 2p XP spectra of Ru_60 sample; Figure S15: O 1s XP spectra of Ru_60sample; Figure S16: Light-off curves of catalytic propane combustion; Figure S17: STY as a function of reaction time over Ru_60_400R at 150 °C.

Author Contributions

Conceptualization, methodology, writing—original draft, W.W.; data curation, investigation, Y.W.; methodology, P.T. and A.S.-L.; investigation, T.W. and L.G.; supervision, resources, Y.G. and B.M.S.; conceptualization, supervision, writing—review and editing, H.O. All authors have read and agreed to the published version of the manuscript.

Funding

This project was supported financially by National Key Research and Development Program of China (2022YFB3504200), the National Natural Science Foundation of China (U21A20326, 21976057, 21922602 and 21673072), the fund of the National Engineering Laboratory for Mobile Source Emission Control Technology (NELMS2020A05) and the Fundamental Research Funds for the Central Universities.

Data Availability Statement

Not applicable.

Acknowledgments

W.W. gratefully acknowledges the China Scholarship Council for the Joint-Ph.D. program between the China Scholarship Council and the Institute of Physical Chemistry of the Justus-Liebig-University Giessen. We acknowledge support from the Center for Materials Research at the JLU. H.O. and L.G. acknowledge funding by the German Research Foundation (DFG, Deutsche Forschungsgemeinschaft—493681475).

Conflicts of Interest

The authors declare that they have no known competing financial interests or personal relationships that could have appeared to influence the work reported in this paper.

References

  1. Mavrikakis, M.; Hammer, B.; Nørskov, J.K. Effect of Strain on the Reactivity of Metal Surfaces. Phys. Rev. Lett. 1998, 81, 2819–2822. [Google Scholar] [CrossRef] [Green Version]
  2. Hammer, B.; Nørskov, J.K. Chemisorption and Reactivity on Supported Clusters and Thin Films; Kluwer Academic: Dordrecht, The Netherlands, 1997; pp. 285–351. [Google Scholar]
  3. Buvat, G.; Eslamibidgoli, M.J.; Youssef, A.H.; Garbarino, S.; Ruediger, A.; Eikerling, M.; Guay, D. Effect of IrO6 Octahedron Distortion on the OER Activity at (100) IrO2 Thin Film. ACS Catal. 2020, 10, 806–817. [Google Scholar] [CrossRef]
  4. Wang, H.; Xu, S.; Tsai, C.; Li, Y.; Liu, C.; Zhao, J.; Liu, Y.; Yuan, H.; Abild-Pedersen, F.; Prinz, F.B.; et al. Direct and Continuous Strain Control of Catalysts with Tunable Battery Electrode Materials. Science 2016, 354, 1031–1036. [Google Scholar] [CrossRef]
  5. Strasser, P.; Kühl, S. Dealloyed Pt-based Core-shell Oxygen Reduction Electrocatalysts. Nano Energy 2016, 29, 166–177. [Google Scholar] [CrossRef] [Green Version]
  6. Gawande, M.B.; Goswami, A.; Asefa, T.; Guo, H.; Biradar, A.V.; Peng, D.-L.; Zboril, R.; Varma, R.S. Core-shell Nanoparticles: Synthesis and Applications in Catalysis and Electrocatalysis. Chem. Soc. Rev. 2015, 44, 7540–7590. [Google Scholar] [CrossRef] [PubMed]
  7. Zhang, S.; Zhang, X.; Jiang, G.; Zhu, H.; Guo, S.; Su, D.; Lu, G.; Sun, S. Tuning Nanoparticle Structure and Surface Strain for Catalysis Optimization. J. Am. Chem. Soc. 2014, 136, 7734–7739. [Google Scholar] [CrossRef] [Green Version]
  8. Kibler, L.A.; El-Aziz, A.M.; Hoyer, R.; Kolb, D.M. Tuning Reaction Rates by Lateral Strain in a Palladium Monolayer. Angew. Chem. Int. Ed. 2005, 44, 2080–2084. [Google Scholar] [CrossRef] [PubMed]
  9. Strasser, P.; Koh, S.; Anniyev, T.; Greeley, J.; More, K.; Yu, C.; Liu, Z.; Kaya, S.; Nordlund, D.; Ogasawara, H.; et al. Lattice-strain Control of the Activity in Dealloyed Core-shell Fuel Cell Catalysts. Nat. Chem. 2010, 2, 454–460. [Google Scholar] [CrossRef]
  10. Xia, Z.; Guo, S. Strain Engineering of Metal-based Nanomaterials for Energy Electrocatalysis. Chem. Soc. Rev. 2019, 48, 3265–3278. [Google Scholar] [CrossRef]
  11. Wang, L.; Zeng, Z.; Gao, W.; Maxson, T.; Raciti, D.; Giroux, M.; Pan, X.; Wang, C.; Greeley, J. Tunable Intrinsic Strain in Two-dimensional Transition Metal Electrocatalysts. Science 2019, 363, 870–874. [Google Scholar] [CrossRef]
  12. You, B.; Tang, M.T.; Tsai, C.; Abild-Pedersen, F.; Zheng, X.; Li, H. Enhancing Electrocatalytic Water Splitting by Strain Engineering. Adv. Mater. 2019, 31, 1807001. [Google Scholar] [CrossRef] [PubMed]
  13. Alayoglu, S.; Nilekar, A.U.; Mavrikakis, M.; Eichhorn, B. Ru-Pt Core-shell Nanoparticles for Preferential Oxidation of Carbon Monoxide in Hydrogen. Nat. Mater. 2008, 7, 333–338. [Google Scholar] [CrossRef] [PubMed]
  14. Schlapka, A.; Lischka, M.; Groß, A.; Käsberger, U.; Jakob, P. Surface Strain versus Substrate Interaction in Heteroepitaxial Metal Layers: Pt on Ru(0001). Phys. Rev. Lett. 2003, 91, 016101. [Google Scholar] [CrossRef] [Green Version]
  15. Teschner, D.; Borsodi, J.; Wootsch, A.; Révay, Z.; Hävecker, M.; Knop-Gericke, A.; Jackson, S.D.; Schlögl, R. The Roles of Subsurface Carbon and Hydrogen in Palladium-Catalyzed Alkyne Hydrogenation. Science 2008, 320, 86–89. [Google Scholar] [CrossRef] [PubMed]
  16. Wilde, M.; Fukutani, K.; Ludwig, W.; Brandt, B.; Fischer, J.-H.; Schauermann, S.; Freund, H.-J. Influence of Carbon Deposition on the Hydrogen Distribution in Pd Nanoparticles and Their Reactivity in Olefin Hydrogenation. Angew. Chem. Int. Ed. 2008, 47, 9289–9293. [Google Scholar] [CrossRef] [PubMed]
  17. Copéret, C.; Estes, D.P.; Larmier, K.; Searles, K. Isolated Surface Hydrides: Formation, Structure, and Reactivity. Chem. Rev. 2016, 116, 8463–8505. [Google Scholar] [CrossRef]
  18. Wu, Z.; Cheng, Y.; Tao, F.; Daemen, L.; Foo, G.S.; Nguyen, L.; Zhang, X.; Beste, A.; Ramirez-Cuesta, A.J. Direct Neutron Spectroscopy Observation of Cerium Hydride Species on a Cerium Oxide Catalyst. J. Am. Chem. Soc. 2017, 139, 9721–9727. [Google Scholar] [CrossRef]
  19. Werner, K.; Weng, X.; Calaza, F.; Sterrer, M.; Kropp, T.; Paier, J.; Sauer, J.; Wilde, M.; Fukutani, K.; Shaikhutdinov, S.; et al. Toward an Understanding of Selective Alkyne Hydrogenation on Ceria: On the Impact of O Vacancies on H2 Interaction with CeO2(111). J. Am. Chem. Soc. 2017, 139, 17608–17616. [Google Scholar] [CrossRef]
  20. Cao, T.; You, R.; Zhang, X.; Chen, S.; Li, D.; Zhang, Z.; Huang, W. An in situ DRIFTS Mechanistic Study of CeO2-catalyzed Acetylene Semihydrogenation Reaction. Phys. Chem. Chem. Phys. 2018, 20, 9659–9670. [Google Scholar] [CrossRef]
  21. Cheng, H.; Wen, M.; Ma, X.; Kuwahara, Y.; Mori, K.; Dai, Y.; Huang, B.; Yamashita, H. Hydrogen Doped Metal Oxide Semiconductors with Exceptional and Tunable Localized Surface Plasmon Resonances. J. Am. Chem. Soc. 2016, 138, 9316–9324. [Google Scholar] [CrossRef]
  22. Li, Z.; Werner, K.; Qian, K.; You, R.; Płucienik, A.; Jia, A.; Wu, L.; Zhang, L.; Pan, H.; Kuhlenbeck, H.; et al. Oxidation of Reduced Ceria by Incorporation of Hydrogen. Angew. Chem. Int. Ed. 2019, 58, 14686–14693. [Google Scholar] [CrossRef] [Green Version]
  23. Vilé, G.; Bridier, B.; Wichert, J.; Pérez-Ramírez, J. Ceria in Hydrogenation Catalysis: High Selectivity in the Conversion of Alkynes to Olefins. Angew. Chem. Int. Ed. 2012, 51, 8620–8623. [Google Scholar] [CrossRef]
  24. Vilé, G.; Colussi, S.; Krumeich, F.; Trovarelli, A.; Pérez-Ramírez, J. Opposite Face Sensitivity of CeO2 in Hydrogenation and Oxidation Catalysis. Angew. Chem. Int. Ed. 2014, 53, 12069–12072. [Google Scholar] [CrossRef]
  25. Carrasco, J.; Vilé, G.; Fernández-Torre, D.; Pérez, J.; Pérez-Ramírez, R.; Ganduglia-Pirovano, M.V. Molecular-Level Understanding of CeO2 as a Catalyst for Partial Alkyne Hydrogenation. J. Phys. Chem. C 2014, 118, 5352–5360. [Google Scholar] [CrossRef] [Green Version]
  26. Wang, W.; Timmer, P.; Luciano, A.S.; Wang, Y.; Weber, T.; Glatthaar, L.; Guo, Y.; Smarsly, B.M.; Over, H. Inserted Hydrogen Promotes Oxidation Catalysis of Mixed Ru0.3Ti0.7O2 as Exemplified with Total Propane Oxidation and the HCl Oxidation Reaction. Catal. Sci. Technol. 2023, 13, 1395–1408. [Google Scholar] [CrossRef]
  27. Colomer, M.T.; Jurado, J.R. Structural, Microstructural, and Electrical Transport Properties of TiO2-RuO2 Ceramic Materials Obtained by Polymeric Sol-Gel Route. Chem. Mater. 2000, 12, 923–930. [Google Scholar] [CrossRef]
  28. Wang, X.; Shao, Y.; Liu, X.; Tang, D.; Wu, B.; Tang, Z.; Wang, X.; Lin, W. Phase Stability and Phase Structure of Ru–Ti–O Complex Oxide Electrocatalyst. J. Am. Ceram. Soc. 2015, 98, 1915–1924. [Google Scholar] [CrossRef]
  29. Ashcroft, N.; Denton, A. Vegard’s Law. Phys. Rev. A 1991, 43, 3161–3164. [Google Scholar]
  30. Özkan, E.; Cop, P.; Benfer, F.; Hofmann, A.; Votsmeier, M.; Guerra, J.M.; Giar, M.; Heiliger, C.; Over, H.; Smarsly, B.M. Rational Synthesis Concept for Cerium Oxide Nanoparticles: On the Impact of Particle Size on the Oxygen Storage Capacity. J. Phys. Chem. C 2020, 124, 8736–8748. [Google Scholar] [CrossRef]
  31. Sivakami, R.; Dhanuskodi, S.; Karvembu, R. Estimation of Lattice Strain in Nanocrystalline RuO2 by Williamson-Hall and Size-strain Plot Methods. Spectrochim. Acta A Mol. Biomol. Spectrosc. 2016, 152, 43–50. [Google Scholar] [CrossRef]
  32. Over, H.; Muhler, M. Catalytic CO Oxidation over Ruthenium—Bridging the Pressure Gap. Prog. Surf. Sci. 2003, 72, 3–17. [Google Scholar] [CrossRef]
  33. Over, H.; Seitsonen, A.P.; Lundgren, E.; Smedh, M.; Andersen, J.N. On the Origin of the Ru-3d5/2 Satellite Feature from RuO2(110). Surf. Sci. 2002, 504, L196–L200. [Google Scholar] [CrossRef]
  34. Khalid, O.; Weber, T.; Drazic, G.; Djerdj, I.; Over, H. Mixed RuxIr1-xO2 Oxide Catalyst with Well-Defined and Varying Composition Applied to CO Oxidation. J. Phys. Chem. C 2020, 124, 18670–18683. [Google Scholar] [CrossRef]
  35. Assmann, J.; Narkhede, V.; Khodeir, L.; Löffler, E.; Hinrichsen, O.; Birkner, A.; Over, H.; Muhler, M. On the Nature of the Active State of Supported Ruthenium Catalysts Used for the Oxidation of Carbon Monoxide: Steady-state and Transient Kinetics Combined with in Situ Infrared Spectroscopy. J. Phys. Chem. B 2004, 108, 14634–14642. [Google Scholar] [CrossRef]
  36. Wang, Z.; Khalid, O.; Wang, W.; Wang, Y.; Weber, T.; Luciano, A.S.; Zhan, W.; Smarsly, B.M.; Over, H. Comparison Study of the Effect of CeO2-based Carrier Materials on the Total Oxidation of CO, Methane, and Propane over RuO2. Catal. Sci. Technol. 2021, 11, 6839–6853. [Google Scholar] [CrossRef]
  37. Walsh, F.; Wills, R. The Continuing Development of Magnéli Phase Titanium Sub-Oxides and Ebonex® Electrodes. Electrochim. Acta 2010, 55, 6342–6351. [Google Scholar] [CrossRef]
  38. Malik, H.; Sarkar, S.; Mohanty, S.; Carlson, K. Modeling and Synthesis of Magneli Phases in Ordered Titanium Oxide Nanotubes with Preserved Morphology. Sci. Rep. 2020, 10, 8050. [Google Scholar] [CrossRef]
  39. Wang, Z.; Huang, Z.; Brosnahan, J.T.; Zhang, S.; Guo, Y.; Guo, Y.; Wang, L.; Wang, Y.; Zhan, W. Ru/CeO2 Catalyst with Optimized CeO2 Support Morphology and Surface Facets for Propane Combustion. Environ. Sci. Technol. 2019, 53, 5349–5358. [Google Scholar] [CrossRef]
  40. Wu, J.; Chen, B.; Yan, J.; Zheng, X.; Wang, X.; Deng, W.; Dai, Q. Ultra-active Ru Supported on CeO2 Nanosheets for Catalytic Combustion of Propane: Experimental Insights into Interfacial Active Sites. J. Chem. Eng. 2022, 438, 135501. [Google Scholar] [CrossRef]
Figure 1. (a) X-ray diffraction (XRD) patterns of the ruthenium−titanium mixed oxide catalysts Ru_x; the composition x of Ru ranges from 20 mol% to 100 mol%. Dashed lines indicate the position of pure rutile-TiO2 and RuO2. (b) XRD patterns of Ru_x_250R catalysts treated in 4 vol% H2/N2 at 250 °C for various compositions x ranging from 20% to 100%.
Inorganics 11 00330 g001
Figure 2. Lattice parameters of rutile Ti1−xRuxO2 solid solution as a function of the nominal composition x given in mol%, as derived from the peak deconvolution of rutile (110) and rutile (101).
Inorganics 11 00330 g002
Figure 3. Shift of binding energies of (a) Ru 3d satellite features. (b) Ru 3p satellite features derived from peak deconvolution of XPS data when varying the composition x of Ru_x.
Inorganics 11 00330 g003
Figure 4. Peak deconvolution of H2O signal (m/z = 18) of Ru_60_250R and Ru_60_250N from TG-MS analysis.
Inorganics 11 00330 g004
Figure 5. XP spectra of Ru_60 (a) in comparison with hydrogen treated sample at 250 °C. (b) Ru_60_250R and re-oxidized sample at 300 °C. (c) Ru_60_250R_300O. Using the CasaXPS software, the Ru3d spectra are decomposed into five components: Ru4+ (red), satellite Ru4+ (blue), metallic Ru (green) and two C1s species.
Inorganics 11 00330 g005
Figure 6. XRD patterns of Ru_60_250R mildly re-oxidized at various temperatures in air. For comparison, Ru_60 and Ru_60_250R are also included.
Inorganics 11 00330 g006
Figure 7. Selection of full conversion curves of catalytic propane combustion over Ru_x and Ru_x_250R (x = 100%, 60% and 20%) as a function of reaction temperature, when cycling the reaction temperature from 30 °C to 250 °C. The full set of conversion curves can be found in Figure S16.
Inorganics 11 00330 g007
Figure 8. STY as a function of reaction time on catalytic propane oxidation over Ru_60_250R when cycling the reaction temperature from 30 °C to 150 °C (blue dotted line). The gray background represents total C3H8 oxidation conditions: 1 vol% C3H8, 5 vol% O2, balanced by N2; total volume flow: 100 sccm/min, temperature ramp: 1 K/min. The green background represents the gas mixture during heating and cooling stage: 4% H2/Ar, total volume flow: 50 sccm/min. When reaching 150 °C, the gas composition is switched to the reaction mixture (gray background).
Inorganics 11 00330 g008
Figure 9. Illustration of the citric acid assisted sol-gel method to prepare mixed oxides of RuO2 and TiO2 with varying concentration x of Ru: Ru_x.
Inorganics 11 00330 g009
Table 1. XRD derived data of Ru–Ti mixed oxide catalysts.
CatalystsCell Parameter a/b (nm) aCell Parameter c (nm) bGrain Size (RuO2) (nm) cGrain Size (Ru–Ti) (nm) cRu–Ti/(RuO2 + Ru–Ti) (%) d
Ru_1004.5003.10718 ± 0.5-0
Ru_904.5093.09427 ± 125 ± 281.2
Ru_804.5193.08232 ± 0.515 ± 0.389.9
Ru_704.5283.06833 ± 112 ± 0.290.9
Ru_604.5383.05336± 110 ± 0.593.7
Ru_504.5483.03546 ± 89 ± 0.596.4
Ru_404.5583.02245 ± 610 ± 0.588.8
Ru_304.5723.00643 ± 512 ± 281.9
Ru_204.5912.97728 ± 616 ± 192.5
a: Calculated by rutile (110) reflection of the Ru–Ti solid solution phase. b: Calculated based on obtained a/b value and rutile (101)/(101) reflections of the Ru–Ti solid solution phase. c: Determined by Scherrer equation from the (110)/(101) reflections of the RuO2 phase after peak deconvolution. d: Determined by peak deconvolution of the (110)/(101) reflections.
Table 2. Compositional information from the surface and bulk region of ruthenium−titanium mixed oxide catalysts.
CatalystsSBET (m2/g)Ru/(Ti + Ru)(mol%) aRu/(Ti + Ru)(mol%) b(OH + Oxygenated Carbon)/O 1s Total b
Ru_100910010039.90
Ru_90689.370.6514.67
Ru_801078.859.815.42
Ru_701468.160.534.85
Ru_601956.754.44.42
Ru_502646.847.742.50
Ru_403240.937.964.69
Ru_303130.029.083.38
Ru_203417.417.614.11
Ru_60_250R1956.252.124.43
a: Calculated from SEM-EDS mapping. b: Calculated from XPS.
Disclaimer/Publisher’s Note: The statements, opinions and data contained in all publications are solely those of the individual author(s) and contributor(s) and not of MDPI and/or the editor(s). MDPI and/or the editor(s) disclaim responsibility for any injury to people or property resulting from any ideas, methods, instructions or products referred to in the content.

