Article

The Mechanical Properties of Geopolymers from Different Raw Materials and the Effect of Recycled Gypsum

1
Department of Chemistry, University of Eastern Finland, P.O. Box 111, Fi-80101 Joensuu, Finland
2
Apila Group Oy Ab, Hietalantie 7A, Fi-80710 Lehmo, Finland
*
Author to whom correspondence should be addressed.
Inorganics 2023, 11(7), 298; https://doi.org/10.3390/inorganics11070298
Submission received: 23 May 2023 / Revised: 30 June 2023 / Accepted: 3 July 2023 / Published: 14 July 2023
(This article belongs to the Special Issue 10th Anniversary of Inorganics: Inorganic Materials)

Abstract

:
Geopolymers are amorphous inorganic polymers that are mainly used in the construction industry as an environmentally friendly alternative to ordinary cement. This study compared selected mechanical properties (setting time, shrinkage, strength) of geopolymer specimens made from different main raw materials, mainly at room temperature, and investigated the effects of recycled gypsum on these. A structural analysis of the specimens was conducted with XRD and SEM. Also, the leaching of aluminium, silicon, and calcium from the specimens was investigated. According to this study, raw materials have a significant impact on the properties of geopolymers. Recycled gypsum affected the setting time of the geopolymers, but the effect was not the same for all specimens. It increased the setting time of specimens made from calcium-rich raw materials, for example, and the ground-granulated blast furnace slag specimens hardened as fast as ordinary Portland cement (about 300 min), but the addition of gypsum decreased it to 1300 min. Gypsum-containing specimens, based on Ca-deficient metakaolin or fly ash, hardened even faster than OPC, in 100–150 min. Recycled gypsum significantly reduced the plastic shrinkage of most of the 28 d specimens to lower values than those achieved for OPC (0.07%). The only exceptions were the fly-ash-based specimens. However, gypsum had no effect on the drying shrinkage, which accounted for a larger proportion of the total shrinkage in most specimens. Therefore, it had no significant effect on the total shrinkage of the geopolymer specimens. The reducing effect of gypsum on the plastic shrinkage of geopolymers was attributed to ettringite, which was observed in all gypsum-containing specimens analysed with XRD. In this study, recycled gypsum decreased the compressive strength of the specimens, which could be prevented by using a finer gypsum powder.

Graphical Abstract

1. Introduction

Geopolymers are amorphous inorganic polymers with a network-like structure composed of tetrahedral (AlO4) and (SiO4) units [1,2,3,4,5,6]. They are prepared via a geopolymerization reaction between aluminosilicate-rich main raw material and an alkaline activator [1,2,3,4,7]. The main raw materials are mainly derived from industrial side streams [5,8]. The most used alkaline activators are NaOH and a mixture of NaOH and Na2SiO3, but sometimes KOH is also used [1,2,3,7]. Currently, geopolymers are mainly utilized in the construction industry to replace ordinary cement, which is the most used construction material [9]. Ordinary cement is durable, relatively cheap, and has good strength properties, but its production causes 5–7% of all CO2 emissions [2,10,11]. Geopolymers have similar mechanical properties to cement but can be produced in a more environmentally friendly manner and from industrial side streams, making them an attractive alternative to ordinary cement [8,12,13].
The structure and properties of geopolymers vary depending on their raw materials and raw material ratios [14,15], and they can be tailored according to the intended use [16]. In general, geopolymers have excellent strength properties and they tolerate heat, sulphates, and acidic environments better than ordinary cement [14,17,18,19].
The setting time of geopolymers is more difficult to adjust than that of ordinary cement. It is affected by the chemical composition and particle size of solid raw materials, the water-to-solid ratio (w/s), the type and concentration of the alkaline activator, and the curing conditions [20], as well as the addition of accelerators and retarders [21]. Increasing the w/s ratio prolongs the setting time, which has also been observed with ordinary cement [22,23]. Instead, increasing the concentration of alkaline activator often accelerates the setting [20,23]. The curing temperature of geopolymers is usually 20–100 °C [22]. Raising the temperature accelerates curing, but also causes evaporation, which can result in greater shrinkage and cracking [20,24]. Gypsum (CaSO4·nH2O) is a well-known retarder of calcium-rich geopolymers. Dissolved calcium from gypsum prevents the dissolution reaction of aluminium and silicon, which is essential to a geopolymerization reaction. The dissolution reaction begins when calcium turns into an insoluble compound [21].
One of the main challenges with geopolymers is their strong tendency to shrink, which causes cracks and thus material fragility [13,25,26]. Shrinkage can be affected by the raw materials used and the type and concentration of the alkaline activator. Furthermore, the w/s ratio and curing conditions have been found to have an effect on shrinkage [14,25]. This can be reduced by adding shrinkage-reducing agents (SRAs) or fillers, most commonly aggregates. Most SRAs are commercially available patented surfactants, which remove the surface tension of water in the pores of a material and thus reduce the pressure generated during drying [27,28]. Gypsum also seems to reduce shrinkage. This effect derives from its tendency to form expanding ettringite crystals (aluminium trisulfate) with aluminium [29,30]. The volume of ettringite crystals is much larger than that of its precursors, which prevents the material from shrinking [21,31]. However, ettringite is not a stable compound and decomposes to aluminium monosulfate over time [30].
Several studies have been conducted on the factors influencing the strength properties of geopolymers [8,17,23,32,33,34,35,36,37,38]. The compressive strength of geopolymers is often high and develops even faster than that of ordinary cement [8,17]. As with cement, the flexural strength of geopolymers is relatively weak [27,39]. In general, blast furnace slag increases the strength properties of geopolymers. Therefore, they are often added to other raw materials when high compressive strength is required [8,32]. Among the alkaline activators, NaOH produces stronger geopolymers than KOH. The main raw materials and their chemical composition affect the optimal concentration of NaOH [17,23,35,40]. However, in many studies, the highest compressive strengths were achieved with 14 M NaOH [17,35,37,40]. Increasing the w/s ratio weakens the strength properties, which has also been observed with ordinary cement [17,23]. The highest compressive strength was achieved with a SiO2/Al2O3 ratio of 3.5–4.5 [41,42]. In small amounts, ettringite can make a material stronger because its expanding crystals fill the small pores of a material. However, in larger amounts, it can cause the material to crack and therefore also become brittle [21,43].
In recent years, geopolymers have been a topic of intensive research because of their potential to replace cement in construction. The effect of additives and fillers on shrinking, hardening, final strengths, and other properties of geopolymers has still not been sufficiently elucidated, even though much developmental work has been conducted [44,45]. Therefore, there is good reason to continue basic research on materials in order to achieve their practical applications.
The construction industry produces a lot of demolition waste, such as waste gypsum. The plasterboard industry is not capable of using only recycled gypsum [46]. In addition to gypsum, other waste materials are present in demolition waste, which hampers the recycling of these materials back into plaster sheets. On the other hand, the other residues of gypsum do not have a very large impact on the properties of geopolymers. The availability of side stream gypsum is good and its use, instead, of virgin gypsum would bring significant benefit to geopolymer production. In recent years, rational environmental management and synthesis of green materials has been directed towards the development of geopolymer-based materials with various bio-based and industrial wastes and by-products. Among organic fillers, for example, palm fiber or ground walnut shells have been tested [44,47]. Inorganic additives, such as limestone [45], nanosilica [48], and gypsum-bearing wastes [49,50,51,52] are extensively studied. In addition, construction cementitious materials [53] or ceramic waste [54] have been used as fillers. The effect of different additives on structural, morphological, and mechanical properties have been evaluated to meet the desired technical requirements. Among these, workability, strength, resistance to climate conditions, and durability are important, for example, since they have influence on the applications [48]. Typically, these studies describe the preparation and properties of geopolymers based on a few starting materials. However, some general overviews on various precursors and their effect on material properties and potential applications are available [8,55].
In this study, the focus was on the use of recycled gypsum as an additive in geopolymers and alkali-activated materials. We compared the mechanical properties of geopolymers made from the most common and accessible side stream raw materials. In contrast to most of the previous studies, the samples examined were hardened mostly at room temperature, which is necessary to widen the applications of the materials [56,57]. Furthermore, the hardening of geopolymers at low temperatures contributes to achieving a lower carbon footprint.
We also wanted to clarify the effect of gypsum on the structures. Since the structure of geopolymers is amorphous, XRD is a great tool for finding and identifying the crystalline phases of the materials. SEM was used to support the structural analysis. The leaching of silicon, aluminium, and calcium from the materials was also studied, because there is little information available.

2. Results and Discussion
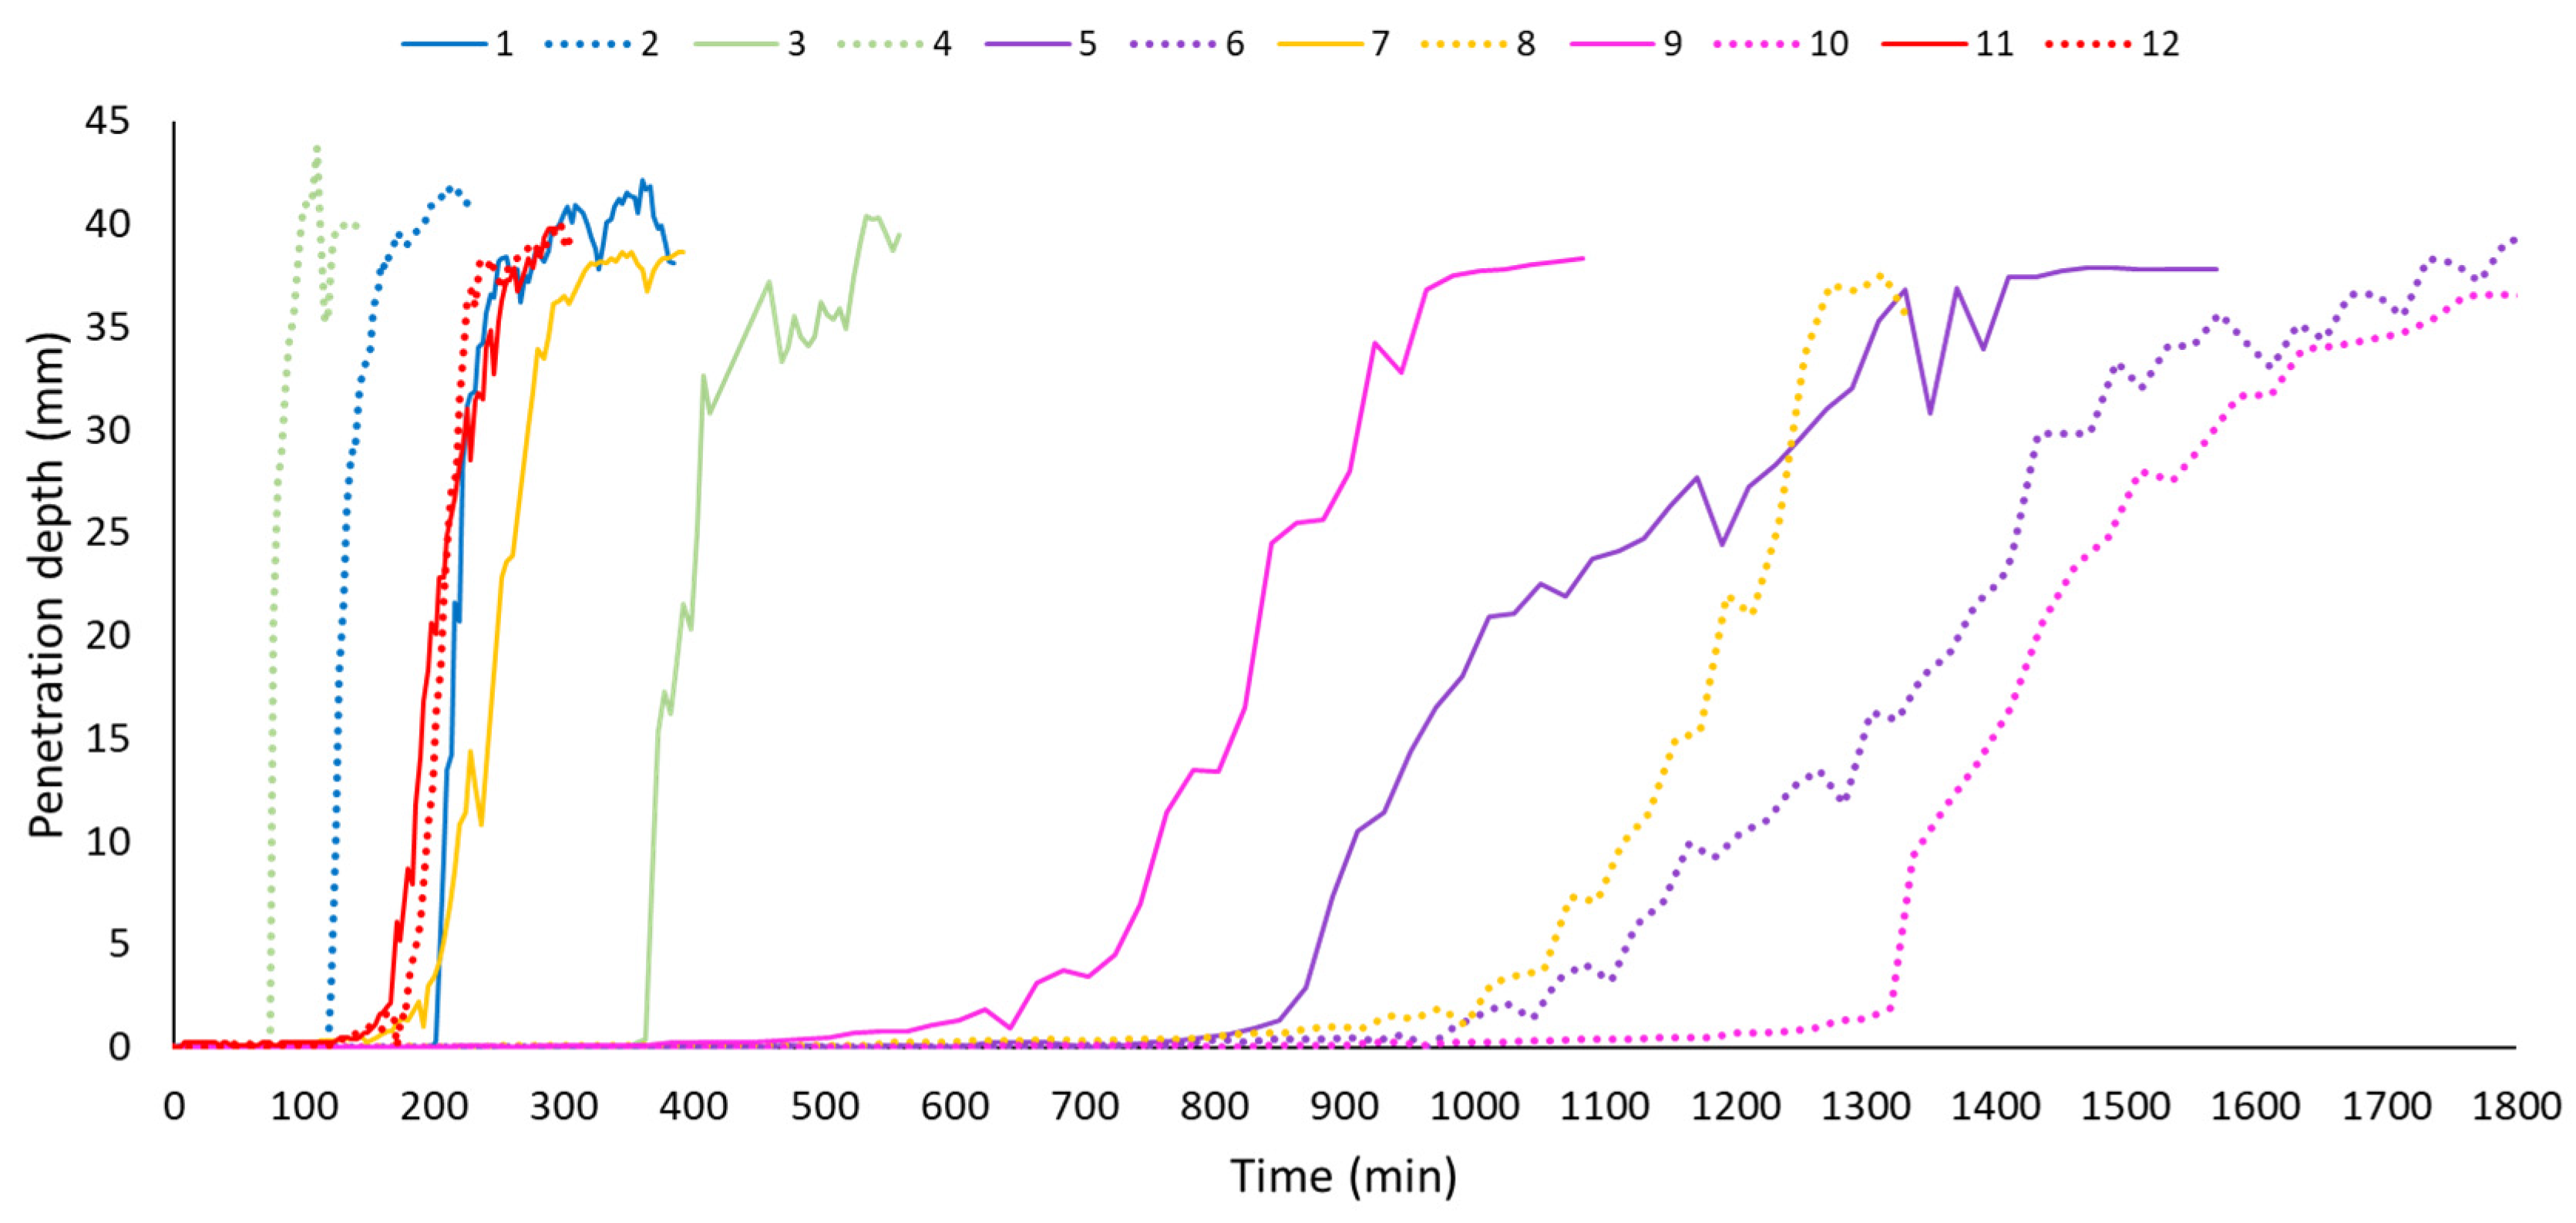
2.1. Setting Time

A series of specimens 113 from various starting materials were prepared in pairs, without gypsum (odd numbers) and with gypsum (even numbers). The preparation process is presented in Section 3.1 and Section 3.2. The detailed composition of the specimens is given in Materials and Methods, Table 1 and Table 2.
Figure 1 shows the setting times of the specimens. The main raw materials of the specimens had a significant effect on their setting times. Of the gypsum-free specimens, the metakaolin-based specimen (1) and the GGBS-based specimen (7) hardened as fast as OPC (11). The setting of the other gypsum-free specimens was slower than the OPC-based specimen. The recycled gypsum affected the setting time of the specimens, but the effect was not the same for all. The effect seemed to depend on the main raw materials of the specimens, especially their calcium content. Gypsum slowed down the setting of specimens made from calcium-rich raw materials (biomass ash and blast furnace slag), while it accelerated the setting of the other materials. Therefore, gypsum-containing specimens based on metakaolin (2) and fly ash (4) hardened even faster than OPC (11). Gypsum did not affect the setting time of OPC (cf. 11 and 12). The decreasing effect of gypsum on the setting time of calcium-rich geopolymers is due to the inhibition of the dissolution reaction of aluminium and silicon caused by calcium in gypsum. This was also observed in a previous study [21].

2.2. Shrinkage

2.2.1. Plastic Shrinkage

Plastic shrinkage, or autogenous shrinkage, i.e., early-stage shrinkage occurs when the mass is in a binding phase. Under sealed curing conditions it is a complicated and not fully understood consequence of the reorganization of matter and the interactions between capillary humidity and the cement/binder paste [58]. It may cause the formation of small cracks on the material [25,26]. The plastic shrinkage of the specimens (7 d and 28 d) is presented in Figure 2. Most of the plastic shrinkage occurred during the first week, after which it slowed down. In the 7 d measurement, the largest plastic shrinkage was measured for the gypsum-free specimens based on metakaolin (1), fly ash (3), GGBS and biomass ash (9), and GGBS (7), and the smallest shrinkage for the gypsum-containing specimens based on GGBS (8) and GGBS and biomass ash (10). Their shrinkage was even smaller than the OPC-based specimen (11). Other materials, whose shrinkage was smaller than the OPC, were the gypsum-free specimen based on fly ash and biomass ash (5), and the gypsum-containing specimens based on fly ash and biomass ash (6), metakaolin (2), and OPC (12). In the 28 d measurement, the largest shrinkage was measured for the gypsum-free specimens based on GGBS (7), fly ash (3), GGBS and biomass ash (9), and metakaolin (1). The plastic shrinkage smaller than that of the OPC (11) was achieved with the gypsum-free specimen based on fly ash and biomass ash (5), the gypsum-containing specimens based on fly ash and biomass ash (6), GGBS (8), GGBS and biomass ash (10), and metakaolin (2). Of these specimens, 5, 6, 8, and 10 were cured at 70 °C and their initial length was measured later than 1 d, which may affect the results. Unlike the other specimens, most of the plastic shrinkage of the aggregate-containing specimen (13) occurred after 7 d. Its plastic shrinkage was 0.04% (28 d), which is significantly smaller than the shrinkage of the same specimen without aggregates (1: 0.17%).
The effect of the recycled gypsum on the plastic shrinkage of the specimens (28 d) is shown in Figure 3. Gypsum did not affect the plastic shrinkage of the specimens whose shrinkage was already very small (cf. fly ash and biomass ash-based specimens 5 and 6) and it increased the plastic shrinkage of OPC (cf. 11 and 12). The plastic shrinkage of the other specimens was reduced by gypsum. The shrinkage of gypsum-free specimens (except 5) was higher than that of OPC (11). However, the shrinkage-reducing effect of gypsum was significant, so that plastic shrinkage of gypsum-containing specimens was even smaller than the shrinkage in OPC (except the fly-ash-based specimen 4). Based on previous studies, the shrinkage-reducing effect of gypsum is based on its tendency to form ettringite crystals with aluminium [29,30].

2.2.2. Drying Shrinkage

Drying shrinkage occurs when the mass dries because of water evaporation. It causes large cracks that extend through the material. Drying shrinkage is usually the most significant cause of shrinkage [25,27]. Figure 4 shows the drying shrinkage of the specimens and the effect of the recycled gypsum on it. The drying shrinkage of fly ash and biomass ash-based specimens 5 and 6 could not be measured because they were so fragile that there were no intact pieces left. The smallest drying shrinkage was measured for the GGBS-containing specimens (7, 8, 9, and 10). Their drying shrinkage was even smaller than the OPC-based specimen (11). The largest drying shrinkage was measured for fly-ash-based specimens (3 and 4). The recycled gypsum reduced the drying shrinkage of the GGBS-based specimen (cf. 7 and 8) and increased the drying shrinkage of the metakaolin-based specimen (cf. 1 and 2). Gypsum did not significantly affect the drying shrinkage of the other materials. The aggregates reduced drying shrinkage notably. The drying shrinkage of the specimen containing aggregates (13) was 0.07%, and the shrinkage of the same specimen without aggregates (1) was 0.17%.

2.2.3. Total Shrinkage

Figure 5 presents the total shrinkage of the specimens, and the proportions of plastic shrinkage and drying shrinkage. The smallest total shrinkage was measured for the gypsum-containing GGBS-based specimens (8 and 10). Their total shrinkages were even smaller than the OPC-based specimen (11). However, specimens 8 and 10 were cured at 70 °C and their initial length was measured later than the others, which may affect the results. The largest total shrinkage was measured for fly-ash-based specimens (3 and 4). The aggregates significantly reduced the shrinkage, which was expected based on a previous study [27]. The total shrinkage of aggregate-containing specimen (13: 0.10%) was significantly smaller than the shrinkage of the same specimen without aggregates (1: 0.35%).
For nearly all specimens, at least half of the total shrinkage was caused by drying shrinkage, which was expected based on previous studies [25,27]. Although gypsum reduced the plastic shrinkage of the specimens, it did not affect their drying shrinkage. Therefore, the recycled gypsum had no significant effect on the total shrinkage of most specimens. For instance, gypsum reduced the plastic shrinkage of the metakaolin specimen, but it increased its drying shrinkage. Therefore, the total shrinkage of metakaolin-based specimens (1 and 2) remained almost the same (0.29% and 0.35%). Gypsum seemed to reduce the total shrinkage of the GGBS-containing specimens (cf. 7, 8, 9, and 10), but the effect could also be a result of the curing conditions.
In addition to shrinkage measurements, the cracks caused by the plastic shrinkage and the drying shrinkage in the specimens were observed (Figure 6). Plastic shrinkage caused cracks in the gypsum-free specimens based on metakaolin (1), GGBS (7), and fly ash (3), as well as in the fly-ash-based specimen with gypsum (4). Drying shrinkage caused cracks in the gypsum-containing specimens based on metakaolin (2), GGBS (8), and GGBS and biomass ash (10). Although specimens 8 and 10 had the lowest total shrinkage, they still showed shrinkage cracks. Therefore, it is reasonable to assume that their small shrinkage is due to the curing conditions. There were no cracks in the gypsum-free specimens based on fly ash and biomass ash (5) and OPC (11), and the gypsum-containing specimens based on fly ash and biomass ash (6), GGBS and biomass ash (9), and OPC (12).

2.3. Strength

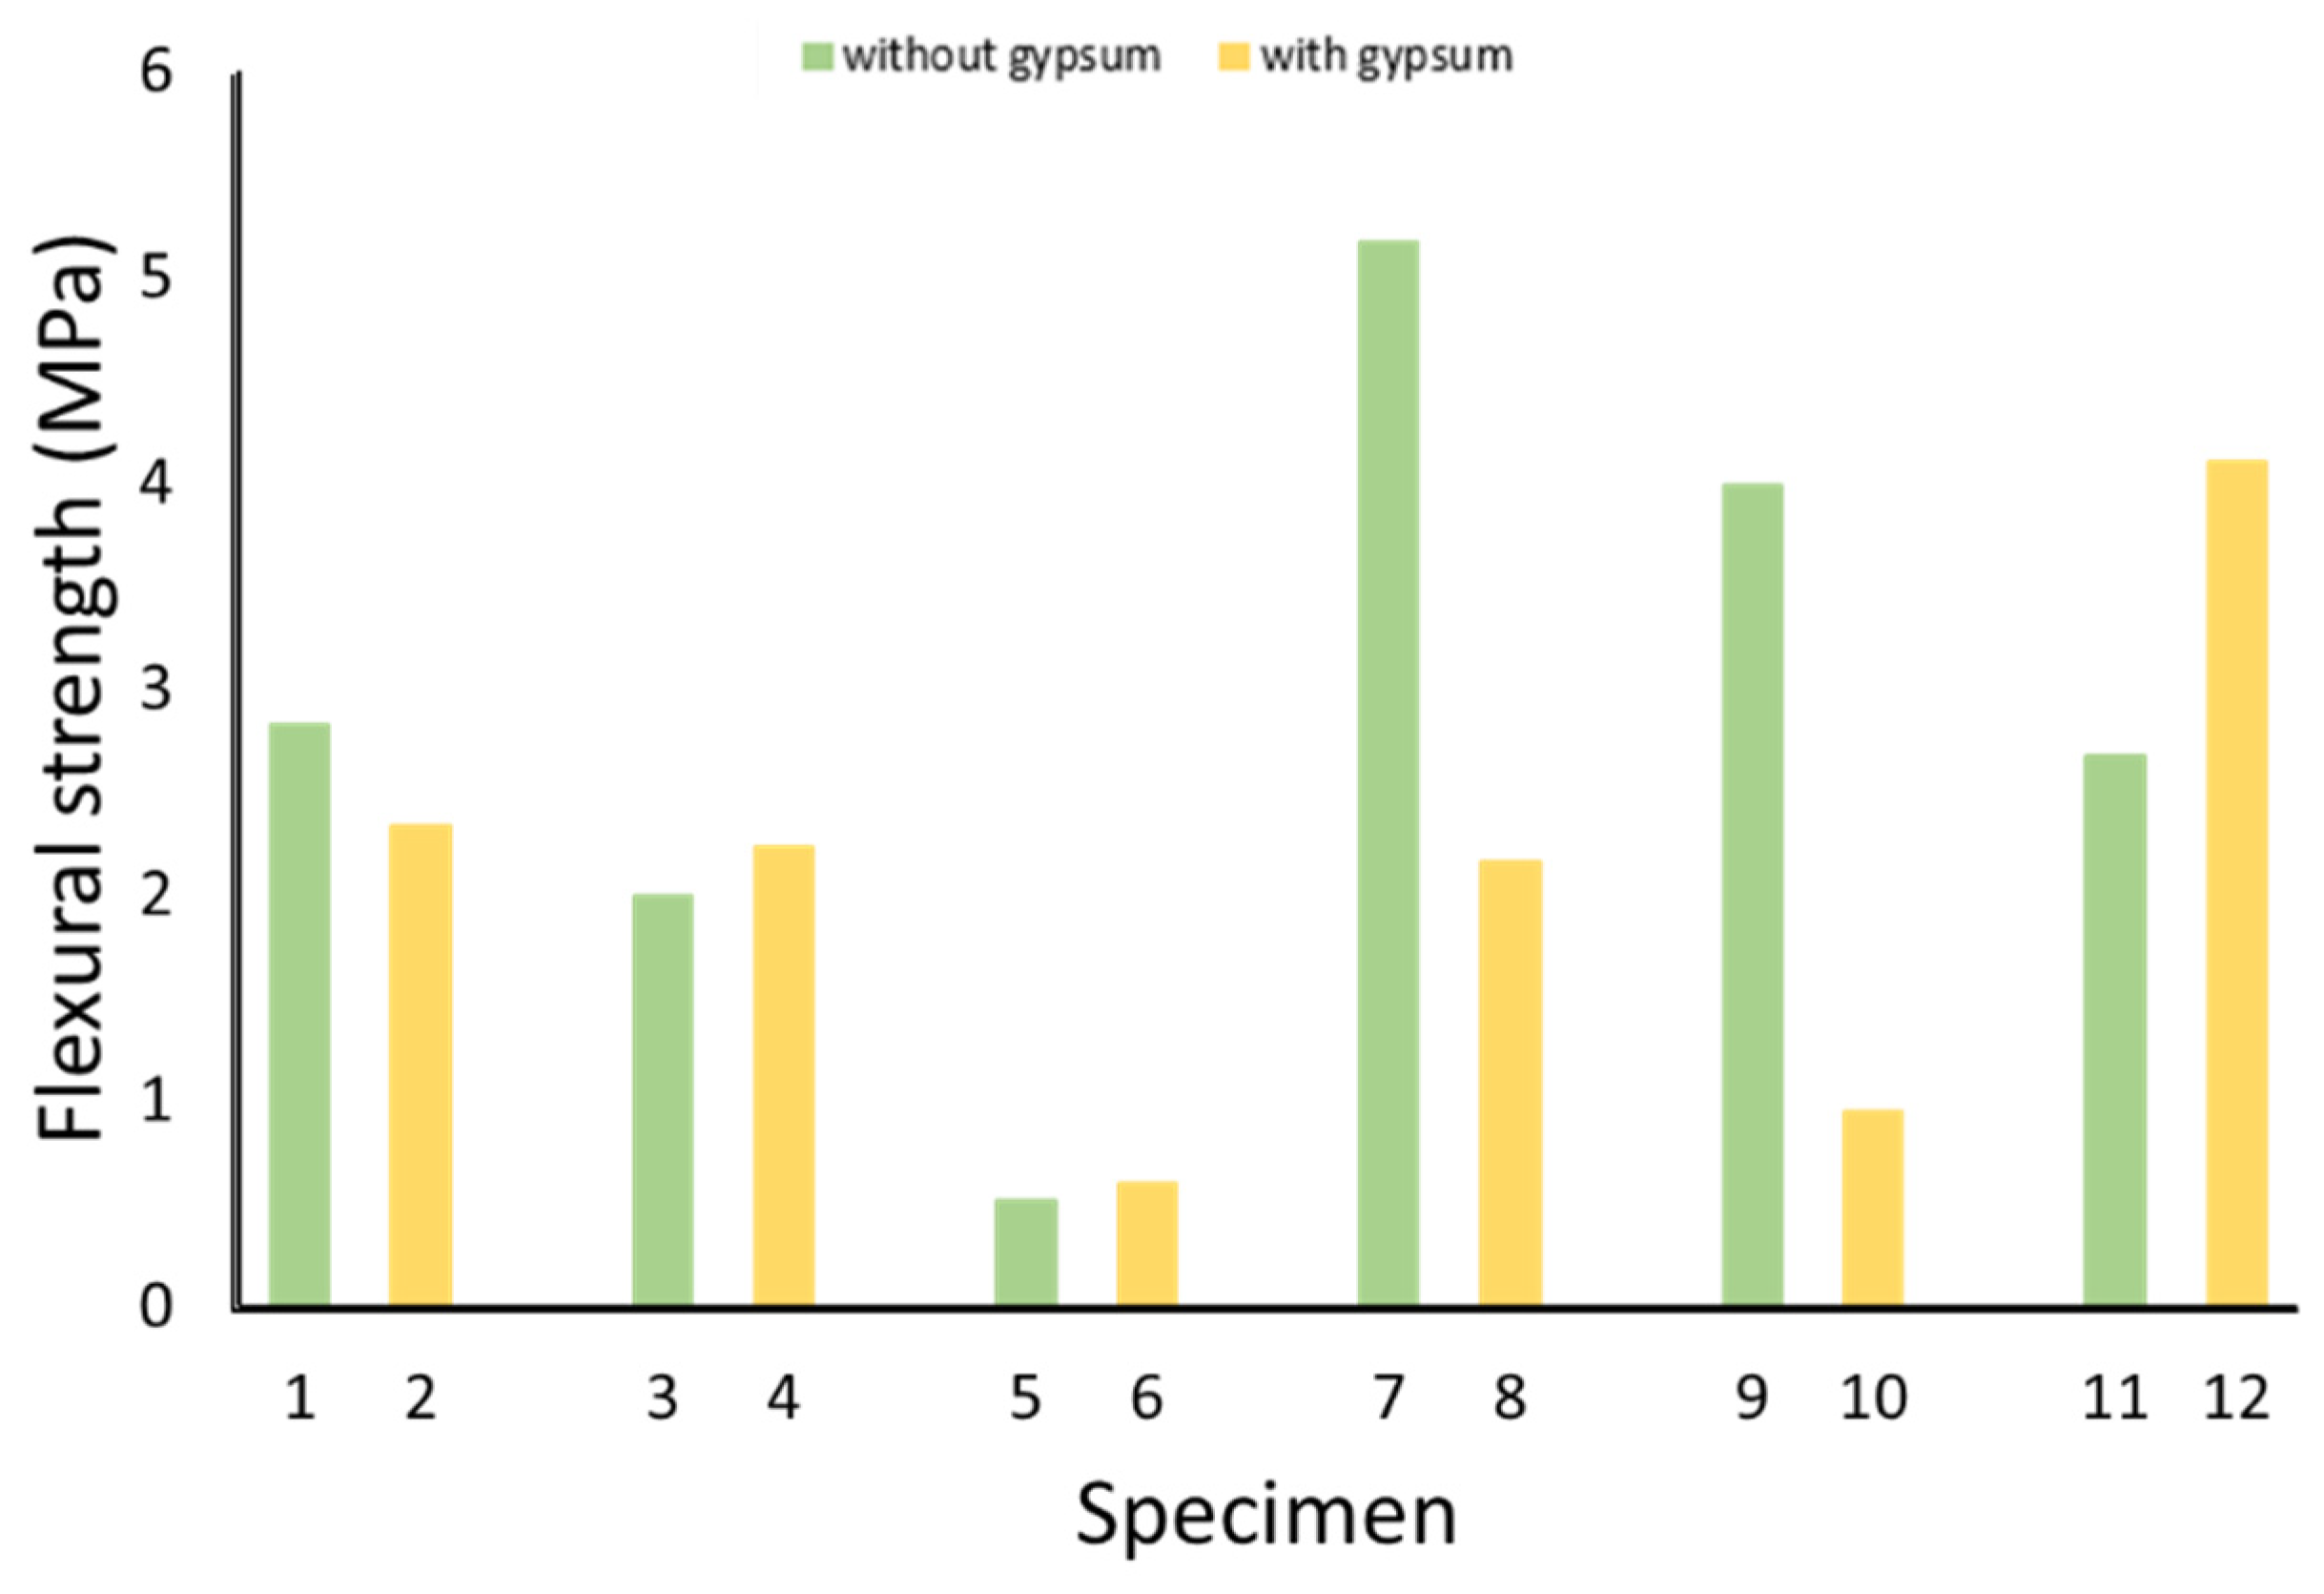
2.3.1. Flexural Strength

The flexural strength of the specimens (7 d and 28 d) is presented in Figure 7. The flexural strength of the specimens developed mainly during the first week and, as expected from previous studies, the specimens were all quite weak [27,39]. In the 7 d measurement, the weakest specimens were gypsum-free and based on fly ash (3) and fly ash and biomass ash (5). The strongest specimens were based on GGBS without gypsum (7) and OPC with gypsum (12). Their flexural strength was even higher than that of the gypsum-free OPC (11). In the 28 d measurement, the weakest specimens were based on fly ash and biomass ash without gypsum (5) and with gypsum (6). The strongest was the gypsum-free GGBS-based specimen (7), which was even stronger than OPC with gypsum (12) and OPC (11). In addition, the gypsum-free specimens based on metakaolin (1) and GGBS and biomass ash (9) were also stronger than OPC (11). This has been observed in a previous study with a fly-ash-based specimen, which also had higher flexural strength than OPC [36].
The effect of the recycled gypsum on the flexural strength of the specimens (28 d) is shown in Figure 8. Gypsum reduced the flexural strength of the GGBS-containing specimens (cf. 7 and 8; 9 and 10). The flexural strength of OPC was increased by gypsum (cf. 11 and 12). There was no effect on the flexural strength of the other specimens.

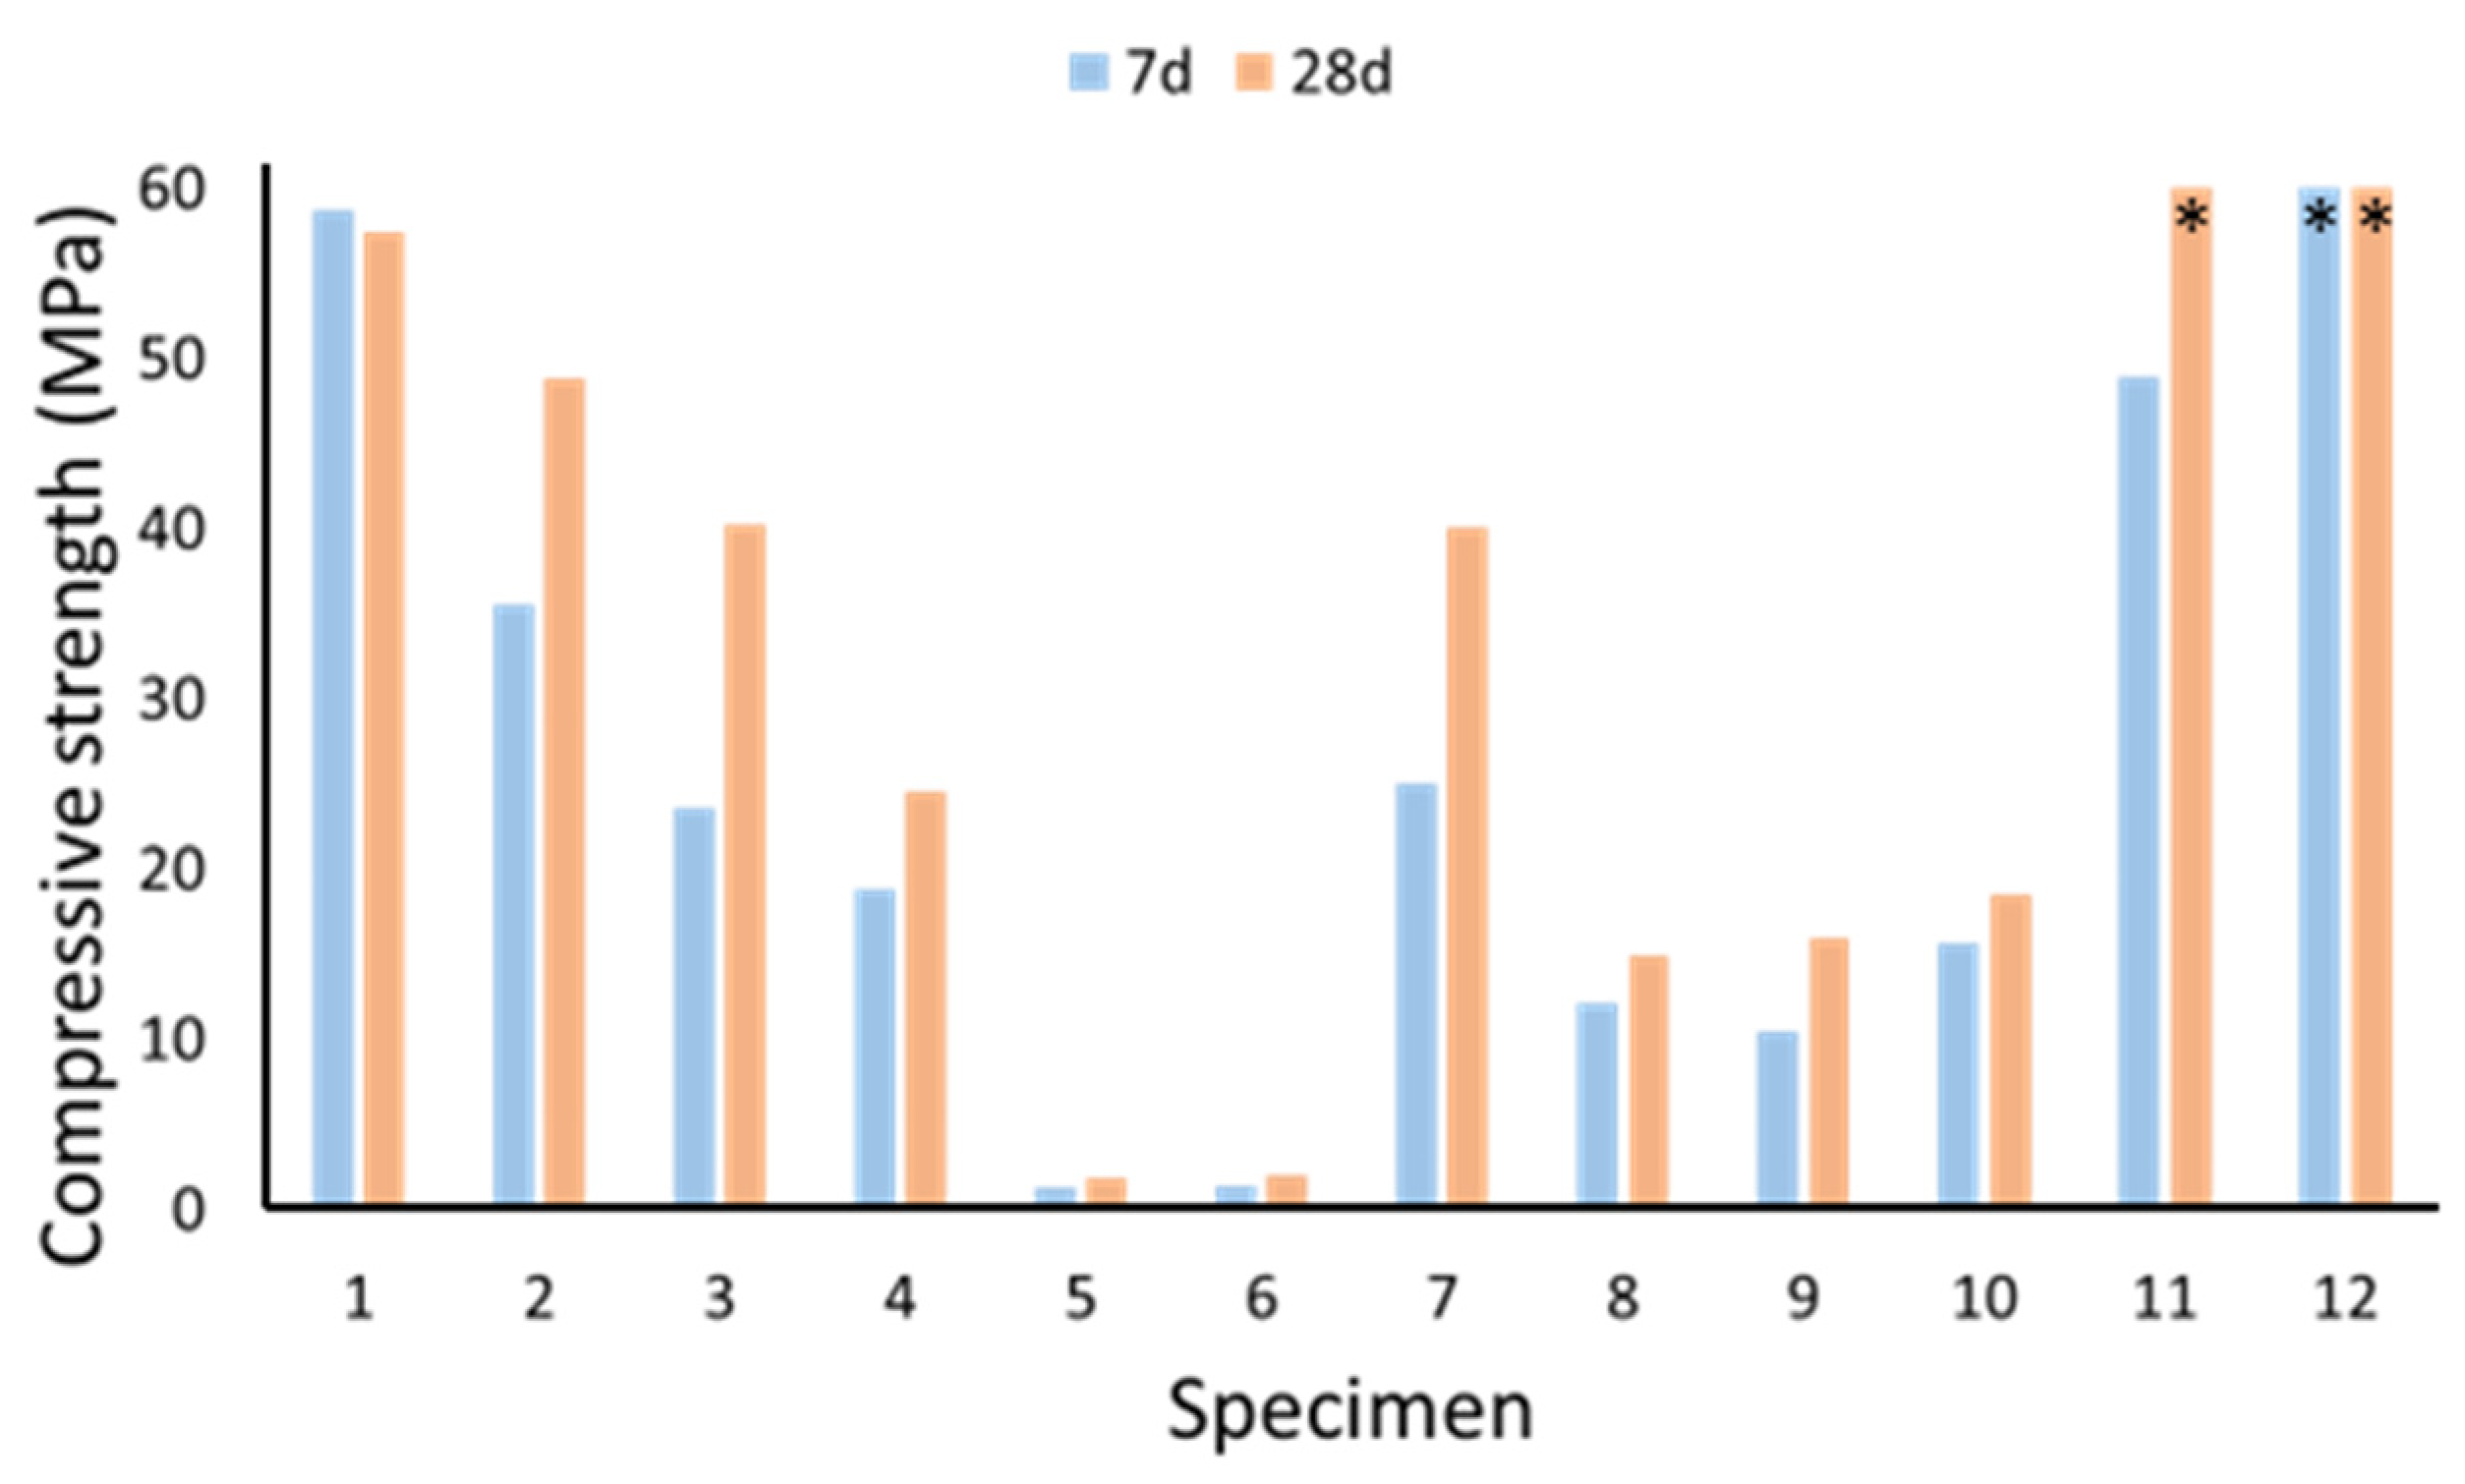
2.3.2. Compressive Strength

Figure 9 shows the compressive strength of the specimens (7 d and 28 d). The compressive strength of the OPC-based specimens 11 (28 d) and 12 (7 d and 28 d) exceeded the limit of the device, therefore their true strength could not be determined. In the 7 d compressive strength measurement, the weakest were fly ash and biomass ash-based specimens without gypsum (5) and with gypsum (6), and the strongest were the specimens based on metakaolin (1) and OPC with gypsum (12), which were stronger than OPC without gypsum (11). In the 28 d compressive strength measurement, the weakest specimens were, again, 5 and 6, and the strongest specimens were the ones based on OPC (11) and OPC with gypsum (12). The strongest of the geopolymer specimens was based on metakaolin (1). The strength of the other materials was below 50 MPa. Based on previous studies, the GGBS-based specimens are generally the strongest and, therefore, GGBS is often added with other raw materials to improve strength properties [8,32]. According to this study, the GGBS-based specimen (7) was as strong as the fly-ash-based specimen (3), but weaker than the metakaolin-based specimen (1).
The effect of recycled gypsum on the compressive strength of the specimens (28 d) is presented in Figure 10. It had no effect on the compressive strength of the already weak specimens (cf. fly ash and biomass ash-based specimens 5 and 6, and biomass ash and GGBS-based specimens 9 and 10), but it reduced the strength of the others. The effect of gypsum on the compressive strength of OPC could not be measured.

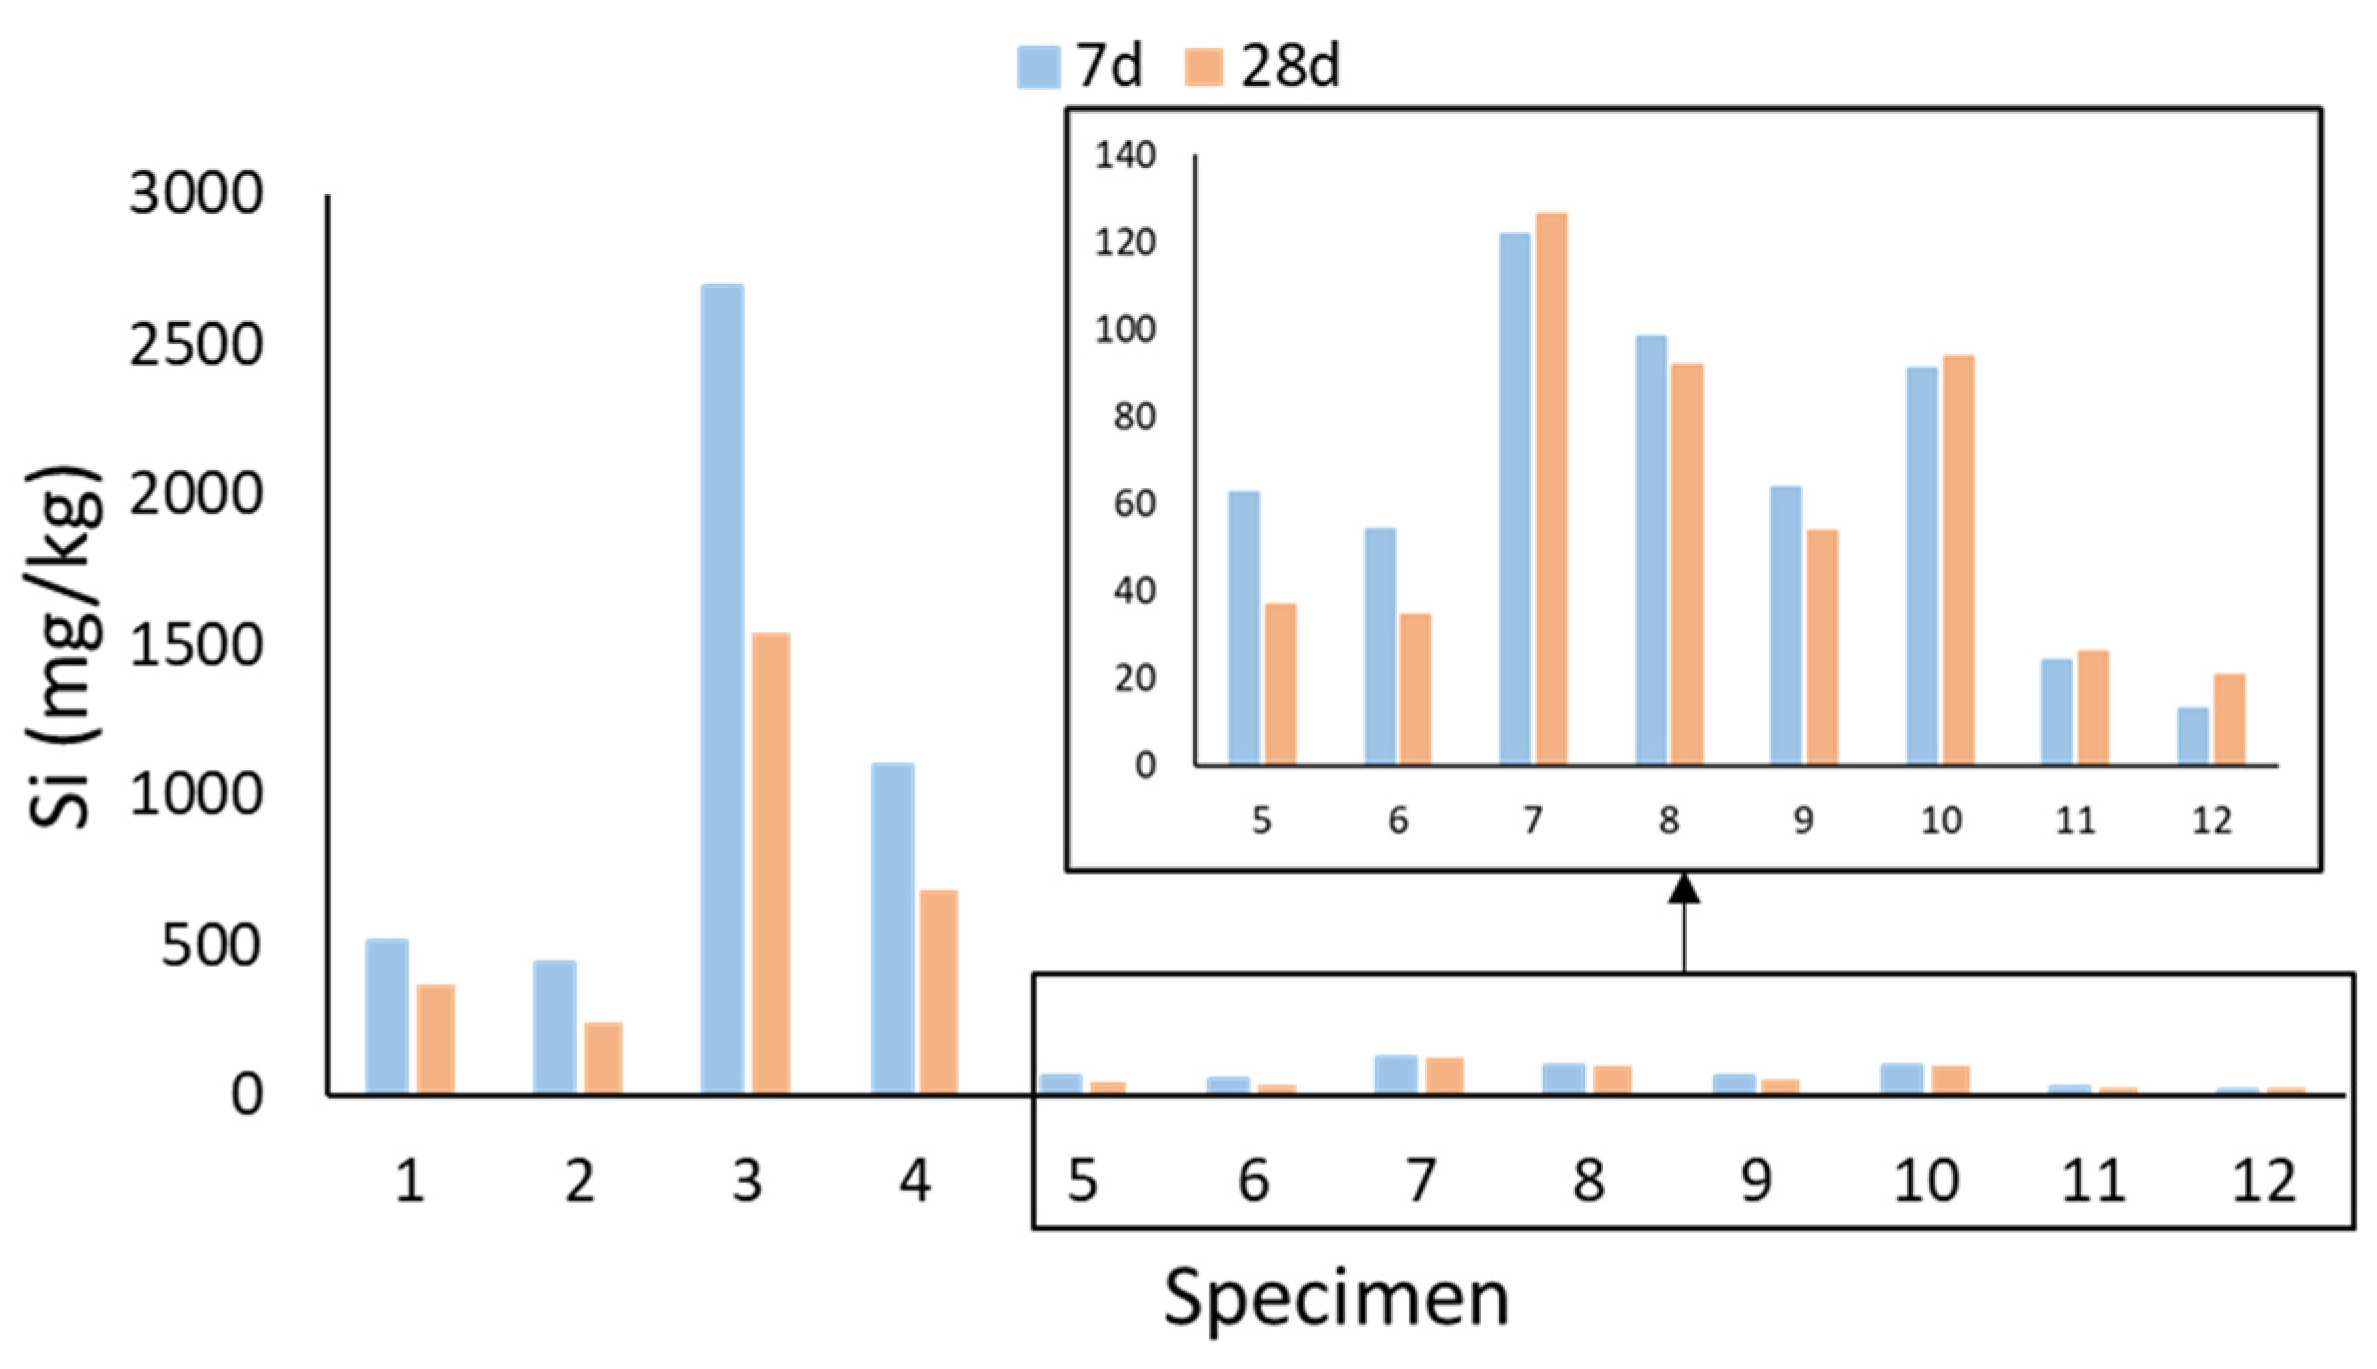
2.4. Leaching of Si, Al, and Ca

Figure 11 presents the amount of aluminium leached from the specimens (7 d and 28 d). In general, less aluminium leached from the specimens at 28 d than at 7 d. For those specimens, from which aluminium leaching was already low (6, 8, and 1012), there was no time dependence. In the 7 d measurement, leaching of aluminium was lower from the gypsum-containing specimens than from the other materials. In the 28 d measurement, the recycled gypsum reduced leaching of aluminium from the GGBS-based specimens (cf. 7, 8, 9, and 10) and increased it from the metakaolin-based specimens (cf. 1 and 2). Gypsum had no significant effect on the other specimens.
The amount of silicon leached from the specimens (7 d and 28 d) is shown in Figure 12. The amount of leached silicon was lower from specimens 16, 8, and 9 at 28 d than at the 7 d measurement. For the other materials, there was no difference in the amount of leached silicon from the specimens of different ages. Gypsum reduced leaching of silicon from the fly-ash-based specimens (cf. 3 and 4), and increased it from the GGBS- and biomass ash-based specimens (cf. 9 and 10). For the other specimens, it reduced slightly or had no effect on the amount of leached silicon.
Figure 13 shows the amount of leached calcium in specimens 512 (7 d and 28 d). Specimens 14 are missing because the amount of calcium leached from them was negligible. The amount of leached calcium was mainly influenced by the calcium content of the raw materials in the specimens. More calcium leached from the specimens made from calcium-rich raw materials (OPC, GGBS, and biomass ash) than from the specimens made from low-calcium raw materials (metakaolin and fly ash). The OPC-based specimens (11 and 12) clearly showed the largest amount of calcium leached. In general, the amount of leached calcium was lower from the specimens at 28 d than at 7 d. The exception was the OPC-based specimen (11), from which slightly more calcium was leached at 28 d than at the 7 d measurement. Gypsum increased the amount of leached calcium, which is explained by the fact that it brings more calcium into the specimen. The results measured by AAS supported the photometrically measured results presented in Figure 13.
The amount of leached aluminium, silicon, and calcium depended on the age and the raw materials of the specimens, as well as the leaching of other substances. In general, less substance leached from the specimens at 28 d than at 7 d, indicating the maturation of the structure and the progress of the geopolymerization reaction. A notable leaching of a certain substance meant less leaching of the others. This was also observed in the gypsum-containing specimens. Gypsum increased calcium leaching but decreased the leaching of silicon and aluminium.

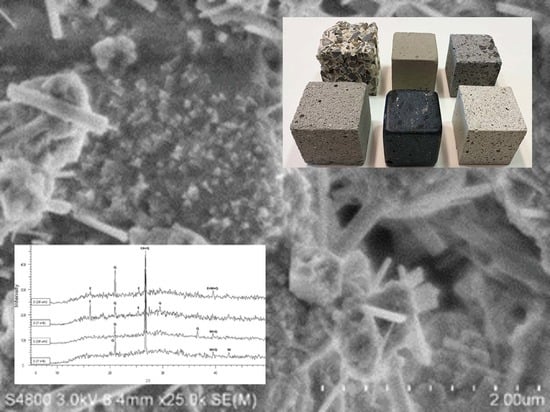
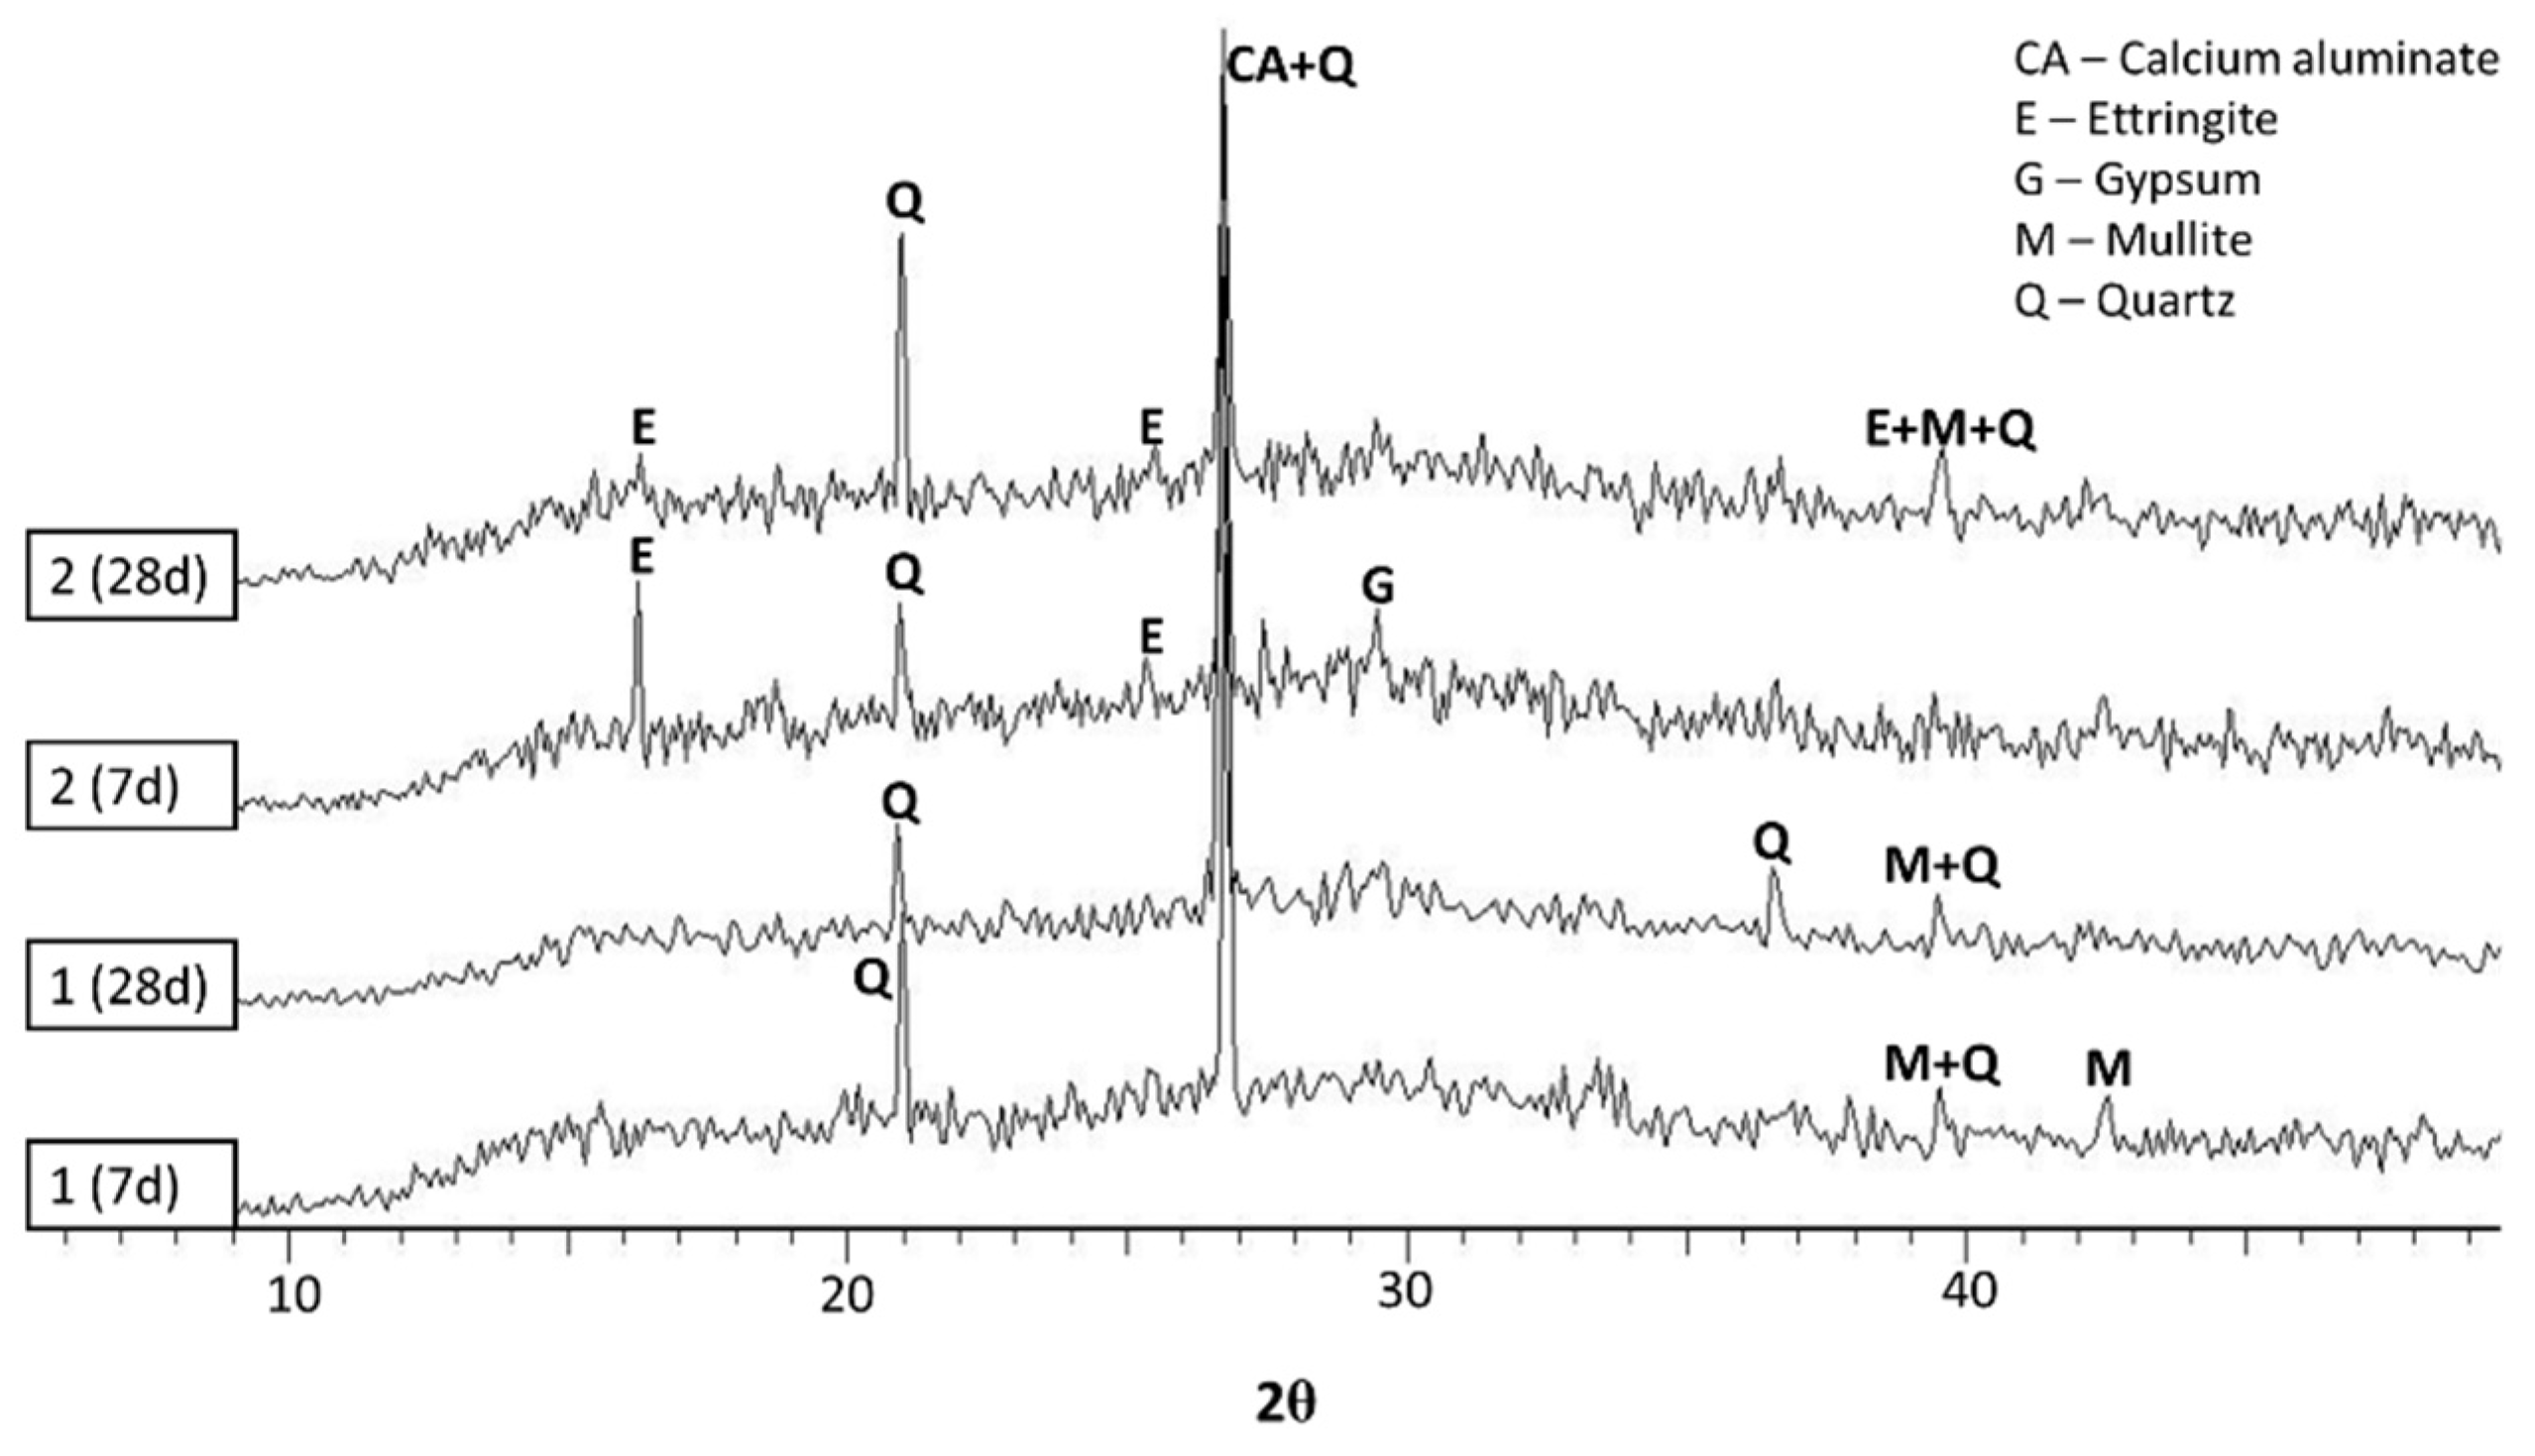
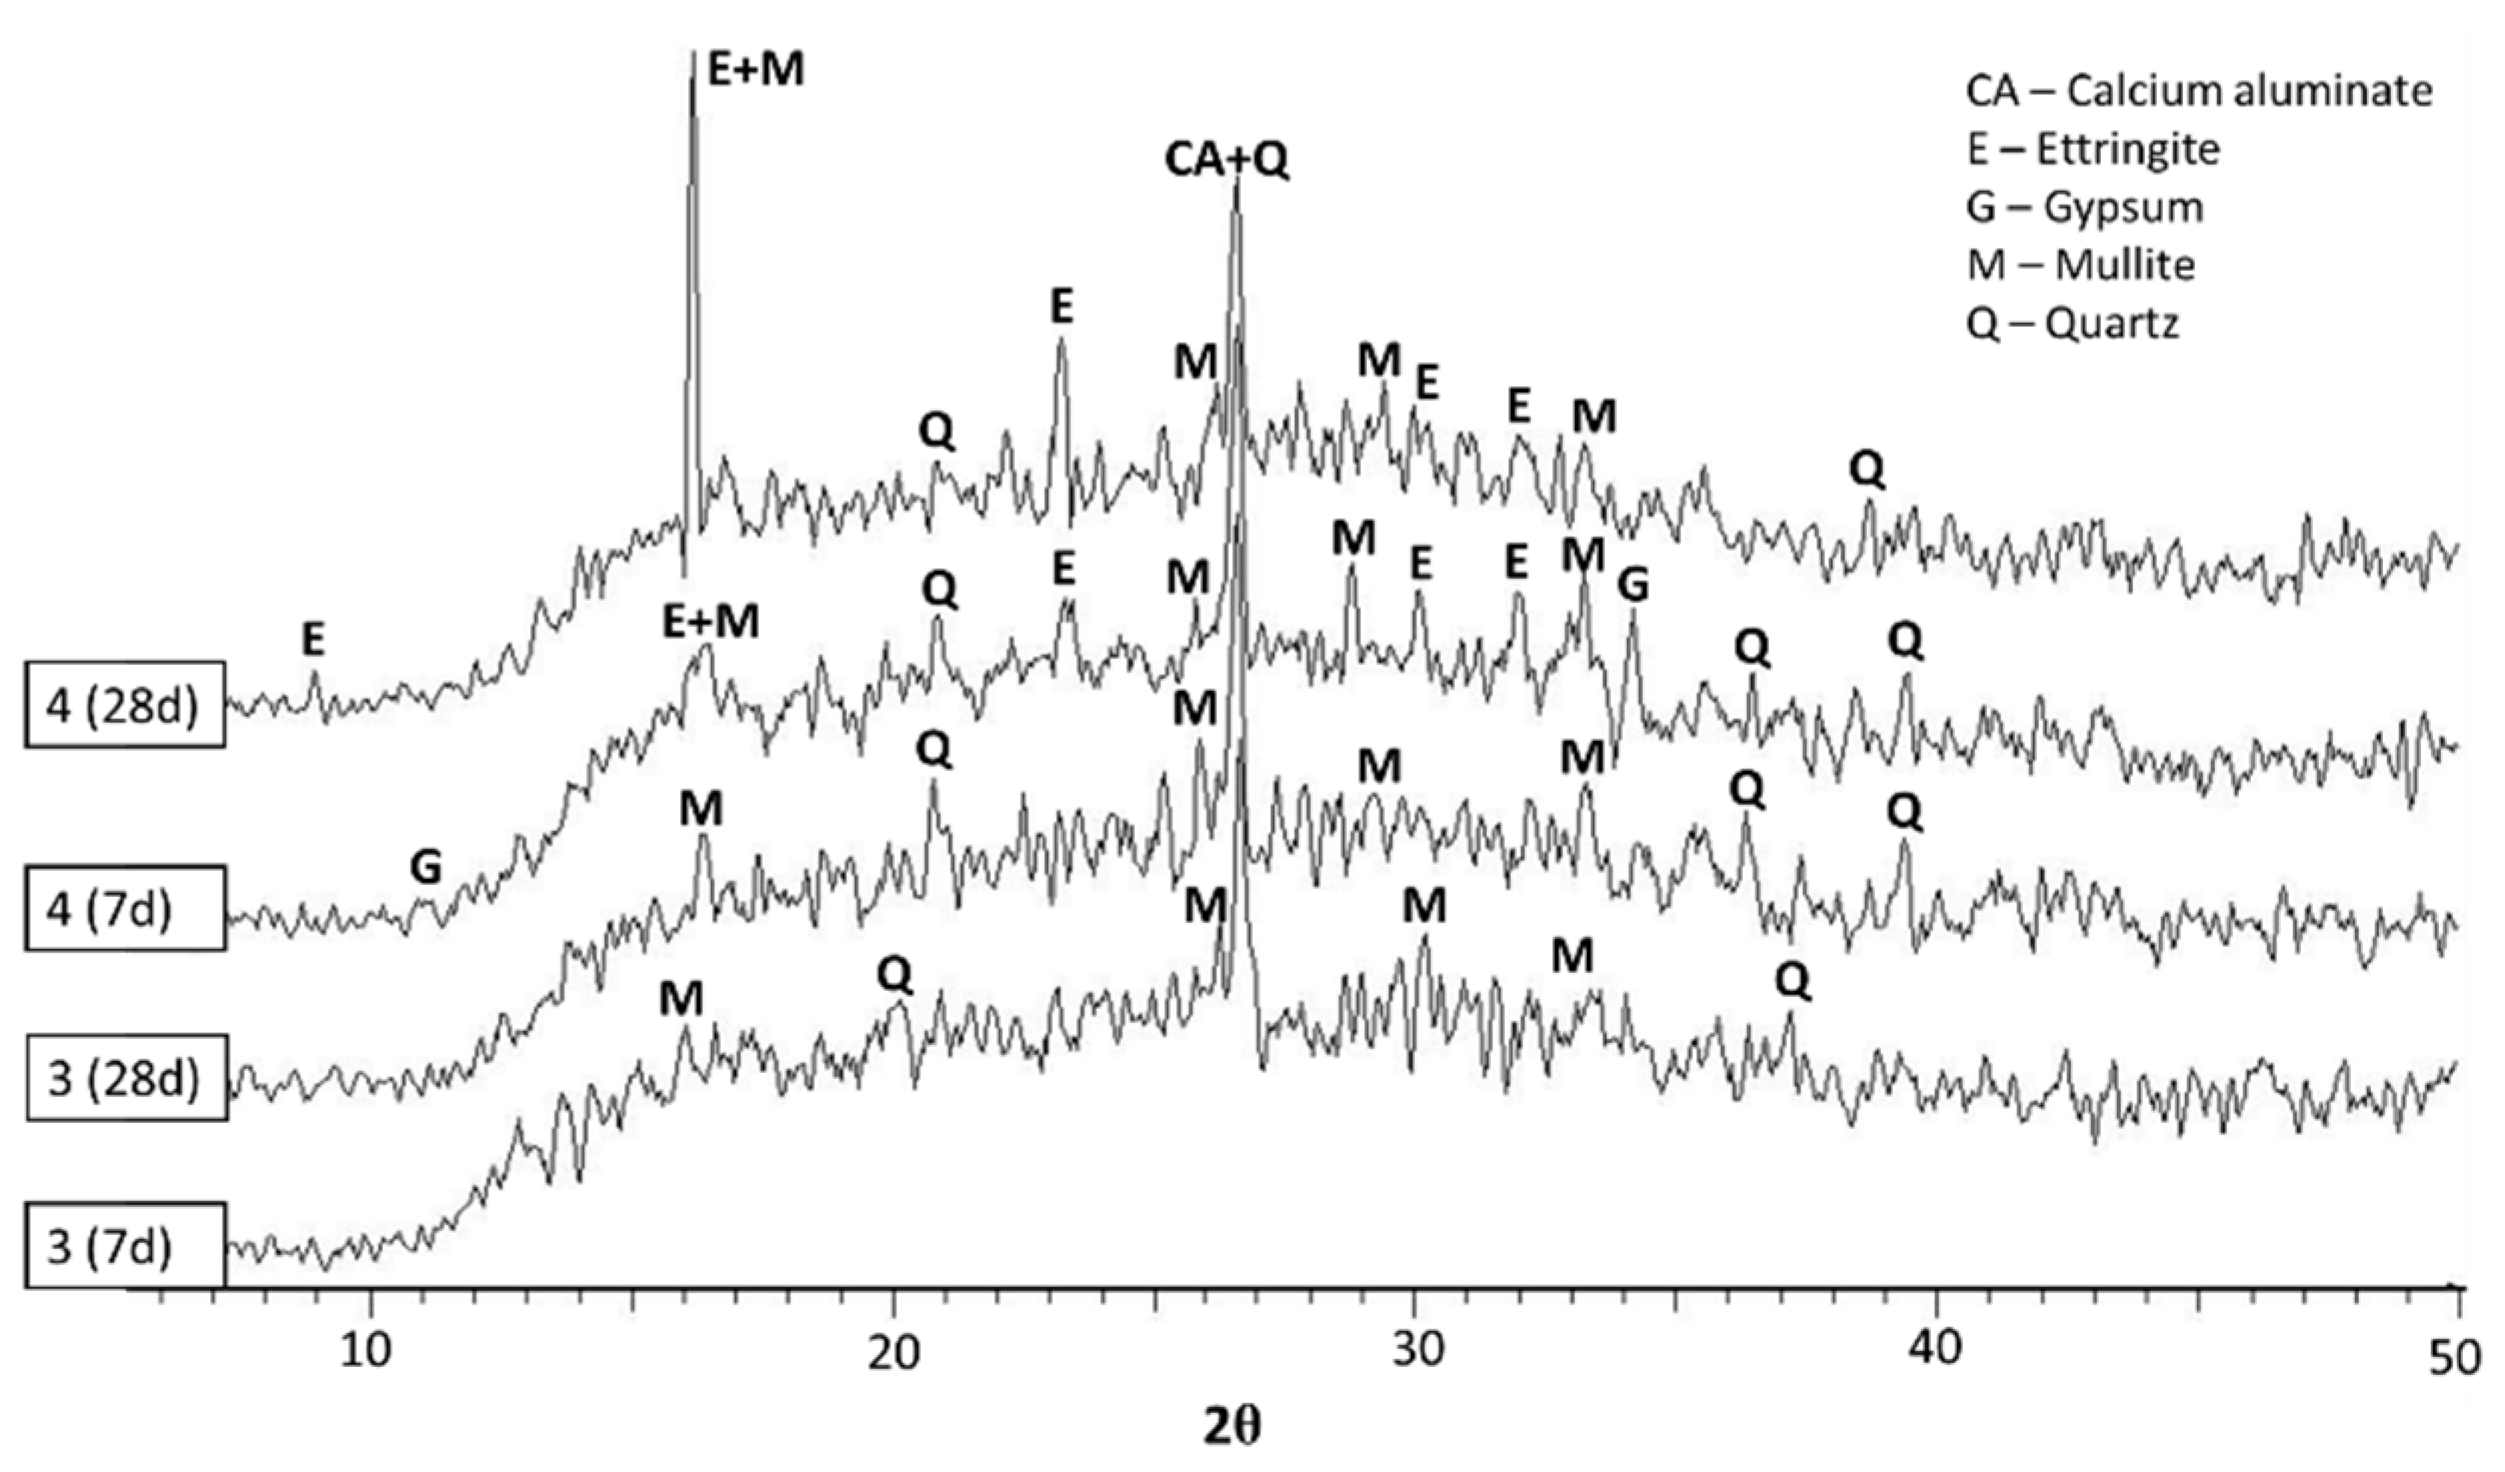
2.5. Crystalline Phase and SEM Measurements

Figure 14 and Figure 15 present diffractograms of the metakaolin-based specimens (1 and 2) and fly ash-based specimens (3 and 4). The diffractograms for the other specimens are given in the supplementary material (Figures S1–S4). The structure of geopolymers is mostly amorphous, which caused a broad signal in diffractograms (2θ ≈ 10–40°) (Figure 14, Figure 15 and Figures S1–S3). The most abundant impurities in the specimens were quartz and mullite, which are weakly reactive compounds originating from the raw materials [14,59]. They were observed mostly in specimens made from biomass ash and fly ash (36, 9, and 10). The specimens made from metakaolin (1 and 2) and OPC (11 and 12) had only traces of quartz and mullite impurities. Specimens 14 contained CAC, which caused calcium aluminate signal (27°) in the diffractograms (Figure 14 and Figure 15). Biomass ash and GGBS contain plenty of calcium, which caused calcium silicate hydrate signals (27–29°) in the diffractograms of specimens 510 (Figures S1–S3). As expected, based on previous studies, ettringite was observed in all specimens containing gypsum [29,30]. Although XRD measurement was not quantitative, conclusions could be drawn about the rate of ettringite formation and decomposition in the specimens. The formation is affected by the rate of diffusion and the amount of reactants [30]. Therefore, the rate varied a lot between the specimens and depended on the raw materials. The diffractogram of specimen 2 (Figure 14) shows that there was less ettringite in the specimen at 28 d than at 7 d, which means that the ettringite had already started to decompose. On the other hand, in some samples, the ettringite crystals persisted better, as can be seen in the diffractogram of specimen 4 (Figure 15).
SEM measurements were performed to obtain further support of the relationship between the material fine structure and the strength of the specimens (Figure S6).
For example, specimen 8, from blast furnace slag and biomass ash with added gypsum, showed low shrinkage. Its SEM figure shows needle-like crystals supporting the larger structural units (Figure 16a). It can be suggested that this prevents shrinkage when the residual water begins to leave the structure. By combining the EDS data of the observed crystals with the XRD analysis, it can be concluded that the crystals are formed from ettringite.
On the other hand, in specimen 4, which is based on fly ash and gypsum, similar crystals are not observed; instead, the material is mainly a fusion of spherical fly ash particles (Figure 16b). The shrinkage of the specimen was high. The structure also had remarkable cracks caused by the plastic shrinkage, as also seen visually in the specimen.
The EDS of 4 shows surprisingly low sulfur content compared to specimen 8. One possibility for this is that the reaction route or the kinetics are different in the formation of 4 than in the formation of 8. This could lead to the flotation of gypsum to the surface of the specimen instead of it remaining in the material. This idea is supported by the formation of efflorescence on the surface of specimen 4 (Figure S5).
It is possible that, in the preparation of 4, the solid substances were dissolved in the activator solution and the material was afforded strength so slowly in the geopolymerization reaction that the added gypsum did not form ettringite crystals. The progress of strength was slow even though the setting time was short. This indicates that the timely formed ettringite crystals support the structure units and hence prevent the collapse of the material when water starts to escape the structure.
Furthermore, the fragility of specimens 5 and 6 can be linked to the high crystallinity with poor interconnectivity between crystals.

3. Materials and Methods

3.1. Materials

In this study, 12 binder specimens with replicates were prepared from different raw materials (Table 1 and Table 2). The main raw materials were metakaolin, fly ash (class F), biomass ash, and ground-granulated blast furnace slag (GGBS). Other materials than metakaolin were obtained from industrial side streams. In addition, a metakaolin-based specimen (13) containing aggregates was prepared (water to binder ratio of 0.61) and used as a control in the shrinkage measurements. The aggregate mixture (grain size ≤ 2 mm) consisted of mine tailings and bottom ash from fluidized bed waste incineration plant. Six of the specimens contained 5% recycled gypsum (CaSO4·2H2O). Calcium aluminate cement (CAC) was used as an additive in specimens 14 and 13. Sodium hydroxide (specimens 510) or a mixture of sodium hydroxide and sodium silicate (specimens 14 and 13) were used as an alkaline activator. Specimens 11 and 12 were made from ordinary Portland cement (OPC) and they were used as controls in this study.
Table 1. Elemental composition of raw materials as mass% of main cations.
Raw MaterialNa + KCaSiAl
Metakaolin1-25.721.2
CAC-27.21.722.0
Fly ash1.714.321.010.0
Biomass ash5.331.06.16.5
GGBS0.927.917.84.8
OPC0.436.37.27.3
Table 2. Numbering, solid raw materials, and water content (WC) of the specimens.
SpecimenSolid Raw Materials
(Mass% of Total)
WC (%)SpecimenSolid Raw Materials
(Mass% of Total)
WC (%)
1Metakaolin (34)
CAC (12)
32.72Metakaolin (32)
CAC (11.4)
CaSO4·2H2O (5)
31.0
3Fly ash (54)
CAC (9.1)
22.34Fly ash (51)
CAC (8.7)
CaSO4·2H2O (5)
21.3
5Fly ash (52)
Biomass ash (24)
27.96Fly ash (49)
Biomass ash (21)
CaSO4·2H2O (5)
26.8
7GGBS (74)25.18GGBS (70)
CaSO4·2H2O (5)
23.9
9GGBS (48)
Biomass ash (21)
25.810GGBS (45.7)
Biomass ash (20)
CaSO4·2H2O (5)
25.3
11OPC (75.8)24.212OPC (72.8)
CaSO4·2H2O (5)
22.2
13Metakaolin (10.3)
CAC (3.6)
Aggregates
16.2
CAC = calcium aluminate cement; GGBS = ground-granulated blast furnace slag; OPC = ordinary Portland cement. NaOH was used as alkaline activator in specimens 14 and 13. Mixture of NaOH and Na2SiO3 was used as alkaline activator in specimens 510.

3.2. Preparation Process

Alkaline activator was added to solid substances (graded, d < 1 mm) and stirred for 3 min. The paste was poured into moulds (40 × 40 × 160 mm). Most of the specimens were cured sealed at room temperature for 1 d. However, specimens 5, 6, 8, and 10 cured slowly. Therefore, they were cured sealed at 70 °C. After curing, the specimens were stored at room temperature in sealed bags for 28 d. During this time, measurements of the plastic phase were made (7 d and 28 d). The specimens were then taken from the bags and allowed to dry at room temperature for 28 d, after which the drying shrinkage (56 d) and SEM images were measured (100 d).

3.3. Testing Methods

3.3.1. Setting Time

Setting time of the specimens was measured by using Vicatronic Matest apparatus, which uses penetrating method. In this method, the setting time is defined when the penetration of the Vicat needle is 40 mm. Measurements were performed under ambient conditions.

3.3.2. Shrinkage

The shrinkage of the specimens was measured by comparing their length with a wooden standard piece. A Testing Bluhm and Feuerherdt shrinkage analyzator (accuracy 1 μm) was used in this study. Specimens 5 and 6 broke during the demoulding. Therefore, their shrinkage was measured with a calliper (accuracy 10 μm). The initial length of the specimens was measured immediately after demoulding (mostly 1 d, except for specimens 5 and 6, for which the length was measured after 2 d and, for specimens 8 and 10, after 4 d). The plastic shrinkage of the specimens was measured at 7 d and 28 d, and the drying shrinkage was measured at 56 d. The last measurement could not be conducted for specimens 5 and 6, because they were so fragile that there were no intact pieces left.

3.3.3. Strength

Strengths of the specimens were measured with Instron 5581 (limit 50 kN). Flexural strength was measured from a prism (40 × 40 × 160 mm) by three-point flexing (press rate 25 MPa/s). Compressive strength was measured from a cube (40 × 40 × 40 mm) or rectangle (30 × 30 × 40 mm) if cube’s compressive strength was above the limit (press rate 10 mm/min). The strengths of the specimens were measured at 7 d and 28 d.

3.3.4. Leaching of Si, Al, and Ca

The amounts of leached silicon, aluminium, and calcium from the specimens were measured at 7 d and 28 d. The measurement followed the standard EN 12457-2:2002 [60]. The amount of leached aluminium and silicon was measured photometrically (model YSI 9500, YSI Incorporated, Yellow Springs, OH, USA), and the amount of leached calcium was measured photometrically and by atomic absorption spectrometer (AAS, model SpecrAA 220, Varian Medical Systems, Inc., Palo Alto, CA, USA). Both methods have specific interferences, therefore several measurements were performed to obtain reliable results.

3.3.5. XRD

XRD was used to qualitatively identify crystalline phases of the specimens at 28 d. XRD test was performed via Bruker Advance D8 (Bruker Corporation, Billerica, MA, USA) powder diffractometer with the scanning range 5–50° (2θ) at a step 0.05° and a rate 5°/min. A database and literature were used to help interpret the diffractograms [61,62,63,64,65,66,67].

3.3.6. SEM

The surface structure of the samples was studied with a Hitachi S4800 FE-SEM (Hitachi, Ltd., Tokyo, Japan). Elemental identification of the surface structures was obtained with energy dispersive X-ray spectroscopy (EDS, Thermo Fisher Scientific, Waltham, MA, USA). Acceleration voltages of 3 and 10 kV were applied. The specimens (over 100 d) were cut into smaller species (approximately 1 × 1 × 1 cm3), dried in an oven at 110 °C for 1 h, and cooled to room temperature in desiccator before the measurements. Additional drying of the specimens was necessary to obtain the required vacuum for the measurement.

4. Conclusions

The combination of different raw materials of a geopolymer has a great impact on its properties. Hence, it is difficult to produce a geopolymer with the same properties as ordinary Portland cement (OPC). In this study, we compared the mechanical properties of specimens of geopolymers with and without recycled gypsum to establish trends in the setting time, shrinkage, and strength of the materials. In addition, the leaching of Al, Si, and Ca was studied. The results were supported by further analysis of the materials by XRD and SEM measurements. The main results can be summarized as follows:
  • The metakaolin-based specimen (1) had the same setting time as OPC and its compressive strength was the closest to OPC, but the shrinkage was significantly greater, and the specimen had cracks caused by shrinkage. The GBSS and biomass ash-based specimen (9) was the closest to OPC in shrinkage without cracking, but had a much lower compressive strength and a much longer setting time.
  • The leaching of Al, Si, and Ca from the specimens was mostly affected by the age and the raw materials of the specimen, as well as the leaching of other substances. However, the leaching of the measured substances did not seem to be related to the mechanical properties of the specimen.
  • Recycled gypsum was found to have a notable effect on the setting time. Depending on the calcium content of the raw materials, it either accelerated or decreased the setting time.
  • Gypsum effectively reduced the plastic shrinkage of the geopolymer specimens but had no effect on, or even increased, their drying shrinkage. This indicates that the shrinkage-reducing effect of gypsum is based on ettringite, which is not a stable compound. It decomposes over time and thus its shrinkage-reducing effect is also gradually lost.
  • Gypsum had almost no effect on the total shrinkage of the geopolymers, as most of this consisted of drying shrinkage.
  • It could be concluded from the diffractograms that the formation and decomposition of ettringite depends on the raw materials of the geopolymer.
  • In this study, recycled gypsum reduced the compressive strength of the specimens, but this could perhaps be avoided by using a finer (<1 mm) gypsum powder. On the other hand, ettringite can also cause the material to become brittle.

Supplementary Materials

The supporting information can be downloaded at https://www.mdpi.com/article/10.3390/inorganics11070298/s1, and includes XRD data for specimens 513, Figure of specimens 113 and SEM-images for 112. Figure S1. XRD of specimens 5 and 6; Figure S2. XRD of specimens 7 and 8; Figure S3. XRD of specimens 9 and 10; Figure S4. XRD of specimens 11 and 12; Figure S5. Prepared specimens 113; Figure S6. SEM-images of species 112.

Author Contributions

H.K.: Investigation, writing—original draft. J.T.: Conceptualization, writing—review and editing, supervision. S.S.: Investigation, writing—review and editing. P.H.: Writing—review and editing, supervision. K.M.: Conceptualization, writing—review and editing. S.J.: Writing—review and editing, supervision. All authors have read and agreed to the published version of the manuscript.

Funding

This research received no external funding.

Data Availability Statement

The data presented in this study are available on request from the corresponding author.

Acknowledgments

We would like to thank Eetu Pietarinen for their assistance in the specimen preparation and measurements.

Conflicts of Interest

The authors declare no conflict of interest.

References

  1. Siyal, A.A.; Shamsuddin, M.R.; Khan, M.I.; Rabat, N.E.; Zulfiqar, M.; Man, Z.; Siame, J.; Azizli, K.A. A Review on Geopolymers as Emerging Materials for the Adsorption of Heavy Metals and Dyes. J. Environ. Manag. 2018, 224, 327–339. [Google Scholar] [CrossRef] [PubMed]
  2. Nazari, A.; Sanjayan, J.G. Synthesis of Geopolymer from Industrial Wastes. J. Clean. Prod. 2015, 99, 297–304. [Google Scholar] [CrossRef]
  3. Duxson, P.; Fernández-Jiménez, A.; Provis, J.L.; Lukey, G.C.; Palomo, A.; van Deventer, J.S.J. Geopolymer Technology: The Current State of the Art. J. Mater. Sci. 2007, 42, 2917–2933. [Google Scholar] [CrossRef]
  4. Hou, L.; Li, J.; Lu, Z.-Y. Effect of Na/Al on Formation, Structures and Properties of Metakaolin Based Na-Geopolymer. Constr. Build. Mater. 2019, 226, 250–258. [Google Scholar] [CrossRef]
  5. Yu, G.; Jia, Y. Preparation of Geopolymer Composites Based on Alkali Excitation. Arab. J. Geosci. 2021, 14, 600. [Google Scholar] [CrossRef]
  6. Kuenzel, C.; Vandeperre, L.J.; Donatello, S.; Boccaccini, A.R.; Cheeseman, C.; Torroja, E. Ambient Temperature Drying Shrinkage and Cracking in Metakaolin-Based Geopolymers. J. Am. Ceram. Soc. 2012, 95, 3270–3277. [Google Scholar] [CrossRef] [Green Version]
  7. Kolezynski, A.; Król, M.; Zychowicz, M. The Structure of Geopolymers—Theoretical Studies. J. Mol. Struct. 2018, 1163, 465–471. [Google Scholar] [CrossRef]
  8. Almutairi, A.L.; Tayeh, B.A.; Adesina, A.; Isleem, H.F.; Zeyad, A.M. Potential Applications of Geopolymer Concrete in Construction: A Review. Case Stud. Constr. Mater. 2021, 15, e00733. [Google Scholar] [CrossRef]
  9. Provis, J.L.; van Deventer, J.S.J. Geopolymers: Structure, Processing, Properties and Industrial Applications; Provis, J.L., van Deventer, J.S.J., Eds.; Woodhead: Boca Raton, FL, USA; CRC Press: Oxford, UK, 2009; pp. 1–11. [Google Scholar]
  10. van Deventer, J.S.J.; Provis, J.L.; Duxson, P. Technical and Commercial Progress in the Adoption of Geopolymer Cement. Miner. Eng. 2012, 29, 89–104. [Google Scholar] [CrossRef]
  11. Kumar Mehta, P. Reducing the Environmental Impact of Concrete. Concr. Int. 2001, 23, 61–66. [Google Scholar]
  12. Mclellan, B.C.; Williams, R.P.; Lay, J.; van Riessen, A.; Corder, G.D. Costs and Carbon Emissions for Geopolymer Pastes in Comparison to Ordinary Portland Cement. J. Clean. Prod. 2011, 19, 1080–1090. [Google Scholar] [CrossRef] [Green Version]
  13. Ridtirud, C.; Chindaprasirt, P.; Pimraksa, K. Factors Affecting the Shrinkage of Fly Ash Geopolymers. Int. J. Miner. Metall. Mater. 2011, 18, 100–104. [Google Scholar] [CrossRef]
  14. Davidovits, J. Geopolymer Chemistry and Applications, 4th ed.; Davidovits, J., Ed.; Institut Géopolymère: Saint-Quentin, France, 2015. [Google Scholar]
  15. Wang, R.; Wang, J.; Dong, T.; Ouyang, G. Structural and Mechanical Properties of Geopolymers Made of Aluminosilicate Powder with Different SiO2/Al2O3 Ratio: Molecular Dynamics Simulation and Microstructural Experimental Study. Constr. Build. Mater. 2020, 240, 117935. [Google Scholar] [CrossRef]
  16. Kenne Diffo, B.B.; Elimbi, A.; Cyr, M.; Dika Manga, J.; Tchakoute Kouamo, H. Effect of the Rate of Calcination of Kaolin on the Properties of Metakaolin-Based Geopolymers. J. Asian Ceram. Soc. 2015, 3, 130–138. [Google Scholar] [CrossRef] [Green Version]
  17. Singh, B.; Rahman, M.R.; Paswan, R.; Bhattacharyya, S.K. Effect of Activator Concentration on the Strength, ITZ and Drying Shrinkage of Fly Ash/Slag Geopolymer Concrete. Constr. Build. Mater. 2016, 118, 171–179. [Google Scholar] [CrossRef]
  18. Duxson, P.; Lukey, G.C.; van Deventer, J.S.J. Thermal Evolution of Metakaolin Geopolymers: Part 1-Physical Evolution. J. Non-Cryst. Solids 2006, 352, 5541–5555. [Google Scholar] [CrossRef]
  19. Barbosa, V.F.F.; MacKenzie, K.J.D. Synthesis and Thermal Behaviour of Potassium Sialate Geopolymers. Mater. Lett. 2003, 57, 1477–1482. [Google Scholar] [CrossRef]
  20. Zhao, J.; Tong, L.; Li, B.; Chen, T.; Wang, C.; Yang, G.; Zheng, Y. Eco-Friendly Geopolymer Materials: A Review of Performance Improvement, Potential Application and Sustainability Assessment. J. Clean. Prod. 2021, 307, 127085. [Google Scholar] [CrossRef]
  21. Wang, D.; Wang, Q.; Huang, Z. New Insights into the Early Reaction of NaOH-Activated Slag in the Presence of CaSO4. Compos. B Eng. 2020, 198, 108207. [Google Scholar] [CrossRef]
  22. El Alouani, M.; Saufi, H.; Moutaoukil, G.; Alehyen, S.; Nematollahi, B.; Belmaghraoui, W.; Taibi, M. Application of Geopolymers for Treatment of Water Contaminated with Organic and Inorganic Pollutants: State-of-the-Art Review. J. Environ. Chem. Eng. 2021, 9, 105095. [Google Scholar] [CrossRef]
  23. Pol Segura, I.; Jensen, P.A.; Damø, A.J.; Ranjbar, N.; Jensen, L.S.; Canut, M. Influence of Sodium-Based Activators and Water Content on the Fresh and Hardened Properties of Metakaolin Geopolymers. SN Appl. Sci. 2022, 4, 283. [Google Scholar] [CrossRef]
  24. Hassan, A.; Arif, M.; Shariq, M. Effect of Curing Condition on the Mechanical Properties of Fly Ash-Based Geopolymer Concrete. SN Appl. Sci. 2019, 1, 1694. [Google Scholar] [CrossRef] [Green Version]
  25. Fang, G.; Bahrami, H.; Zhang, M. Mechanisms of Autogenous Shrinkage of Alkali-Activated Fly Ash-Slag Pastes Cured at Ambient Temperature within 24 h. Constr. Build. Mater. 2018, 171, 377–387. [Google Scholar] [CrossRef]
  26. Mastali, M.; Kinnunen, P.; Dalvand, A.; Mohammadi Firouz, R.; Illikainen, M. Drying Shrinkage in Alkali-Activated Binders—A Critical Review. Constr. Build. Mater. 2018, 190, 533–550. [Google Scholar] [CrossRef]
  27. Ranjbar, N.; Zhang, M. Fiber-Reinforced Geopolymer Composites: A Review. Cem. Concr. Compos. 2020, 107, 103498. [Google Scholar] [CrossRef]
  28. Kotrla, J.; Soukal, F.; Bilek, V.; Alexa, M. Effects of Shrinkage-Reducing Admixtures on Autogenous Shrinkage in Alkali-Activated Materials. IOP Conf. Ser. Mater. Sci. Eng. 2019, 583, 012023. [Google Scholar] [CrossRef]
  29. Bakharev, T.; Sanjayan, J.G.; Cheng, Y.-B. Effect of Admixtures on Properties of Alkali-Activated Slag Concrete. Cem. Concr. Res. 2000, 30, 1367–1374. [Google Scholar] [CrossRef]
  30. Tao, S.; Yumei, Y. Quantitative Analysis of Ettringite Formed in the Hydration Products of High-Alite Cements. Adv. Cem. Res. 2015, 27, 497–505. [Google Scholar] [CrossRef]
  31. Liu, J.; Hu, L.; Tang, L.; Zhang, E.Q.; Ren, J. Shrinkage Behaviour, Early Hydration and Hardened Properties of Sodium Silicate Activated Slag Incorporated with Gypsum and Cement. Constr. Build. Mater. 2020, 248, 118687. [Google Scholar] [CrossRef]
  32. Divvala, S.; Rani, M.S. Early Strength Properties of Geopolymer Concrete Composites: An Experimental Study. Mater. Today Proc. 2021, 47, 3770–3777. [Google Scholar] [CrossRef]
  33. Zaheer, M.; Khan, N.; Uddin, F.; Shaikh, A.; Hao, Y.; Hao, H. Synthesis of High Strength Ambient Cured Geopolymer Composite by Using Low Calcium Fly Ash. Constr. Build. Mater. 2016, 125, 809–820. [Google Scholar] [CrossRef]
  34. Rattanasak, U.; Chindaprasirt, P. Influence of NaOH Solution on the Synthesis of Fly Ash Geopolymer. Miner. Eng. 2009, 22, 1073–1078. [Google Scholar] [CrossRef]
  35. Pane, I.; Imran, I.; Budiono, B. Compressive Strength of Fly Ash-Based Geopolymer Concrete with a Variable of Sodium Hydroxide (NaOH) Solution Molarity. MATEC Web Conf. 2018, 147, 01004. [Google Scholar] [CrossRef] [Green Version]
  36. Hardjasaputra, H.; Cornelia, M.; Gunawan, Y.; Surjaputra, I.V.; Lie, H.A.; Pranata Ng, G. Study of Mechanical Properties of Fly Ash-Based Geopolymer Concrete. IOP Conf. Ser. Mater. Sci. Eng. 2019, 615, 012009. [Google Scholar] [CrossRef]
  37. Talha Ghafoor, M.; Khan, Q.S.; Qazi, A.U.; Sheikh, M.N.; Hadi, M.N.S. Influence of Alkaline Activators on the Mechanical Properties of Fly Ash Based Geopolymer Concrete Cured at Ambient Temperature. Constr. Build. Mater. 2021, 273, 121752. [Google Scholar] [CrossRef]
  38. Gómez-Casero, M.A.; de Dios-Arana, C.; Bueno-Rodríguez, J.S.; Pérez-Villarejo, L.; Eliche-Quesada, D. Physical, Mechanical and Thermal Properties of Metakaolin-Fly Ash Geopolymers. Sustain. Chem. Pharm. 2022, 26, 100620. [Google Scholar] [CrossRef]
  39. Zhang, H.Y.; Kodur, V.; Cao, L.; Qi, S.L. Fiber Reinforced Geopolymers for Fire Resistance Applications. Procedia Eng. 2014, 71, 153–158. [Google Scholar] [CrossRef] [Green Version]
  40. Cao, Y.F.; Tao, Z.; Pan, Z.; Wuhrer, R. Effect of Calcium Aluminate Cement on Geopolymer Concrete Cured at Ambient Temperature. Constr. Build. Mater. 2018, 191, 242–252. [Google Scholar] [CrossRef]
  41. Liew, Y.-M.; Cheng-Yong, H.; Al Bakri, M.; Hussin, K. Structure and Properties of Clay-Based Geopolymer Cements: A Review. Prog. Mater. Sci. 2016, 83, 595–629. [Google Scholar] [CrossRef]
  42. Juengsuwattananona, K.; Winnefeldb, F.; Chindaprasirtc, P.; Pimraksa, K. Correlation between Initial SiO2/Al2O3, Na2O/Al2O3, Na2O/SiO2 and H2O/Na2O Ratios on Phase and Microstructure of Reaction Products of Metakaolin-Rice Husk Ash Geopolymer. Constr. Build. Mater. 2019, 226, 406–417. [Google Scholar] [CrossRef]
  43. Qu, F.; Li, W.; Wang, K.; Zhang, S.; Sheng, D. Performance Deterioration of Fly Ash/Slag-Based Geopolymer Composites Subjected to Coupled Cyclic Preloading and Sulfuric Acid Attack. J. Clean. Prod. 2021, 321, 128942. [Google Scholar] [CrossRef]
  44. Kozub, B.; Castro-Gomes, J. An Investigation of the Ground Walnut Shells’ Addition Effect on the Properties of the Fly Ash-Based Geopolymer. Materials 2022, 15, 3936. [Google Scholar] [CrossRef] [PubMed]
  45. Rojo-López, G.; González-Fonteboa, B.; Martínez-Abella, F.; González-Taboada, I. Rheology, Durability, and Mechanical Performance of Sustainable Self-Compacting Concrete with Metakaolin and Limestone Filler. Case Stud. Constr. Mater. 2022, 17, e01143. [Google Scholar] [CrossRef]
  46. Weimann, K.; Adam, C.; Buchert, M.; Sutter, J. Environmental Evaluation of Gypsum Plasterboard Recycling. Minerals 2021, 11, 101. [Google Scholar] [CrossRef]
  47. Ibrahim, Y.E.; Adamu, M.; Marouf, M.L.; Ahmed, O.S.; Drmosh, Q.A.; Malik, M.A. Mechanical Performance of Date-Palm-Fiber-Reinforced Concrete Containing Silica Fume. Buildings 2022, 12, 1642. [Google Scholar] [CrossRef]
  48. Golewski, G.L. Combined Effect of Coal Fly Ash (CFA) and Nanosilica (NS) on the Strength Parameters and Microstructural Properties of Eco-Friendly Concrete. Energies 2023, 16, 452. [Google Scholar] [CrossRef]
  49. Alfimova, N.; Pirieva, S.; Levickaya, K.; Kozhukhova, N.; Elistratkin, M. The Production of Gypsum Materials with Recycled Citrogypsum Using Semi-Dry Pressing Technology. Recycling 2023, 8, 34. [Google Scholar] [CrossRef]
  50. Kozhukhova, N.I.; Alfimova, N.I.; Kozhukhova, M.I.; Nikulin, I.S.; Glazkov, R.A.; Kolomytceva, A.I. The Effect of Recycled Citrogypsum as a Supplementary Mineral Additive on the Physical and Mechanical Performance of Granulated Blast Furnace Slag-Based Alkali-Activated Binders. Recycling 2023, 8, 22. [Google Scholar] [CrossRef]
  51. Nawaukkaratharnant, N. Utilization of Gypsum-Bonded Investment Mold Waste from Jewelry and Accessory Industry as Raw Material for Construction Materials Using Geopolymer Technology. Rep. Grant-Support. Res. Asahi Glass Found. 2021, 89, 1–12. [Google Scholar]
  52. An, Q.; Pan, H.; Zhao, Q.; Du, S.; Wang, D. Strength Development and Microstructure of Recycled Gypsum-Soda Residue-GGBS Based Geopolymer. Constr. Build. Mater. 2022, 331, 127312. [Google Scholar] [CrossRef]
  53. Abadel, A.A.; Alghamdi, H.; Alharbi, Y.R.; Alamri, M.; Khawaji, M.; Abdulaziz, M.A.M.; Nehdi, M.L. Investigation of Alkali-Activated Slag-Based Composite Incorporating Dehydrated Cement Powder and Red Mud. Materials 2023, 16, 1551. [Google Scholar] [CrossRef]
  54. Ricciotti, L.; Occhicone, A.; Ferone, C.; Cioffi, R.; Tarallo, O.; Roviello, G. Development of Geopolymer-Based Materials with Ceramic Waste for Artistic and Restoration Applications. Materials 2022, 15, 8600. [Google Scholar] [CrossRef]
  55. Mohammed, A.A.; Ahmed, H.U.; Mosavi, A. Survey of Mechanical Properties of Geopolymer Concrete: A Comprehensive Review and Data Analysis. Materials 2021, 14, 4690. [Google Scholar] [CrossRef]
  56. Deb, P.S.; Nath, P.; Sarker, P.K. Drying Shrinkage of Slag Blended Fly Ash Geopolymer Concrete Cured at Room Temperature. Procedia Eng. 2015, 125, 594–600. [Google Scholar] [CrossRef] [Green Version]
  57. Alnkaa, A.; Yaprak, H.; Selcuk, M.; Kaplan, G. Effect of Different Cure Conditions on the Shrinkage of Geopolymer Mortar. Int. J. Eng. Res. Dev. 2018, 14, 51–55. [Google Scholar]
  58. Lu, T.; Li, Z.; van Breugel, K. Modelling of Autogenous Shrinkage of Hardening Cement Paste. Constr. Build. Mater. 2020, 264, 120708. [Google Scholar] [CrossRef]
  59. Katare, V.D.; Madurwar, M.V. Experimental Characterization of Sugarcane Biomass Ash—A Review. Constr. Build. Mater. 2017, 152, 1–15. [Google Scholar] [CrossRef]
  60. EN 12457-2:2002; Characterisation of Waste—Leaching—Compliance Test for Leaching of Granular Waste Materials and Sludges. Comite Europeen de Normalisation: Brussels, Belgium, 2002.
  61. Levien, L.; Prewitt, C.T.; Weidner, D.J. Structure and Elastic Properties of Quartz at Pressure P = 1 Atm. Am. Mineral. 1980, 65, 920–930. [Google Scholar]
  62. Balzar, D.; Ledbetter, H. Crystal Structure and Compressibility of 3:2 Mullite. Am. Mineral. 1993, 78, 1192–1196. [Google Scholar]
  63. Goetz-Neunhoeffer, F.; Neubauer, J. Refined Ettringite (Ca6Al2(SO4)3(OH)12*26H2O) Structure for Quantitative X-Ray Diffraction Analysis. Powder Diffr. 2006, 21, 4–11. [Google Scholar] [CrossRef]
  64. Schofield, P.F.; Knight, K.S.; Stretton, I.C. Thermal Expansion of Gypsum Investigated by Neutron Powder Diffraction T = 4.2 K. Am. Mineral. 1996, 81, 847–851. [Google Scholar] [CrossRef]
  65. Abolhasani, A.; Aslani, F.; Samali, B.; Ghaffar, S.H.; Fallahnejad, H.; Banihashemi, S. Silicate Impurities Incorporation in Calcium Aluminate Cement Concrete: Mechanical and Microstructural Assessment. Adv. Appl. Ceram. 2021, 120, 104–116. [Google Scholar] [CrossRef]
  66. Pacewska, B.; Nowacka, M.; Aleknevičius, M.; Antonovič, V. Early Hydration of Calcium Aluminate Cement Blended with Spent FCC Catalyst at Two Temperatures. Procedia Eng. 2013, 57, 844–850. [Google Scholar] [CrossRef] [Green Version]
  67. Chen, B.; Zhang, Y.; Chen, Q.; Yang, F.; Liu, X.; Wu, J.; Wang, P. Effect of Mineral Composition and w/c Ratios to the Growth of AFt during Cement Hydration by In-Situ Powder X-Ray Diffraction Analysis. Materials 2020, 13, 4963. [Google Scholar] [CrossRef]
Figure 1. Setting times of the specimens 112. Colours indicate main raw materials; solid lines indicate specimens without gypsum and dotted lines indicate specimens with gypsum.
Inorganics 11 00298 g001
Figure 2. Plastic shrinkage of the specimens at 7 d (blue) and 28 d (orange).
Inorganics 11 00298 g002
Figure 3. Effect of recycled gypsum on plastic shrinkage of specimens (28 d). Green columns indicate specimens without gypsum and yellow columns indicate specimens with gypsum.
Inorganics 11 00298 g003
Figure 4. Drying shrinkage of specimens and effect of recycled gypsum on it. Green columns indicate specimens without gypsum and yellow columns indicate specimens with gypsum.
Inorganics 11 00298 g004
Figure 5. Total shrinkage of the specimens 113, and proportions of plastic shrinkage (blue) and drying shrinkage (orange).
Inorganics 11 00298 g005
Figure 6. Cracks of specimens caused by plastic shrinkage (above) and drying shrinkage (below).
Inorganics 11 00298 g006
Figure 7. Flexural strength of the specimens at 7 d (blue) and 28 d (orange).
Inorganics 11 00298 g007
Figure 8. Effect of the recycled gypsum on flexural strength of specimens (28 d). Green columns indicate specimens without gypsum and yellow columns indicate specimens with gypsum.
Inorganics 11 00298 g008
Figure 9. Compressive strength of the specimens at 7 d (blue) and 28 d (orange). * Compressive strength of the specimen exceeded the limit of the device.
Inorganics 11 00298 g009
Figure 10. Effect of the recycled gypsum on compressive strength of the specimens (28 d). Green columns indicate specimens without gypsum and yellow columns indicate specimens with gypsum. * Compressive strength of the specimen exceeded the limit of the device.
Inorganics 11 00298 g010
Figure 11. Amount of leached aluminium from the specimens at 7 d (blue) and 28 d (orange).
Inorganics 11 00298 g011
Figure 12. Amount of leached silicon from the specimens at 7 d (blue) and 28 d (orange).
Inorganics 11 00298 g012
Figure 13. Photometrically measured amount of leached calcium from the specimens at 7 d (blue) and 28 d (orange). Specimens 14 are missing because the amount of calcium leached from them was negligible.
Inorganics 11 00298 g013
Figure 14. XRD of specimens 1 and 2.
Inorganics 11 00298 g014
Figure 15. XRD of specimens 3 and 4.
Inorganics 11 00298 g015
Figure 16. SEM figure of specimen 8 (a) and specimen 4 (b).
Inorganics 11 00298 g016
Disclaimer/Publisher’s Note: The statements, opinions and data contained in all publications are solely those of the individual author(s) and contributor(s) and not of MDPI and/or the editor(s). MDPI and/or the editor(s) disclaim responsibility for any injury to people or property resulting from any ideas, methods, instructions or products referred to in the content.

