Article

A Combination of Ruthenium Complexes and Photosensitizers to Treat Colorectal Cancer

1
Univ. Limoges, LABCiS, UR 22722, Faculté de Pharmacie, F-87000 Limoges, France
2
Institute of Chemistry, University of Neuchatel, Avenue de Bellevaux 51, CH-2000 Neuchatel, Switzerland
3
Université de Limoges, CNRS, Inserm, CHU Limoges, BISCEm, UAR 2015, US 42, F-87000 Limoges, France
4
Department of Chemistry and Biochemistry, Lebanese University, Beyrouth 21219, Lebanon
5
Doctoral School of Sciences and Technology, Lebanese University, Hadath El Jebbeh, Beyrouth 21219, Lebanon
*
Authors to whom correspondence should be addressed.
Inorganics 2023, 11(12), 451; https://doi.org/10.3390/inorganics11120451
Submission received: 26 September 2023 / Revised: 9 November 2023 / Accepted: 16 November 2023 / Published: 22 November 2023
(This article belongs to the Special Issue Rational Design of Pharmacologically Active Metal-Based Compounds)

Abstract

:
Treatment regimens are regularly evolving alongside novel therapies and drugs. Such evolution is necessary to circumvent resistance mechanisms and to give patients the best possible health care. When dealing with cancer, most regimens involve multiple treatments (surgery, radiation therapy, chemotherapy, immunotherapy, etc.). The purpose of this study was to associate in a single compound metal-based drugs and photosensitizers to combine chemotherapy and photodynamic therapy. Two arene–ruthenium tetrapyridylporphyrin compounds (2H-TPyP-arene-Ru and Zn-TPyP-arene-Ru) have been synthesized and evaluated on two colorectal cancer cell lines (HCT116 and HT-29). Their cytotoxicity and phototoxicity have been evaluated. In addition, the anticancer mechanism and the cell death process mediated by the two compounds were studied. The results showed that the two arene–ruthenium photosensitizer-containing complexes have a strong phototoxic effect after photoactivation. The 2H-TPyP-arene-Ru complex induced outstanding cytotoxicity when compared to the Zn-TPyP-arene-Ru analogue. Moreover, under light, these two arene–ruthenium photosensitizers induce an apoptotic process in human colorectal cancer cell lines.

Graphical Abstract

1. Introduction

Cancer is a group of diseases that refer to abnormal cell division leading to uncontrolled cell growth and proliferation, and when occurring in the colon or rectum, the disease is defined as colorectal cancer (CRC) [1]. In 2022, the World Health Organization (WHO) and the International Agency for Research on Cancer (IARC) have estimated that CRC was the third most common cancer worldwide, with approximately 1.9 million cases annually, and the second leading cause of death for oncological reasons, with 900,000 deaths globally [2,3]. CRC mainly originates from a benign tumor or adenomatous polyp that evolves into a dangerous malignant tumor [4]. This transformation is characterized by the capacity of the cells to infiltrate the different histological layers of the organs [5]. The most dangerous stage is the metastatic phase, when the cancer cells have acquired the ability to detach from the initial tumor and invade other organs through the blood or lymph, and create secondary tumors [6]. Today, CRC treatment is at a crossroad, and its strategies involve many conventional and advanced scientific methods. These therapies incorporate surgery/polypectomy, radiation therapy, chemotherapy, combination therapy, immunotherapy, and targeted therapy [7,8,9]. Unfortunately, these methods are still insufficient for the complete cure of advanced CRC. Researchers have tried to provide modern alternative approaches to fight CRC resistance mechanisms [10]. Over the past decade, significant progress in CRC treatments has been achieved through the development of novel drugs and elaborate treatment protocols. However, the increasing resistance of tumor cells toward these new drugs and persistent side effects due to their toxicity on healthy tissues make it imperative to add other options to CRC treatment regimens.
Photodynamic therapy (PDT) has attracted widespread attention in recent years as a non-invasive and highly selective approach for cancer treatment [11,12]. The molecular mechanism of PDT involves the photoactivation of a photosensitizer (PS) at an appropriate wavelength in the presence of oxygen molecules [13,14,15]. In effect, PDT exploits the potency of visible light to generate cytotoxic agents in a spatially and temporally controlled manner to directly damage the targeted tumor cells and tissues [16,17]. PDT is mainly associated with the production of reactive oxygen species (ROS), which are involved in cell death [18,19]. For this to happen, the PS must absorb at least one photon to be promoted to a sufficiently long-lived excited state and then to induce photodynamic reactions in an oxygenated environment [20]. Under the effect of light irradiation, the PS is activated and goes from a ground to an excited state [21,22]. At this stage, the PS is very unstable and loses its excess energy either directly or via an excited triplet state intermediate [23]. The excited triplet state will slowly return to the ground state via photochemical reactions of type I or II. Both reactions may take place simultaneously, their kinetics being strongly correlated to the presence of oxygen, the substrate concentration, and the nature of the PS. In type I reactions, the free radicals may further react with oxygen to produce ROS [24,25]. Superoxide anion initially produced via the type I pathway by monovalent reduction does not cause oxidative damage but reacts with itself to generate oxygen and hydrogen peroxide. However, in type II reactions, the excited PS transfers its energy directly to molecular oxygen to form singlet oxygen. These highly cytotoxic ROS can oxidize a variety of biomolecules, inducing an acute stress response and triggering a series of redox signaling pathways, generally leading to cell death [26,27,28]. Currently, the most widely used PSs in PDT are tetrapyrrole derivatives such as porphyrins, chlorins, bacteriochlorins, and phthalocyanines. Nevertheless, the main inconveniences of these planar aromatic PSs are their low water solubility, which limits intravenous administration, their poor photophysical properties due to PS aggregation, and their low tumor selectivity, thus limiting their use in the clinic overall [29].
Chemotherapy is essential to cancer treatments. Indeed, platinum-based drugs like oxaliplatin and carboplatin, which remain at the forefront of CRC treatment regimens, are used on an everyday basis [30]. Unfortunately, this type of metal-based drug has shown significant side effects, which has led to the search for new and less toxic anticancer metal-based agents [31]. Among other metal-based drugs, ruthenium (Ru) derivatives have received much attention due to their interesting properties [32]. And some Ru-based chemotherapeutics have already entered clinical trials [33]. Moreover, about 15 years ago, combining PDT and chemotherapy with Ru-based complexes was introduced [34,35], and today, such a Ru complex, TLD1433, is in clinical trials [36]. TLD1433 is a cationic bis(4,4′-dimethyl-2,2′-bipyridine) (dmbp) and 2-(2,2′:5′,2″-terthiophene-5-yl)-1,3,7,8-tetraaza-1H-cyclopenta[l]phenanthrene (ip-3t) Ru(II) complex with the general formula [Ru(dmbp)2(ip-3t)]2+. This complex exploits the rich photophysical properties of polypyridyl Ru-based complexes. Upon photoactivation of the Ru-center, an intra-ligand charge transfer (ILCT) takes place, which generates 1O2. This ruthenium complex efficiently combines photochemotherapy and PDT in a single molecule.
Recently, we have proposed another strategy to associate PSs and Ru-based complexes in a single molecule, using a coordination self-assembly process [37]. In these systems, two tetrapyridylporphyrin units are linked by four arene-Ru clips (Figure 1). Such octanuclear complexes allow the internalization of the PS to cells, and they show moderate dark cytotoxicity on ovarian cancer cell lines (≈8 μM) [38]. Herein, we are looking at the possibility of using these metalla-assemblies to treat CRC with a combination of PDT and chemotherapy. Therefore, we have verified whether the photoactivity of the PS has been modified or not when it is part of a metalla-assembly by investigating the anticancer effect of the functionalized 2H-TPyP and Zn-TPyP with arene-Ru complexes on human HCT116 and HT-29 colorectal cancer cell lines. Then, to better understand the cell death process involved, we examined the cell cycle distribution, phosphatidylserines externalization, as well as caspase-3 activation, poly-ADP ribose polymerase (PARP) cleavage, and DNA fragmentation. Subsequently, consistent with other PDT studies, our results demonstrated that, once photoactivated, 2H-TPyP-arene-Ru and Zn-TPyP-arene-Ru assemblies generate cellular ROS production and achieve their anticancer effects through an apoptotic process.

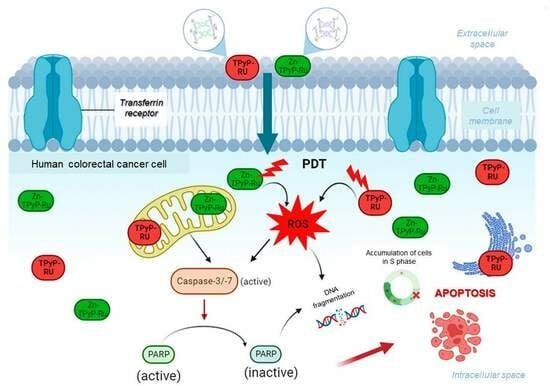
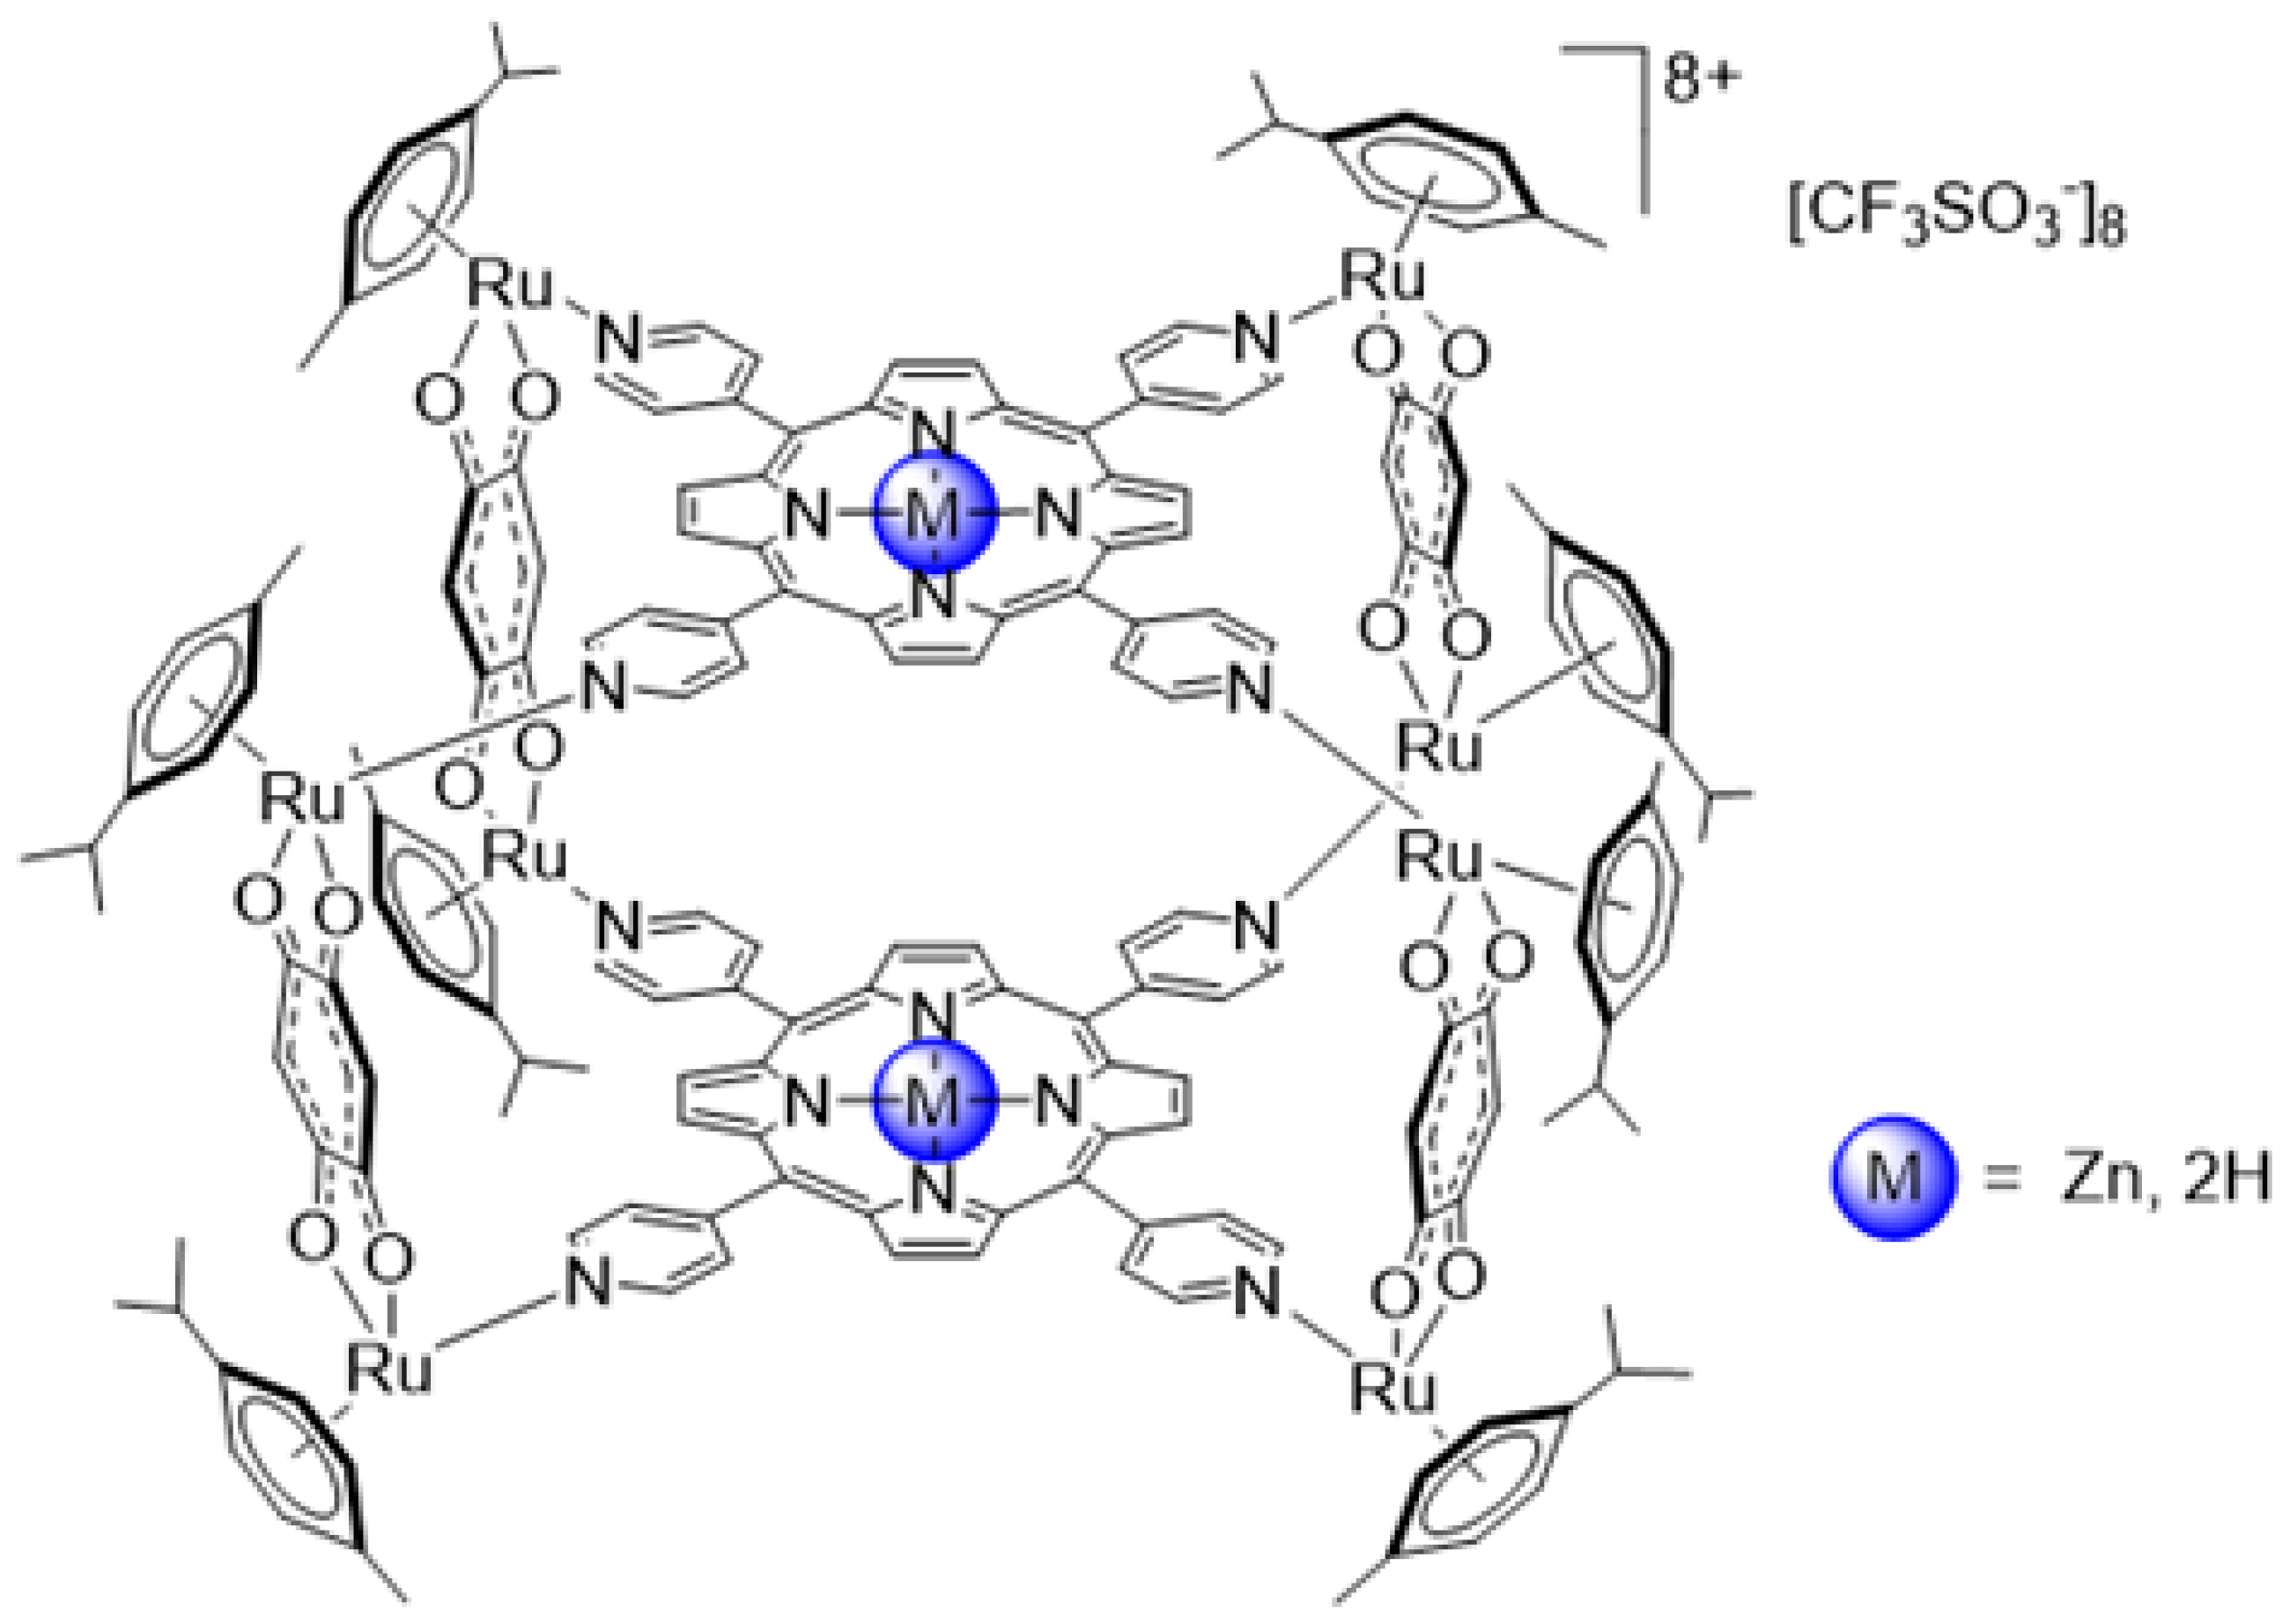
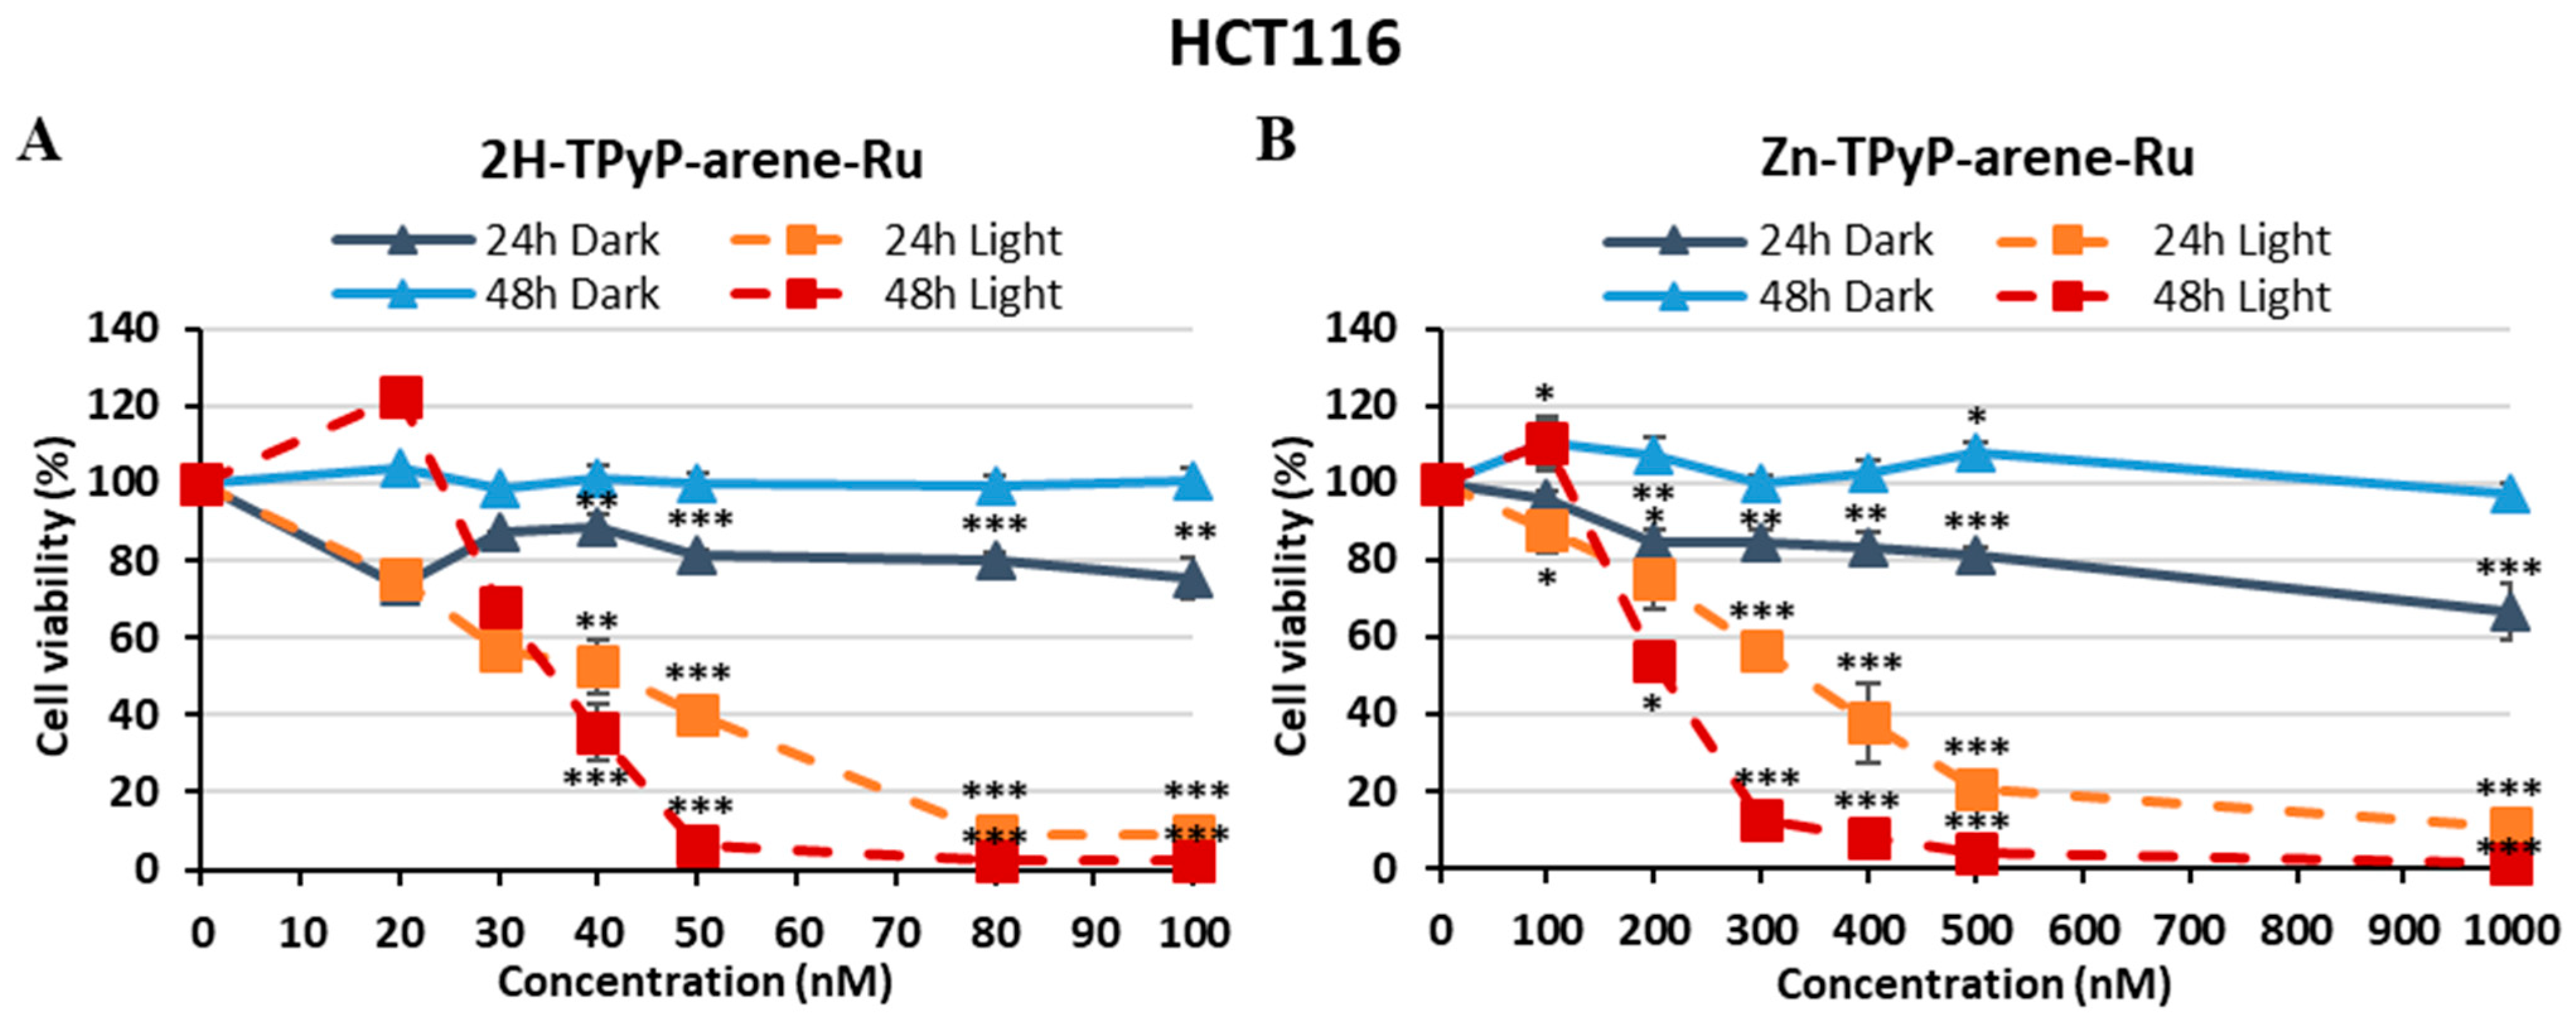
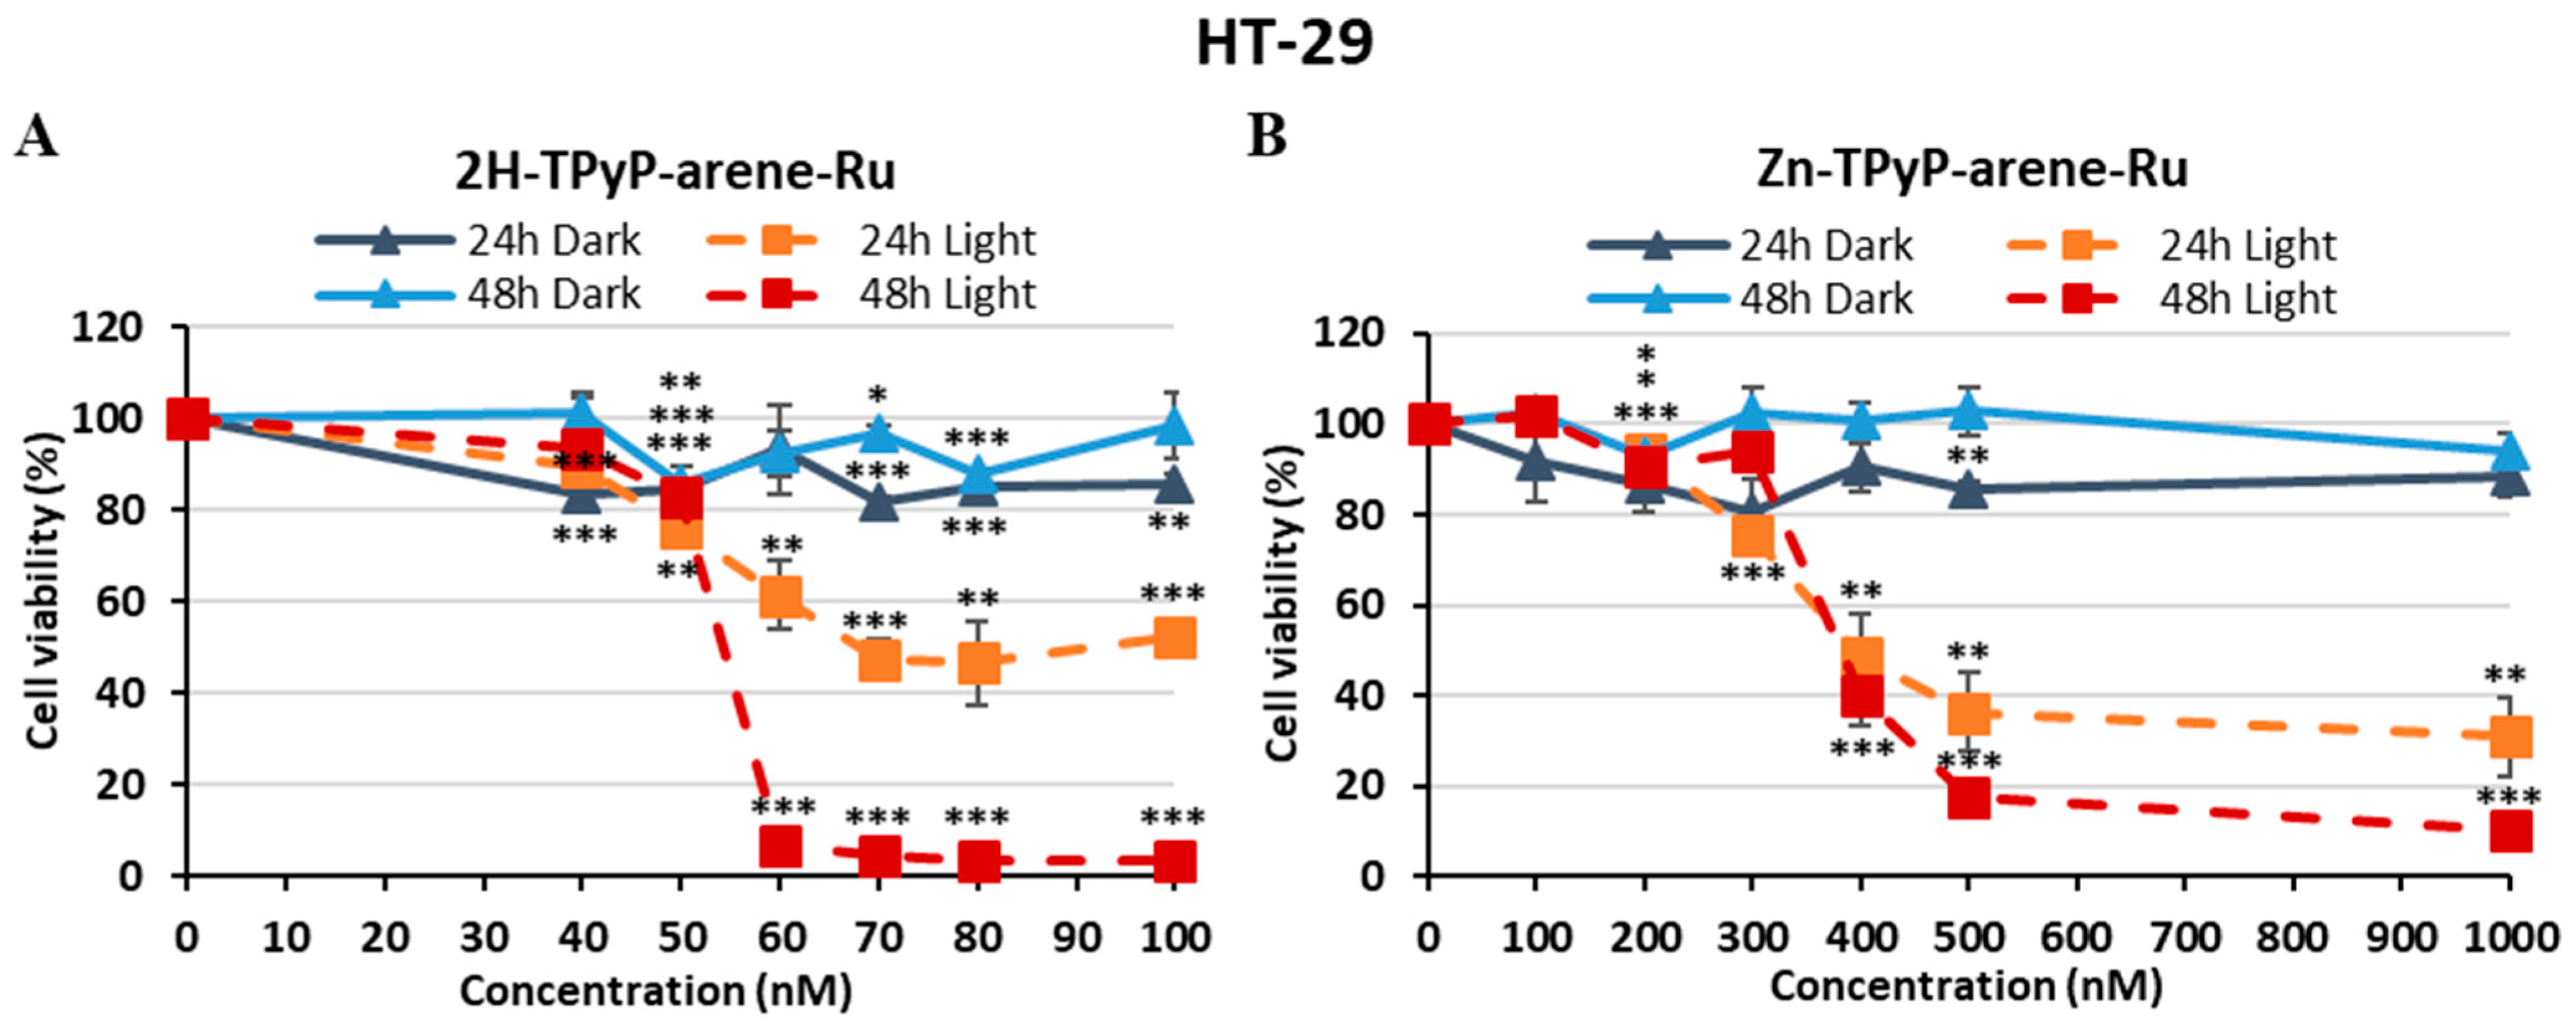
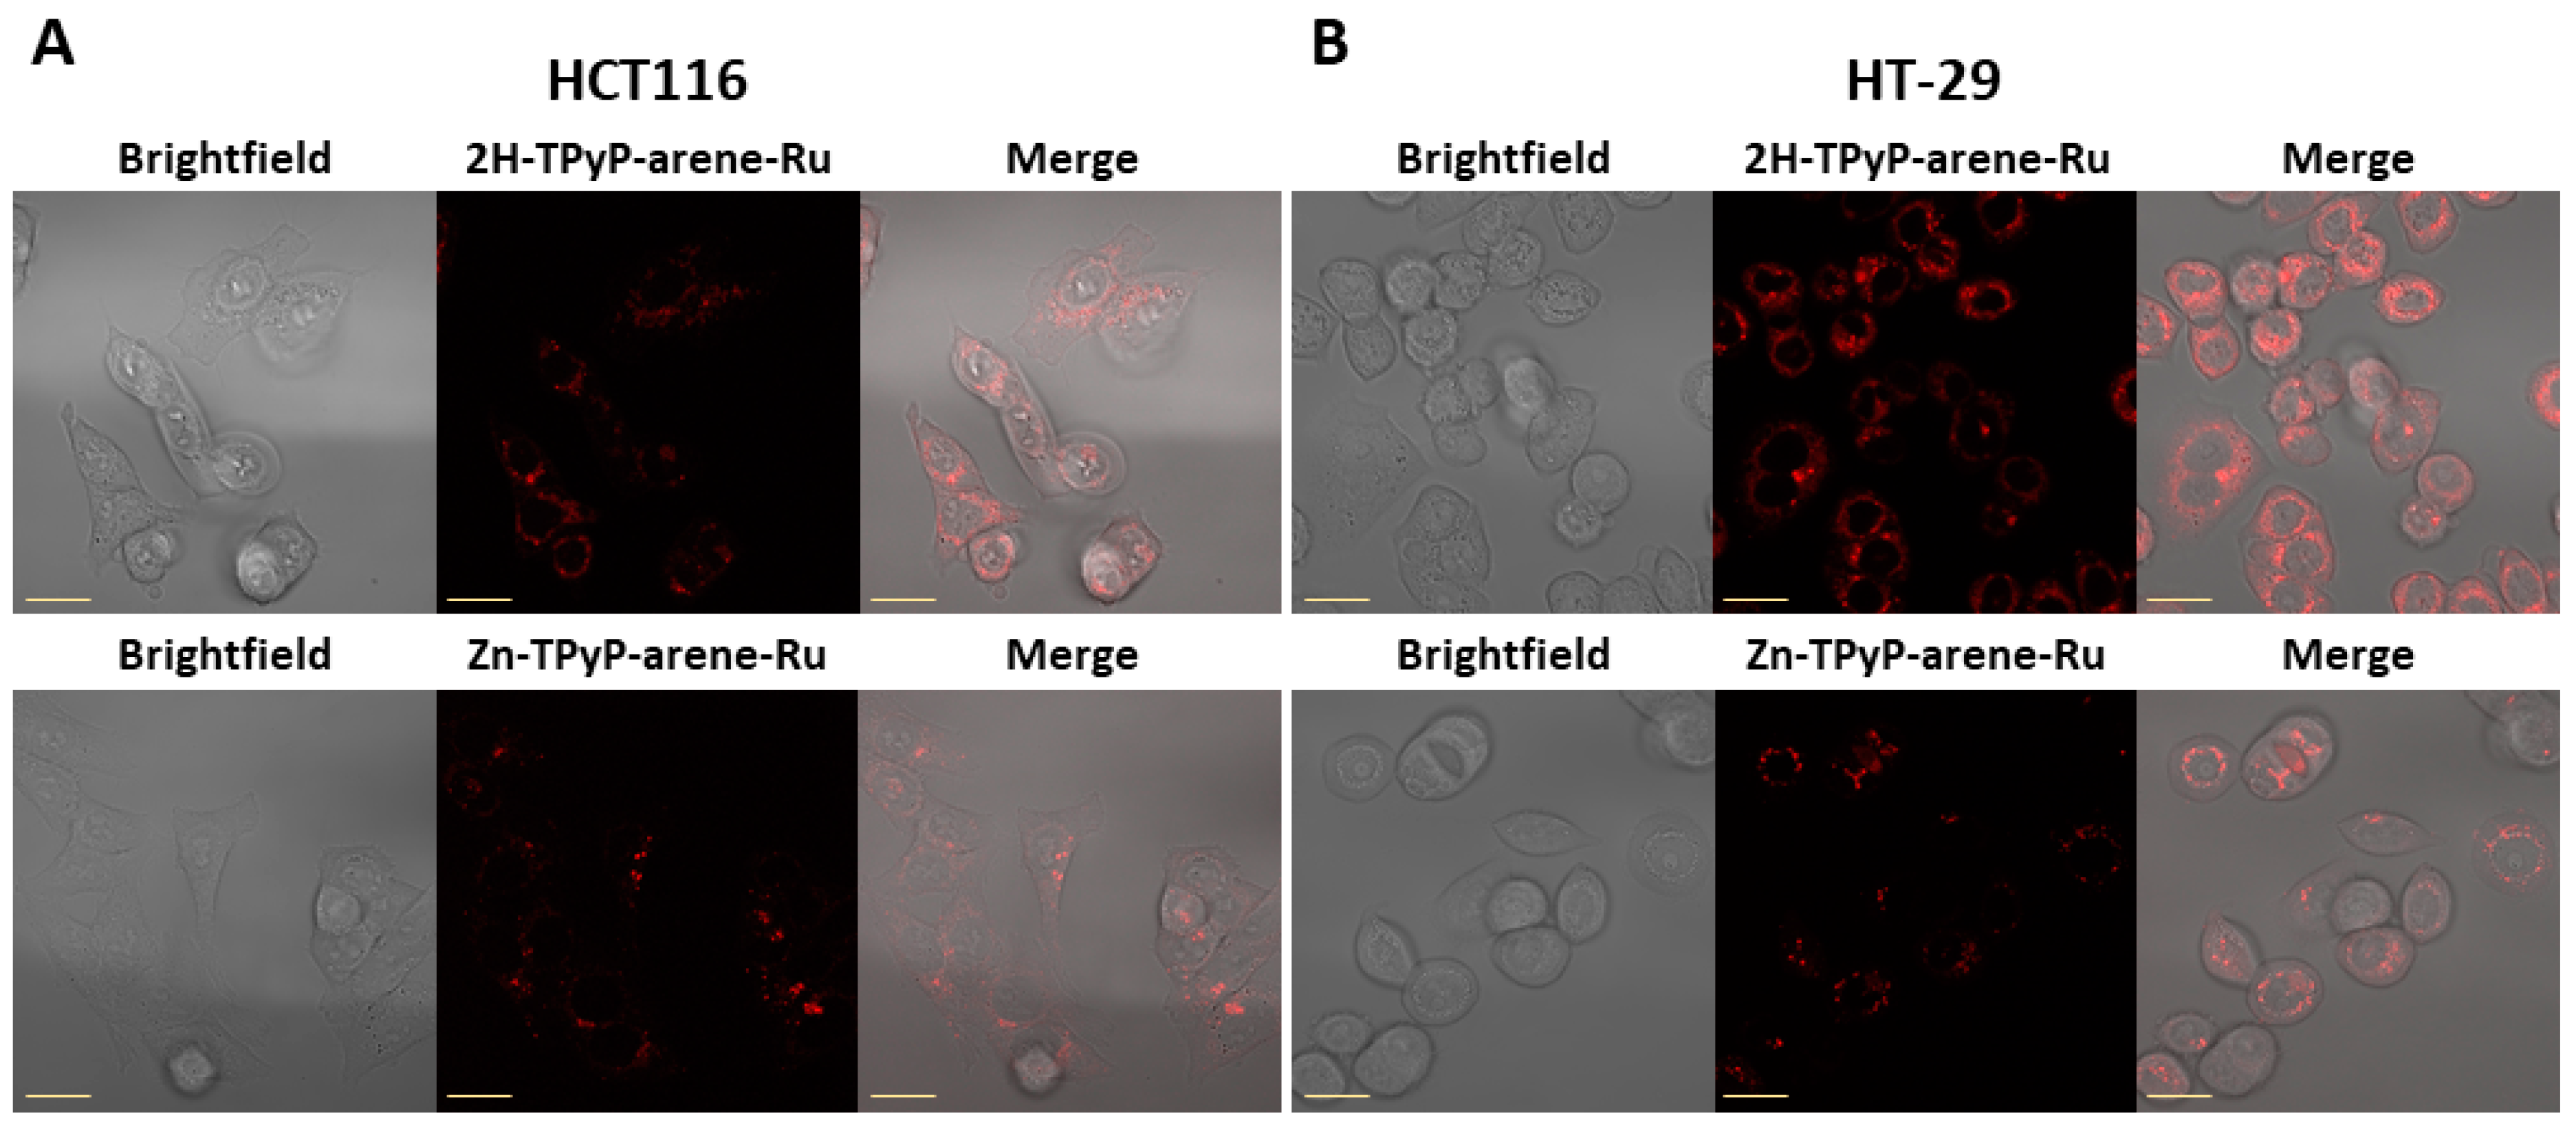
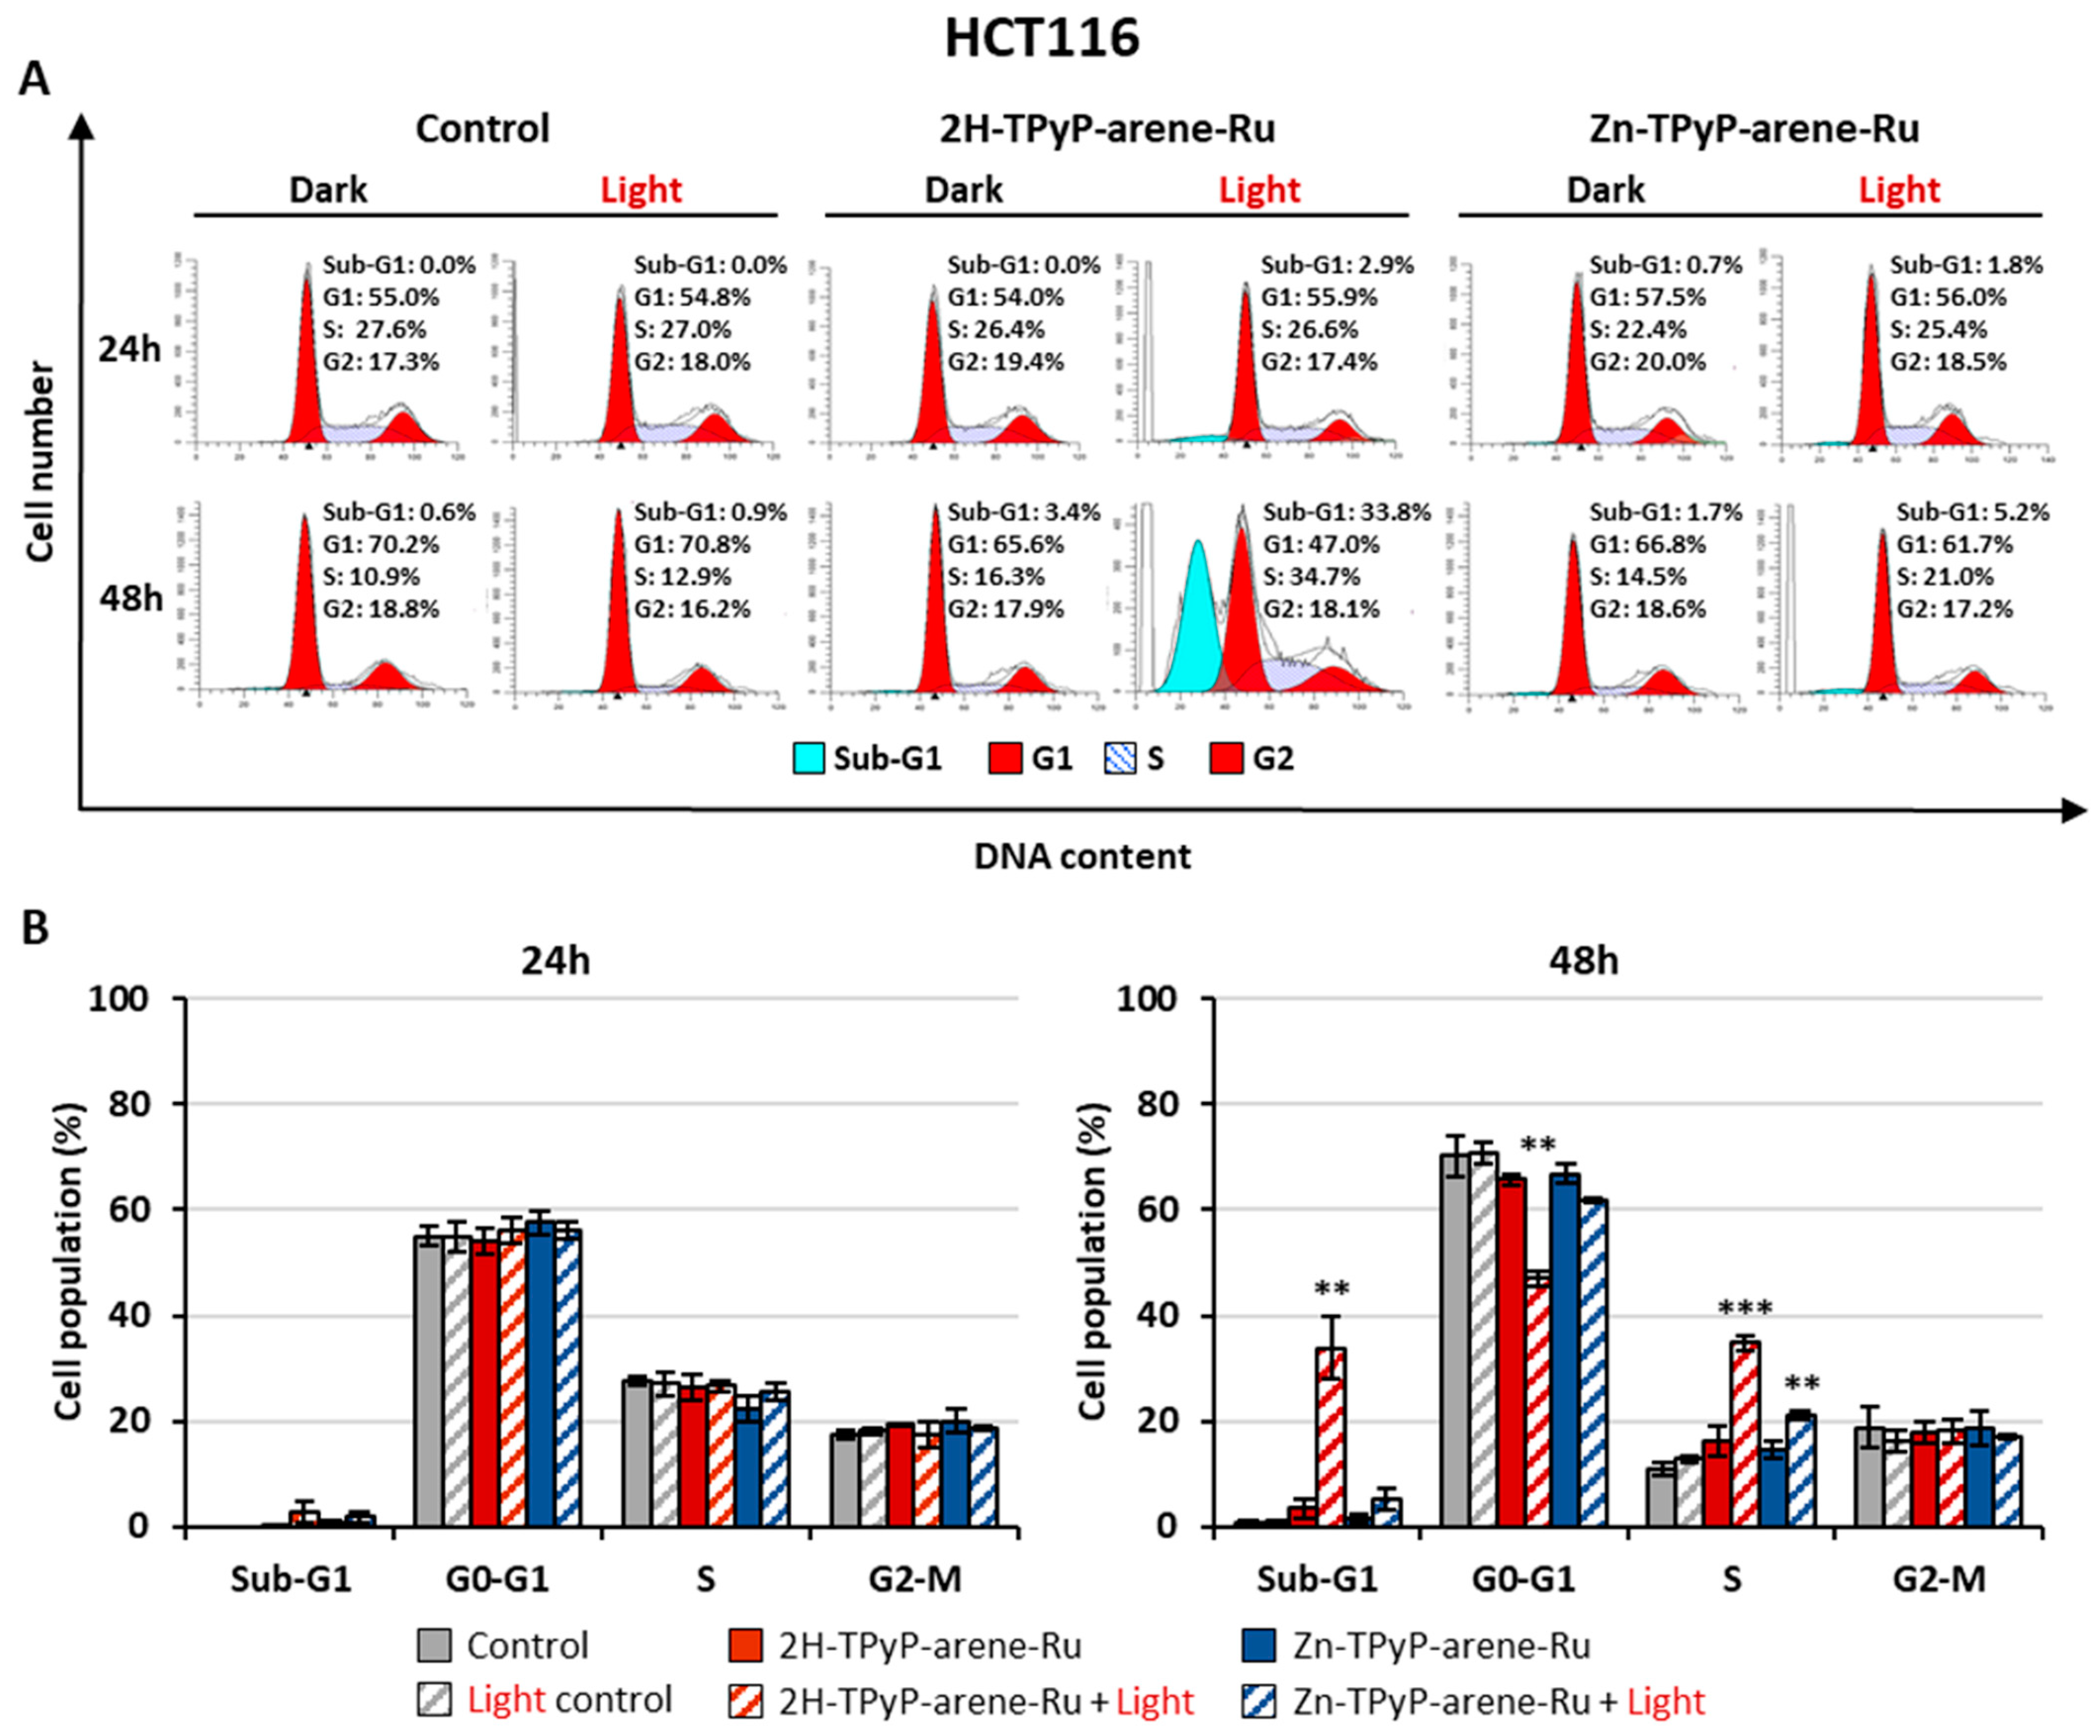
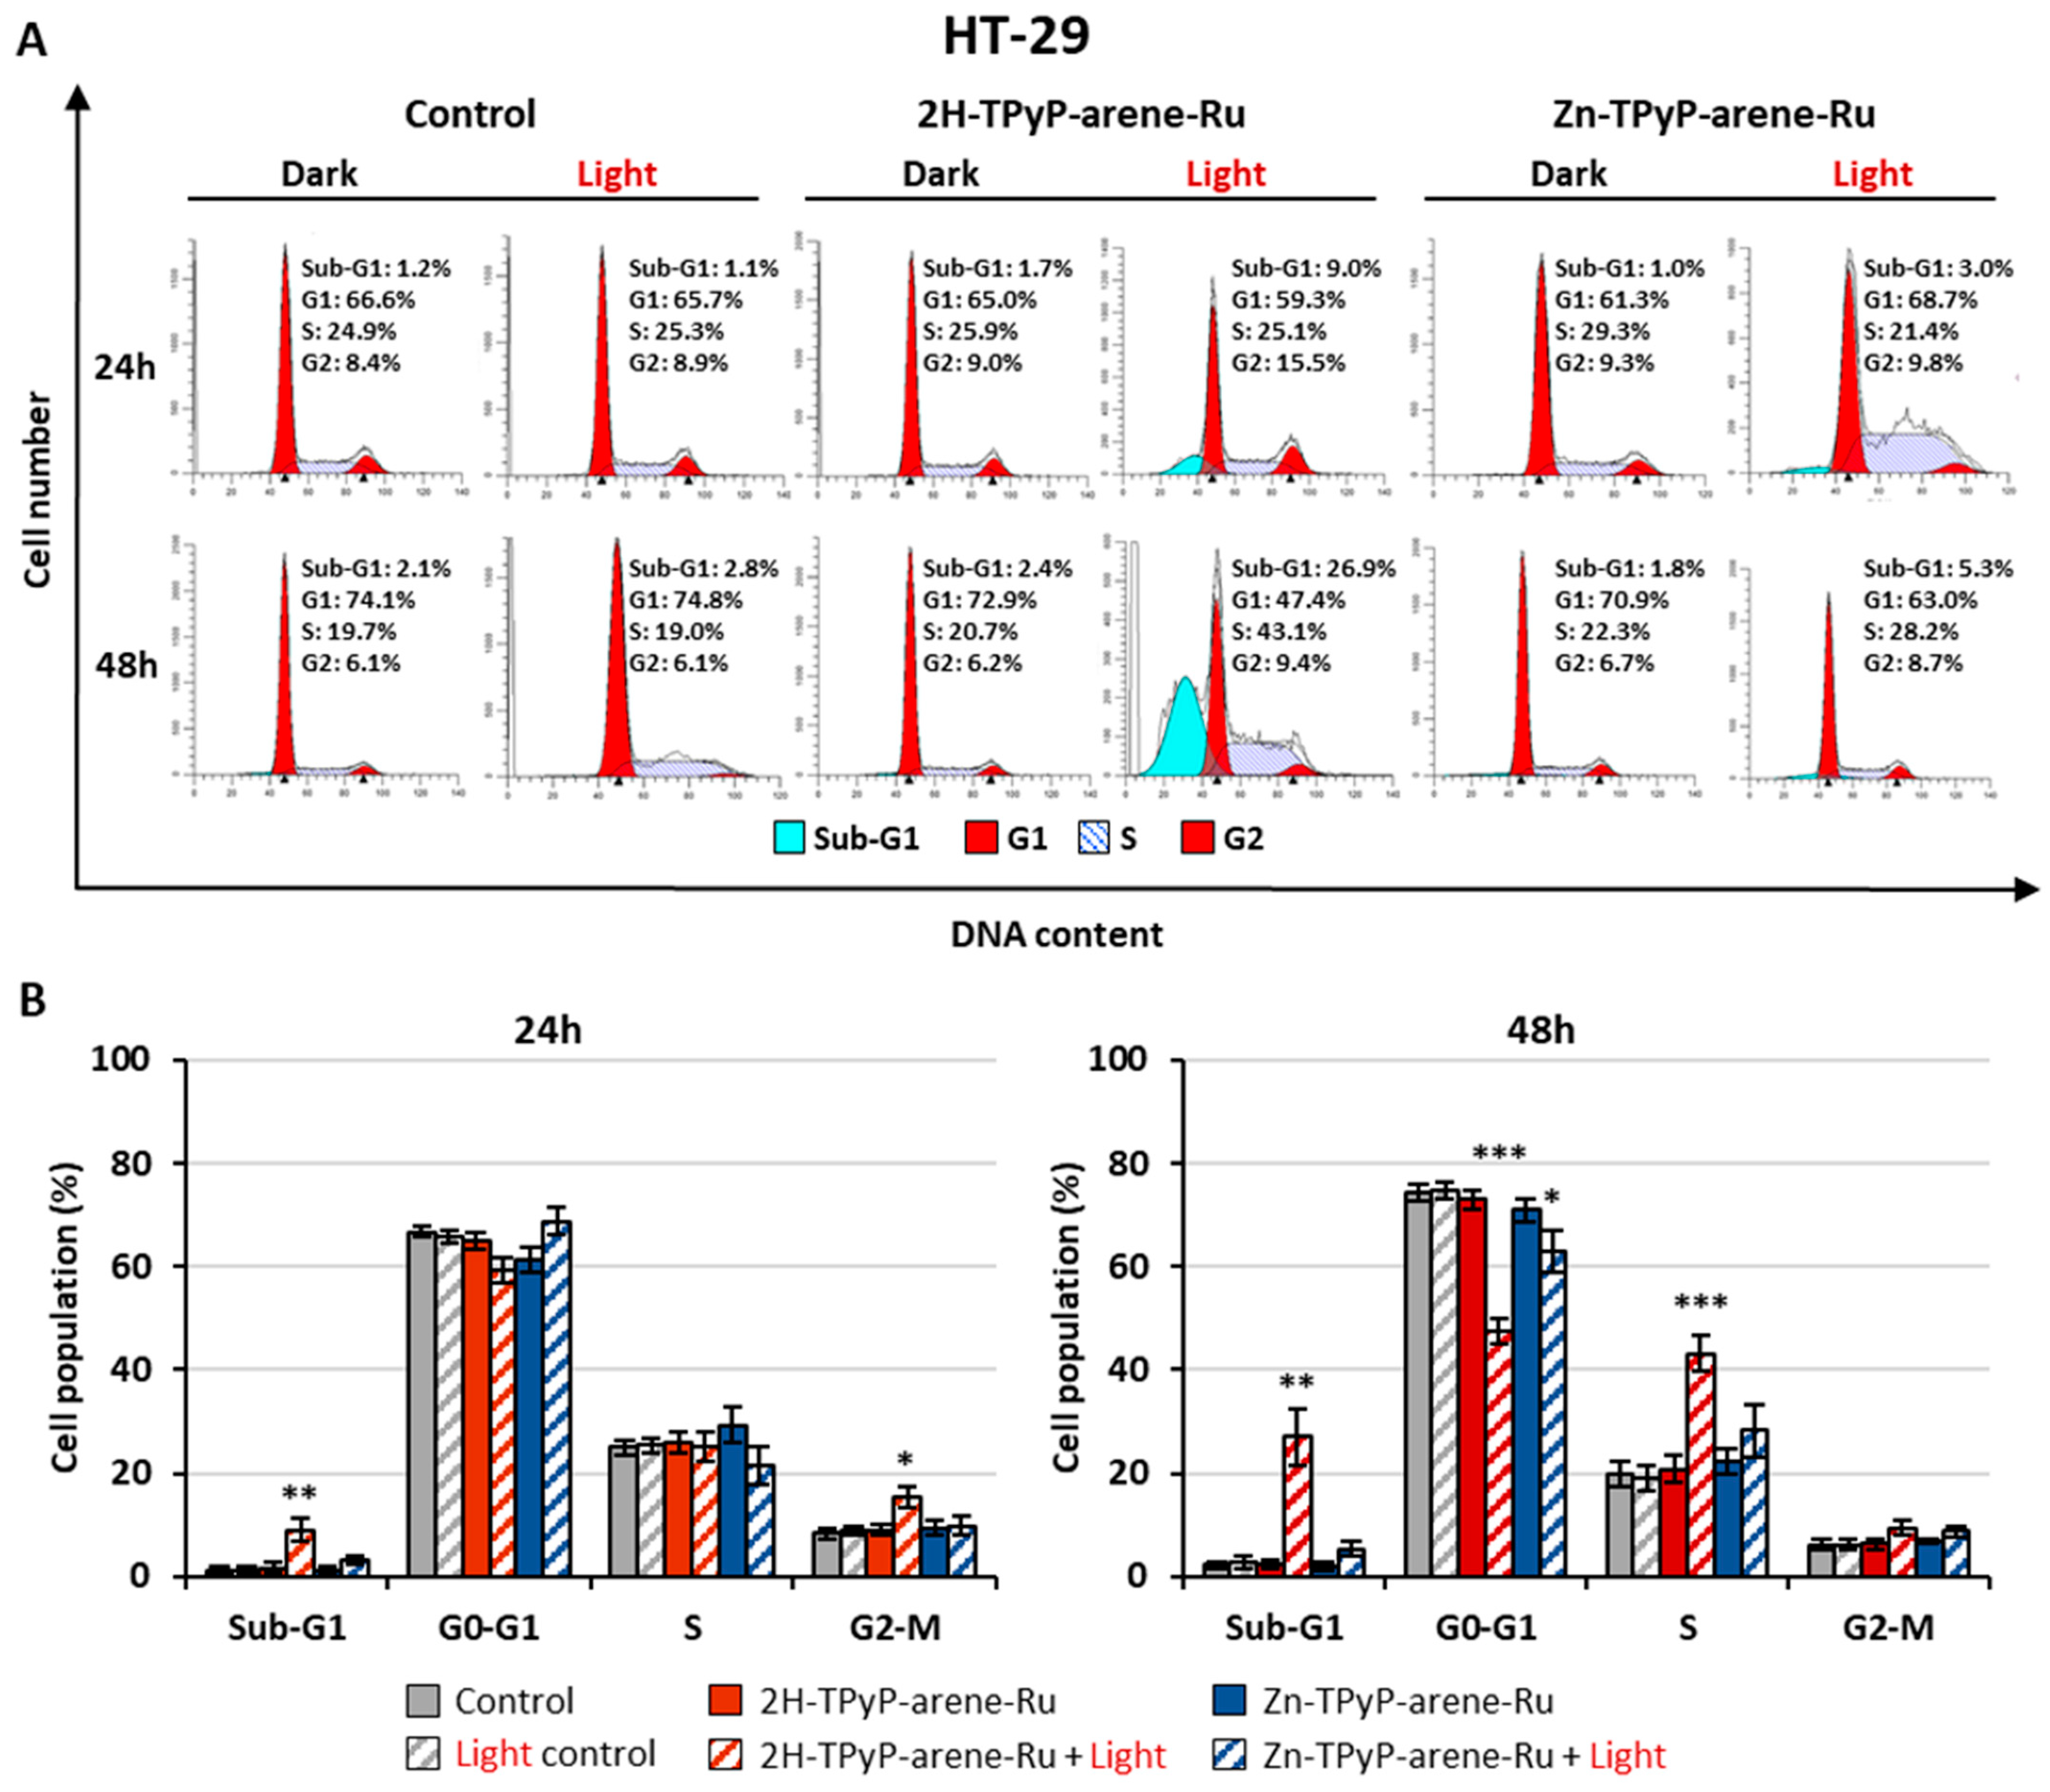
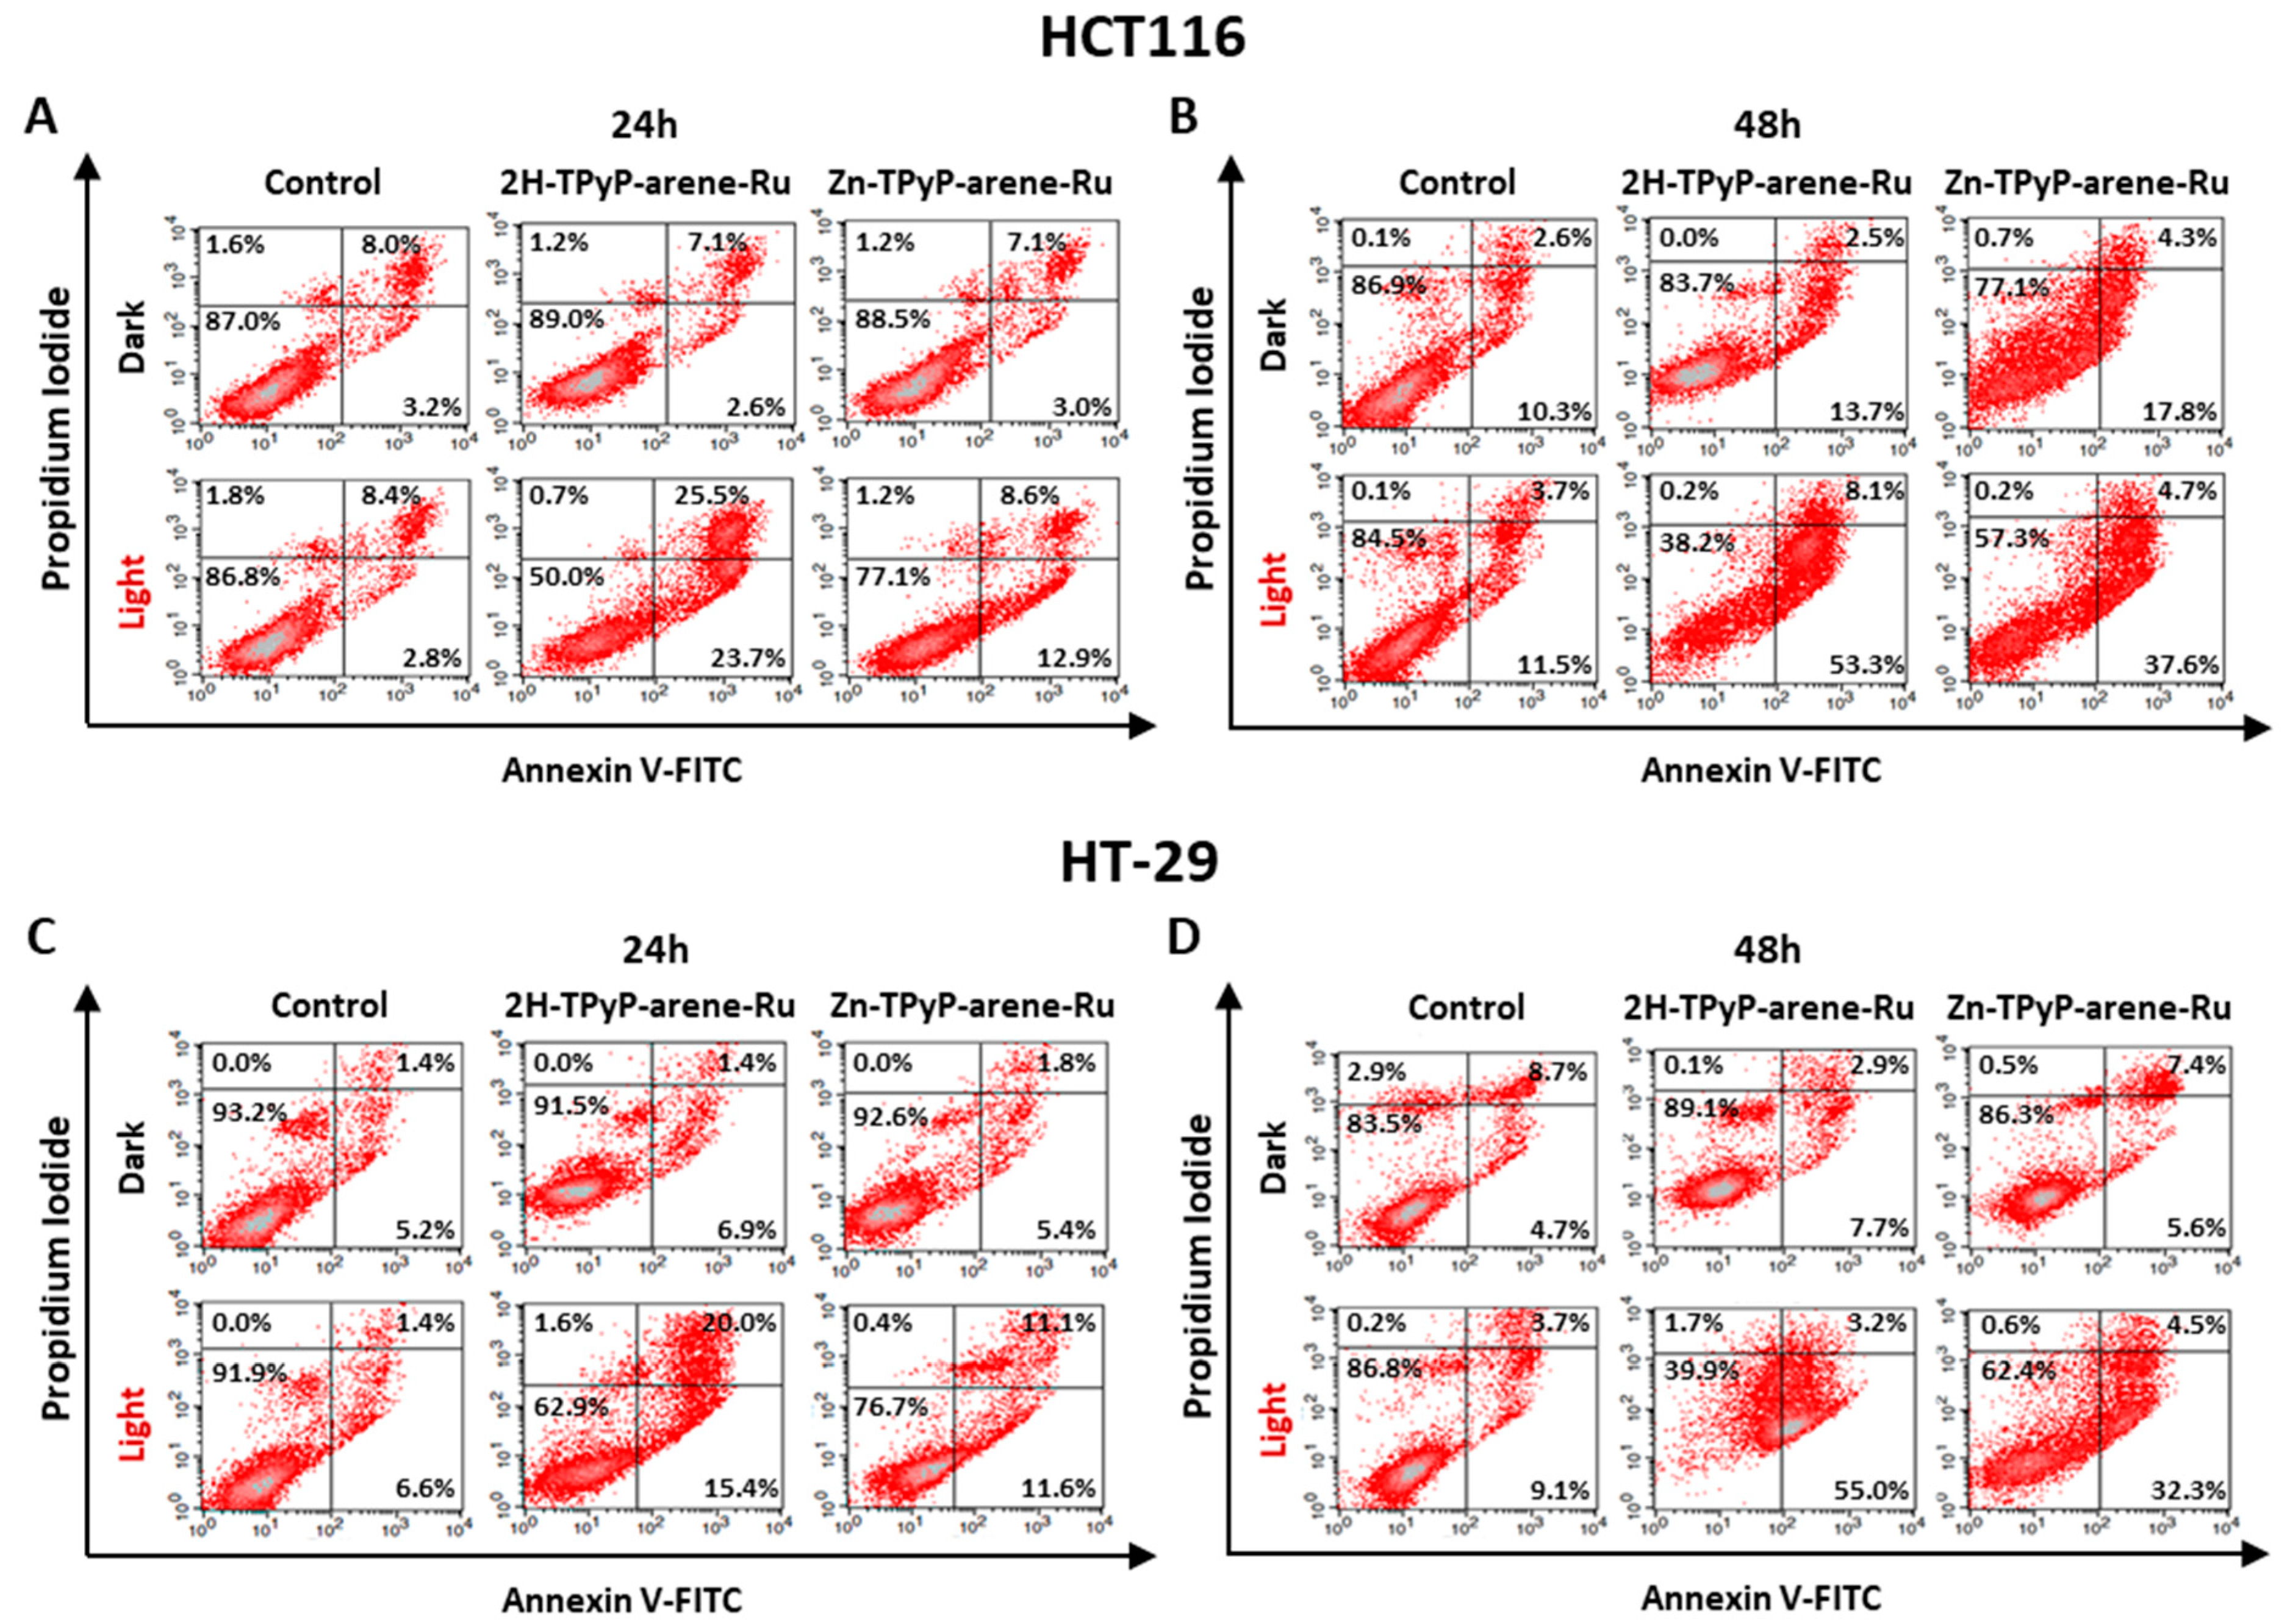
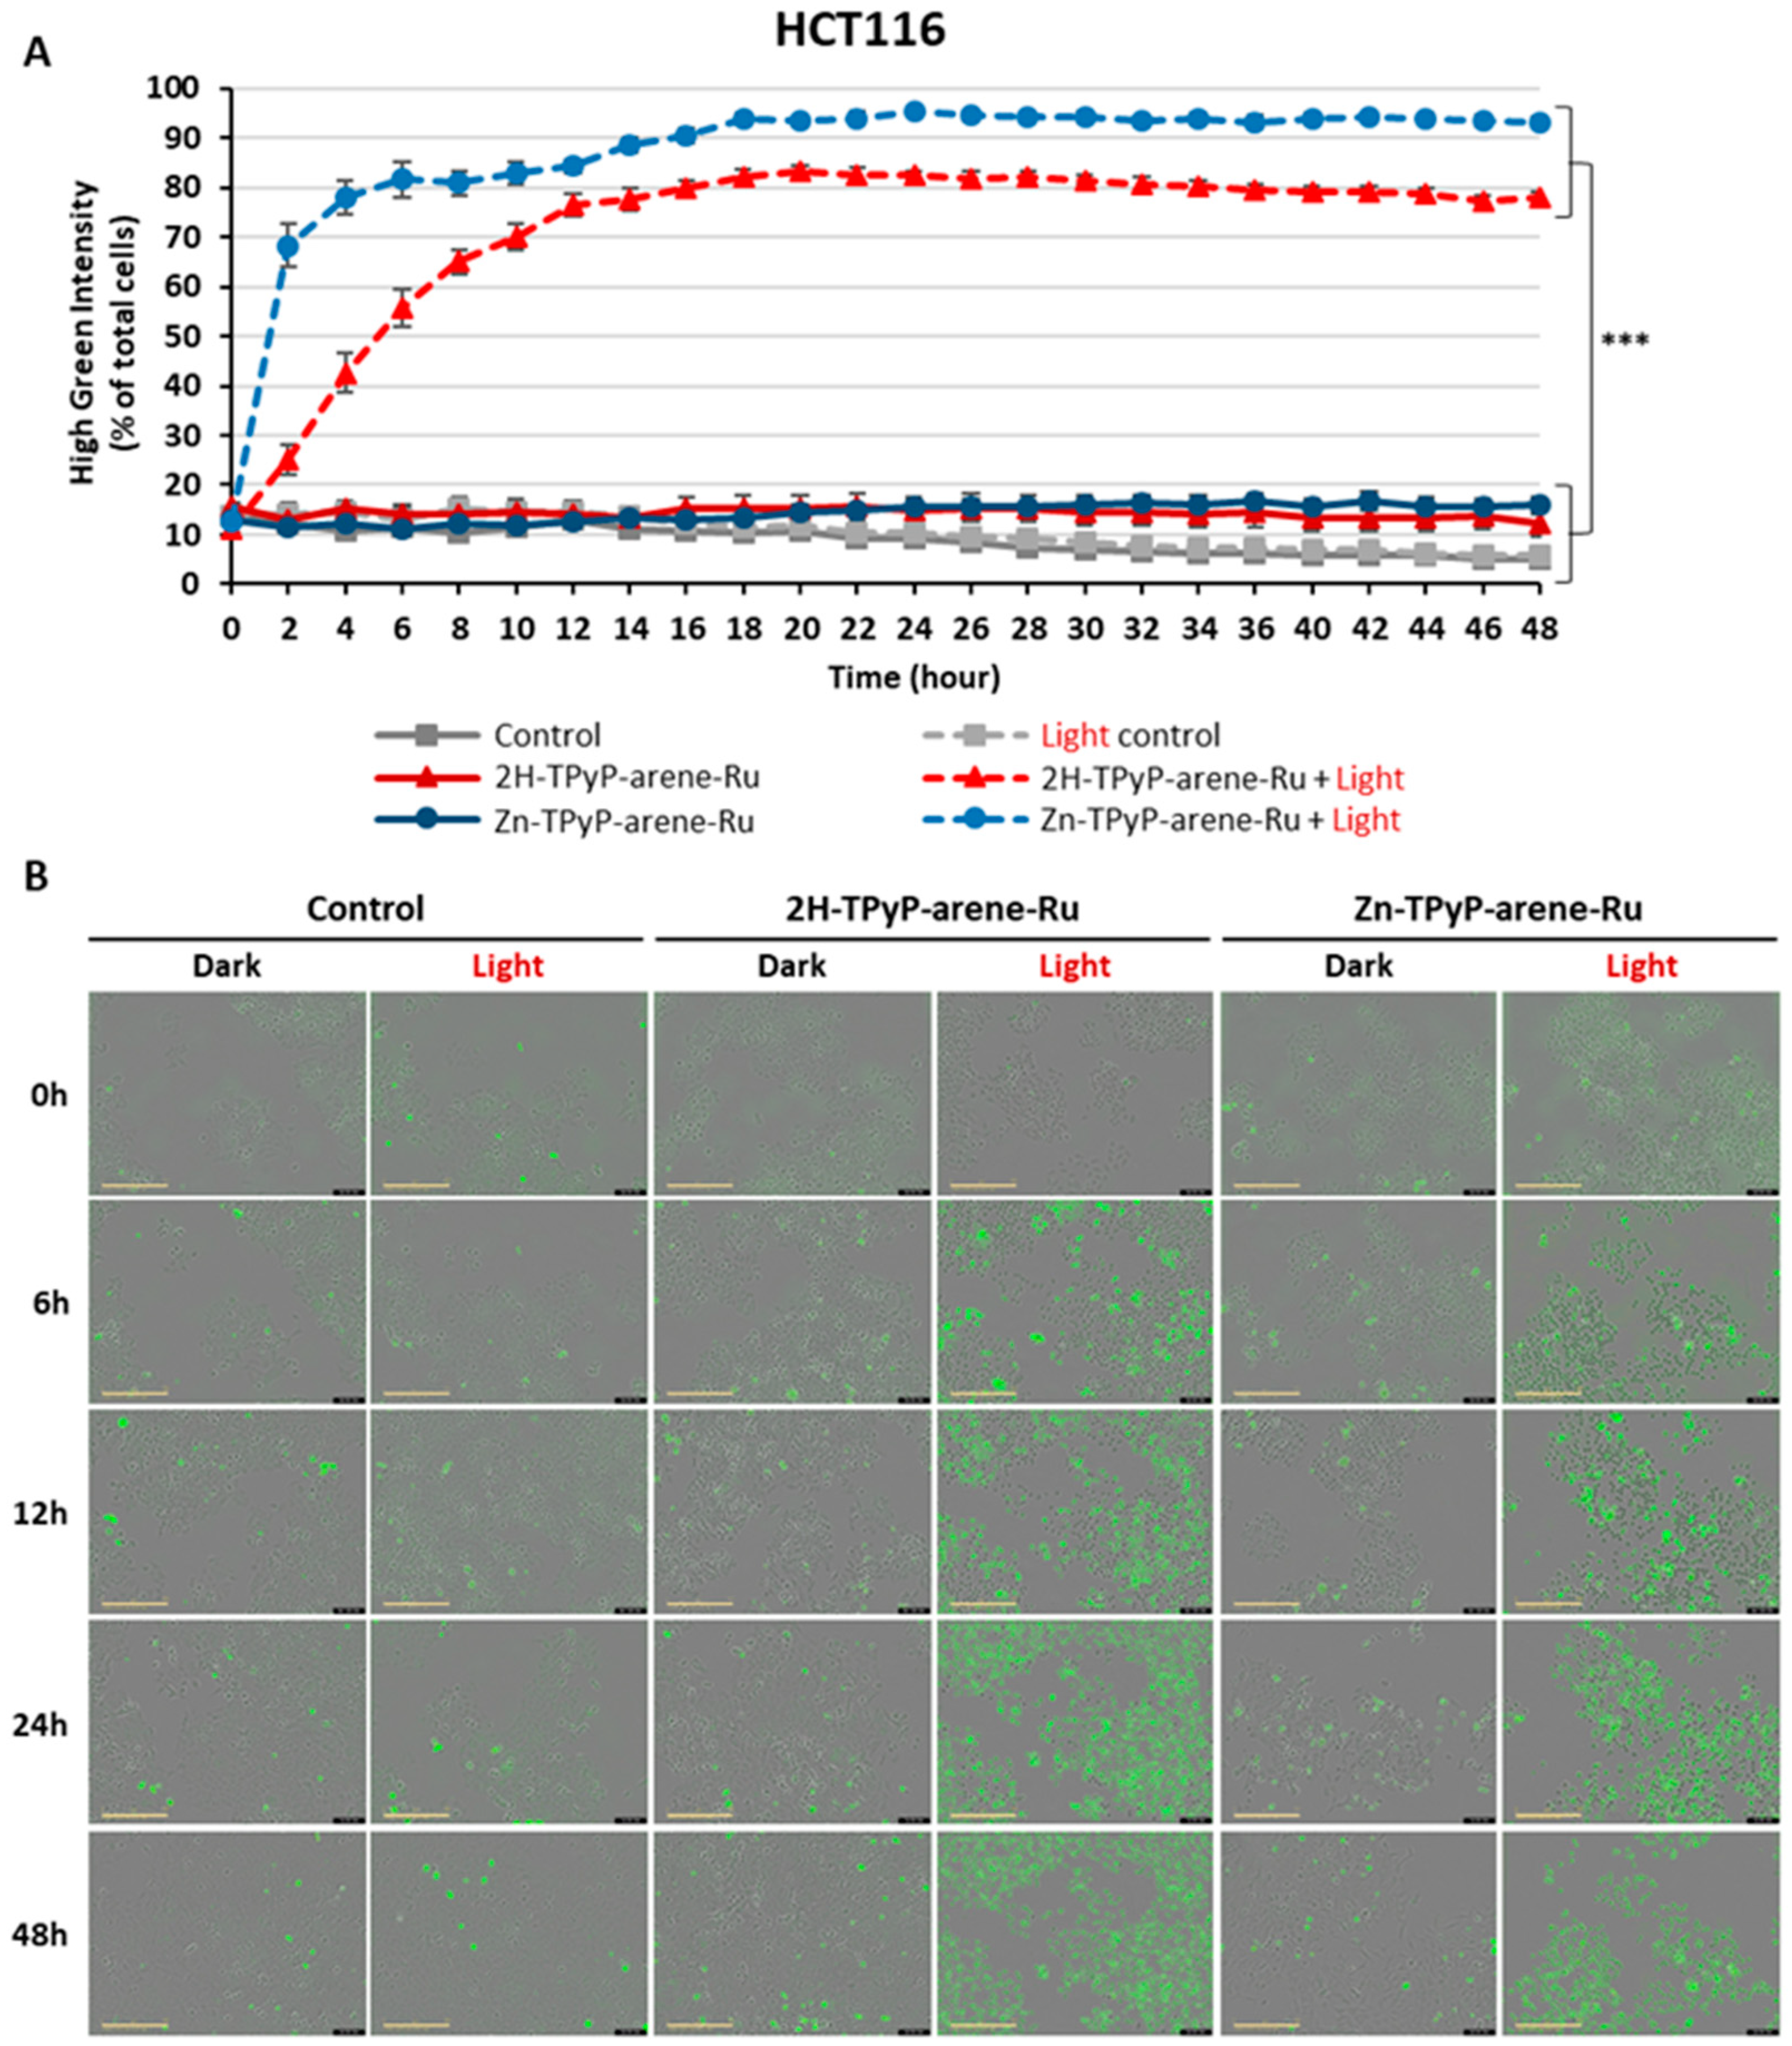
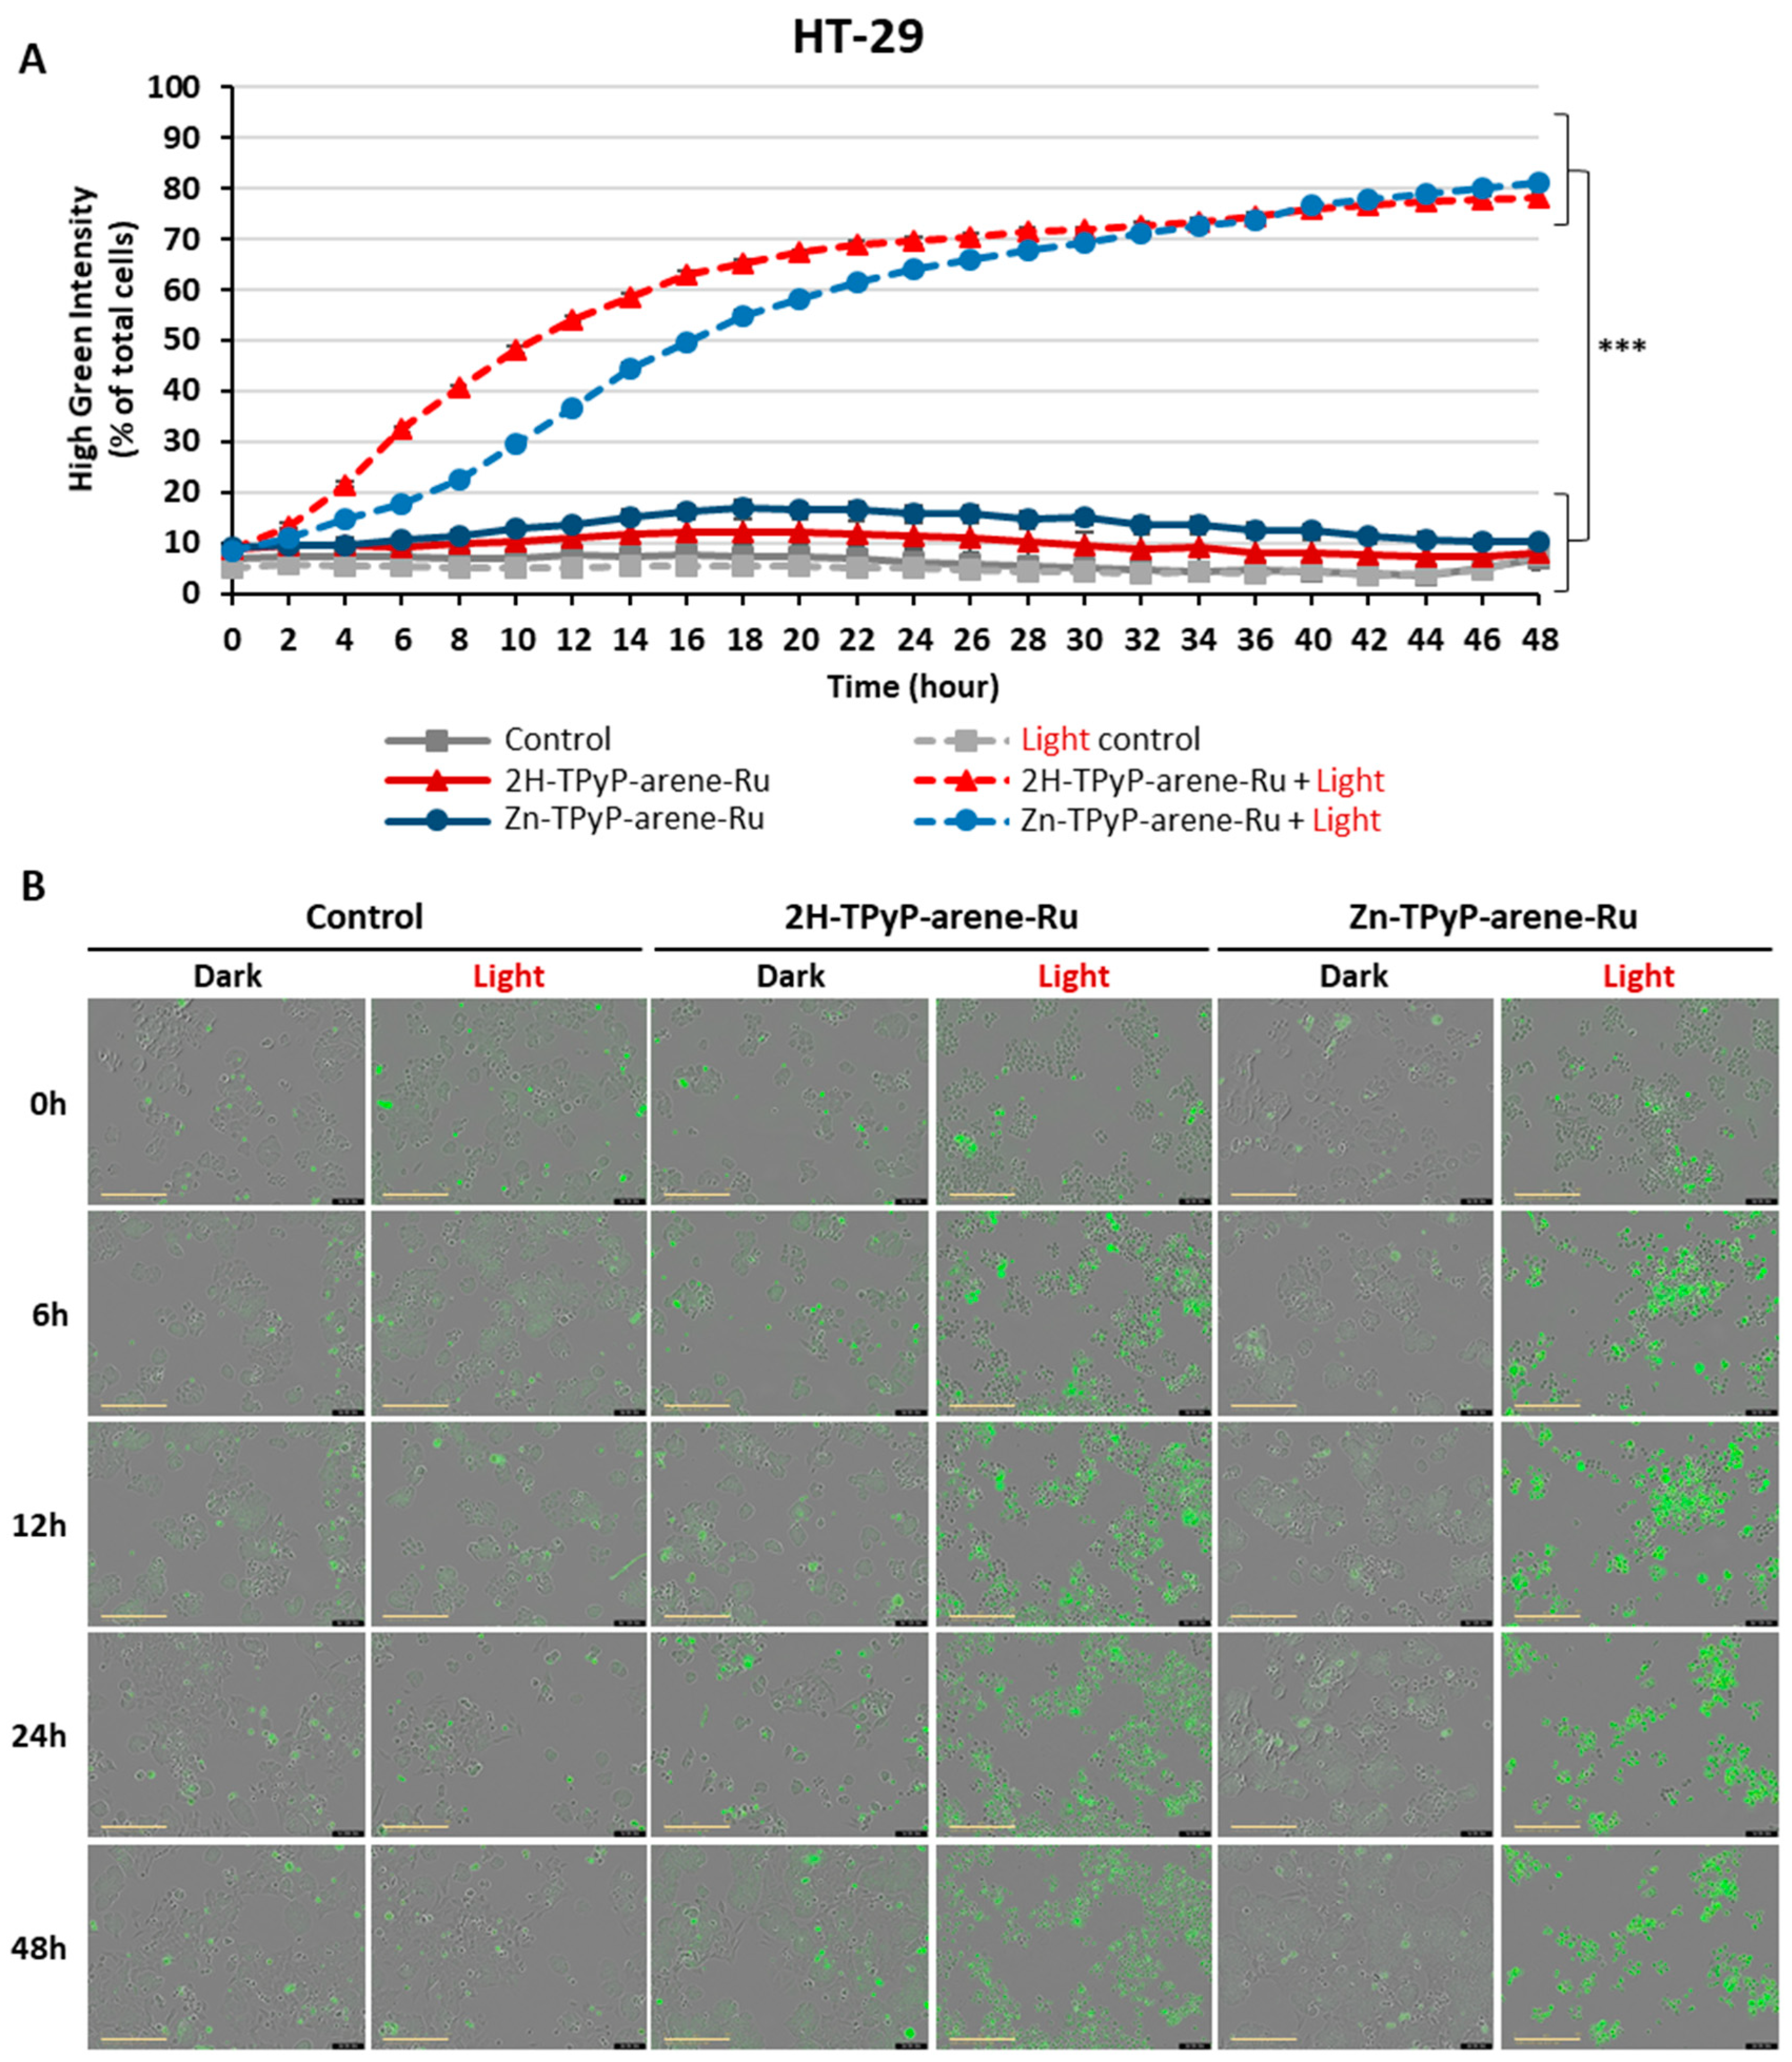
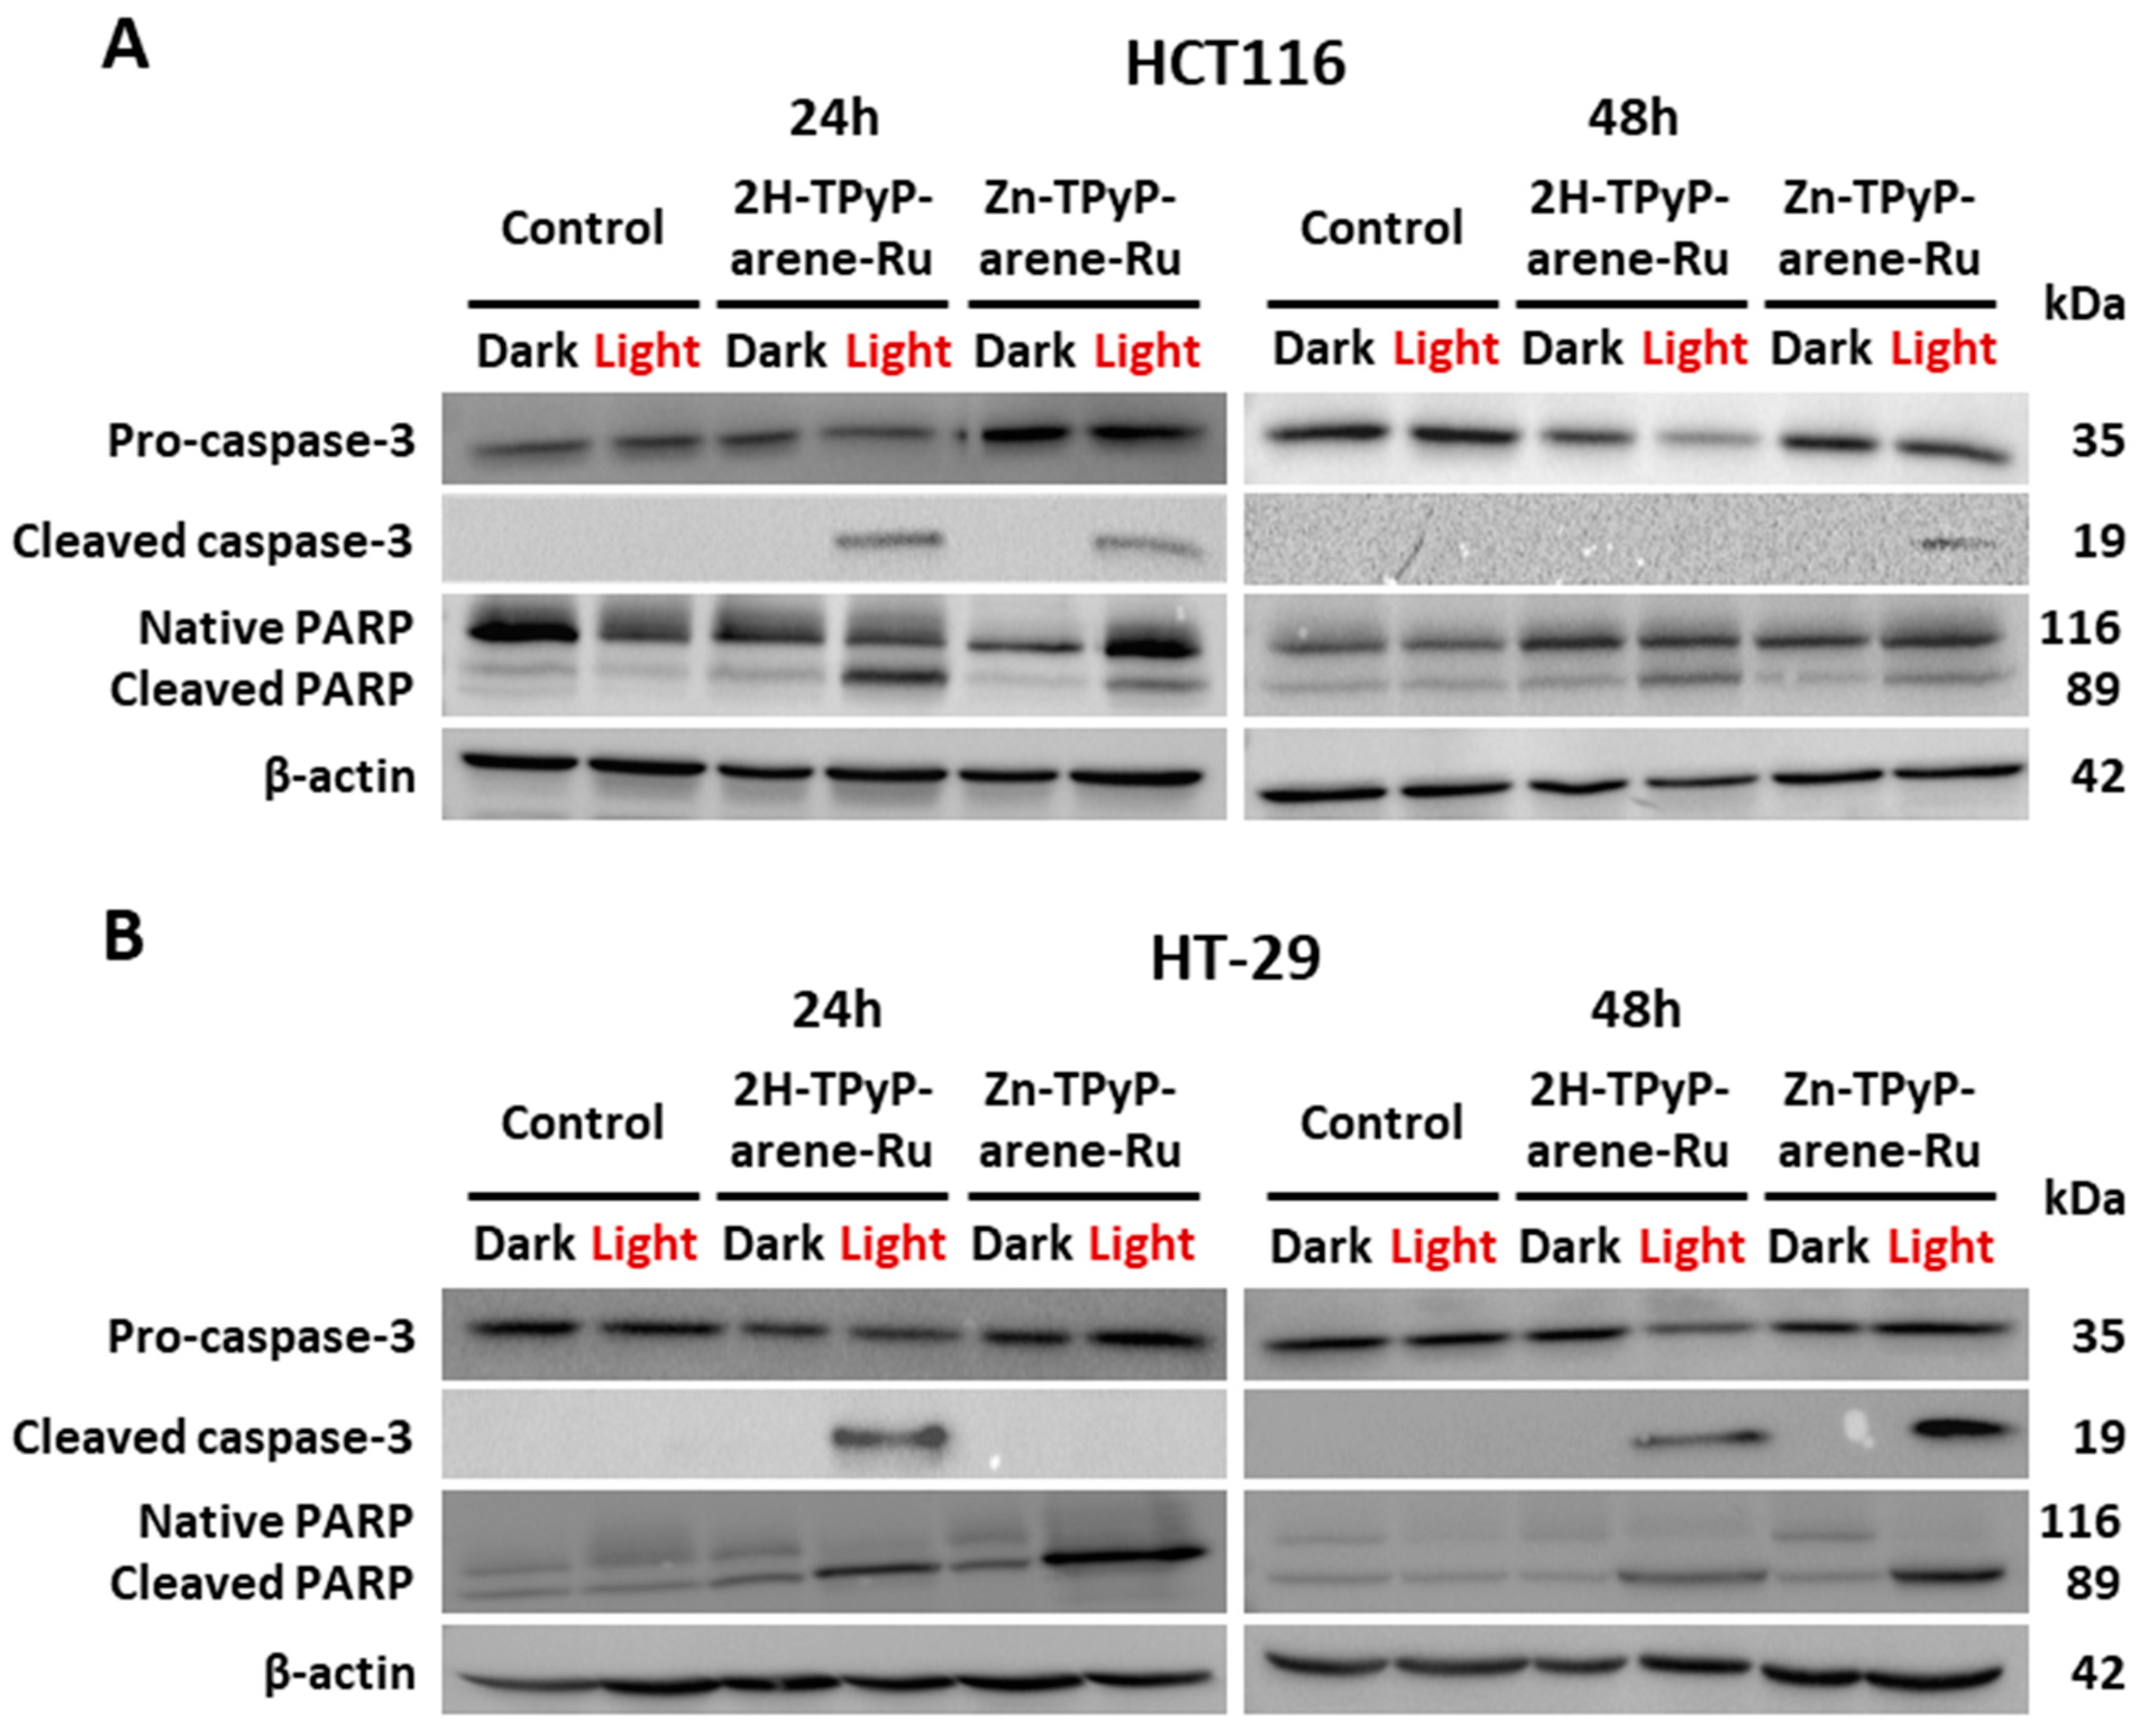
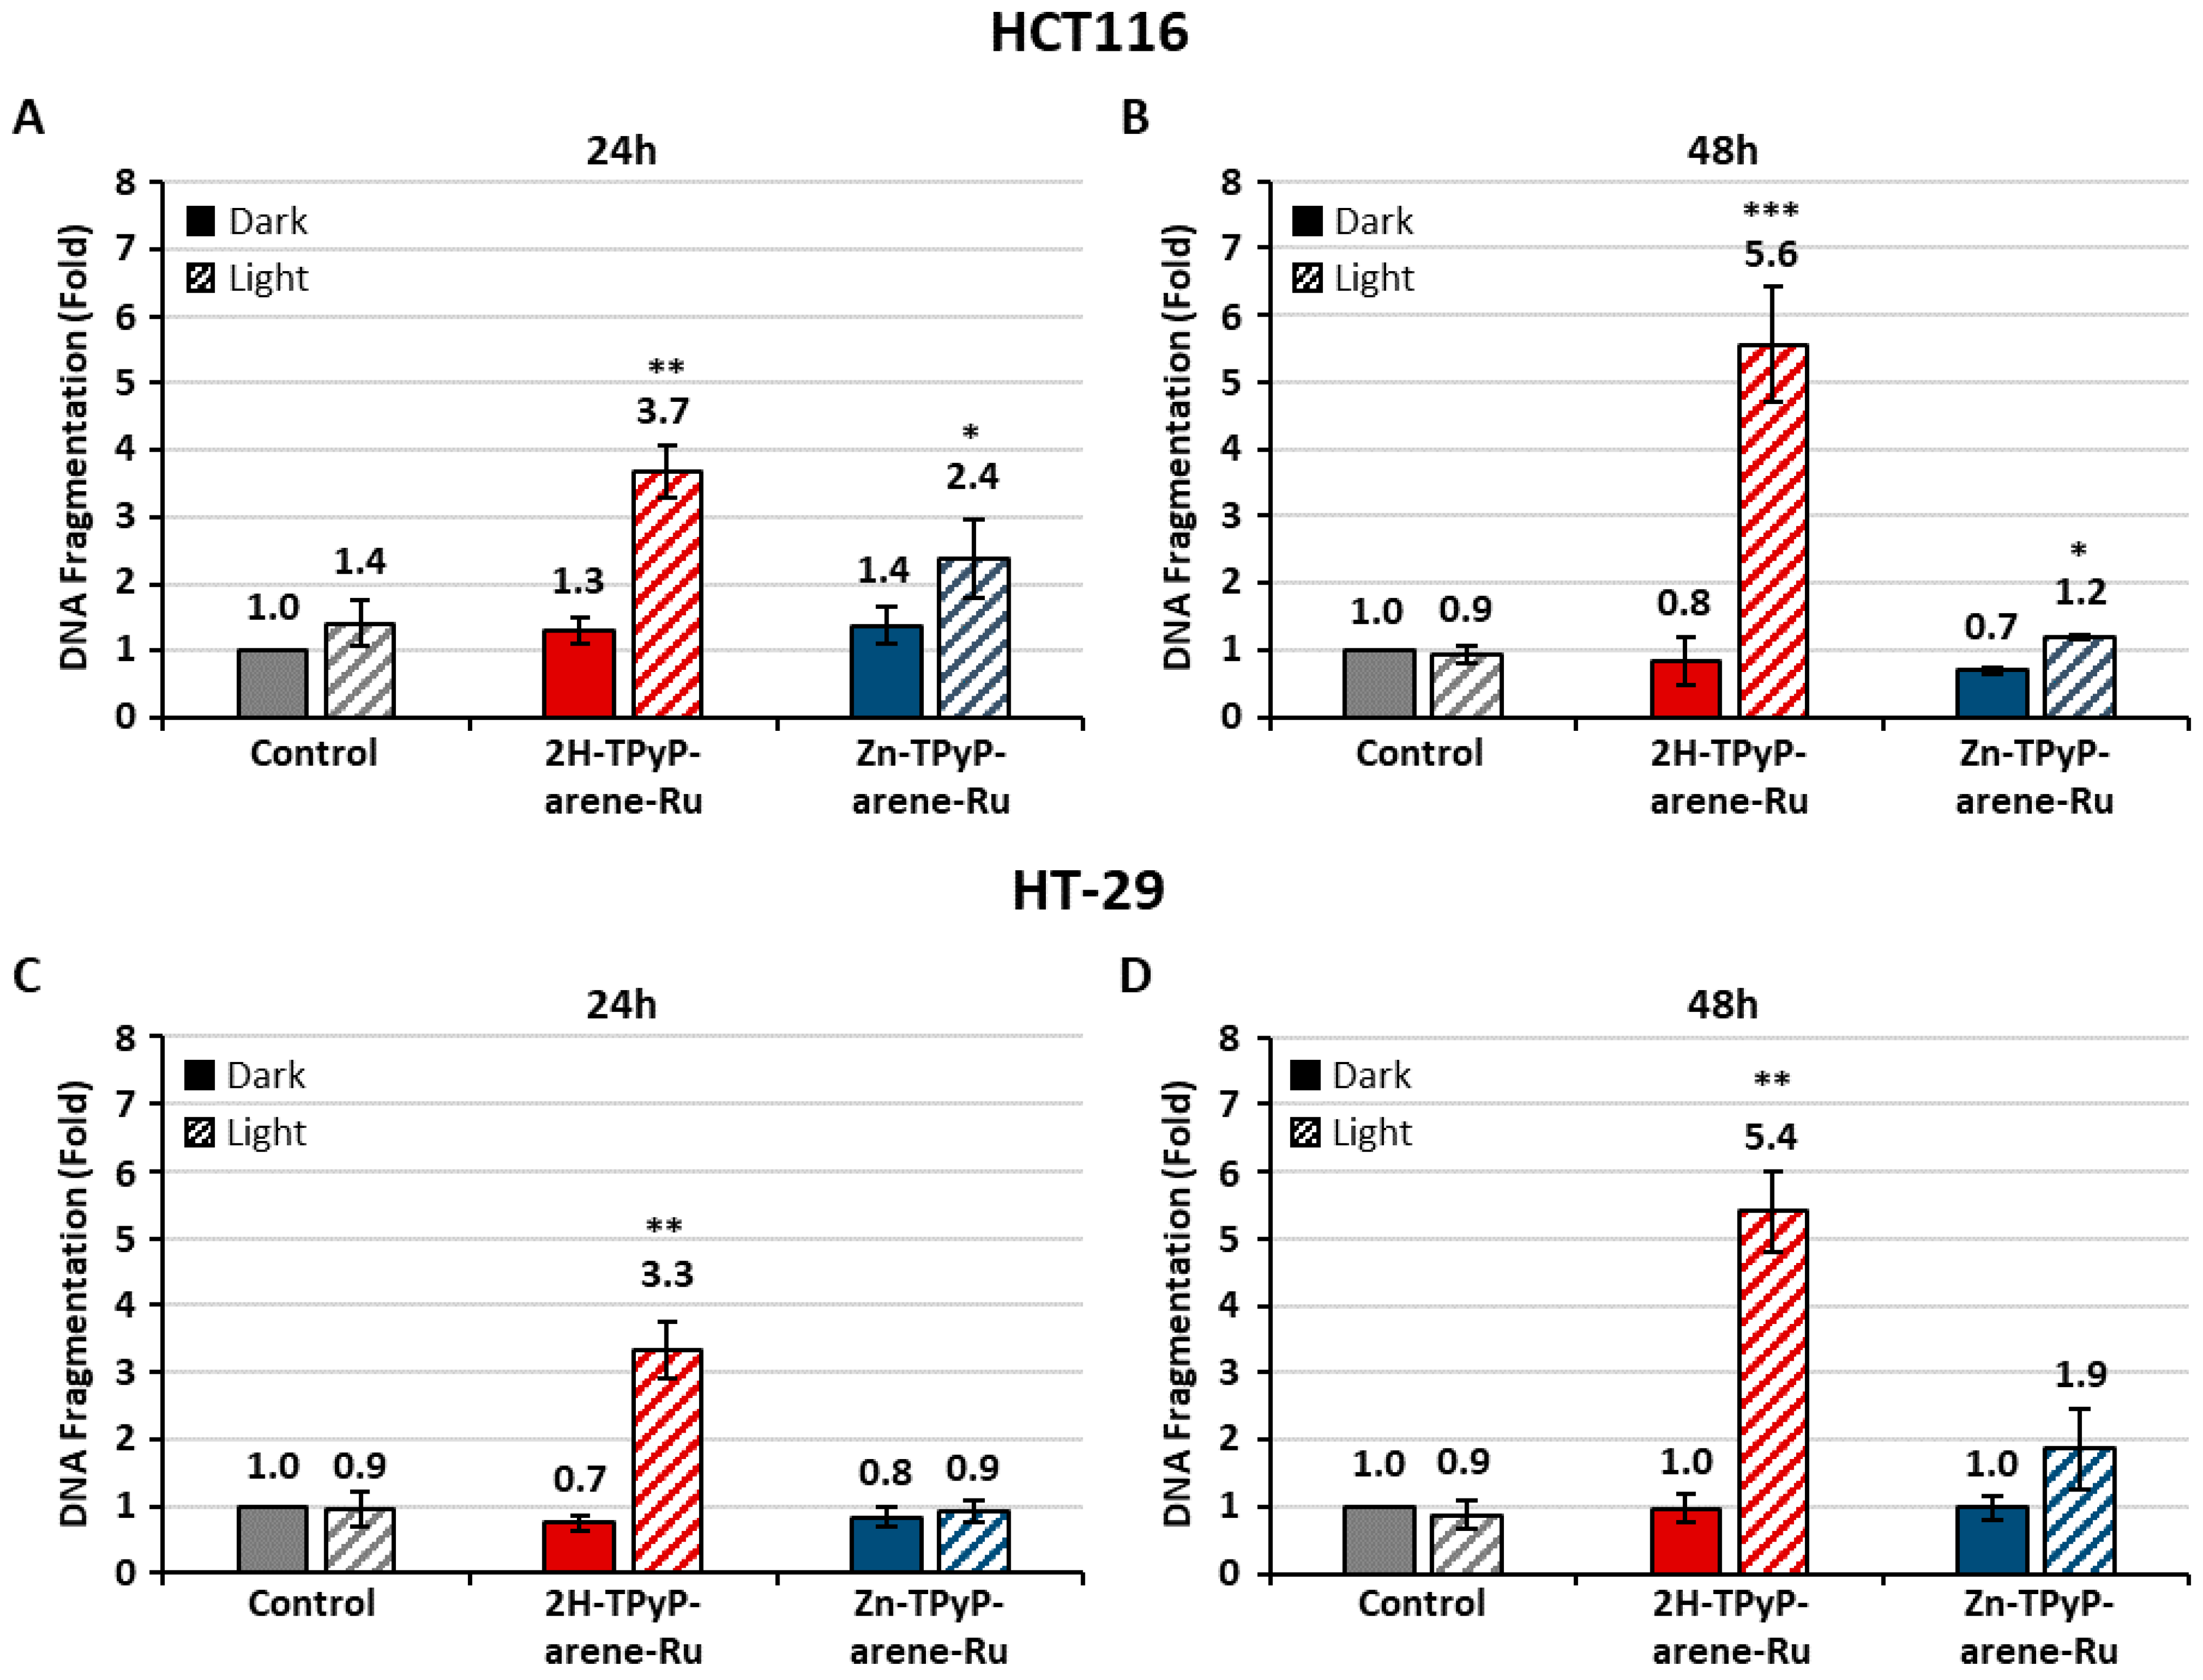
2. Results and Discussion

PDT is an innovative cancer therapy that offers advantages over conventional treatments. Despite its potential advantages, only a small number of PSs have been approved in the clinic, mainly porphyrin-type compounds [39]. This type of PS is often limited due to its low solubility in biological media, but when incorporated into delivery vectors, they can be internalized into cells. Based on this assumption, the conjugation of porphyrin with metals has received much attention [40]. Recent scientific studies showed that ruthenium complexes are one of the most promising metal-based drugs used in the treatment of several cancers such as CRC [32,33]. The interesting properties of Ru complexes have led to their involvement in various fields such as PS and photoactive DNA cleavage agents for therapeutic purposes [41]. Several studies reported that porphyrin-Ru complexes had significant anticancer effects. Bogoeva et al. reported Ru porphyrin-induced photodamage in bladder cancer cells [42]. In addition, Schmitt et al. demonstrated that 5,10,15,20-tetra(4-pyridyl)porphyrin (TPP) arene Ru(II) derivatives exhibited excellent phototoxicities toward melanoma cells when exposed to light at 652 nm [34]. Cellular uptake and localization microscopy studies of [Ru46-C6H5CH3)4(TPP)Cl8] revealed that they accumulated in the cytoplasm of melanoma cells. Another study provided by Rani-Beeram et al. established that fluorinated Ru porphyrin presents a strong DNA interaction that leads to its cleavage in melanoma cells [35]. More recently, we reported that cubic or prismatic cages can serve as an ideal carrier for PSs to treat rheumatoid arthritis [37,43]. In the current study, we have determined the biological activity of cationic TPyP-arene-Ru metalla-assemblies (Figure 1) on CRC cells. We wanted to evaluate the potential of such octanuclear assemblies as anticancer agents on CRC. For this purpose, we determined the effect of 2H-TPyP-arene-Ru and Zn-TPyP-arene-Ru complexes associated with PDT on two human CRC cell lines, HCT116 and HT-29 respectively.
To investigate the in vitro phototoxicity of 2H-TPyP-arene-Ru and Zn-TPyP-arene-Ru, we treated or not two human CRC cell lines (HCT116 and HT-29) with the ruthenium-based PS. Then, the cells were exposed or not to PDT under red light (630–660 nm), and phototoxic effects were determined 24 and 48 h post-irradiation using the MTT assay. Results showed that TPyP-arene-Ru complexes had no toxic effect on HCT116 and HT-29 cell lines in the dark below 1 μM, and that cell growth was unaffected by light alone (Fluence 75 J/cm2). However, upon photoactivation, both 2H-TPyP-arene-Ru and Zn-TPyP-arene-Ru complexes led to a drastic decrease in cell viability in a dose-dependent manner (Figure 2 and Figure 3). It is worth mentioning that the 2H-TPyP-arene-Ru complex was more effective than the Zn-TPyP-arene-Ru analogue on both cell lines.
The IC50 values were determined to compare the impact of adding a diamagnetic metal (Zn2+) to the center of the tetrapyrrole ring in the 2H-TPyP panels after activation with PDT. We observed that 2H-TPyP-arene-Ru was much more effective than Zn-TPyP-arene-Ru in the HCT116 cell line, with 8-fold more photocytotoxicity 24 h post-irradiation (Figure 2). IC50 values were in the range of 41.9 nM for 2H-TPyP-arene-Ru and 331.2 nM for Zn-TPyP-arene-Ru. Our studies revealed more cytotoxicity at 48 h, where IC50 values decreased to 35.2 nM for 2H-TPyP-arene-Ru and 207.4 nM for Zn-TPyP-arene-Ru, respectively (Table 1). Similar results were observed for the HT-29 cell line, which was shown to be more resistant than HCT116, as their respective IC50 values were 67.8 nM for 2H-TPyP-arene-Ru and 393.9 nM for Zn-TPyP-arene-Ru at 24 h (Figure 3). These values decreased to be, respectively, 54.1 nM for 2H-TPyP-arene-Ru and 379.3 nM for Zn-TPyP-arene-Ru after 48 h post-injection (Table 1). The concentrations used for the following experiments correspond to the IC50 values obtained under light.
However, in the dark, the concentrations required to observe a cytotoxic response on those cell lines are much higher (Table 1), suggesting that PDT is the dominant effect over chemotherapy. This result was not necessarily surprising considering that the structure of the assemblies contains two units of tetrapyridylporphins as PS, which has the effect of strengthening the effectiveness of the PDT treatment and consequently providing a better therapeutic effect under light. The IC50 values of 2H-TPyP-arene-Ru coupled with PDT on both cell lines are five to eight times higher when compared to the Zn-tetrapyridylporphin analogue. This can be linked to the stronger fluorescence of PS with a metallic center.
Fluorescence is a consequence of the energetic decay from the excited state of the PS to the minimum energy state. Therefore, high fluorescence quantum yield suggests that most of the energy in the singlet excited state of the PS returns to the ground state without passing through the triplet excited state, consequently, generating more fluorescence, but leaving behind less energy in the triplet state to interact with O2 and to produce ROS. However, in all cases, we systematically obtained under PDT a significant cytotoxic effect for which the IC50 values are in the nanomolar range.
As PDT induced cell death via cellular ROS production, quantification of ROS was determined in the two cell lines 1 h post-irradiation. Cells were labeled with dichlorodihydrofluorescein diacetate (DCFDA), and hydrogen peroxide (H2O2) was used as a positive control. The results showed that when HCT116 cells were treated with both compounds and then photoactivated (630–660 nm, 75 J/cm2), the ROS production for 2H-TPyP-arene-Ru was 79.4%, while for Zn-TPyP-arene-Ru, ROS production was 75.5%. In the dark, both compounds show limited ROS production, being 15.5% and 14.2%, respectively. A similar result was observed in HT-29 cells, where photoactivation of 2H-TPyP-arene-Ru resulted in 82.8% ROS production vs. 14.9% in the dark, while for Zn-TPyP-arene-Ru, the ROS production was 79.9% vs. 11.2% in the dark (Figure 4).
The significant phototoxic effects of the complexes may be due to an enhanced cellular internalization of the cationic porphyrin arene-Ru assemblies. In order to confirm the cellular uptake of our compounds, a study regarding the internalization of 2H-TPyP-arene-Ru and Zn-TPyP-arene-Ru was performed using flow cytometry coupled with AMNIS® image analysis and further confirmed by confocal microscopy.
Flow cytometry image analyses show high cellular internalization of 2H-TPyP-arene-Ru with 89% and 81% in HCT116 and HT-29 cells, respectively. Similar results were observed for the Zn-TPyP-arene-Ru analogue, 82% in HCT116 and 85% in HT-29 cells, suggesting that the presence of Zn2+ in the porphyrin core does not alter the internalization process. This internalization was reflected by the red fluorescence of both compounds in cells (Figure 5). Cellular internalization was also confirmed by confocal microscopy as the fluorescence of 2H-TPyP-arene-Ru or Zn-TPyP-arene-Ru (red) was clearly observed in the cytoplasm of the cells, with however, no accumulation in the nucleus (Figure 6).
The inhibition of cancer cell proliferation by cytotoxic drugs could be the result of the induction of apoptosis or cell cycle arrest or a combination of both processes. Therefore, we investigated the cell growth mechanism inhibition by flow cytometry analysis. PDT can induce irreversible photodamage leading to cell death, and to define the cell death process triggered by our compounds, the impact on cell cycle activity was determined. Accordingly, HCT116 and HT-29 cells were treated or not at the phototoxic IC50 concentrations (Table 1) and then subjected to flow cytometry analysis using PI staining after PDT. Results showed that on HCT116 cells, 2H-TPyP-arene-Ru induced a strong increase in the number of apoptotic cells represented by the sub-G1 peak, mainly at 48 h with 33.83% vs. 0.65% for control. In contrast, Zn-TpyP-arene-Ru was shown to have less effect on sub-G1 cells with 5.29% vs. 0.65% for control (Figure 7). Similar results were observed on HT-29 cells, where 2H-TpyP-arene-Ru produced an increase in the number of apoptotic cells, as signaled by a sub-G1 peak of 9.04% vs. 1.22% for the control at 24 h. Likewise, we observed a drastic increase at 48 h with a 26.98% sub-G1 peak vs. 2.19% for the control (Figure 8). On both cell lines, the complexes have no influence on the cell cycle without photo-activation, the concentrations being far below the IC50 in the dark (Table 1). Nevertheless, it is important to emphasize that at 48 h post-irradiation, 2H-TPyP-arene-Ru under PDT induced an accumulation of S-phase cells with a decrease in the number of G1 phase in both cell lines.
In order to evaluate the induction of apoptosis mechanism leading to cell death, we investigated by flow cytometry the percentage of phosphatidylserines externalization of apoptotic cells by annexin-V-FITC/PI dual staining assay. Cell cycle analysis of HCT116 and HT-29 cells treated with either 2H-TPyP-arene-Ru or Zn-TPyP-arene-Ru revealed the appearance of a sub-G1 population referring to cells in apoptosis. Therefore, we have studied the mechanism of apoptosis induced by both complexes on HCT116 and HT-29 cells 24 and 48 h post-PDT. The apoptotic process was first investigated using annexin V-FITC/PI dual staining assay. During the early stages of apoptosis, phosphatidylserines are known for their translocation from the inner to the outer plasma membrane of cells; thus, phosphatidylserines externalization allows binding to annexin V. Therefore, the percentages of apoptotic cells at early and later stages were determined via dual staining with annexin V-FITC and PI using flow cytometry. The results showed that in HCT116 cells, control, and light control, 2H-TPyP-arene-Ru- and Zn-TPyP-arene-Ru treated cells were mostly viable, whereas the cumulative rate of early and late apoptosis was 11.31%, 11.29%, 9.79%, and 10.23%, respectively, at 24 h. This rate has increased dramatically after irradiation to be 49.25% for 2H-TPyP-arene-Ru-PDT, which is more effective than Zn-TPyP-arene-Ru-PDT with 21.58% (Figure 9A). Similarly, 48 h after PDT, 2H-TPyP-arene-Ru and Zn-TpyP-arene-Ru caused 61.46% and 42.41% of apoptosis, respectively, compared to 12.96% for control, 15.24% for light control, 16.22% for 2H-TPyP-arene-Ru, and 22.14% for Zn-TPyP-arene-Ru complexes without photoactivation (Figure 9B). Similar results were obtained on HT-29 cells after photoactivation of 2H-TpyP-arene-Ru and Zn-TpyP-arene-Ru, respectively, with 35.45% and 22.81% vs. controls (control: 6.70%, light control: 8.02%, 2H-TPyP-arene-Ru dark: 8.38%, and Zn-TPyP-arene-Ru dark: 7.29%) at 24 h (Figure 9C) and with 58.31% and 36.87% vs. controls (control: 13.44%, light control: 12.92%, 2H-TPyP-arene-Ru dark: 10.67%, and Zn-TPyP-arene-Ru dark: 13.07%) at 48 h (Figure 9D).
We established that photoactivation of 2H-TPyP-arene-Ru and Zn-TPyP-arene-Ru dramatically increased the cumulative rate of early and late apoptosis, which can confirm cell death via apoptosis. These results are in agreement with a study held by Silva et al. reporting the apoptotic cell death in human colon carcinoma HCT116 cells treated with Ru(II)-thymine complexes [44]. Furthermore, to validate the apoptotic mechanism, we evaluated the last stages in the death mechanism up to DNA fragmentation. We demonstrated that 2H-TPyP-arene-Ru and Zn-TPyP-arene-Ru coupled with PDT induced caspase-3 activation, significant PARP cleavage, and DNA fragmentation. Accordingly, the apoptotic process was further analyzed at a later stage of apoptosis. For this purpose, quantitative analysis of activated caspases-3/-7 was carried out using the IncuCyte® S3 live-cell analysis system for 48 h. For the HCT116 cell line (Figure 10), the results showed that photoactivation of TPyP-arene-Ru led to a significant increase in the number of activated caspases-3/-7 as early as 6 h after treatment. In fact, both compounds generated a significant increase in this activity over time when compared to the light control at 48 h post-irradiation (70%–95% for 2H-TPyP-arene-Ru light and Zn-TPyP-arene- Ru light vs. 5%–15% for the light control). Similar results were observed on HT-29 cells (Figure 11).
Activation of effector caspases results in the cleavage of several cellular substrates. One of the substrates of caspase-3 is PARP, an enzyme involved in DNA repair. For this reason, protein expression of this apoptotic marker was analyzed via Western blotting (WB). In the HCT116 and HT-29 cell lines, the results showed that, in the dark, 2H-TPyP-arene-Ru, Zn-TPyP-arene-Ru, and the control had no effect on the expression of native caspase-3 after 24 and 48 h. In contrast, we mainly noticed that photoactivation of 2H-TPyP-arene-Ru and Zn-TPyP-arene-Ru resulted in cleavage of native caspase-3 (35 kDa), and consequently its activation, which was observed by the appearance of the cleaved caspase-3 fragment (19 kDa). To confirm the role of 2H-TPyP-arene-Ru and Zn-TPyP-arene-Ru after PDT on apoptosis, other investigations on later stages of the process had to be evaluated, such as the state of PARP. Cleavage of PARP is considered as a hallmark of cells undergoing apoptosis. We compared the expression of native and cleaved PARP forms in treated and untreated cells using WB. After PDT, results showed that 2H-TPyP-arene-Ru and Zn-TPyP-arene-Ru induced PARP cleavage, as shown by the highly apparent 89 kDa cleavage fragment for HCT116 (Figure 12A) and HT-29 (Figure 12B) cell lines, associated with a decreased expression of the native PARP in treated cells compared to control at 24 and 48 h.
In order to study the nuclear changes in apoptosis caused by 2H-TPyP-arene-Ru and Zn-TPyP-arene-Ru, DNA fragmentation was evaluated via ELISA assay in both cell lines after 24 and 48 h. The outcomes indicate that in HCT116 cells (Figure 13A,B), 2H-TPyP-arene-Ru after PDT leads to a significant increase in DNA fragmentation by 3.7-fold at 24 h and 5.6-fold at 48 h compared to non-irradiated conditions at 1.3-fold and 0.8-fold, respectively, compared to the control. Similarly, Zn-TPyP-arene-Ru coupled with PDT increased DNA fragmentation by 2.4-fold and 1.2-fold at 24 and 48 h, respectively, compared to non-irradiated conditions at 1.4-fold and 0.7-fold compared to the control. HT-29 cells showed similar results (Figure 13C,D). 2H-TPyP-arene-Ru coupled with PDT induced a significant increase in DNA fragmentation by 3.3-fold at 24 h and 5.4-fold at 48 h, whereas the non-irradiated condition showed no significant effect with 0.7-fold and 1.0-fold, respectively, compared to control. Likewise, Zn-TPyP-arene-Ru with PDT increased DNA fragmentation mainly at 48 h by 1.9-fold compared to the non-irradiated condition by 1.0-fold compared to the control.
This result can be related to the strong potential of Ru complexes photophysical and photochemical properties that allow them to bind to DNA and induce their cleavage via photoactivation [45]. These results agree with Lu et al. study, which reports the anticancer effect of Ru complexes on hepatocellular carcinoma [46].

3. Materials and Methods

3.1. Materials

DMEM medium, DMEM red-phenol-free medium, RPMI 1640 medium, RPMI 1640 red-phenol-free medium, fetal bovine serum (FBS), L-glutamine, and penicillin-streptomycin were purchased from Gibco BRL (Cergy-Pontoise, France). 3-(4,5-dimethylthiazol-2-yl)-2,5-diphenyltetrazolium bromide (MTT), cell death detection enzyme-linked immunosorbent assay PLUS (ELISA), and human anti-β-actin antibody were obtained from Sigma-Aldrich (Saint-Quentin-Fallavier, France). Poly-ADP-ribose polymerase (PARP) antibody and goat anti-rabbit IgG secondary antibody conjugated to horseradish peroxidase (HRP) were acquired from Cell Signaling Technology-Ozyme (Saint-Quentin-en-Yvelines, France). Rabbit anti-mouse IgG-IgM H&L HRP secondary antibody, Annexin V-FITC, and propidium iodide (PI) were obtained from Invitrogen-Thermo Fisher Scientific (Villebon-Sur-Yvette, France). Immobilon Western Chemiluminescent HRP Substrate was acquired from Merck (Lyon, France).
2H-TPyP-arene-Ru and Zn-TPyP-arene-Ru complexes were prepared as previously described [37,47]. Stock solutions of TPyP-arene-Ru complexes were dissolved at 1 mM concentration in DMSO, then were diluted in culture medium to obtain the appropriate final concentrations just before use. The concentration of DMSO in culture medium was lower than 0.1% in all cases, which is considered to be non-toxic.

3.2. Cell Culture and Treatment

Human CRC cell lines HT-29 and HCT116 were purchased from the American Type Culture Collection (ATCC-LGC Standards, Mosheim, France). Cells were grown in DMEM medium for HT-29 cells and RPMI 1640 medium for HCT116 cells. Culture media were supplemented with 10% FBS, 1% L-glutamine and 100 U/mL penicillin, and 100 µg/mL streptomycin. Cultures were maintained in a humidified atmosphere containing 5% CO2 at 37 °C. For all experiments, cells were seeded at 2.1 × 10⁴, 1.2 × 10⁴ cells/cm2 for HT-29 and HCT116 cells, respectively. Cells were washed, and the culture medium was replaced by a red phenol-free appropriate culture medium before PDT.

3.3. Cytotoxicity and Phototoxicity

Cytotoxicity and phototoxicity was determined using an MTT assay. Briefly, cells were seeded in 96-well culture plates and grown for 36 h in an appropriate culture medium before exposure or not to 2H-TPyP-arene-Ru or Zn-TPyP-arene-Ru complexes. After 24 h incubation, cells were washed and irradiated or not with a 630–660 nm CURElight lamp at 75 J/cm2 (PhotoCure ASA, Oslo, Norway). The emission spectrum of this light source is shown in Figure S1 (Supplementary Materials). MTT assays were performed 24 and 48 h post-irradiation, and cell cytotoxicity was expressed as a percentage of each treatment condition by normalizing to untreated cells.

3.4. Intracellular ROS Production

Cellular ROS production was quantified using the 2′,7′-dichlorofluorescein diacetate cellular reactive oxygen species detection assay kit. Cells were seeded in 25 cm2 culture flasks at the determined density and cultured for 36 h. Cells were then treated or not with 2H-TPyP-arene-Ru or Zn-TPyP-arene-Ru at the determined IC50 values. After 24 h incubation, cells were labeled with DCFDA for 30 min at 37 °C. The cells were then washed, the medium replaced with the corresponding medium without phenol red, and irradiated or not. Cellular ROS generation was then quantified 1 h after irradiation via flow cytometry analysis. Hydrogen peroxide (H2O2) was used as a positive control at 800 μM.

3.5. Cellular Internalization

3.5.1. Flow Cytometry with AMNIS Imaging

Cells were seeded in 25 cm2 culture flasks at the determined density and cultured for 36 h. Cells were then treated with 2H-TPyP-arene-Ru or Zn-TPyP-arene-Ru at the determined IC50 values. After 1–4 h incubation, the natural fluorescence of 2H-TPyP-arene-Ru (excitation: 405 nm; emission: 650 nm) or Zn-TPyP-arene-Ru (excitation: 561 nm; emission: 655 nm) was analyzed using flow cytometry coupled with AMNIS® image analysis, and the data were analyzed with IDEAS® software (version 3.0; Merck).

3.5.2. Confocal Microscopy

Cells were seeded for 36 h in an incubation chamber (ibidi μ-Slide 8 well; Clinisciences, Martinsried, Germany) coated with a gel containing acetic acid (20 mM) and type I collagen (3 mg/mL). Cells were then treated at the determined IC50 values. Photographs were taken using a Carl Zeiss LSM 510 confocal laser microscope. Meta—×1000 (Marly-le-Roi, France). Co-localization was analyzed using the ImageJ software (version 1.54f).

3.6. Cell Cycle Analysis

The cell cycle distributions in colorectal HT-29 and HCT116 cell lines were analyzed by flow cytometry using propidium iodide (PI) staining. For each cell line, cells were treated or not with the determined IC50 values of 2H-TPyP-arene-Ru and Zn-TPyP-arene-Ru for 24 and 48 h, then harvested with trypsin. For flow cytometry analysis, 1.5 × 10⁶ cells of each condition were collected, washed with PBS, and fixed by adding 1 mL of chilled 70% ethanol in PBS and stored at −20 °C. Following fixation, cells were pelleted, washed in cold PBS, resuspended in 500 µL of cold PBS containing 30 µL of RNase A (10 mg/mL), and incubated for 30 min at room temperature. After staining with 25 µL of PI, the percentage of cells in each stage of the cell cycle was determined using the FACS system (BD Biosciences, San Jose, CA, USA). All the experiments were performed on three samples.

3.7. Mechanisms of Apoptosis

3.7.1. Annexin V-FITC/PI Dual Staining Assay

The annexin V-FITC/PI dual staining assay was used to determine the percentage of apoptotic cells. For each cell line, cells were treated or not with the determined IC50 values of 2H-TPyP-arene-Ru and Zn-TPyP-arene-Ru for 24 and 48 h and then harvested with trypsin. Next, 2.5 × 10⁵ cells of each condition were collected, washed in PBS, centrifuged, and resuspended in 300 µL binding buffer (1×) containing 5 µL of annexin V-FITC and 1 µL of PI (0.1 mg/mL) at room temperature in the dark. After 15 min incubation, cells were analyzed for the percentage undergoing apoptosis using the FACS system (BD Biosciences).

3.7.2. Quantitative Analysis of Activated Caspases-3/-7

Cells were seeded in 96-well plates at the determined density and cultured for 36 h. Cells were then treated or not with 2H-TPyP-arene-Ru or Zn-TPyP-arene-Ru at the determined IC50 values. After 24 h incubation, the culture medium was replaced by the corresponding phenol red-free medium, and the cells were then irradiated or not. Cells were then treated with caspases-3/-7 green reagent (5 μM) and placed in the IncuCyte® S3 live cell analysis system (Sartorius, Dourdan, France). Every 2 h, cells were imaged at a rate of 4 images per well in phase contrast and green fluorescence using ×20 magnification. The number of cells in apoptosis was quantified with IncuCyte® software (version 2022A Rev1 ; Sartorius) using the ratio of the number of fluorescent cells.

3.7.3. Protein Extraction and Western Blot Analysis

For each cell line, cells were treated or not with the determined IC50 values of 2H-TPyP-arene-Ru and Zn-TPyP-arene-Ru for 24 and 48 h and then harvested with trypsin. For total protein extraction, collected samples of each condition were washed in PBS. Then, the total cell pool was centrifuged at 200× g for 5 min at 4 °C and homogenized in RIPA lysis buffer (50 mM HEPES, pH 7.5, 150 mM NaCl, 1% sodium deoxycholate, 1% NP-40, 0.1% SDS, 20 mg/mL of aprotinin) containing protease inhibitors according to the manufacturer’s instructions, as previously described [16]. The protein level was determined using the Bradford method. Proteins (60 µg) were separated on 12.5% SDS-PAGE gels and transferred to PVDF membranes (Amersham Pharmacia Biotech, Saclay, France). Membranes were probed with respective human antibodies against caspase-3, cleaved caspase-3, PARP, and β-actin used as a loading control, according to the manufacturer’s instructions. After incubation with appropriate secondary antibodies, blots were developed using the “Immobilon Western” substrate following the manufacturer’s protocol and G: BOX system (Syngene, Ozyme).

3.7.4. DNA Fragmentation

For each cell line, cells were treated or not at the determined IC50 concentrations of 2H-TPyP-arene-Ru and Zn-TPyP-arene-Ru for 24 and 48 h and then harvested with trypsin. Histone release from the nucleus during apoptosis was analyzed using the Cell Death Detection ELISAPLUS as previously described [48]. Next, 2 × 10⁵ cells of each condition were obtained and DNA fragmentation was measured according to the manufacturer’s protocol.

3.8. Statistical Analysis

All quantitative results are expressed as the mean ± standard error of the mean (SEM) of separate experiments. Statistical significance was evaluated using the two-tailed unpaired Student’s t-test and expressed as: * p < 0.05; ** p < 0.01; and *** p < 0.001.

4. Conclusions

In this study, we have evaluated the anticancer efficacy of 2H-TPyP-arene-Ru and Zn-TPyP-arene-Ru metalla-assemblies on two human CRC cell lines, HCT116 and HT-29. We have demonstrated a strong in vitro anticancer efficacy of 2H-TPyP-arene-Ru and Zn-TPyP-arene-Ru complexes under a PDT regimen. Moreover, our results showed a stronger phototoxicity effect for the metal-free porphyrin derivative, and they confirmed that cell death occurred via an apoptotic pathway. On the other hand, the chemotherapeutic window appeared to be at a much higher concentration, suggesting that the role of the Ru atoms in the biological activity of the metalla-assemblies might be superficial. However, without the presence of the arene-Ru units, the internalization of the PS into cells would have been negligible, TPyP being insoluble in biological media. Therefore, the presence of Ru is essential, and the combination of Ru and PS within metal-based assemblies remains an attractive strategy to add to the regimen of CRC treatments.

Supplementary Materials

The following supporting information can be downloaded at: https://www.mdpi.com/article/10.3390/inorganics11120451/s1, Figure S1: Emission spectrum of the used light source (a 630–660 nm CURElight lamp (PhotoCure ASA, Oslo, Norway)).

Author Contributions

Conceptualization, J.M., B.T. and B.L.; Methodology, J.M., A.P., M.G.-V., L.P., C.O. and C.C.; Validation, S.A., M.D.-A. and B.L.; Writing—original draft preparation, J.M. and A.P.; Writing—review and editing, B.T. and B.L. All authors have read and agreed to the published version of the manuscript.

Funding

This research was funded by the Ministère de l’Enseignement Supérieur et de la Recherche Scientifique of France, Région Nouvelle-Aquitaine and Ligue contre le Cancer (Comité départemental 87—Haute-Vienne).

Data Availability Statement

Data are contained within the article and supplementary materials.

Acknowledgments

The authors are grateful to the BISCEm unit (Univ. Limoges, CNRS, Inserm, CHU Limoges, UAR 2015, US 42) for technical support regarding cytometry and microscopy experiments.

Conflicts of Interest

The authors declare no conflict of interest.

Abbreviations

ATCC: American Type Culture Collection/CRC: Colorectal cancer/DMEM: Gibco Dulbecco’s Modified Eagle Medium/DMSO: Dimethyl sulfoxide/DNA: deoxyribonucleic acid/FBS: Fetal Bovine Serum/ØF: Fluorescence Quantum Yield/HEPES: 4-(2-hydroxyethyl)-1-piperazine ethane sulfonic acid/H2O2: Hydrogen peroxide/HRP: Horseradish Peroxidase/IARC: International Agency for Research on Cancer/IC50: median inhibiting concentration/kDa: Kilodalton/MTT: 3-(4,5-dimethylthiazol-2-yl)-2,5-diphenyltetrazolium bromide/1O2: Singlet oxygen/PARP: Poly-ADP-ribose polymerase/PBS: Phosphate-buffered saline/PDT: Photodynamic therapy/PI: Propidium Iodide/PS: Photosensitizer/PVDF membrane: Polyvinylidene fluoride membrane/RIPA: Radio immuno precipitation Assay/ROS: Reactive oxygen species/RPMI: Roswell Park Memorial Institute medium/SDS-PAGE: Electrophoresis in polyacrylamide gel containing sodium dodecyl sulfate/SEM: Standard Error of the Mean/TPyP: Tetrapyridylporphin.

References

  1. Labianca, R.; Beretta, G.D.; Kildani, B.; Milesi, L.; Merlin, F.; Mosconi, S.; Pessi, M.A.; Prochilo, T.; Quadri, A.; Gatta, G.; et al. Colon cancer. Crit. Rev. Oncol. Hematol. 2010, 74, 106–133. [Google Scholar] [CrossRef] [PubMed]
  2. Colonna, M. Chapter 1—Épidémiologie. In Cancérologie Colorectale; Faucheron, J.-L., Ed.; Elsevier Masson: Paris, France, 2020; pp. 1–10. [Google Scholar]
  3. Sung, H.; Ferlay, J.; Siegel, R.L.; Laversanne, M.; Soerjomataram, I.; Jemal, A.; Bray, F. Global Cancer Statistics 2020: GLOBOCAN Estimates of Incidence and Mortality Worldwide for 36 Cancers in 185 Countries. CA Cancer J. Clin. 2021, 71, 209–249. [Google Scholar] [CrossRef] [PubMed]
  4. Hobeika, C.; Lefevre, J. Chapter 4—Bilan du cancer colorectal. In Cancérologie Colorectale; Faucheron, J.-L., Ed.; Elsevier Masson: Paris, France, 2020; pp. 31–50. [Google Scholar]
  5. Nagaraju, G.P.; Shukla, D.; Vishvakarma, N.K. (Eds.) Colon Cancer Diagnosis and Therapy: Volume 1; Springer: Cham, Switzerland, 2021. [Google Scholar] [CrossRef]
  6. Li-Chang, H.H.; Kirsch, R.; Conner, J.; Sari, A.; Pollett, A.; El-Zimaity, H.; Jain, D.; Celli, R.; Reid, S.L.; Riddell, R.H. Atlas of Intestinal Pathology: Volume 1: Neoplastic Diseases of the Intestines; Springer: Cham, Switzerland, 2019. [Google Scholar] [CrossRef]
  7. Ishida, H.; Koda, K. Recent Advances in the Treatment of Colorectal Cancer; Springer: Singapore, 2019. [Google Scholar] [CrossRef]
  8. Baatrup, G. Multidisciplinary Treatment of Colorectal Cancer: Staging—Treatment—Pathology—Palliation; Springer: Cham, Switzerland, 2021. [Google Scholar] [CrossRef]
  9. Messersmith, W.A.; Ahnen, D.J. Targeting EGFR in colorectal cancer. N. Engl. J. Med. 2008, 359, 1834–1836. [Google Scholar] [CrossRef] [PubMed]
  10. Kozovska, Z.; Gabrisova, V.; Kucerova, L. Colon cancer: Cancer stem cells markers, drug resistance and treatment. Biomed. Pharmacother. 2014, 68, 911–916. [Google Scholar] [CrossRef] [PubMed]
  11. Kawczyk-Krupka, A.; Bugaj, A.M.; Latos, W.; Zaremba, K.; Wawrzyniec, K.; Sieroń, A. Photodynamic therapy in colorectal cancer treatment: The state of the art in clinical trials. Photodiagn. Photodyn. Ther. 2015, 12, 545–553. [Google Scholar] [CrossRef]
  12. Gu, B.; Wang, B.; Li, X.; Feng, Z.; Ma, C.; Gao, L.; Yu, Y.; Zhang, J.; Zheng, P.; Wang, Y.; et al. Photodynamic therapy improves the clinical efficacy of advanced colorectal cancer and recruits immune cells into the tumor immune microenvironment. Front. Immunol. 2022, 13, 1050421. [Google Scholar] [CrossRef]
  13. Sharifkazemi, H.; Amini, S.M.; Ortakand, R.K.; Narouie, B. A Review of Photodynamic Therapy in Different Types of Tumors. J. Transl. Res. Urol. 2022, 4, 61–70. [Google Scholar] [CrossRef]
  14. Agostinis, P.; Berg, K.; Cengel, K.A.; Foster, T.H.; Girotti, A.W.; Gollnick, S.O.; Hahn, S.M.; Hamblin, M.R.; Juzeniene, A.; Kessel, D.; et al. Photodynamic therapy of cancer: An update. CA Cancer J. Clin. 2011, 61, 250–281. [Google Scholar] [CrossRef]
  15. Chilakamarthi, U.; Giribabu, L. Photodynamic Therapy: Past, Present and Future. Chem. Rec. 2017, 17, 775–802. [Google Scholar] [CrossRef]
  16. Bretin, L.; Pinon, A.; Bouramtane, S.; Ouk, C.; Richard, L.; Perrin, M.L.; Chaunavel, A.; Carrion, C.; Bregier, F.; Sol, V.; et al. Photodynamic Therapy Activity of New Porphyrin-Xylan-Coated Silica Nanoparticles in Human Colorectal Cancer. Cancers 2019, 11, 1474. [Google Scholar] [CrossRef]
  17. Hodgkinson, N.; Kruger, C.A.; Abrahamse, H. Targeted photodynamic therapy as potential treatment modality for the eradication of colon cancer and colon cancer stem cells. Tumour Biol. 2017, 39, 1010428317734691. [Google Scholar] [CrossRef] [PubMed]
  18. Castano, A.P.; Mroz, P.; Hamblin, M.R. Photodynamic therapy and anti-tumour immunity. Nat. Rev. Cancer. 2006, 6, 535–545. [Google Scholar] [CrossRef] [PubMed]
  19. Dos Santos, A.F.; De Almeida, D.R.Q.; Terra, L.F.; Baptista, M.S.; Labriola, L. Photodynamic therapy in cancer treatment—An update review. J. Cancer Metastasis Treat. 2019, 5, 25. [Google Scholar] [CrossRef]
  20. Sellera, F.P.; Nascimento, C.L.; Ribeiro, M.S. Photodynamic Therapy in Veterinary Medicine: From Basics to Clinical Practice; Springer: Cham, Switzerland, 2016. [Google Scholar] [CrossRef]
  21. Baptista, M.S.; Cadet, J.; Di Mascio, P.; Ghogare, A.A.; Greer, A.; Hamblin, M.R.; Lorente, C.; Nunez, S.C.; Ribeiro, M.S.; Thomas, A.H.; et al. Type I and Type II Photosensitized Oxidation Reactions: Guidelines and Mechanistic Pathways. Photochem. Photobiol. 2017, 93, 912–919. [Google Scholar] [CrossRef] [PubMed]
  22. Kwiatkowski, S.; Knap, B.; Przystupski, D.; Saczko, J.; Kędzierska, E.; Knap-Czop, K.; Kotlińska, J.; Michel, O.; Kotowski, K.; Kulbacka, J. Photodynamic therapy—Mechanisms, photosensitizers and combinations. J. Biomed. Pharmacother. 2018, 106, 1098–1107. [Google Scholar] [CrossRef] [PubMed]
  23. Delaire, J.; Piard, J.; Méallet-Renault, R.; Clavier, G. Photophysique et photochimie: Des fondements aux applications. In QuinteSciences; EDP Sciences: Les Ulis, France, 2016. [Google Scholar]
  24. Nowak-Stepniowska, A.; Pergoł, P.; Padzik-Graczyk, A. Photodynamic method of cancer diagnosis and therapy-mechanisms and applications. Postep. Biochem. 2013, 59, 53–63. [Google Scholar]
  25. Luksiene, Z. Photodynamic therapy: Mechanism of action and ways to improve the efficiency of treatment. Medicina 2003, 39, 1137–1150. [Google Scholar]
  26. Juzeniene, A.; Moan, J. The history of PDT in Norway Part one: Identification of basic mechanisms of general PDT. Photodiagn. Photodyn. Ther. 2007, 4, 3–11. [Google Scholar] [CrossRef]
  27. Fonseca, S.M.; Pina, J.; Arnaut, L.G.; Seixas de Melo, J.; Burrows, H.D.; Chattopadhyay, N.; Alcacer, L.; Charas, A.; Morgado, J.; Monkman, A.P.; et al. Triplet-state and singlet oxygenformation in fluorene-based alternating copolymers. J. Phys. Chem. B 2006, 110, 8278–8283. [Google Scholar] [CrossRef]
  28. Kessel, D. Death pathways associated with photodynamic therapy. Med. Laser Appl. 2006, 21, 219–224. [Google Scholar] [CrossRef]
  29. Zhu, W.; Gao, Y.H.; Liao, P.Y.; Chen, D.Y.; Sun, N.N.; Nguyen Thi, P.A.; Yan, Y.J.; Wu, X.F.; Chen, Z.L. Comparison between porphin, chlorin and bacteriochlorin derivatives for photodynamic therapy: Synthesis, photophysical properties, and biological activity. Eur. J. Med. Chem. 2018, 160, 146–156. [Google Scholar] [CrossRef] [PubMed]
  30. Köberle, B.; Schoch, S. Platinum Complexes in Colorectal Cancer and Other Solid Tumors. Cancers 2021, 13, 2073. [Google Scholar] [CrossRef] [PubMed]
  31. Lazarević, T.; Rilak, A.; Bugarčić, Ž.D. Platinum, palladium, gold and ruthenium complexes as anticancer agents: Current clinical uses, cytotoxicity studies and future perspectives. Eur. J. Med. Chem. 2017, 142, 8–31. [Google Scholar] [CrossRef]
  32. Alessio, E.; Mestroni, G.; Bergamo, A.; Sava, G. Ruthenium antimetastatic agents. Curr. Top. Med. Chem. 2004, 4, 1525–1535. [Google Scholar] [CrossRef] [PubMed]
  33. Lee, S.Y.; Kim, C.Y.; Nam, T.G. Ruthenium Complexes as Anticancer Agents: A Brief History and Perspectives. Drug Des. Dev. Ther. 2020, 14, 5375–5392. [Google Scholar] [CrossRef]
  34. Schmitt, F.; Govindaswamy, P.; Süss-Fink, G.; Ang, W.H.; Dyson, P.J.; Juillerat-Jeanneret, L.; Therrien, B. Ruthenium porphyrin compounds for photodynamic therapy of cancer. J. Med. Chem. 2008, 51, 1811–1816. [Google Scholar] [CrossRef]
  35. Rani-Beeram, S.; Meyer, K.; McCrate, A.; Hong, Y.; Nielsen, M.; Swavey, S. A Fluorinated Ruthenium Porphyrin as a Potential Photodynamic Therapy Agent: Synthesis, Characterization, DNA Binding, and Melanoma Cell Studies. Inorg. Chem. 2008, 47, 11278–11283. [Google Scholar] [CrossRef]
  36. Monro, S.; Colón, K.L.; Yin, H.; Roque, J.; Konda, P.; Gujar, S.; Thummel, R.P.; Lilge, L.; Cameron, C.G.; McFarland, S.A. Transition Metal Complexes and Photodynamic Therapy from a Tumor-Centered Approach: Challenges, Opportunities, and Highlights from the Development of TLD1433. Chem. Rev. 2019, 119, 797–828. [Google Scholar] [CrossRef]
  37. Gallardo-Villagrán, M.; Paulus, L.; Charissoux, J.L.; Leger, D.Y.; Vergne-Salle, P.; Therrien, B.; Liagre, B. Ruthenium-based assemblies incorporating tetrapyridylporphyrin panels: A photosensitizer delivery strategy for the treatment of rheumatoid arthritis by photodynamic therapy. Dalton Trans. 2022, 51, 9673–9680. [Google Scholar] [CrossRef]
  38. Barry, N.P.E.; Zava, O.; Dyson, P.J.; Therrien, B. Synthesis, Characterization and Anticancer Activity of Porphyrin-Containing Organometallic Cubes. Aust. J. Chem. 2010, 63, 1529–1537. [Google Scholar] [CrossRef]
  39. Baskaran, R.; Lee, J.; Yang, S.G. Clinical development of photodynamic agents and therapeutic applications. Biomater. Res. 2018, 22, 25. [Google Scholar] [CrossRef] [PubMed]
  40. Sun, R.W.-Y.; Zhang, M.; Li, D.; Li, M.; Wong, A.S.-T. Enhanced anti-cancer activities of a gold(III) pyrrolidinedithiocarbamato complex incorporated in a biodegradable metal-organic framework. J. Inorg. Biochem. 2016, 163, 1–7. [Google Scholar] [CrossRef] [PubMed]
  41. Schmitt, F.; Govindaswamy, P.; Zava, O.; Süss-Fink, G.; Juillerat-Jeanneret, L.; Therrien, B. Combined arene ruthenium porphyrins as chemotherapeutics and photosensitizers for cancer therapy. J. Biol. Inorg. Chem. 2009, 14, 101–109. [Google Scholar] [CrossRef] [PubMed]
  42. Bogoeva, V.; Siksjø, M.; Sæterbø, K.G.; Melø, T.B.; Bjørkøy, A.; Lindgren, M.; Gederaas, O.A. Ruthenium porphyrin-induced photodamage in bladder cancer cells. Photodiagn. Photodyn. Ther. 2016, 14, 9–17. [Google Scholar] [CrossRef] [PubMed]
  43. Gallardo-Villagrán, M.; Paulus, L.; Charissoux, J.L.; Sutour, S.; Vergne-Salle, P.; Leger, D.Y.; Liagre, B.; Therrien, B. Evaluation of Ruthenium-Based Assemblies as Carriers of Photosensitizers to Treat Rheumatoid Arthritis by Photodynamic Therapy. Pharmaceutics 2021, 13, 2104. [Google Scholar] [CrossRef]
  44. Silva, S.L.R.; Baliza, I.R.S.; Dias, R.B.; Sales, C.B.S.; Gurgel Rocha, C.A.; Soares, M.B.P.; Correa, R.S.; Batista, A.A.; Bezerra, D.P. Ru(II)-thymine complex causes DNA damage and apoptotic cell death in human colon carcinoma HCT116 cells mediated by JNK/p38/ERK1/2 via a p53-independent signaling. Sci. Rep. 2019, 9, 11094. [Google Scholar] [CrossRef]
  45. Mishra, A.K.; Mishra, L. Ruthenium Chemistry; Pan Stanford Publishing Pte. Ltd.: Singapore, 2018. [Google Scholar] [CrossRef]
  46. Lu, Y.; Shen, T.; Yang, H.; Gu, W. Ruthenium Complexes Induce HepG2 Human Hepatocellular Carcinoma Cell Apoptosis and Inhibit Cell Migration and Invasion through Regulation of the Nrf2 Pathway. Int. J. Mol. Sci. 2016, 17, 775. [Google Scholar] [CrossRef]
  47. Barry, N.P.E.; Austeri, M.; Lacour, J.; Therrien, B. Highly Efficient NMR Enantiodiscrimination of Chiral Octanuclear Metalla-Boxes in Polar Solvent. Organometallics 2009, 28, 4894–4897. [Google Scholar] [CrossRef]
  48. Rioux, B.; Pinon, A.; Gamond, A.; Martin, F.; Laurent, A.; Champavier, Y.; Barette, C.; Liagre, B.; Fagnère, C.; Sol, V.; et al. Synthesis and biological evaluation of chalcone-polyamine conjugates as novel vectorized agents in colorectal and prostate cancer chemotherapy. Eur. J. Med. Chem. 2021, 222, 113586. [Google Scholar] [CrossRef]
Figure 1. Molecular structures of the metalla-assemblies: 2H-TPyP-arene-Ru (M = 2H) or Zn-TPyP-arene-Ru (M = Zn).
Inorganics 11 00451 g001
Figure 2. Photocytotoxic effect of 2H-TPyP-arene-Ru (A) and Zn-TPyP-arene-Ru (B) on HCT116 cells. Cells were seeded in 96-well plates and cultured for 36h before being treated or not with 2H-TPyP-arene-Ru or Zn-TPyP-arene-Ru. After 24 h incubation, cells were irradiated or not with a 630–660 nm CURElight lamp at 75 J/cm2 (PhotoCure ASA, Oslo, Norway). MTT assays were performed at 24 and 48 h after irradiation, and cell cytotoxicity was expressed as a percentage of each treatment condition compared with untreated cells. Data are presented as mean ± SEM (n = 3). * p < 0.05; ** p < 0.01 and *** p < 0.001.
Inorganics 11 00451 g002
Figure 3. Photocytotoxic effect of 2H-TPyP-arene-Ru (A) and Zn-TPyP-arene-Ru (B) on HT-29 cells. Cells were seeded in 96-well plates and cultured for 36 h before being treated or not with 2H-TPyP-arene-Ru or Zn-TPyP-arene-Ru. After 24 h incubation, the cells were washed and irradiated or not with a CURElight lamp from 630–660 nm at 75 J/cm2 (PhotoCure ASA, Oslo, Norway). MTT assays were performed at 24 and 48 h after irradiation, and cell cytotoxicity was expressed as a percentage of each treatment condition compared with untreated cells. Data are presented as mean ± SEM (n = 3). * p < 0.05; ** p < 0.01 and *** p < 0.001.
Inorganics 11 00451 g003
Figure 4. ROS generation by TPyP-arene-Ru on HCT116 (A) and HT-29 (B) cell lines. Cells were treated or not with 2H-TPyP-arene-Ru or Zn-TPyP-arene-Ru at IC50 concentrations. The cells were labeled with DCFDA and irradiated or not. ROS production was then quantified via flow cytometry and interpreted using the % positive fluorescence values given in the tables. *** p < 0.001.
Inorganics 11 00451 g004
Figure 5. Cellular internalization of TPyP-arene-Ru in HCT116 (A) and HT-29 (B) cells. Cells were treated with 2H-TPyP-arene-Ru and Zn-TPyP-arene-Ru at IC50 concentrations. After 24 h incubation, the fluorescence of 2H-TPyP-arene-Ru (excitation: 405 nm; emission: 650 nm) and Zn-TPyP-arene-Ru (excitation: 561 nm; emission: 655 nm) was analyzed via flow cytometry coupled to AMNIS® image analysis. In graphs, cells treated with TPyP-arene-Ru complexes (green line) were compared to untreated cells (blue line).
Inorganics 11 00451 g005
Figure 6. Cellular internalization of TPyP-arene-Ru by confocal microscopy on HCT116 (A) and HT-29 (B) cells. Cells were seeded at the appropriate density and cultured for 36 h in an incubation chamber with a coating of type I collagen and acetic acid. Cells were then treated with 2H-TPyP-arene-Ru (excitation: 405 nm; emission: 650 nm) and Zn-TPyP-arene-Ru (excitation: 561 nm; emission: 655 nm) at IC50 concentrations. Fluorescence of both compounds was determined via confocal microscopy, and cell internalization was determined using the Image J image-processing software (version 1.54f). Images show the different treatment conditions. Yellow scale bar = 20 µm.
Inorganics 11 00451 g006
Figure 7. Effects of photoactivation of TPyP-arene-Ru on the cell cycle distribution in HCT116 cells. Cells were grown for 36 h in an appropriate culture medium before exposure or not to 2H-TPyP-arene-Ru or Zn-TPyP-arene-Ru complexes at IC50 concentrations. After 24 or 48 h incubation, cells were irradiated or not with a 630–660 nm CURElight lamp at 75 J/cm2 (PhotoCure ASA, Oslo, Norway), then subjected to flow cytometry analysis using PI staining after PDT. Images of cell cycle analysis (A) are representative of three separate experiments. Results of flow cytometry analysis are represented by histograms (B) that display the percentage of cells in each cell cycle phase. Data are shown as mean ± SEM (n = 3). ** p < 0.01 and *** p < 0.001.
Inorganics 11 00451 g007
Figure 8. Effects of photoactivation of TPyP-arene-Ru on the cell cycle distribution in HT-29 cells. Cells were grown for 36 h in an appropriate culture medium before exposure or not to 2H-TPyP-arene-Ru or Zn-TPyP-arene-Ru complexes at IC50 concentrations. After 24 or 48 h incubation, cells were irradiated or not with a 630–660 nm CURElight lamp at 75 J/cm2 (PhotoCure ASA, Oslo, Norway), then subjected to flow cytometry analysis using PI staining after PDT. Images of cell cycle analysis (A) are representative of three separate experiments. Results of flow cytometry analysis are represented by histograms (B) that display the percentage of cells in each cell cycle phase. Data are shown as mean ± SEM (n = 3). * p < 0.05; ** p < 0.01 and *** p < 0.001.
Inorganics 11 00451 g008
Figure 9. Apoptosis effects of photoactivation of TPyP-arene-Ru on HCT116 (A,B) and HT-29 (C,D) cell lines. Cells were grown for 36 h in an appropriate culture medium before exposure or not to 2H-TPyP-arene-Ru or Zn-TPyP-arene-Ru complexes at IC50 concentrations. After 24 or 48 h incubation, cells were irradiated or not with a 630–660 nm CURElight lamp at 75 J/cm2 (PhotoCure ASA, Oslo, Norway). HCT116 and HT-29 cells were also stained 24 h post-PDT (AC) and 48 h post-PDT (BD) with Annexin V-FITC and PI, and apoptosis was analyzed via flow cytometry. The upper right quadrant represents the percentage of late apoptosis, and the lower right quadrant represents early apoptosis. Images shown are representative of three separate experiments.
Inorganics 11 00451 g009
Figure 10. Quantitative analysis of activated caspases-3/-7 in HCT116 cells over 48 h. HCT116 cells were seeded and cultured for 36 h and then treated with 2H-TPyP-arene-Ru or Zn-TPyP-arene-Ru at IC50 concentrations. Cells were then irradiated, co-treated with caspases-3/-7 green reagent, and placed in the IncuCyte® S3 live cell analysis system. Every 2 h, cells were imaged at a rate of 4 images per well in phase contrast and green fluorescence using the ×20 objective. (A) The number of cells undergoing apoptosis was quantified using IncuCyte® software (version 2022A Rev1) using the ratio of the percentage of green fluorescent cells normalized by the percentage of total cells in each well over 48 h. Data are shown as mean ± SEM (n = 3). *** p < 0.001. (B) Representative images are shown for each condition at 0, 6, 12, 24, and 48 h. Yellow scale bar = 200 µm.
Inorganics 11 00451 g010
Figure 11. Quantitative analysis of activated caspases-3/-7 in HT-29 cells over 48 h. HT-29 cells were seeded and cultured for 36 h and then treated with 2H-TPyP-arene-Ru or Zn-TPyP-arene-Ru at IC50 concentrations. Cells were then irradiated, co-treated with caspases-3/-7 green reagent, and placed in the IncuCyte® S3 live cell analysis system. Every 2 h, cells were imaged at a rate of 4 images per well in phase contrast and green fluorescence using the ×20 objective. (A) The number of cells undergoing apoptosis was quantified using IncuCyte® software (version 2022A Rev1) using the ratio of the percentage of green fluorescent cells normalized by the percentage of total cells in each well over 48 h. Data are shown as mean ± SEM (n = 3). *** p < 0.001. (B) Representative images are shown for each condition at 0, 6, 12, 24, and 48 h. Yellow scale bar = 200 µm.
Inorganics 11 00451 g011
Figure 12. Effects of photoactivation of TPyP-arene-Ru on protein expression of apoptotic markers in HCT116 (A) and HT-29 (B) cells. Cells were seeded at the determined density and cultured for 36 h, then treated or not with 2H-TPyP-arene-Ru or Zn-TPyP-arene-Ru at IC50 concentrations. After 24 or 48 h incubation, the culture medium was replaced, and cells were irradiated or not. At 24 and 48 h post-irradiation, the cells were then recovered and protein expression determined via WB. β-actin was used as the reference protein.
Inorganics 11 00451 g012
Figure 13. Effects of photoactivation of TPyP-arene-Ru on DNA fragmentation HCT116 (A,B) and HT-29 (C,D) cells. Cells were grown for 36 h in an appropriate culture medium before exposure or not to 2H-TPyP-arene-Ru or Zn-TPyP-arene-Ru complexes at IC50 concentrations. After 24 or 48 h incubation, cells were irradiated or not with a 630–660 nm CURElight lamp at 75 J/cm2 (PhotoCure ASA, Oslo, Norway). DNA fragmentation in both cell lines 24 h post-PDT (A,C) and 48 h post-PDT (B,D) was quantified from cytosol extracts via ELISA. Results are reported as n-fold compared to control. Data are shown as mean ± SEM (n = 3). * p < 0.05, ** p < 0.01 and *** p < 0.001.
Inorganics 11 00451 g013
Table 1. IC50 values (nM) determined with MTT assays on HCT116 and HT-29 cells. PI = phototoxic index.
PSIC50 (nM)PI
(IC50 Dark/IC50 Light)
Light
24 h
Light
48 h
Dark24 h48 h
HCT1162H-TPyP-arene-Ru41.935.2> 100> 2.38> 2.84
Zn-TPyP-arene-Ru331207> 1000> 3.02> 4.83
HT-292H-TPyP-arene-Ru67.854.1> 100> 1.47> 1.84
Zn-TPyP-arene-Ru394379> 1000> 2.53> 2.63
Disclaimer/Publisher’s Note: The statements, opinions and data contained in all publications are solely those of the individual author(s) and contributor(s) and not of MDPI and/or the editor(s). MDPI and/or the editor(s) disclaim responsibility for any injury to people or property resulting from any ideas, methods, instructions or products referred to in the content.

