Article

Valence Tautomerism in Chromium Half-Sandwich Triarylmethylium Dyads †

Department of Chemistry, Universität Konstanz, Universitätsstraße 10, 78464 Konstanz, Germany
*
Author to whom correspondence should be addressed.
This work is dedicated to Prof. Otto J. Scherer, a full-blood, enthusiastic chemist and inspiring mentor on the occasion of his 90th birthday.
Inorganics 2023, 11(11), 448; https://doi.org/10.3390/inorganics11110448
Submission received: 26 October 2023 / Revised: 13 November 2023 / Accepted: 15 November 2023 / Published: 20 November 2023
(This article belongs to the Special Issue 10th Anniversary of Inorganics: Organometallic Chemistry)

Abstract

:
Valence tautomerism (VT) may occur if a molecule contains two chemically different redox-active units, which differ only slightly in their intrinsic redox potential. Herein, we present three new half-sandwich complexes [(η6-arene)Cr(CO)2L]+ with a triarylmethylium substituent appended to the π-coordinated arene and different coligands L (L = CO, P(OPh)3, PPh3, 1+3+) at the chromium atom. Ligand substitution purposefully lowers the half-wave potential for chromium oxidation and thereby the redox potential difference towards tritylium reduction. For the PPh3-substituted complex 3+, cyclic voltammetry measurements indicate that chromium oxidation and tritylium reduction occur at (almost) the same potential. This renders the diamagnetic Cr(0)-C6H4-CAr2+ form 3+, and its paramagnetic diradical Cr(I)+•-C6H4-CAr2 valence tautomer 3+•• energetically nearly degenerate. Temperature-dependent IR spectroscopy indeed shows two pairs of carbonyl bands that are assignable to a Cr(0) and a Cr(I) species, coexisting in a T-dependent equilibrium with almost equal quantities for both at −70 °C. The diradical form with one unpaired spin at the trityl unit engages in a monomer ⇌ dimer equilibrium, which was investigated by means of quantitative EPR spectroscopy. The diradical species 1+••3+•• were found to be highly reactive, leading to several identified reaction products, which presumably result from hydrogen atom abstraction via the trityl C atom, e.g., from the solvent.

Graphical Abstract

1. Introduction

Valence tautomerism (VT) is characterized by the coexistence of two (or more) redox isomers that differ in their charge and spin density distribution, hence the oxidation state assignment to the individual redox sites. VT may occur if a molecule contains two chemically different redox-active entities, which are oxidized or reduced at similar redox potentials [1]. Interconversion between individual valence tautomers occurs via an intramolecular electron transfer and can be induced by external triggers, e.g., irradiation with light [2,3,4,5] or X-ray [6,7], or variations in temperature [8,9,10,11,12]. This renders them stimuli-responsive.
Several examples of metal complexes exhibiting VT are known in the literature [1,13,14,15]. An early example of valence tautomerism occurring in sandwich complexes was provided by Veciana’s group in 2003 [12] when they presented a dyad comprising of a ferrocenyl building block and a perchlorotriphenylmethyl (PTM) radical as redox-active units, bridged by a vinylene linker. Thermally induced intramolecular electron transfers from the ferrocenyl unit to the PTM radical result in the zwitterionic ferrocenium–trityl complex shown at the top of Scheme 1. The valence tautomeric equilibrium was analyzed via T-dependent 57Fe-Mößbauer spectroscopy, showing both Fe(II) and Fe(III) signals.
Trityl-type compounds such as CAr3z can not only exist as radicals CAr3 (z = 0) or anions CAr3 (z = −1) but also as tritylium cations CAr3+ (z = +1) [17,18,19,20]. Attaching a suitable tritylium unit CAr3+ to ferrocene can therefore result in VT between a diamagnetic ferrocene–tritylium form and a paramagnetic ferrocenium–trityl diradical isomer (Scheme 1, bottom). This would render such complexes magnetochemical switches. While we have recently shown that VT can purposefully be implemented in ferrocene–tritylium complexes via tailoring the reduction potential of the tritylium unit [16,21], there are some inherent disadvantages of such dyads: (i) Altering the oxidation potential of the ferrocene unit (e.g., via the methylation of cyclopentadienide ligands) turned out to be synthetically challenging. (ii) Due to very fast electron spin relaxation, ferrocenium ions show extremely broad and low-intensity EPR signals, which are only observable at very low temperatures, usually at 10 K or below [22,23]. This made it very difficult for us to observe the EPR signatures of both types of radicals at the same time since the diradical ferrocenium isomer is thermodynamically less stable [16]. We therefore sought better alternatives for the ferrocenyl donor, which combine the advantages of a facile adjustment of its oxidation potential and a more straightforward means to detect the actual oxidation state of the metal ion with the aid of molecular spectroscopy.
Examples of such candidates are chromium half-sandwich complexes such as [(η6-arene)Cr(CO)2L]. The simplest representative, [(η6-C6H6)Cr(CO)3], was first published by Fischer and Öfele in 1957 [24]. This was soon followed by a vast variety of other chromium half-sandwich complexes [25,26,27,28] and the development of more convenient synthetic approaches [29,30]. The herein proposed electron-rich [(η6-arene)Cr(CO)2L] complexes to be used as donors in such dyads have some advantages over the previously employed ferrocene. First, the oxidation potential of the chromium unit can easily be adjusted by substituting one CO ligand for a better σ-donor/weaker π-acceptor L [31]. This is demonstrated by the shift in the half-wave potential of chromium oxidation by −660 mV upon the substitution of one CO ligand in [(η6-C6H6)Cr(CO)3] for triphenylphosphine, PPh3 [32]. Secondly, CO ligands are excellent charge-sensitive labels for infrared (IR) spectroscopy. As the energies of the CO stretching vibrations of Cr(0) and Cr(I) redox states differ by 100–150 cm−1 [31,32,33] and the CO band intensities vary only a little with respect to the chromium oxidation state [34], IR spectroscopy provides an easy method for probing the valence tautomeric equilibrium. Thirdly, the chromium-centered radical is already EPR-active at 77 K [32,33,35], which is much more convenient compared to the need for 10 K measurements for ferrocenium species.
The main aim of this work is the purposeful implementation of VT into [(η6-arene)Cr(CO)2L]−triarylmethylium dyads via tuning the oxidation potential of the metal unit. The valence tautomeric equilibrium of the envisioned chromium half-sandwich complexes is designed to occur between a diamagnetic Cr(0)-C6H4-CAr2+ species and a paramagnetic Cr(I)+•-C6H4-CAr2 species (cf. Scheme 2).

2. Results and Discussion

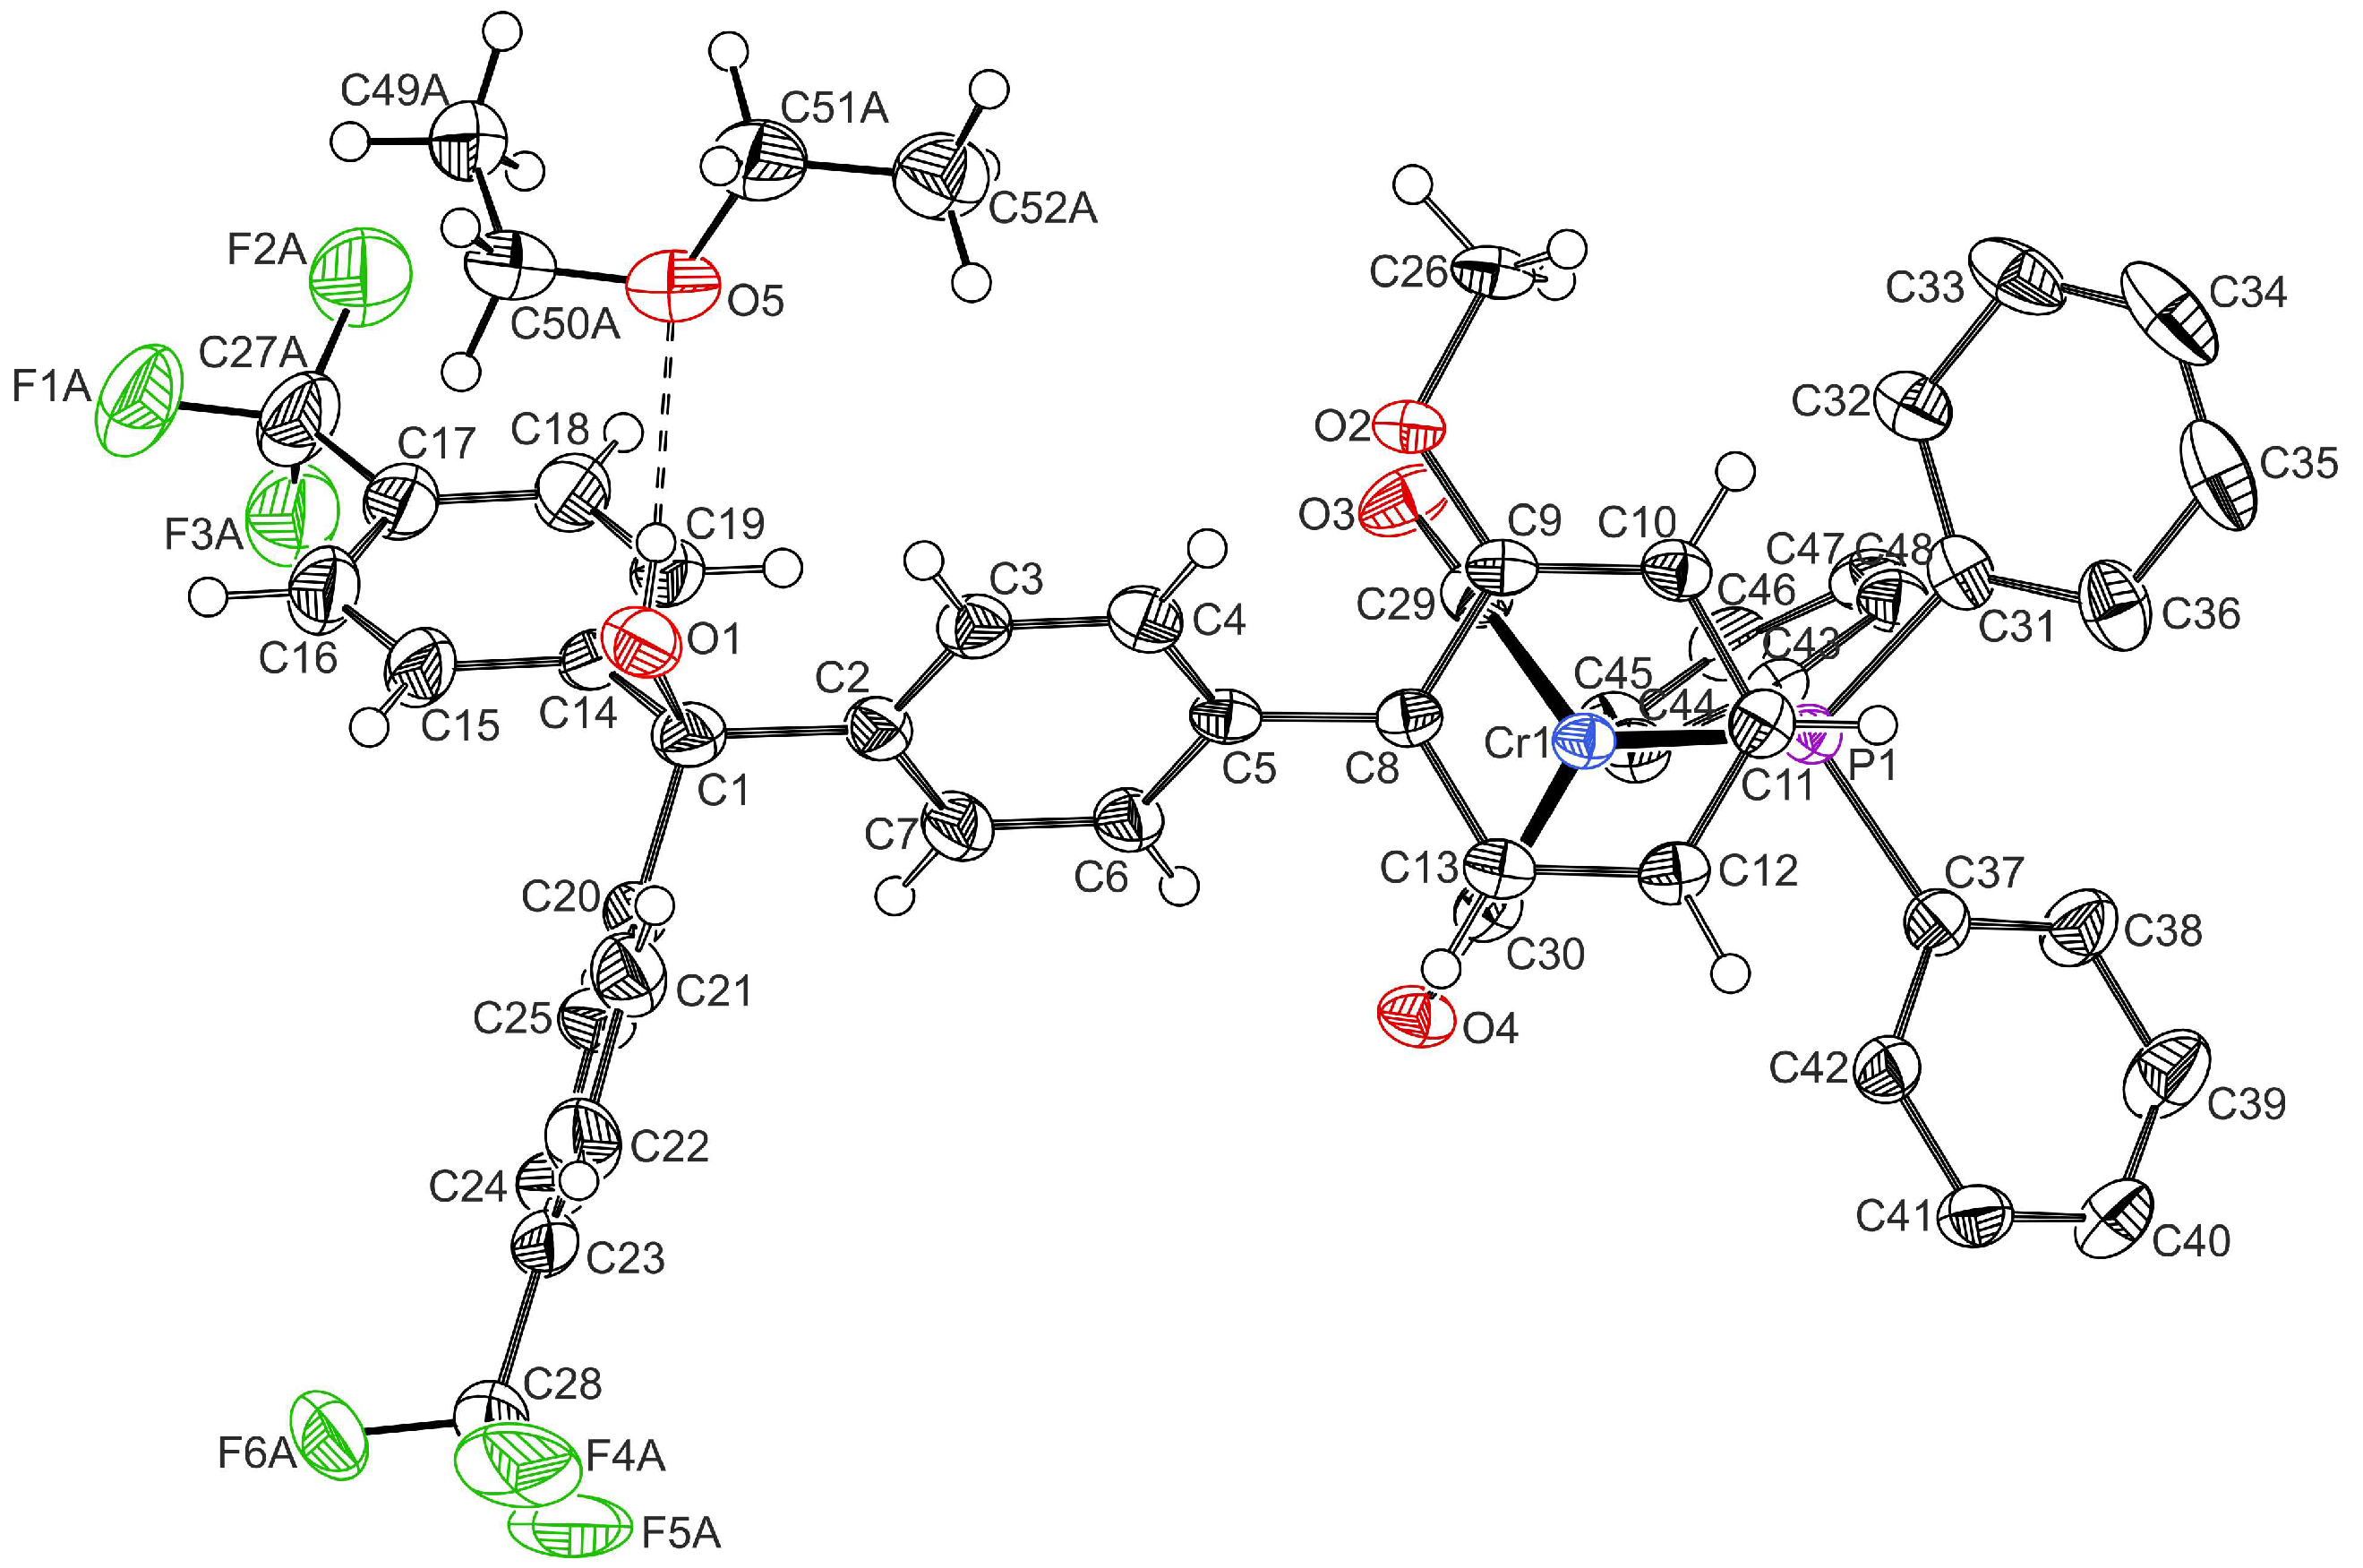
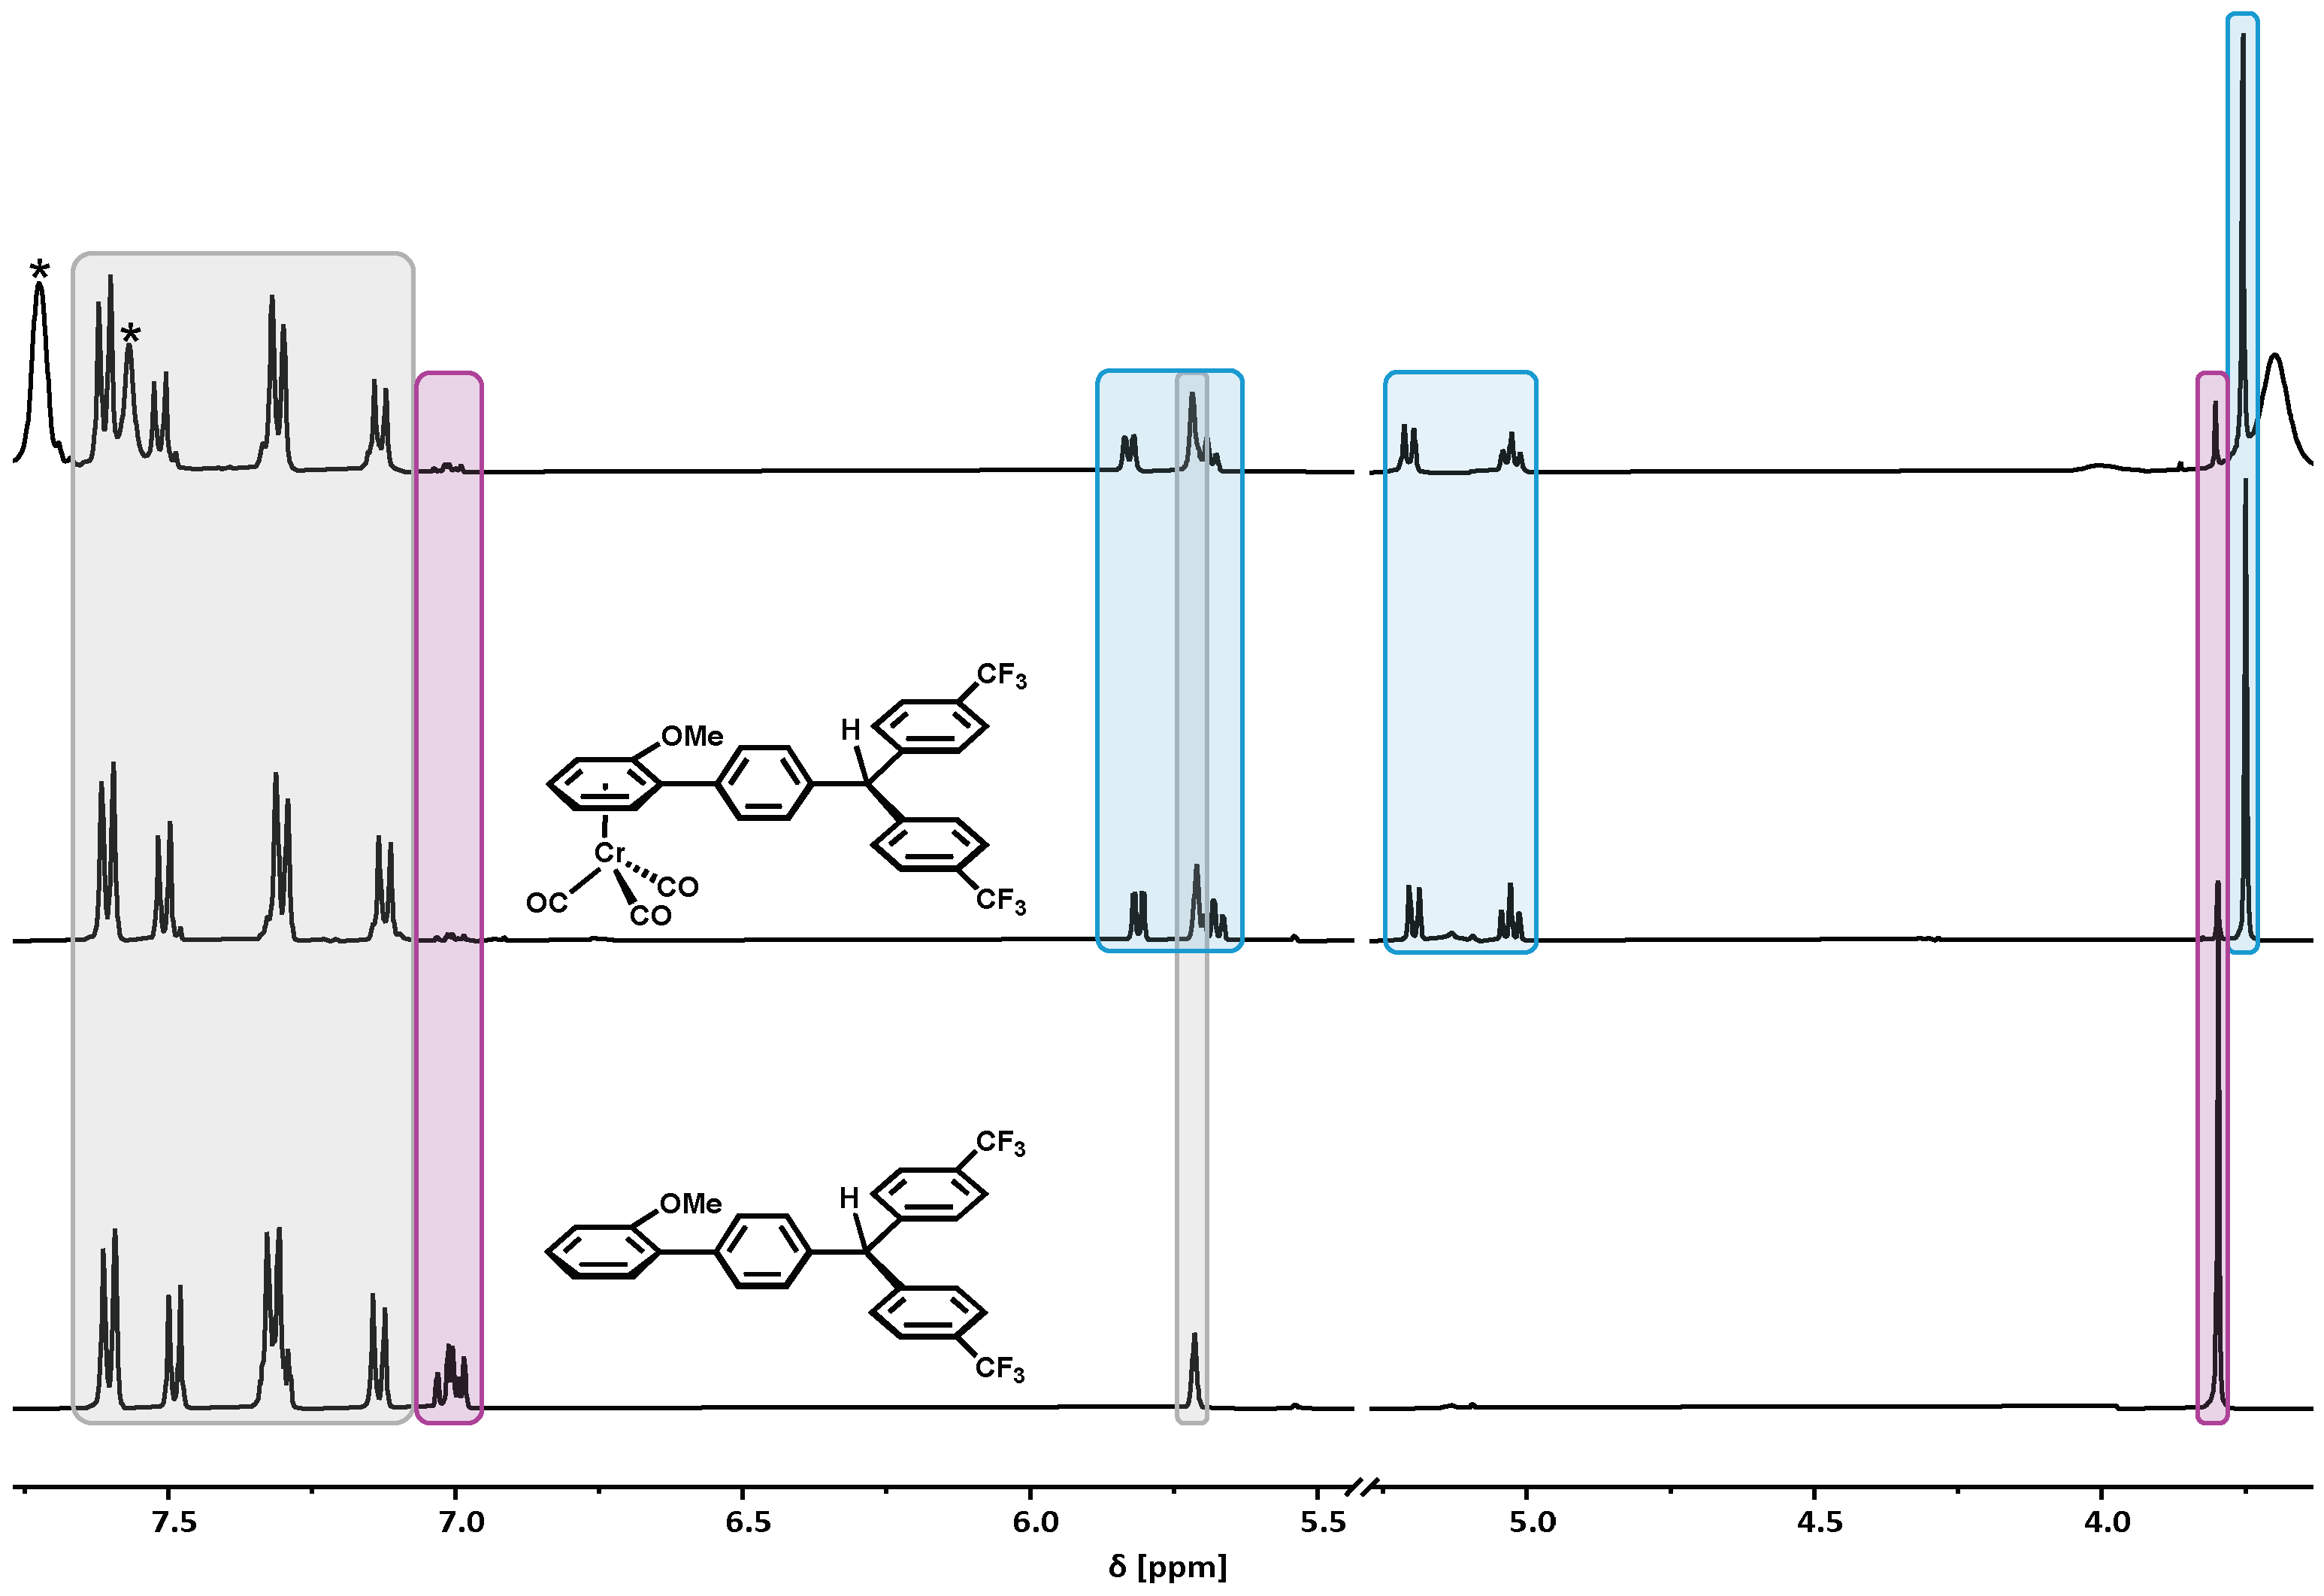
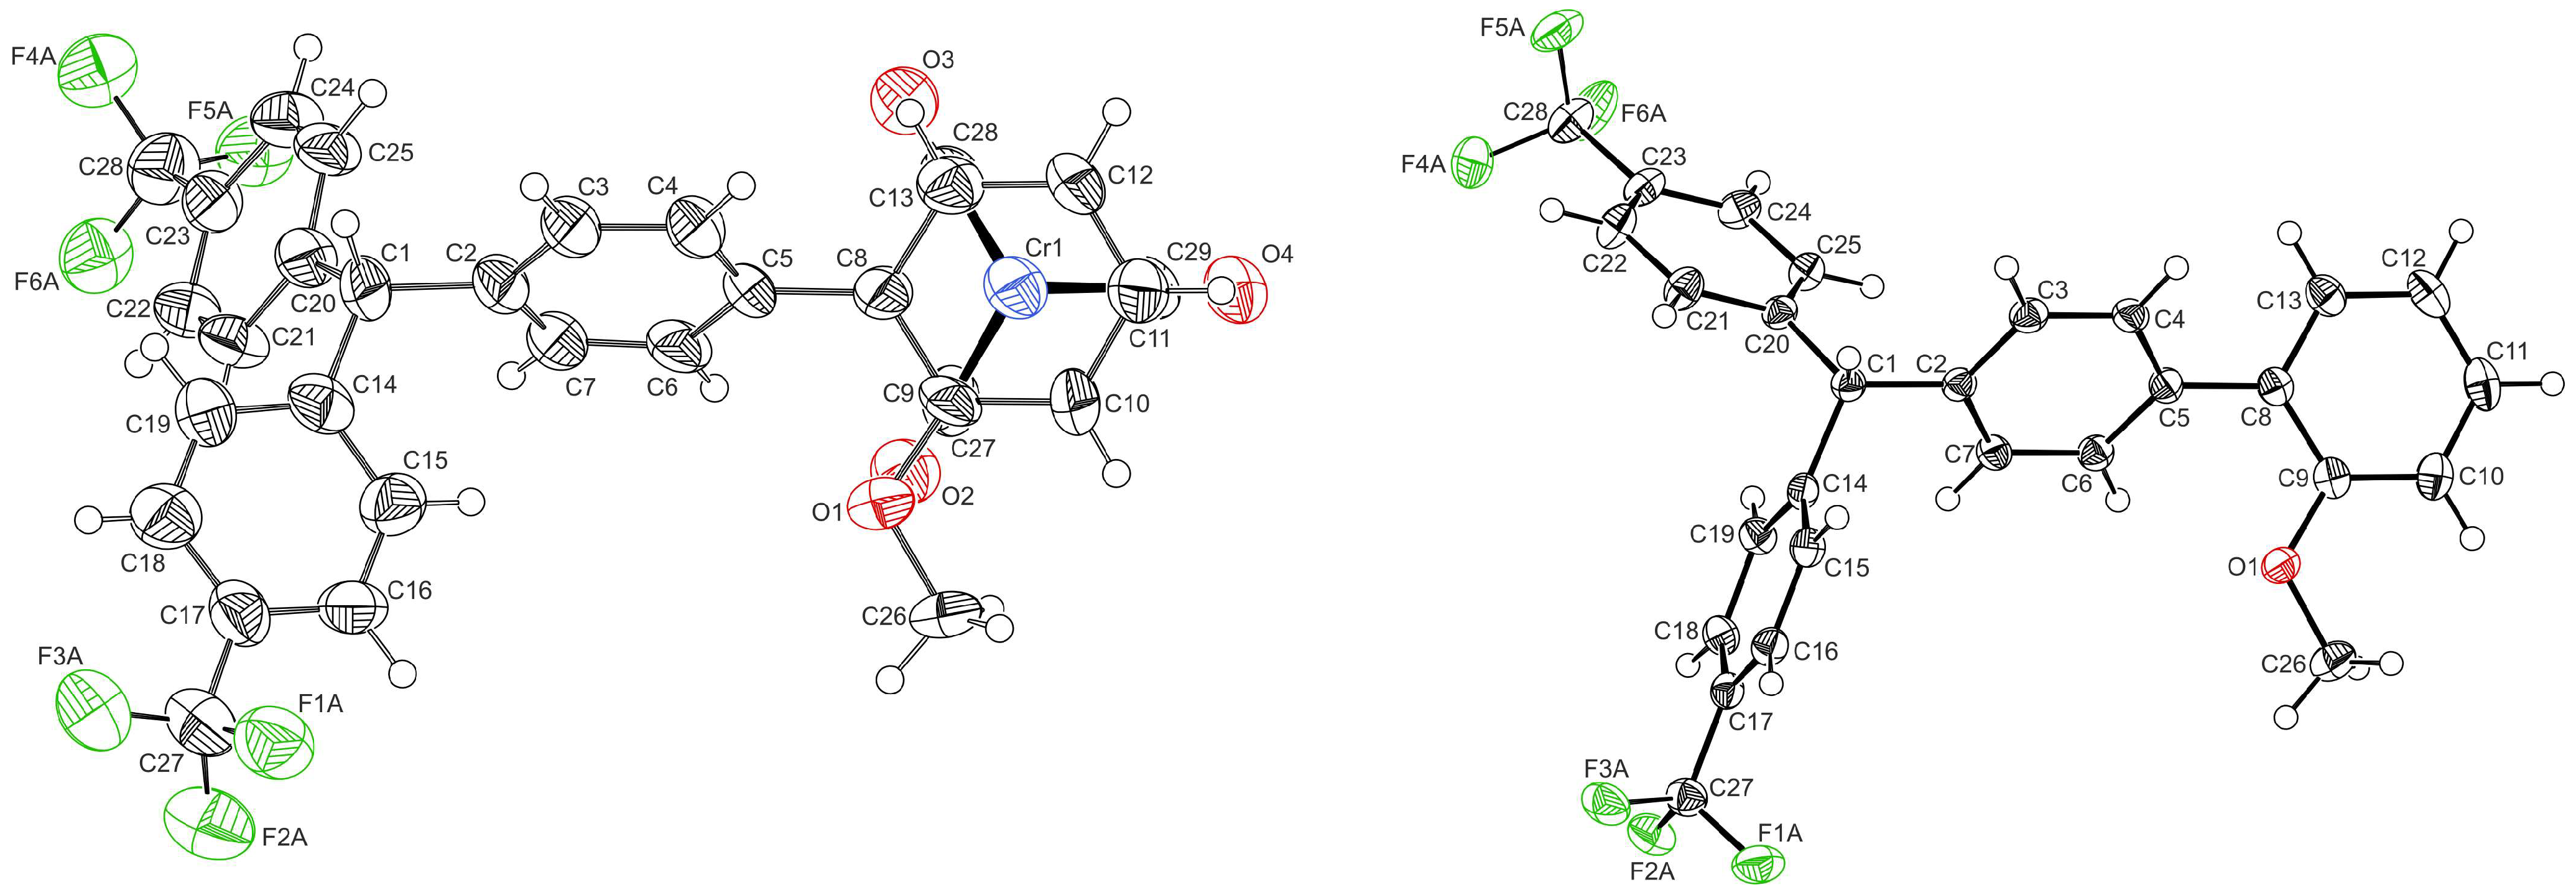
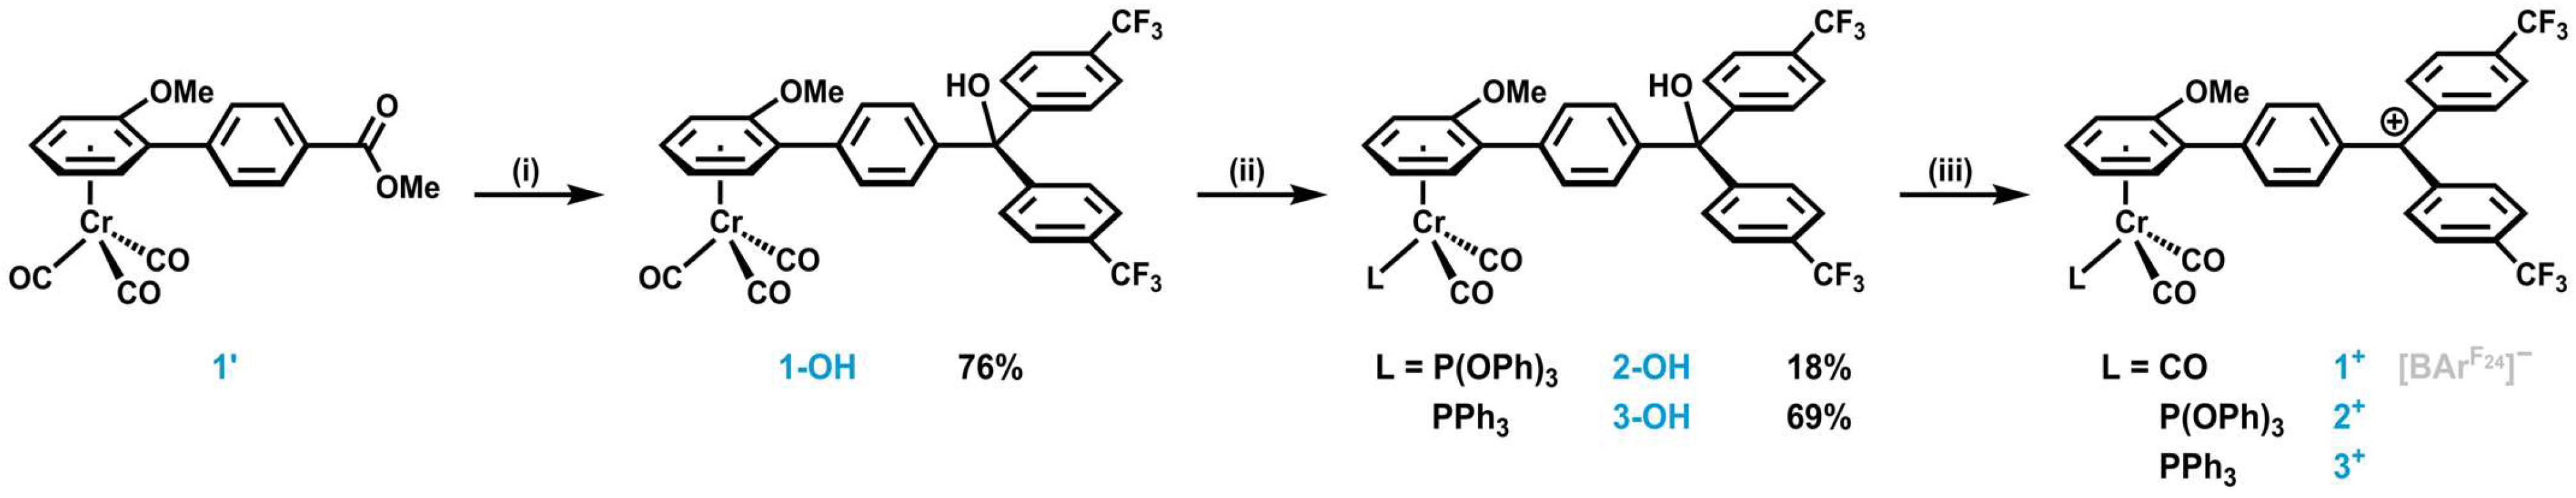
2.1. Synthesis and Characterization

We prepared three chromium half-sandwich complexes with a different coligand L at the chromium atom, where a tritylium unit is attached to the π-coordinated anisole ring via a phenylene spacer. Variations in L are intended for adjusting the redox potential difference between chromium oxidation and tritylium reduction and hence the free enthalpy difference ΔG between the two valence tautomers. In order to maintain the reduction potential of the tritylium unit in a viable range, we implemented electron-withdrawing trifluoromethyl groups in the para-positions of the remaining phenyl rings (see Scheme 2).
Complexes 1+3+ were synthesized in four (1+) or five steps (2+, 3+), as detailed in Scheme 3. [(η6-anisole)Cr(CO)3] was synthesized according to the literature [30] and converted into biaryl ester 1′ via Murahashi coupling with methyl-4-iodobenzoate [36]. The nucleophilic addition of two equivalents of 4-trifluromethylphenyl lithium to the ester functionality of 1′ resulted in the formation of the carbinol 1-OH. The photochemical ligand substitution [37,38] of one carbonyl ligand by either triphenylphosphite, P(OPh)3, or triphenylphosphine, PPh3, yielded precursors 2-OH and 3-OH. Due to the general light sensitivity of [(η6-arene)Cr(CO)3] complexes, the yields of the carbinol precursors were only moderate, ranging from 18 to 76%. The carbinols were characterized via NMR and IR spectroscopy, as well as mass spectrometry (MS). The corresponding spectra are provided in Figures S1–S15 in the Supplementary Materials. Subsequent protolytic dehydration via the addition of Brookhart’s acid [H(OEt2)2]+ [B{C6H3(CF3)2-3,5}4] [39], denoted henceforth as HBArF24, yielded tritylium complexes 1+3+. Although the very weakly nucleophilic [B{C6H3(CF3)2-3,5}4] ([BArF24]) counterion endowed ferrocene–tritylium complexes with sufficient stability to allow for the recording of their NMR spectra and their handling at r.t. [40,41,42], complexes 1+3+ already start to decompose at −40 °C or even below. This precluded us from characterizing them via NMR spectroscopy and mass spectrometry. It was nevertheless possible to identify and investigate 1+3+ by means of low-temperature IR and EPR spectroscopy and cyclic voltammetry (CV). As will be shown later, their instability is mainly due to the high reactivity of diradical redox isomers 1+••3+••.
Single crystals of the biaryl precursor complex 1′ and carbinol 3-OH that were suitable for X-ray crystallography were obtained via the vapour diffusion of n-pentane into a solution of complex 1′ in dichloromethane or a diethylether solution of 3-OH. 1′ crystallizes in the triclinic space group P 1 ¯ , and 3-OH crystallizes in the monoclinic space group P21/c as an ether disolvate; both as racemic mixtures of Sp and Rp enantiomers. Details with respect to data collection, structure solution, and refinement are shown in Tables S2 and S3 of the Supplementary Materials. Table 1 compares the most important bond lengths and angles. A drawing of the molecular structure of complex 1′ can be found in Figure S16 of the Supplementary Materials. The molecular structure of the Sp enantiomer of carbinol 3-OH is displayed in Figure 1. The pseudo-tetrahedral [(η6-arene)Cr(CO)2(PPh3)] fragment in 3-OH adopts an eclipsed conformation, in which the PPh3 ligand is in the anti-position with respect to the carbinol substituent. For 1′, the conformation is only nearly eclipsed. With a torsion angle of 17.4(4) (1′) and 5.6(4)° (3-OH), respectively, the methoxy substituent resides in the plane of the phenyl ring so as to improve its electron-donating capabilities towards the metal-coordinated arene ring, just as it was observed for other alkoxy-substituted chromium half-sandwich complexes [43,44,45,46,47,48]. The torsion angle between the planes of the coordinated anisole ring (PhCr) and the phenylene spacer (Ph1) is 53.63(17) and 52.55(14)°, respectively, similarly to other [(biaryl)Cr(CO)3] complexes bearing an ortho-substituent [49]. Ring torsion between the coordinated π-perimeter and the linker is thus substantially greater than in [(η5-C5H5)Fe(η5-C5H4-C6H4)-C(OH)Ar2] complexes that lack an ortho-substituent at the biaryl connection, where they range from 12.3(3) to 24.19(12)° [42]. Enhanced ring torsion is expected to result in a more efficient decoupling of the two units, which itself is beneficial for achieving electronic bistability.
Both complexes show interesting packing motifs in the crystal lattice. As shown in Figure S17b,c of the Supplementary Materials, the different enantiomers of 1′ (cf. Figure S17a) align in an antiparallel fashion to tail-to-tail dimers. They interact via pairwise C-H···O hydrogen bonds between the methyl protons of the ester substituent and the O atom of a carbonyl ligand and the methoxy substituent of the coordinated benzene ring, as well as a C-H···π interaction to the phenylene linker. The dimers are packed in rows along the b axis of the unit cell with pairwise C-H···π interactions between η6-bonded anisole rings, while complexes with the same optical configuration align along a axis via C-H···O contacts between a proton of the phenylene linker and the ester carbonyl.
In the case of 3-OH, the carbinol hydroxyl group forms an O-H···O hydrogen bond of 2.053(3) Å with one of the ether solvate molecules, whereas the other ether molecule occupies voids in the crystal lattice without forming any short contacts. In the crystal lattice, the Rp and Sp enantiomers of 3-OH align alternately to chains that run along the b axis of the unit cell. These chains are held together by three short C-H···O hydrogen bonds of 2.528(2), 2.528(2), and 2.502(2) Å between one proton of the coordinated anisole ring and the PPh3 ligand; a methoxy proton also interacts with the O atoms of the two CO ligands of each molecule (cf. Figure S18a in the Supplementary Materials). Along the c axis, pairs of Rp and Sp enantiomers are associated via two weak C-H···π interactions between the phenylene spacer and the anisole ring, and they are also associated via five strong C-H···F and C-H···π hydrogen bonds that involve the methylene and methyl protons of an ethyl group of ether solvent molecules (cf. Figure S18b of the Supplementary Materials). As shown in Figure S18c, molecular packing creates fluorous layers formed by the CF3 substituents along the bc plane of the unit cell.

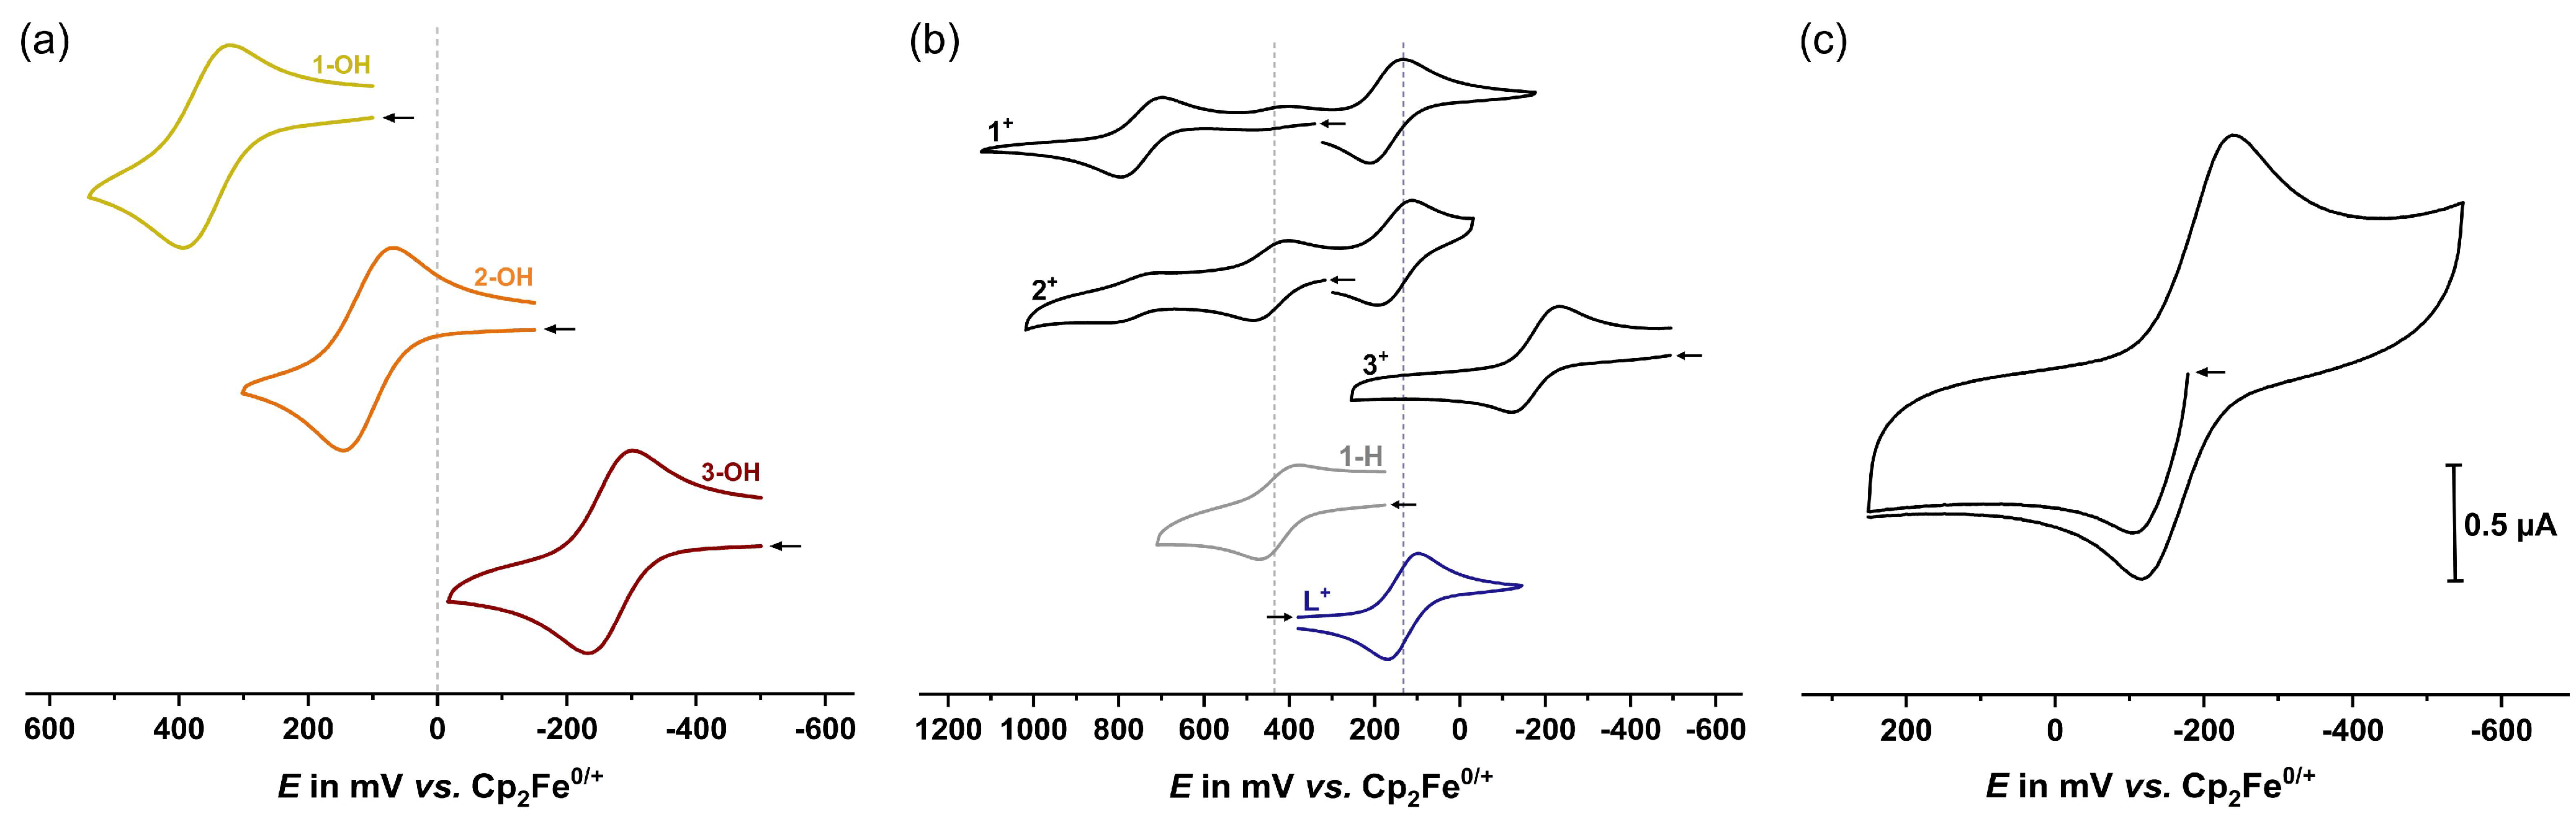
2.2. Electrochemistry

The electrochemical properties of 1-OH3-OH were investigated in the very weakly nucleophilic electrolyte CH2Cl2/0.1 M [NBu4]+ [BArF24], which has not only the capability to stabilize the resulting tritylium complexes [40,41,42] but can also increase the chemical reversibility of oxidation in arene chromium half-sandwich complexes [32,50]. The cyclic voltammograms of the carbinol precursors 1-OH3-OH are displayed in Figure 2a, and the respective data are listed in Table 2. All carbinols undergo a chemically (peak current ratios ip,a/ip,c ca. 1) and electrochemically (peak potential separations ΔEp = 68–81 mV) reversible one-electron oxidation of the chromium nucleus. The half-wave potential E1/2 of the tricarbonyl complex 1-OH of 360 mV is nearly identical to that of [(η6-anisole)Cr(CO)3] (E1/2 = 350 mV) [51,52]. The substitution of one carbonyl ligand by P(OPh)3 lowers E1/2 by 250 mV, which matches the data for [(estradiol)Cr(CO)2L] (L = CO, P(OPh)3) [32]. In keeping with the stronger donating properties and the weaker π-acidity of the PPh3 ligand, the half-wave potential is further lowered to −265 mV in 3-OH, consistent with the difference in Lever’s electrochemical ligand parameter EL [53]. The choice of ligand L thus shifts E1/2 over a range of more than 600 mV.
For all further studies, including cyclic voltammetry, the cationic tritylium complexes were generated in situ from their carbinol precursors via treatment with an equimolar amount of Brookhart´s acid, which led to an instantaneous change in color from yellow to green or from bright to dark orange. As shown in Figure 2b, the cyclic voltammogram of 1+ exhibits two main redox waves: one for chromium oxidation at E1/2 = 750 mV and one at E1/2 = 175 mV for tritylium reduction. Compared to the carbinol precursor, the oxidation potential is shifted by 390 mV to higher potential, which is due to the influence of the neighboring strongly electron-accepting triarylmethylium unit. The reduction potential of the tritylium unit resembles that of the uncoordinated ligand C6H4(2-OMe)-C6H4-C+{-C6H4(4-CF3)}2 (L+) (E1/2 = 135 mV). The half-wave potential difference ΔE1/2 between chromium oxidation and tritylium reduction thus amounts to 575 mV, which translates into a free-enthalpy difference ΔG of 55.5 kJ mol−1 for the two valence tautomers (cf. Scheme 2). A third redox process is located in between these waves, which is associated with smaller peak currents. A closer inspection of this wave shows that the peak current on the reverse scan, i.e., after traversing the oxidation wave of 1+, surmounts that of the forward (anodic) peak. This suggests that this wave belongs to a product arising from chemical decomposition, which already ensues in the parent cationic state, but occurs at an even faster rate after chromium oxidation. This particular wave could be assigned to the triphenylmethane-substituted complex 1-H (E1/2 = 435 mV) with a proton instead of the hydroxyl substituent of 1-OH (vide infra, Scheme 5).
The cyclic voltammogram of 2+ at room temperature shows two main redox processes that might be due to the chromium oxidation and tritylium reduction of this complex (cf. Figure 2b). While the reduction wave is nearly unshifted with respect to 1+, the potential of the oxidation wave is lowered by ca. 300 mV, similarly to the difference for carbinols 1-OH and 2-OH. Due to the extreme thermosensitivity of this complex and the close similarity of the potentials of these waves to those of identified decomposition products 1-H and L+ (vide infra), the above assignment is however only tentative. An extreme tendency of complex 2+ to be adsorbed on any electrode surface (Au, Pt, and glassy carbon) unfortunately prevented us from conducting CV measurements at low temperatures.
Due to the inherent instability of 3+, we recorded its cyclic voltammograms at 195 K (cf. Figure 2b). To our surprise, we only observed one redox wave at −180 mV instead of the expected separate waves for metal oxidation and tritylium reduction. Intriguingly, the open circuit potential of 3+ (cf. Figure 2c, marked with an arrow) falls within the redox wave. This indicates a curious situation where the half-wave potentials of both processes are so close that the two waves merge into a single, composite redox wave, corresponding to a half-wave potential difference of (almost) 0 mV. This means that the two valence tautomers are energetically degenerate or nearly so, which renders 3+ a particularly promising candidate for observing valence tautomerism.

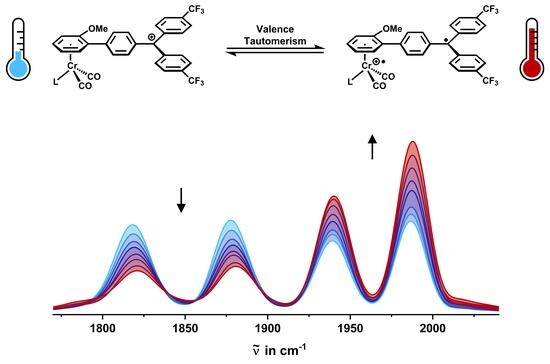
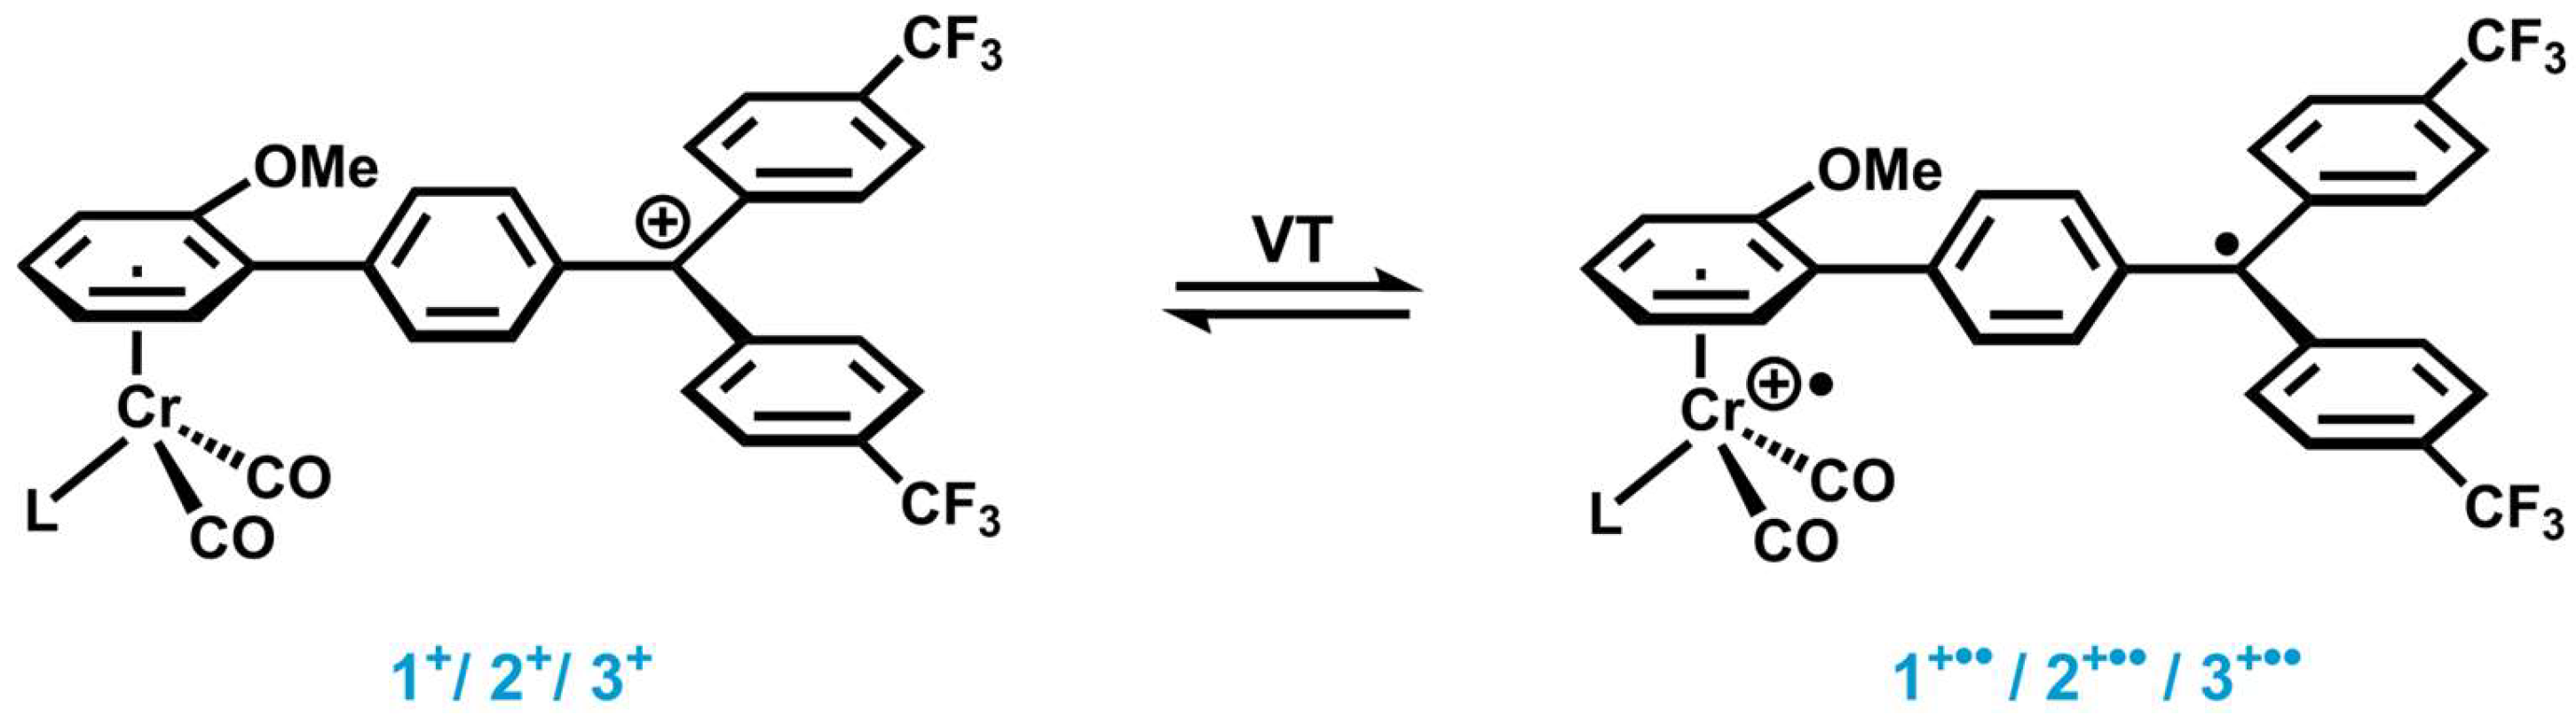
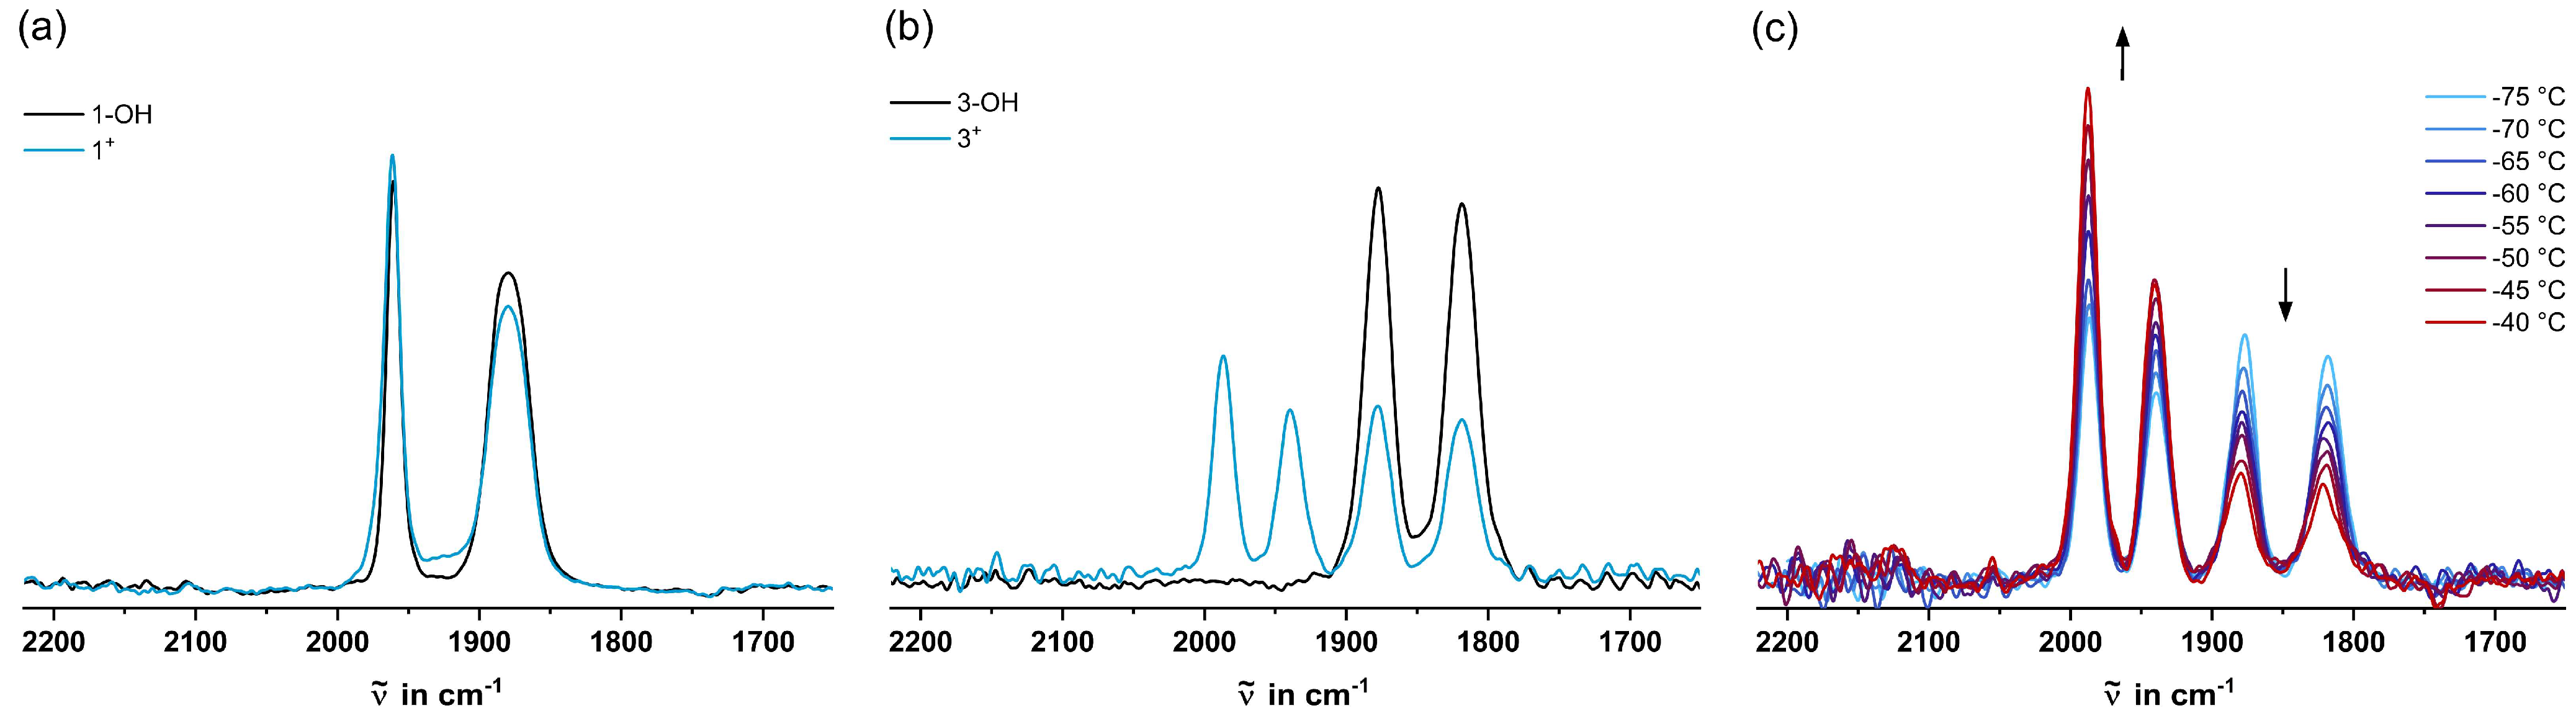
2.3. IR Spectroscopy

Table 3 compiles the CO bands of all complexes of this study. For both the carbinol complexes and their tritylium congeners, the increased electron density at the chromium atom upon replacing one CO ligand by the weaker π-acceptors P(OPh)3 or PPh3 is also manifested in their IR spectra (cf. Figure S15 of the Supplementary Materials) [31]. Hence, the average CO stretching frequency is red-shifted by 40 (2-OH) or 72 cm−1 (3-OH) with respect to 1-OH.
As expected from the large ΔE1/2 and ΔG, the in situ generated 1+ only shows one pair of CO bands assignable to the diamagnetic Cr(0)-C6H4-CAr2+ valence tautomer within the accessible temperature range from −70 (Figure 3a) to −40 °C (cf. Figure S19 of the Supplementary Materials). The identical CO stretching energies of 1-OH and 1+ may look suspicious. We however note that ring substituents only exert minor effects on the CO bands in [(η6-arene)Cr(CO)3] complexes [55] and that cyclic voltammograms of 1+ did not show any remains of 1-OH under these conditions. Above −40 °C, decomposition ensues, as indicated by the emergence of new CO bands, which could later be assigned to specific decomposition products (vide infra). In the case of 2+, the IR spectrum shows a second set of carbonyl bands of considerably weaker intensity, which is characteristically shifted by 113 cm−1 to higher energies, as expected for a Cr(I) species (cf. Table 3 and Figure S20 of the Supplementary Materials). This hints at the presence of small amounts of the diradical valence tautomer. The rapid onset of decomposition already at −70 °C unfortunately precluded us from studying any temperature dependence of the equilibrium between the two isomers.
The IR spectroscopic data of 3+ are particularly interesting, as they show two pairs of CO bands immediately after the addition of Brookhart’s acid to the carbinol precursor at −70 °C (Figure 3b). The energy difference of 117 cm−1 between the average v ~ CO values of the two pairs of bands strongly hints at the simultaneous presence of Cr(0) and Cr(I) species [31,32,33]. Increasing the temperature in steps of 5 °C from −75 to −40 °C resulted in an intensity decrease of the band pair at lower energies at the expense of the band pair at higher energies (Figure 3c). Upon re-cooling to −70 °C, the spectral changes were (almost) entirely reversible (cf. Figure S21 of the Supplementary Materials), in agreement with a T-dependent equilibrium. Therefore, the carbonyl bands at 1988 and 1940 cm−1 are tentatively assigned to the paramagnetic valence tautomer 3+•• with a positively charged Cr(I) unit, and the bands at 1878 and 1819 cm−1 are assigned to the diamagnetic valence tautomer with a positive charge at the triarylmethylium residue (cf. Scheme 2).
From the areas of the CO bands of each pair, we can even deduce the ratio of the quantities of the two valence tautomers of 3+ within the accessible temperature range as dictated by the limits of our cryostat and the onset of decomposition at T = −40 °C (cf. Figure S22 of the Supplementary Materials). In our analysis, we assume that the oscillator strengths of the CO bands are identical for the Cr(I) and Cr(0) oxidation states, which is supported by the literature [34]. Our finding that the total area of all carbonyl bands remained constant during the T-dependent measurements supports this notion and defies any significant decomposition during our measurements (cf. Figure S23 of the Supplementary Materials). The near degeneracy of the two isomers, which was already indicated by the coincident half-wave potentials of chromium oxidation and tritylium reduction, is thus duly reflected in the nearly identical intensities and integrals of both pairs of bands at −70 °C, corresponding to a ratio of the individual valence tautomers of ca. 1:1. The ratio of the isomers translates into the equilibrium constant K, from which ΔG can be calculated via the relationship ΔG = −RT·ln(K). When plotting our experimentally derived ΔG values as a function of T, we obtained an excellent linear fit (R2 = 0.9943), which allows us to determine ΔH = 15.8 ± 0.5 kJ mol−1 and ΔS = 77 ± 2 J (mol·K)−1 (cf. Figure S24 of the Supplementary Materials). We must however note that this analysis is compromised by the partial dimerization of the diradical isomer 3+•• such that the thermodynamic parameters pertain to the combination of these two processes.

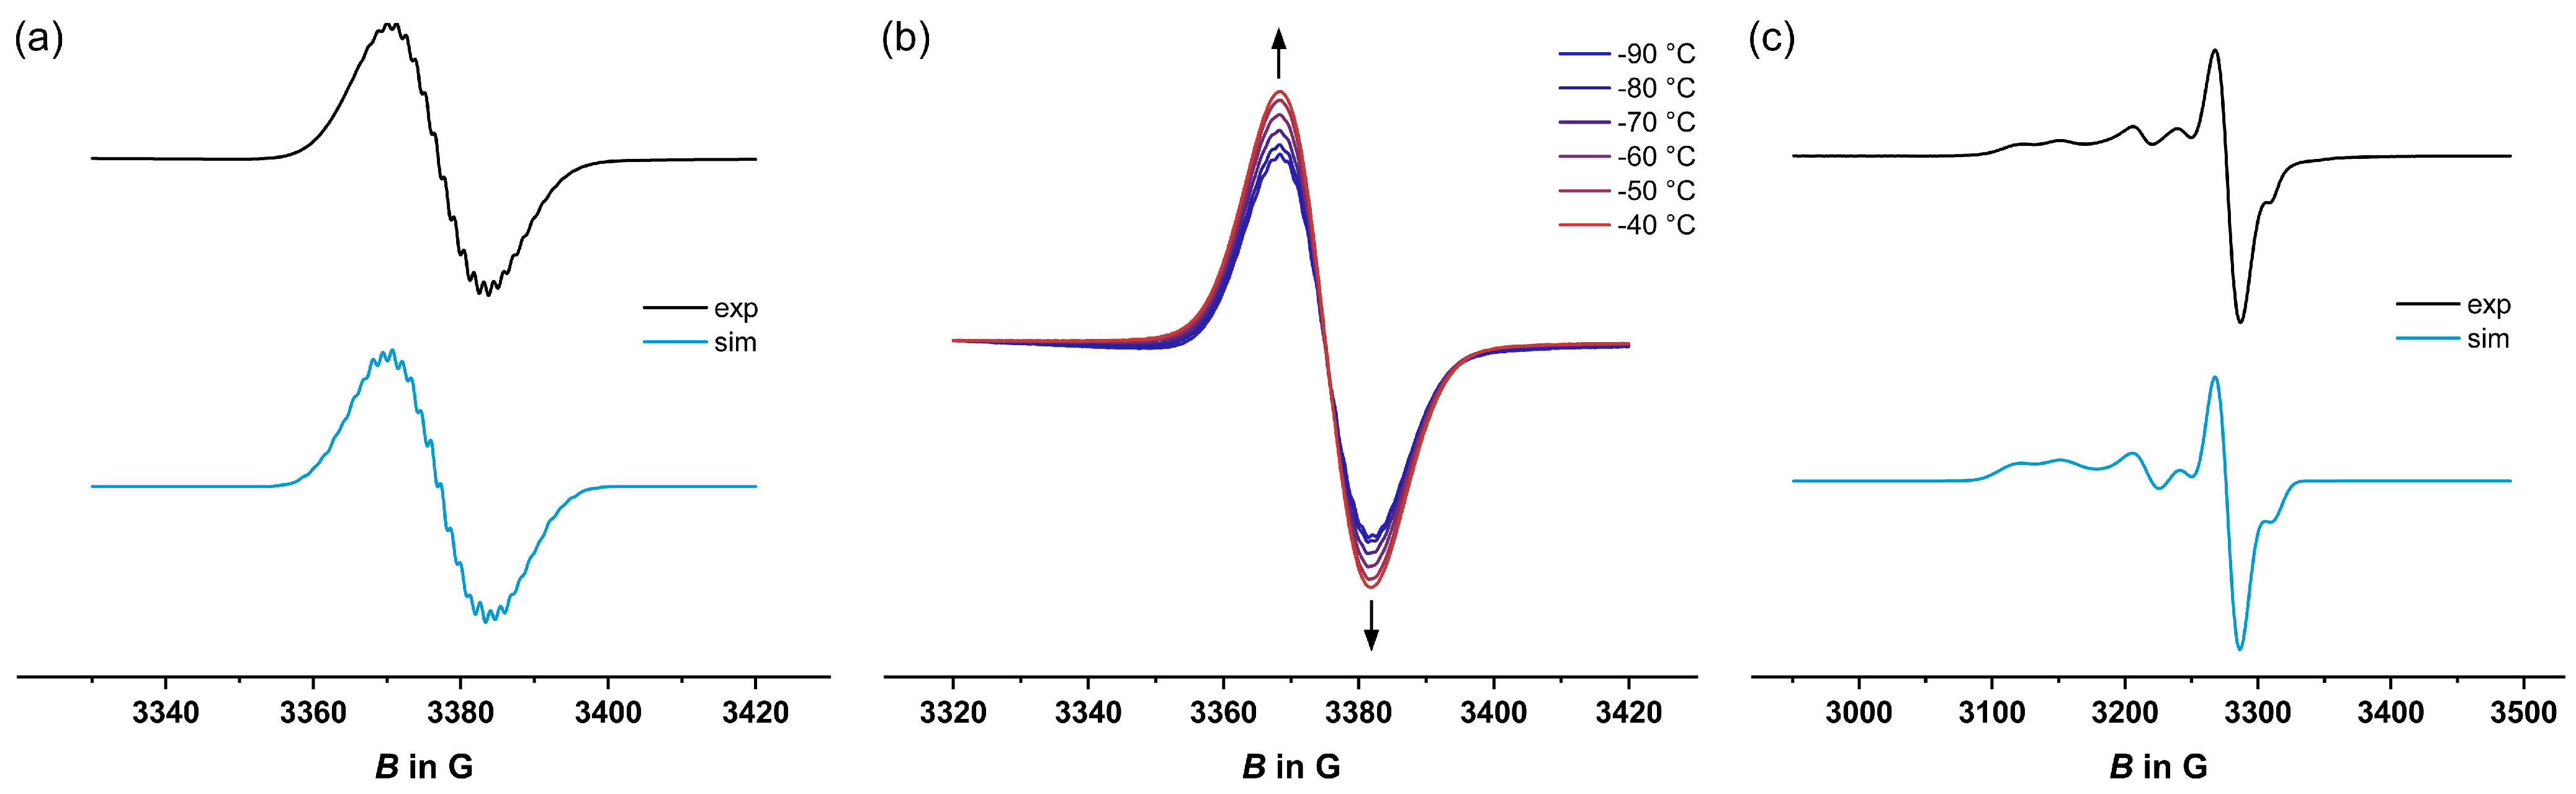
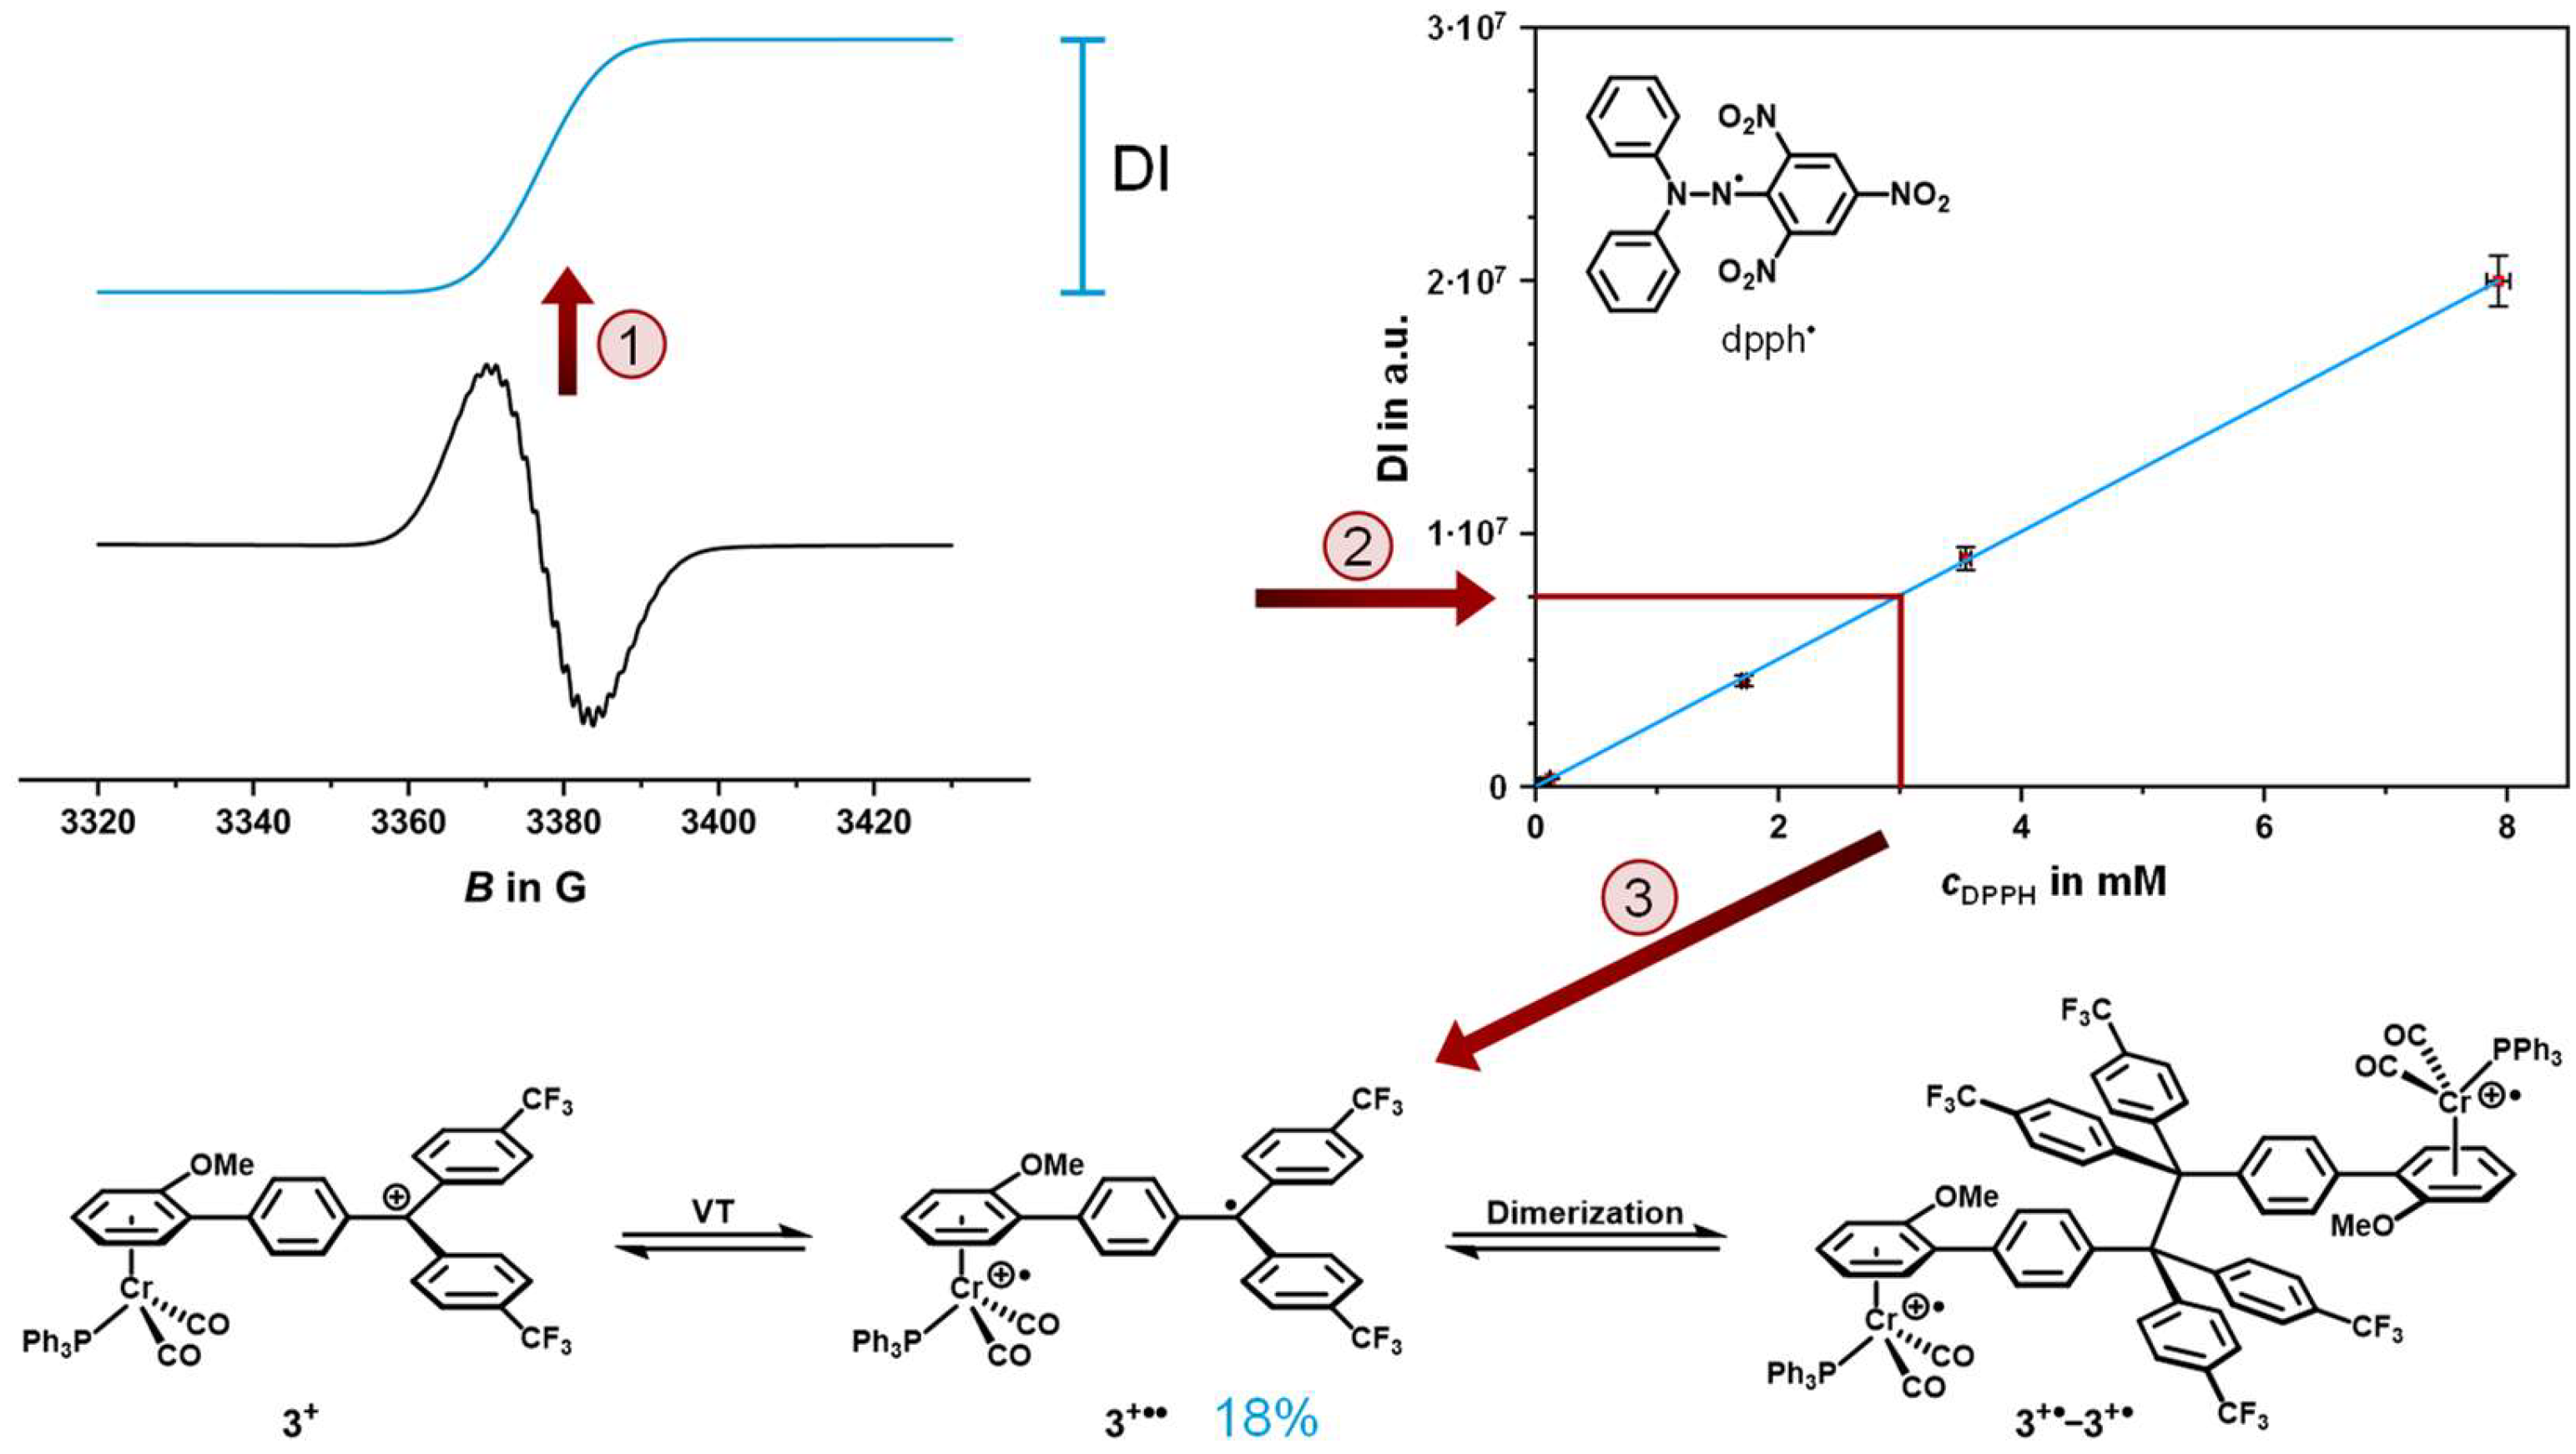
2.4. EPR Spectroscopy

Next, we analyzed 1+ and 3+ via EPR spectroscopy (complex 2+ proved to be too unstable to obtain reliable EPR data). The sheer existence of an EPR signal already hints at the presence of the diradical valence tautomer, since the Cr(0)-C6H4-CAr2+ isomer is EPR-silent. As depicted in Figure S25a of the Supplementary Materials, the EPR spectrum of 1+ recorded at −70 °C shows a weak isotropic signal with a g value of 2.005, characteristic of a trityl radical [56,57], with resolved hyperfine splittings to the hydrogen and fluorine atoms in close proximity. Splitting constants A and the g value were obtained from a simulation using the EasySpin program [58] (see Table 4 for data). The observability of the EPR signal of 1+•• demonstrates the superior sensitivity of this method compared to IR spectroscopy, where no traces of this second valence tautomer were found. In agreement with the notion that the diradical isomer is entropically favored, the EPR signal’s intensity increases reversibly with increasing temperatures (cf. Figure S25b,c of the Supplementary Materials), opposing the otherwise expected Boltzmann behavior [59]. Due to the overall weak signal intensity, we were however only able to detect the organic spin but not the metal-centered spin (cf. Figure S25d of the Supplementary Materials).
Investigations of the valence tautomeric equilibrium of 3+ at temperatures between −90 and −40 °C (fluid solution) and at 77 K (frozen solution) proved to be even more rewarding. Selected EPR spectra are depicted in Figure 4. At −70 °C, samples of 3+ provide an isotropic EPR signal with a g value of 2.003, which can be ascribed to the organic spin of a trityl species (Figure 4a). Hyperfine couplings to hydrogen and fluorine atoms in close proximity are partially resolved and the coupling constants were modeled via the digital simulation of the EPR spectrum at −70 °C (see Table 4). Upon the gradual warming of the sample from −90 to −40 °C (Figure 4b), the signal’s intensity increases, which again opposes the expected Boltzmann behavior [59]. This finding agrees with a higher proportion of the paramagnetic isomer at higher temperatures. We however note that diradical 3+•• engages in a T-dependent monomer ⇌ dimer equilibrium, which also contributes to the intensity increase at higher T (vide infra). Changes induced by temperature variations were reversed upon the re-cooling of the sample as long as the temperature was kept below −40 °C (cf. Figure S26 of the Supplementary Materials).
In frozen CH2Cl2, at 77 K, the EPR spectrum shows an additional rhombic signal with hyperfine coupling of all g-tensor components to one phosphorus atom (Figure 4c), which was side by side with that of the trityl-type radical. g values and hyperfine splitting constants are very similar to those reported for other oxidized [(η6-arene)Cr(CO)2(PPh3)]+ complexes [34,35]. The simultaneous presence of both kinds of EPR resonances within the same spectrum provides further compelling evidence for the coexisting diradical 3+••.
The high signal intensity already hints at substantial amounts of diradical valence tautomer 3+••. In order to determine its amount, we conducted quantitative EPR measurements with spin counting at −70 °C. Scheme 4 illustrates the spin-counting method as detailed in reference [42]. First, a sample of 3+ of known concentration was freshly prepared at −40 °C and rapidly cooled to −70 °C inside the cavity of the EPR spectrometer. An EPR spectrum with predefined parameters and instrument settings was recorded (cf. Experimental Section for details). The signal was then doubly integrated in order to relate to the spin concentration within the sample (step (1) in Scheme 4; note that the EPR signature is the first derivative of the pristine signal). The double integral (DI) of the sample was then compared to a regression line taken from the EPR spectra of the stable 2,2-diphenyl-1-picrylhydrazyl radical (dpph) as a calibration standard [60]; EPR spectra of the standard were recorded at different concentrations and the same temperature as those of 3+ (step (2)). Assuming that dpph is inert towards dimerization, even at low temperatures, we can thereby determine the absolute spin concentration of the sample and compare it to the nominal concentration (step (3)). Our analysis yielded an amount of ca. 18% of the free diradical valence tautomer 3+•• in samples of 3+. The lower spin concentration compared to the IR data at the same T, which indicated nearly equimolar amounts of both valence tautomers (vide supra), points to the partial dimerization of the paramagnetic valence tautomer via the formation of a new C-C bond between the trityl C atoms. The same behavior was already documented for related ferrocene–tritylium complexes [42]. Dimerization results in the loss of the organic spin while maintaining the oxidation state at the chromium center. Therefore, the CO bands at 1988 and 1940 cm−1 are likely caused by both the diradical valence tautomer 3+•• and its dimer 3+•-3+•.

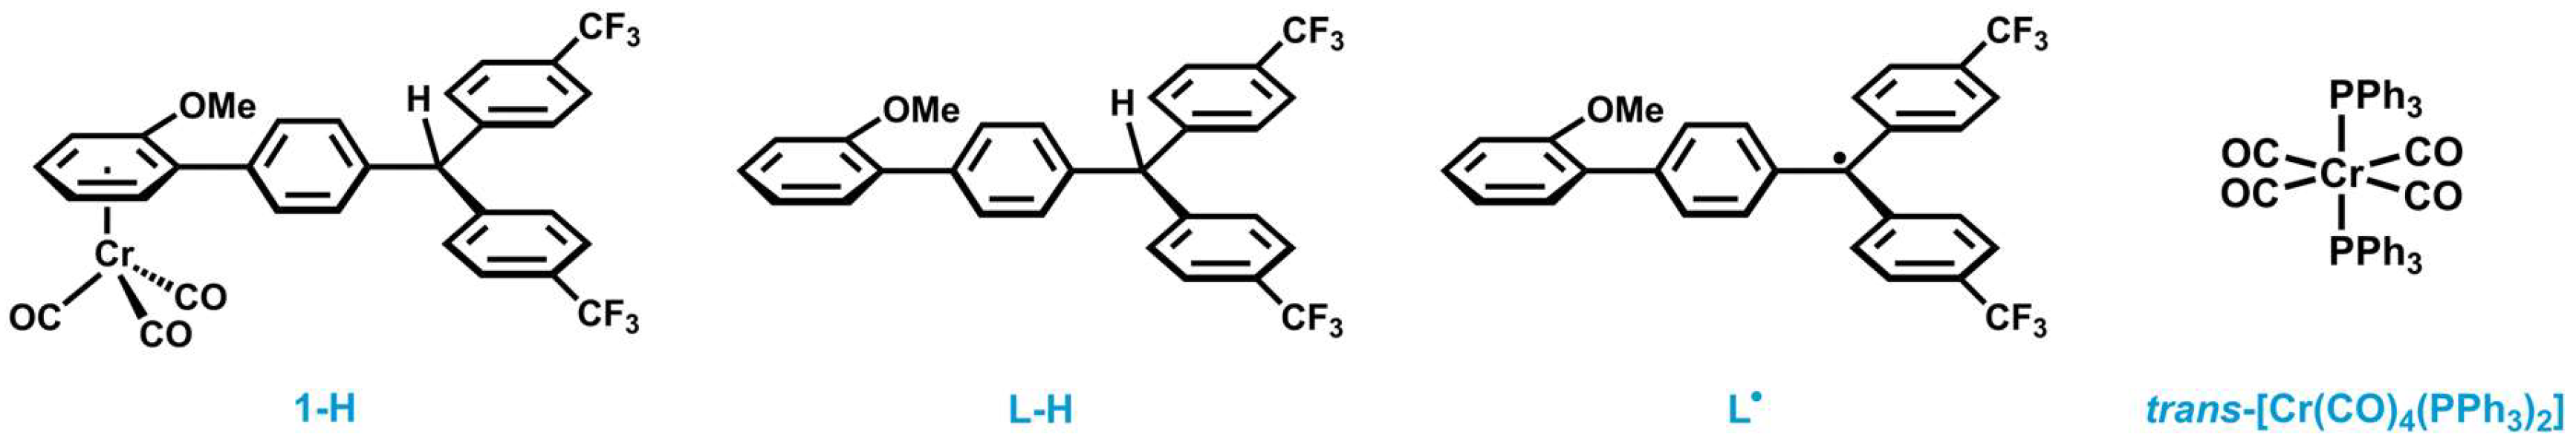
2.5. Decomposition Pathways

Although the tritylium complexes were prepared and handled under strictly anaerobic and anhydrous conditions, decomposition commenced at temperatures above −40 °C (1+, 3+) or even −70 °C (2+). Following this process by means of IR and NMR spectroscopy allowed us to identify four decomposition products, and some of them were even analyzed via NMR and IR spectroscopy, ESI-MS, single-crystal X-ray analysis, and cyclic voltammetry. Relevant data are provided in Figures S27 in the Supplementary Materials.
Tritylium complex 1+ proved to be the most stable out of the three in this study. We assume that this is due to the presence of only very minor amounts of the highly reactive diradical valence tautomer 1+••. Still, 1+ decomposes within several hours to chromium half-sandwich complex 1-H and minor amounts of the free ligand L-H, as revealed by the NMR spectra in Figure 5. The formation of 1-H was also confirmed via IR spectroscopy (cf. Figure S36 of the Supplementary Materials). The availability of an authentic sample of 1-H also allowed us to assign the additional redox wave observed in the cyclic voltammograms of 1+ as arising from this species (vide supra). 1-H and the decoordinated free ligand L-H putatively originate from the diradical valence tautomer Cr(I)+•-C6H4-CAr2 (1+••) via hydrogen atom abstraction from the solvent. This would provide Cr(I) species 1-H+•, which is gradually reduced. L-H then results from 1-H via the loss of the arene ligand, a phenomenon that we frequently observed during every synthesis of the chromium half-sandwich complexes in this work, or via hydrogen atom abstraction proceeding from L.
Surprisingly, tritylium complexes 2+ and 3+ also form tricarbonyl complex 1-H and ligand L-H during their decomposition (cf. NMR and IR spectra depicted in Figures S36 of the Supplementary Materials). This indicates that PR3 and CO ligands are scrambled between the metal fragments during this process. In this vein, we also isolated a single crystal of trans-[Cr(CO)4(PPh3)2] from a solution of decomposed 3+. IR bands detected when the decomposition was monitored via IR spectroscopy (cf. Figure S38) hint at the intermediate formation of trans-[Cr(CO)4(PPh3)2]+ [61], which is gradually reduced to form trans-[Cr(CO)4(PPh3)2] [62].
Single crystals of 1-H and L-H, as well as the crystal of trans-[Cr(CO)4(PPh3)2], were obtained via the diffusion of n-pentane into a dichloromethane solution of 3+ at r.t. The molecular structures of 1-H and L-H are depicted in Figure 6, while Tables S4 and S5 of the Supplementary Materials provide the details of the data collection, structure solution, and refinement. The Cr(CO)3 fragment in complex 1-H adopts an almost eclipsed conformation (cf. Figure 6, left), as it is typical of [(η6-anisole)Cr(CO)3] complexes [63]. As depicted in Figure S41 of the Supplementary Materials, Rp/Rp and Sp/Sp enantiomers interact via short C-H···O contacts of 2.672(8) and 2.798(7) Å between a proton of the coordinated anisole ring and the O atoms of two carbonyl ligands. In addition, pairwise C-H···O hydrogen bonds between a C-H proton of the triarylmethane residue and a proton of the phenylene linker to carbonyl ligands are established. The free ligand L-H (cf. Figure 6, right) exhibits a smaller torsion at the biphenyl linkage (Table 1). Individual molecules of L-H are associated via several C-H···O and C-H···F hydrogen bonds in the crystal lattice (see Figure S42 of the Supplementary Materials).

3. Materials and Methods

Experimental Methods and Materials: All syntheses were carried out under a nitrogen atmosphere using standard Schlenk and Glovebox techniques. Solvents were taken from a solvent purification system (SPS). All reagents were purchased from commercial sources and used without further purification. [NBu4]+ [B{C6H3(CF3)2-3,5}4] [64,65], Brookhart’s acid [39], and complex 1′ [36] were prepared according to published procedures. Ligand substitution was conducted photochemically via UV irradiation using a high-pressure mercury lamp and a Duran glass irradiation apparatus [38,66].
NMR Spectroscopy: 1H-NMR (400/600/800 MHz), 19F{1H}-NMR (376/752 MHz), 31P{1H}-NMR (162 MHz), and 13C{1H}-NMR (101/151/202 MHz) spectra were recorded in CD2Cl2 at 300 K using a Bruker Avance III 400, Bruker Avance III 600, or Bruker Avance Neo 800 spectrometer. NMR spectra were referenced to residual solvent signals (1H) with respect to the solvent signal itself (13C). 19F- and 31P-NMR spectra were referenced to the external reference of the spectrometer (δ(19F/31P) = 0 ppm for CFCl3 or H3PO4, respectively). The assignment of signals is based on 2D spectra. Mass Spectrometry: Mass spectra were recorded in the positive mode on an ESI-calibrated LTQ Orbitrap Velos Spectrometer with the direct injection of dichloromethane solutions. IR Spectroscopy: Room temperature IR spectra were recorded in dichloromethane on a Bruker Tensor II FT-IR spectrometer. The low-temperature IR spectra of the tritylium complexes were recorded inside a nitrogen-filled glovebox using a Nicolet iS10 spectrometer with the aid of a Remspec fiber-optic transmission IR probe. The custom-built setup was already described in an earlier publication [16]. It is composed of two cups made of thermally conducting Al2O3 (one for the reference and one for the sample) with 5 mL capacity each, which can be switched automatically. Cooling was carried out using a cryostat (−40 °C) with a thermal connection to a cascading Peltier cooler inside the glovebox, which allows for cooling to −75 °C (the temperature is measured directly at the outer walls of the Al vials). The IR spectra were baseline-corrected. Thermodynamic Analysis: The pairs of carbonyl bands in the T-dependent IR spectra of 3+ were integrated separately for both valence tautomers. Assuming that the band intensities are invariant to the chromium oxidation state allowed us to calculate the equilibrium constant K from the ratio of the peak areas for the paramagnetic and diamagnetic valence tautomers. This was carried out for every temperature within the range of −70 to −40 °C. Next, the corresponding ΔG values were calculated according to the equation ΔG = −RT·ln(K) for every data point. The resulting plot of ΔG against T is depicted in Figure S24 in the Supplementary Materials. ΔH was taken from the intercept, and ΔS was taken from the slope. X-Ray Crystallography: A STOE IPDS-II image plate diffractometer equipped with a Mo-Kα or Cu-Kα radiation source was used. Data acquisition was conducted at 100 K. The program package X-Area was used for data processing. Depending on the structure, either semiempirical or spherical absorption corrections were performed. The structure was solved and refined with SHELXT [67,68] and OLEX2 [69]. All non-hydrogen atoms were refined anisotropically. EPR Spectroscopy: EPR samples of the cationic complexes were freshly prepared inside a nitrogen-filled glovebox using glassware and dichloromethane that were precooled to −40 °C. Prior to filling, the EPR tube was inserted into a suitable bore in an Al block that was precooled to −40°C to serve as a cold reservoir in order to prevent decomposition. T-dependent EPR spectra were recorded in dichloromethane on an X-band benchtop spectrometer MiniScope MS5000. Quantitative EPR measurements of the complexes and the dpph standard were recorded with defined measurement parameters (B = 330–345 mT; modulation = 0.3 mT; power = 6.3096 mW; sweep time of 60 s) to ensure comparability [42]. The EPR spectra in frozen solution were conducted at 77 K on an X-band ELEXSYS E580 spectrometer. The simulation of the EPR spectra was performed with the Matlab software package EasySpin using the ‘garlic’ function for isotropis signals, or the ‘pepper’ function for rhombic signals [58]. Cyclic Voltammetry: Cyclic voltammetry measurements were conducted under an argon atmosphere at room temperature (1-OH3-OH, 1+, 2+) or −78 °C (3+). The cyclic voltammograms were recorded in dry dichloromethane using the very weakly nucleophilic electrolyte [NBu4]+ [B{C6H3(CF3)2-3,5}4]. A platinum counter electrode, an Ag/AgCl pseudo-reference electrode, and a glassy carbon working electrode were used. The working electrode was first polished with 1 μm and then 0.25 μm diamond pastes prior to every measurement. Data acquisition was conducted with a computer-controlled BASi potentiostat. After the completion of the measurements, ferrocene or decamethylferrocene were added as an internal reference, and the measurements were repeated in the presence of the standard. The cyclic voltammograms were then referenced to the Cp2Fe0/+ redox couple with E1/2(Cp*2Fe0/+) = −540 mV.
Synthesis of 1-OH: To a solution of 4-bromo-1-trifluoromethylbenzene (0.23 mL, 1.65 mmol) in 20 mL of THF, n-butyllithium (2.5 M in hexane, 0.73 mL, 1.82 mmol) was slowly added at −78 °C. The solution was stirred for 2 h at −78 °C, and [(biaryl ester)Cr(CO)3] 1′ (250 mg, 0.66 mmol) dissolved in 10 mL of THF was added dropwise. The reaction mixture was allowed to warm to room temperature overnight and was subsequently quenched by the addition of water (10 mL). The phases were separated, and the aqueous phase was extracted with diethylether (3 × 20 mL). The combined organic phases were washed with water (20 mL) and brine (20 mL) and dried over Na2SO4, and the solvent was removed under reduced pressure. The crude product was purified via column chromatography (silica gel, n-pentane/ethyl acetate 3:1–2:1) to obtain yellow 1-OH in a yield of 76% (321 mg, 0.50 mmol). For atom numbering, we refer the reader to Figure S1 of the Supplementary Materials. 1H-NMR (400 MHz, CD2Cl2) δ [ppm] = 7.64 (d, 3JHH = 8.4 Hz, 4H, H-15), 7.54 (d, 3JHH = 8.7 Hz, 2H, H-9), 7.51 (d, 3JHH = 8.4 Hz, 4H, H-14), 7.26 (d, 3JHH = 8.7 Hz, 2H, H-10), 5.82 (dd, 3JHH = 6.3 Hz, 4JHH = 1.4 Hz, 1H, H-6), 5.69 (ddd, 3JHH = 6.8, 6.3 Hz, 4JHH = 1.4 Hz, 1H, H-4), 5.20 (dd, 3JHH = 6.8 Hz, 4JHH = 0.8 Hz, 1H, H-3), 5.03 (vt, 3JHH = 6.3 Hz, 4JHH = 0.8 Hz, 1H, H-5), 3.75 (s, 3H, H-1), 3.01 (s, 1H, OH). 19F{1H}-NMR (376 MHz, CD2Cl2) δ [ppm] = −62.8 (s, CF3).13C{1H}-NMR (101 MHz, CD2Cl2) δ [ppm] = 233.6 (CO), 150.3 (C-13), 146.0 (C-11), 142.3 (C-2), 134.7 (C-8), 130.7 (C-9), 130.0 (q, 2JCF = 33 Hz, C-16), 128.6 (C-14), 127.9 (C-10), 125.6 (q, 3JCF = 4 Hz, C-15), 124.6 (q, 1JCF = 272 Hz, C-17), 101.1 (C-7), 99.2 (C-6), 95.6 (C-4), 85.4 (C-5), 81.7 (C-12), 74.3 (C-3), 56.3 (C-1). IR (CH2Cl2) v ~ C O [cm−1] = 1965, 1886. ESI-MS calculated for C31H20CrF6O5+: m/z = 485.1335 (M+ -CrCO3 -OH), 621.0587 (M+ -OH), 638.0615 (M+), found: 485.1345, 621.0592, 638.0591 (measured in CH2Cl2, direct injection, and calibrated).
Ligand Substitution (2-OH): Complex 1-OH (50 mg, 0.08 mmol) was dissolved in tetrahydrofuran (30 mL) and irradiated under IR monitoring. Subsequently, triphenylphosphite (24 mg, 0.08 mmol), dissolved in 5 mL tetrahydrofuran, was added, and the reaction mixture was stirred for 30 min. The solution was evaporated to dryness, and the mixture was separated via column chromatography (silica gel, n-pentane/diethylether 2:1), giving 2-OH as a light orange solid in a yield of 18% (13 mg, 14 μmol). For atom numbering, we refer the reader to Figure S5 of the Supplementary Materials. 1H-NMR (400 MHz, CD2Cl2) δ [ppm] = 7.62 (d, 3JHH = 8.3 Hz, 4H, H-15), 7.50 (m, 6H6H, H-9+H-14), 7.40-7.30 (m, 14H, H-19+H-20), 7.21-7.14 (m, 5H, H-10+H-21), 5.40 (d, 3JHH = 6.1 Hz, 1H, H-6), 5.23 (dt, 3JHH = 6.7, 6.1 Hz, 1H, H-4), 3.87 (d, 3JHH = 6.7 Hz, 1H, H-3), 3.52 (vt, 3JHH = 6.1 Hz, 1H, H-5), 3.25 (s, 3H, H-1), 3.03 (s, 1H, OH). 13C{1H}-NMR (101 MHz, CD2Cl2) δ [ppm] = 236.5 (d, 2JCP = 34 Hz, CO-a), 236.3 (d, 2JCP = 31 Hz, CO-b), 152.8 (d, 2JCP = 6 Hz, C-18), 150.3 (C-13), 145.4 (C-11), 140.6 (C-2), 135.8 (C-8), 130.7 (C-9), 130.0 (C-20), 129.9 (q, 2JCF = 32 Hz, C-16), 128.6 (C-14), 127.7 (C-10), 125.5 (q, 3JCF = 4 Hz, C-15), 124.7 (C-21), 124.6 (q, 1JCF = 272 Hz, C-17), 122.2 (d, 3JCP = 4 Hz, C-19), 96.9 (C-6), 96.1 (C-7), 92.6 (C-4), 82.7 (C-5), 81.7 (C-12), 71.4 (C-3), 55.6 (C-1). 19F{1H}-NMR (376 MHz, CD2Cl2) δ [ppm] = −62.9 (s, CF3). 31P{1H}-NMR (162 MHz, CD2Cl2) δ [ppm] = 202.1 (s, P(OPh)3). IR (CH2Cl2) v ~ C O [cm−1] = 1910, 1853. ESI-MS calculated for C48H35CrF6O7P+: m/z = 920.1424 (M+), found: 920.1385 (measured in CH2Cl2, direct injection, and calibrated).
Ligand Substitution (3-OH): Complex 1-OH (110 mg, 0.17 mmol) and triphenylphosphine (68 mg, 0.26 mmol) were dissolved in toluene (30 mL) and irradiated under IR monitoring. Subsequently, the solution was evaporated to dryness, and the mixture was separated via column chromatography (silica gel, n-pentane/diethylether 2:1) to obtain 3-OH as a dark orange solid in a yield of 69% (103 mg, 0.12 mmol). A crystal suitable for single-crystal X-ray diffraction was obtained via the vapor diffusion of n-pentane into a diethylether solution. X-ray crystallographic data are provided in the Supplementary Materials. For atom numbering, we refer the reader to Figure S10 of the Supplementary Materials. 1H-NMR (400 MHz, CD2Cl2) δ [ppm] = 7.64 (d, 3JHH = 8.3 Hz, 4H, H-15), 7.63 (d, 3JHH = 8.5 Hz, 2H, H-9), 7.54 (d, 3JHH = 8.3 Hz, 4H, H-14), 7.52–7.47 (m, 6H, H-19), 7.36–7.33 (m, 9H, H-20+H-21), 7.23 (d, 3JHH = 8.5 Hz, 2H, H-10), 5.38 (d, 3JHH = 6.0 Hz, 1H, H-6), 4.76 (vq, 3JHH = 6.3 Hz, 1H, H-4), 4.58 (vt, 3JHH = 6.0 Hz, 1H, H-5), 3.93 (d, 3JHH = 6.6 Hz, 1H, H-3), 3.51 (s, 3H, H-1), 3.02 (s, 1H, OH). 19F{1H}-NMR (376 MHz, CD2Cl2) δ [ppm] = −62.8 (s, CF3). 31P{1H}-NMR (162 MHz, CD2Cl2) δ [ppm] = 90.9 (s, PPh3).13C{1H}-NMR (101 MHz, CD2Cl2) δ [ppm] = 241.9 (d, 2JCP = 21 Hz, CO-a), 240.4 (d, 2JCP = 20 Hz, CO-b), 150.4 (C-13), 145.1 (C-11), 139.8 (d, 1JCP = 34 Hz, C-18), 139.6 (C-2), 136.8 (C-8), 133.3 (d, 2JCP = 11 Hz, C-19), 130.8 (C-9), 129.9 (q, 2JCF = 33 Hz, C-16), 129.4 (d, 4JCP = 2 Hz, C-21), 128.7 (C-14), 128.3 (d, 3JCP = 9 Hz, C-20), 127.7 (C-10), 125.5 (q, 3JCF = 4 Hz, C-15), 124.6 (q, 1JCF = 272 Hz, C-17), 94.1 (C-4), 93.9 (C-6), 93.2 (C-7), 84.9 (C-5), 81.7 (C-12), 73.6 (C-3), 55.8 (C-1). IR (CH2Cl2) v ~ C O [cm−1] = 1880, 1821. ESI-MS calculated for C48H35CrF6O4P+: m/z = 872.1577 (M+), found: 872.1608 (measured in CH2Cl2, direct injection, and calibrated).
Synthesis of L-OH: Irradiation (λ = 465 nm) of 1-OH (60 mg, 94 μmol) in dichloromethane (10 mL) and subsequent purification via column chromatography (silica gel, n-pentane/dichloromethane 1:1) provided L-OH as a white solid in a yield of 75% (35 mg, 69 μmol). 1H-NMR (400 MHz, CD2Cl2) δ [ppm] = 7.63 (d, 3JHH = 8.4 Hz, 4H, H-15), 7.53 (d, 3JHH = 8.4 Hz, 4H, H-14), 7.52 (d, 3JHH = 8.6 Hz, 2H, H-9), 7.36–7.30 (m, 2H, H-4+H-6), 7.26 (d, 3JHH = 8.6 Hz, 2H, H-10), 7.03 (vt, 3JHH = 7.5 Hz, 1H, H-5), 7.01 (d, 3JHH = 8.3 Hz, 1H, H-3), 3.80 (s, 3H, H-1), 3.02 (s, 1H, OH). 19F{1H}-NMR (376 MHz, CD2Cl2) δ [ppm] = −62.8 (s, CF3). 13C{1H}-NMR (101 MHz, CD2Cl2) δ [ppm] = 156.9 (C-2), 150.5 (C-13), 144.4 (C-11), 138.9 (C-8), 131.1 (C-6), 130.0 (C-7), 129.9 (C-4), 129.9 (q, 2JCF = 33 Hz, C-16), 129.4 (C-9), 128.7 (C-14), 127.8 (C-10), 125.5 (q, 3JCF = 4 Hz, C-15), 124.6 (q, 1JCF = 272 Hz, C-17), 121.2 (C-5), 111.7 (C-3), 81.8 (C-12), 55.8 (C-1). ESI-MS calculated for C28H20F6O2: m/z = 485.1335 (M+ -OH), found: 485.1331 (measured in CH2Cl2, direct injection, and calibrated). Representations of the spectra can be found in Figures S43–S46 of the Supplementary Materials.
Synthesis of Tritylium Complexes 1+3+, L+: To the respective carbinol (1-OH3-OH, L-OH) in dichloromethane, an equimolar amount of Brookhart’s acid was added at −70 °C (IR, for 1-OH3-OH), −78 °C (CV, for 3-OH) resp. r.t. (CV, for 1-OH, 2-OH, L-OH), or −40 °C (EPR, only for 1+ and 3+).
1-H and L-H: Decomposition products 1-H and L-H were isolated from the decomposition of 3+ in CD2Cl2 at room temperature via column chromatography (silica gel, n-pentane/ethyl acetate 4:1). 1-H: For atom numbering, we refer the reader to Figure S27 of the Supplementary Materials. 1H-NMR (600 MHz, CD2Cl2) δ [ppm] = 7.60 (d, 3JHH = 8.0 Hz, 4H, H-15), 7.51 (d, 3JHH = 8.0 Hz, 2H, H-9), 7.30 (d, 3JHH = 8.0 Hz, 4H, H-14), 7.12 (d, 3JHH = 8.0 Hz, 2H, H-10), 5.81 (d, 3JHH = 6.1 Hz, 1H, H-6), 5.71 (s, 1H, H-12), 5.68 (vt, 3JHH = 6.5 Hz, 1H, H-4), 5.20 (d, 3JHH = 6.7 Hz, 1H, H-3), 5.03 (vt, 3JHH = 6.1 Hz, 1H, H-5), 3.75 (s, 3H, H-1). 19F{1H}-NMR (376 MHz, CD2Cl2) δ [ppm] = −62.8 (s, CF3). 13C{1H}-NMR (151 MHz, CD2Cl2) δ [ppm] = 233.7 (CO), 147.3 (C-13), 142.7 (C-11), 142.2 (C-2), 133.6 (C-8), 131.0 (C-9), 130.2 (C-14), 129.3 (C-10), 129.3 (q, 2JCF = 32 Hz, C-16), 125.9 (q, 3JCF = 4 Hz, C-15), 124.7 (q, 1JCF = 270 Hz, C-17), 101.5 (C-7), 99.2 (C-6), 95.6 (C-4), 85.4 (C-5), 74.3 (C-3), 56.5 (C-12), 56.3 (C-1). IR (CH2Cl2) v ~ C O [cm−1] = 1880, 1821. ESI-MS calculated for C31H20CrF6O4+: m/z = 468.1413 (M+ -CrCO3), 623.0744 (M+) found: 486.1412, 623.0697 (measured in CH2Cl2, direct injection, and calibrated). X-ray crystallographic data are provided in the Supplementary Materials. L-H: For atom numbering, we refer the reader to Figure S32 of the Supplementary Materials. 1H-NMR (800 MHz, CD2Cl2) δ [ppm] = 7.59 (d, 3JHH = 8.3 Hz, 4H, H-15), 7.49 (d, 3JHH = 8.3 Hz, 2H, H-9), 7.34-7.28 (m, 5H, H-4+H-14), 7.30 (d, 3JHH = 7.5 Hz, 1H, H-6), 7.13 (d, 3JHH = 8.3 Hz, 2H, H-10), 7.02 (vt, 3JHH = 7.5 Hz, 1H, H-5), 7.00 (d, 3JHH = 8.3 Hz, 1H, H-3), 5.71 (s, 1H, H-12), 3.80 (s, 3H, H-1). 19F{1H}-NMR (752 MHz, CD2Cl2) δ [ppm] = −62.7 (s, CF3). 13C{1H}-NMR (202 MHz, CD2Cl2) δ [ppm] = 156.9 (C-2), 147.7 (C-13), 141.0 (C-11), 137.8 (C-8), 131.0 (C-6), 130.2 (C-7+C-14+C-9), 129.3 (C-10), 129.2 (C-4), 129.1 (q, 2JCF = 32 Hz, C-16), 125.8 (q, 3JCF = 4 Hz, C-15), 124.7 (q, 3JCF = 272 Hz, C-17), 121.2 (C-5), 111.6 (C-3), 56.5 (C-12), 55.8 (C-1). ESI-MS calculated for C28H20F6O2+: m/z = 486.1413 (M+), found: 486.1410 (measured in CH2Cl2, direct injection, and calibrated). X-ray crystallographic data are provided in the Supplementary Materials.

4. Summary and Conclusions

We have reported three new chromium half-sandwich triarylmethylium dyads [Cr(CO)2L(η6-C6H4(2-OMe)-C6H4-C+{-C6H4(4-CF3)}2] (1+3+) with different coligands L (L = CO, P(OPh)3, PPh3) at the chromium atom. The cyclic voltammetry data of their carbinol precursors 1-OH3-OH indicate that variations in L shift the chromium oxidation potential over a range of > 600 mV. These compounds, symbolized as Cr(0)-C6H4-CAr2+, were investigated with respect to their propensity to coexist with their paramagnetic redox isomers (valence tautomers) Cr(I)+•-C6H4-CAr2. The latter result from intramolecular electron transfer from the Cr(0) donor to the tritylium-type acceptor unit so that the equilibria between the two isomers depend on the difference between the half-wave potentials for metal-centered oxidation and ligand-based reduction.
The potential difference of 575 mV between chromium-based oxidation and tritylium-based reduction in 1+, which corresponds to ΔG = 55.5 kJ mol−1, is too large to allow for significant quantities of the diradical valence tautomer. For complex 3+ however, the oxidation and reduction waves overlap, indicating that the two isomers are nearly degenerate. Indeed, the IR spectrum of in situ generated 3+ shows two pairs of carbonyl bands separated by 117 cm−1, which is supportive of the simultaneous presence of a Cr(0)-C6H4-CAr2+ and Cr(I)+•-C6H4-CAr2 isomer. As was shown by IR spectroscopy, the equilibrium between the two valence tautomers is T-dependent with higher proportions of the thermodynamically less stable but entropically favored diradical isomer present at higher temperatures. The spectral changes are reversible as long as T is kept below −40 °C, where decomposition sets in. Quantitative EPR spectroscopy suggests that, at −70 °C, ca. two out of three molecules of the paramagnetic isomer are trapped in dimer 3+•-3+•. In frozen solutions, the typical EPR signature of the half-sandwich Cr(I) entity was observed together with the isotropic signal of the trityl-type radical, confirming the simultaneous presence of both types of paramagnetic centers.
While the near degeneracy of the diamagnetic and diradical isomers of 3+ constitutes an ideal situation for magnetoswitching, i.e., the thermoresponsive and reversible alteration of magnetic properties, its low thermal stability poses a serious obstacle to practical applications. 3+ and its congeners 1+ and 2+ decompose even at low temperatures and under inert gas conditions. We were able to identify the triarylmethane-appended complex 1-H and the respective free ligand L-H as the main products generated during this process. This hints at the decisive role of the diradical valence tautomers 1+••3+•• from which 1-H is putatively formed via H atom abstraction and the subsequent decoordination of the ligand L-H. This concurs with the observation that 1+, which generates the smallest quantities of the paramagnetic isomer, is the most stable complex of the three. Since 1-H and L-H were also identified as arising from the decomposition of complexes 2+ and 3+, their decomposition must ensue with the exchange of CO and PR3 ligands.
Our results nevertheless show that valence tautomerism can be purposefully implemented into chromium half-sandwich triarylmethylium complexes by tailoring the oxidation potential of the metal unit via ligand substitution. The presence of CO ligands at the metal ion and the detectability of the EPR signal of the paramagnetic metal entity under well-accessible conditions provide highly convenient handles for an in-depth analysis of such systems. In particular, they alleviate the studies of the valence tautomeric equilibria when compared to related ferrocenyl systems. Further improvements might be achieved via the steric shielding of the trityl unit in order to thwart dimerization and tame the reactive trityl site via enhanced spin density delocalization. This will be the subject of further forays in our laboratories.

Supplementary Materials

The following supporting information can be downloaded at https://www.mdpi.com/article/10.3390/inorganics11110448/s1: Figures S1–S14: 1H-, 19F{1H}-, 31P{1H}-, 13C{1H}-NMR and mass spectra of complexes 1-OH3-OH; Figure S15: CO stretching vibrations in the IR spectra of complexes 1-OH3-OH; Figure S16: ORTEP of the Sp enantiomer of [(biaryl-ester)Cr(CO)3], complex 1’; Figures S17–S18: Packing of 1’ and 3-OH, respectively, in the crystal; Figure S19: IR spectra of complex 1+ at temperatures between −70 and −40 °C; Figure S20: IR spectra of 2-OH and 2+ at −70 °C; Figure S21: Reversibility of the temperature dependence in the IR spectra of 3+; Figure S22: Amounts of the distinct valence tautomers of 3+ between −70 and −40 °C; Figure S23: Total area of all carbonyl bands of complex 3+ within the temperature range from −70 to −40 °C; Figure S24: Plot of ΔG against T for 3+ with a linear regression line; Figure S25a-d: EPR spectra of 1+ at different temperatures; Figure S26: Reversibility of the temperature dependence in the EPR spectra of 3+; Figures S27–S31: 1H-, 19F{1H}-, 13C{1H}-NMR spectra, mass spectrum, and IR spectrum of complex 1-H; Figures S32–S35: 1H-, 19F{1H}-, and 13C{1H}-NMR spectra, mass spectrum and IR spectrum of L-H; Figures S36–S38: IR spectra recorded during decomposition of 1+, 2+ and 3+, respectively; Figures S39–S40: 1H-NMR spectra of decomposed 2+ and 3+, respectively, compared to decomposition products 1-H and L-H; Figure S41–S42: Packing of 1-H and L-H, respectively; Figrues S43–S46: 1H-, 19F{1H}-, and 13C{1H}-NMR spectra, mass spectrum and IR spectrum of complex L-OH; Tables S1–S4: Crystal data and structure refinement for [(biaryl-ester)Cr(CO)3] 1’, 3-OH, 1-H, and L-H. CCDC 2303541 (1-H), 2303542 (L-H), 2303543 (1′), and 2303544 (3-OH) contain the supplementary crystallographic data for this paper. These data can be obtained free of charge from http://www.ccdc.cam.ac.uk/conts/retrieving.html (or from the CCDC, 12 Union Road, Cambridge CB2 1EZ, UK; Fax: +44 1223 336033; E-mail: [email protected]).

Author Contributions

Conceptualization, A.R. and R.F.W.; methodology, A.R., M.L., and M.A.; crystal structure analysis, M.L.; investigation, A.R., M.L., and M.A.; resources, R.F.W. and M.D.; data curation, A.R. and M.L.; writing—original draft preparation, A.R. and R.F.W.; writing—review and editing, A.R. and R.F.W.; visualization, A.R.; supervision, R.F.W. and M.L.; project administration, R.F.W.; funding acquisition, R.F.W. and M.D. All authors have read and agreed to the published version of the manuscript.

Funding

This research received no external funding.

Data Availability Statement

Data are contained within the article or in the Supplementary Materials.

Acknowledgments

We thank Malin Bein for ESI-MS, Anke Friemel from the NMR core facility for NMR spectroscopic measurements, and Kai Jellinek for his aid with the synthesis of carbinols 1-OH and 3-OH.

Conflicts of Interest

The authors declare no conflict of interest.

References

  1. Pierpont, C.G. Studies on charge distribution and valence tautomerism in transition metal complexes of catecholate and semiquinonate ligands. Coord. Chem. Rev. 2001, 216, 99–125. [Google Scholar] [CrossRef]
  2. Adams, D.M.; Li, B.; Simon, J.D.; Hendrickson, D.N. Photoinduced Valence Tautomerism in Cobalt Complexes Containing Semiquinone Anion as Ligand: Dynamics of the High-Spin [CoII(3,5-dtbsq)2] to Low-Spin [CoIII(3,5-dtbsq)(3,5-dtbcat)] Interconversion. Angew. Chem. Int. Ed. 1995, 34, 1481–1483. [Google Scholar] [CrossRef]
  3. Adams, D.M.; Hendrickson, D.N. Pulsed Laser Photolysis and Thermodynamics Studies of Intramolecular Electron Transfer in Valence Tautomeric Cobalt o-Quinone Complexes. J. Am. Chem. Soc. 1996, 118, 11515–11528. [Google Scholar] [CrossRef]
  4. Sato, O.; Cui, A.; Matsuda, R.; Tao, J.; Hayami, S. Photo-induced Valence Tautomerism in Co Complexes. Acc. Chem. Res. 2007, 40, 361–369. [Google Scholar] [CrossRef]
  5. Tao, J.; Maruyama, H.; Sato, O. Valence Tautomeric Transitions with Thermal Hysteresis around Room Temperature and Photoinduced Effects Observed in a Cobalt-Tetraoxolene Complex. J. Am. Chem. Soc. 2006, 128, 1790–1791. [Google Scholar] [CrossRef]
  6. Francisco, T.M.; Gee, W.J.; Shepherd, H.J.; Warren, M.R.; Shultz, D.A.; Raithby, P.R.; Pinheiro, C.B. Hard X-ray-Induced Valence Tautomeric Interconversion in Cobalt-o-Dioxolene Complexes. J. Phys. Chem. Lett. 2017, 8, 4774–4778. [Google Scholar] [CrossRef]
  7. Poneti, G.; Mannini, M.; Sorace, L.; Sainctavit, P.; Arrio, M.-A.; Otero, E.; Criginski Cezar, J.; Dei, A. Soft-X-ray-Induced Redox Isomerism in a Cobalt Dioxolene Complex. Angew. Chem. Int. Ed. 2010, 49, 1954–1957. [Google Scholar] [CrossRef]
  8. Buchanan, R.M.; Pierpont, C.G. Tautomeric Catecholate-Semiquinone Interconversion via Metal-Ligand Electron Transfer. Structural, Spectral, and Magnetic Properties of (3,5-Di-tert-butylcatecholato)-(3,5-di-tert-butylsemiquinone)(bipyridyl)cobalt(III), a Complex Containing Mixed-Valence Organic Ligands. J. Am. Chem. Soc. 1980, 102, 4951–4957. [Google Scholar] [CrossRef]
  9. Caneschi, A.; Dei, A.; Fabrizi de Biani, F.; Gütlich, P.; Ksenofontov, V.; Levchenko, G.; Hoefer, A.; Renz, F. Pressure- and Temperature-Induced Valence Tautomeric Interconversion in a o-Dioxolene Adduct of a Cobalt-Tetraazamacrocycle Complex. Chem. Eur. J. 2001, 7, 3926–3930. [Google Scholar] [CrossRef]
  10. Carbonera, C.; Dei, A.; Létard, J.-F.; Sangregorio, C.; Sorace, L. Thermally and Light-Induced Valence Tautomeric Transition in a Dinuclear Cobalt-Tetraoxolene Complex. Angew. Chem. Int. Ed. 2004, 43, 3136–3138. [Google Scholar] [CrossRef]
  11. Leroy, L.; Francisco, T.M.; Shepherd, H.J.; Warren, M.R.; Saunders, L.K.; Shultz, D.A.; Raithby, P.R.; Pinheiro, C.B. Controlled Light and Temperature Induced Valence Tautomerism in a Cobalt-o-Dioxolene Complex. Inorg. Chem. 2021, 60, 8665–8671. [Google Scholar] [CrossRef] [PubMed]
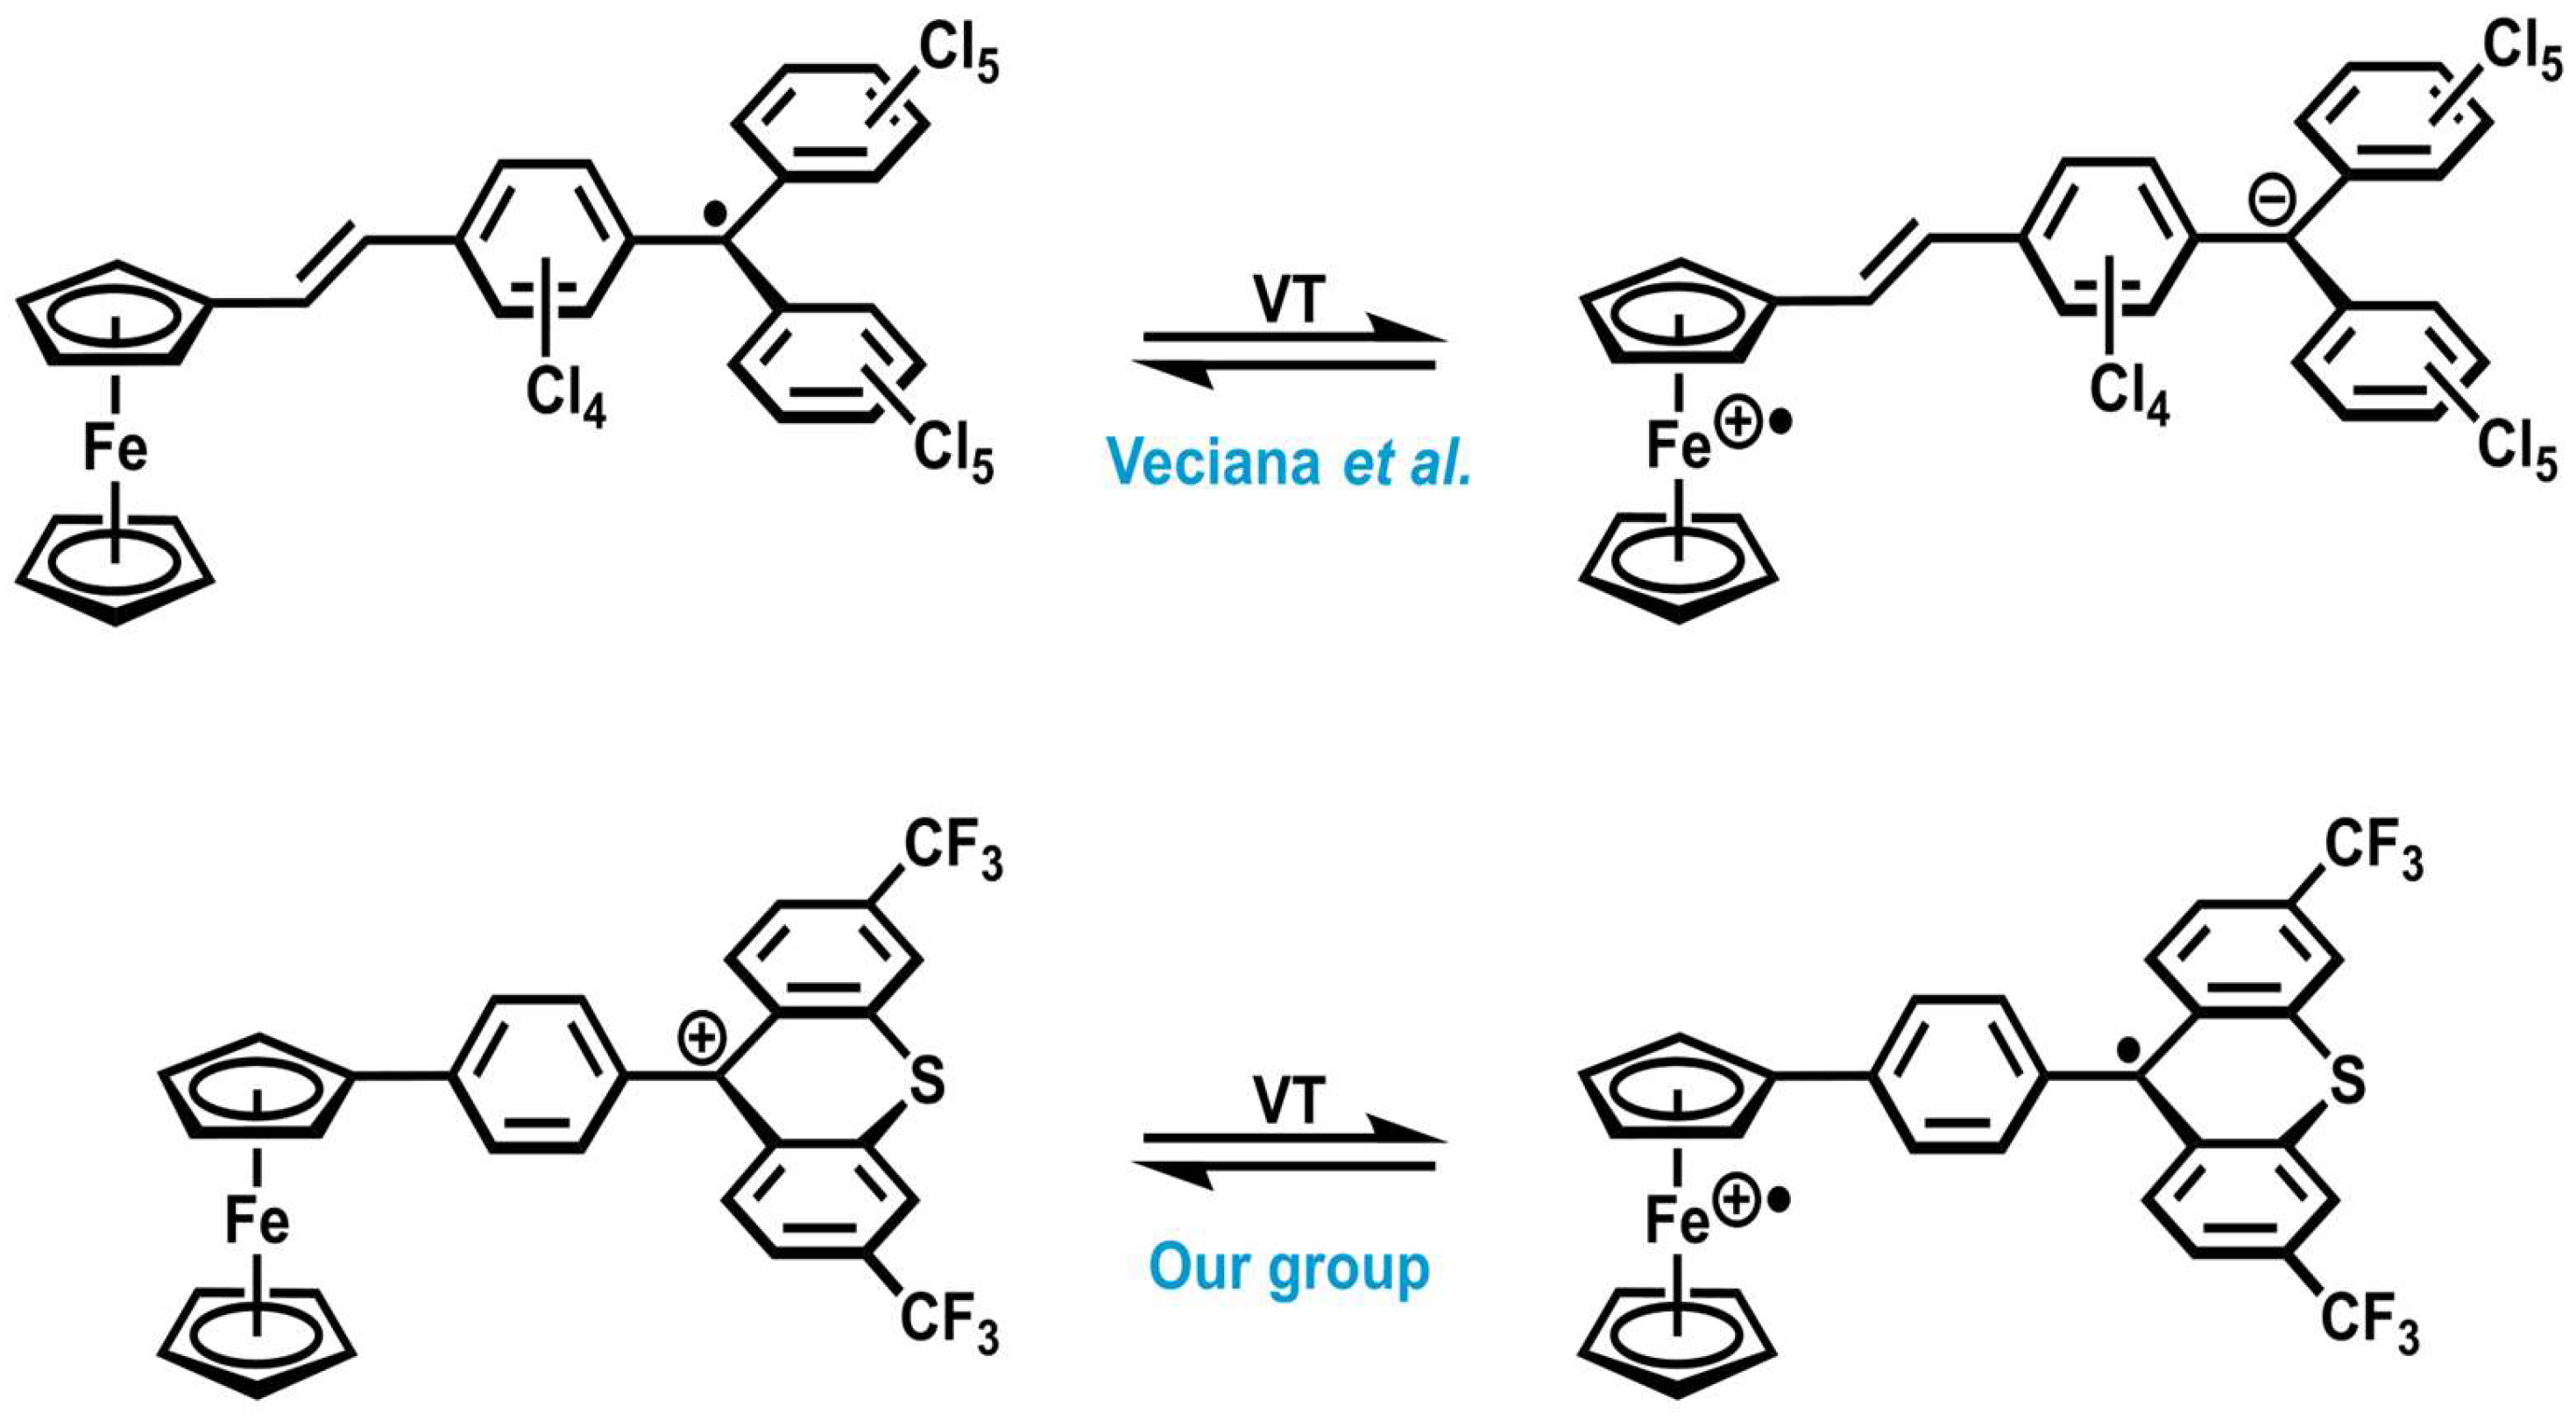
  12. Ratera, I.; Ruiz-Molina, D.; Renz, F.; Ensling, J.; Wurst, K.; Rovira, C.; Gütlich, P.; Veciana, J. A New Valence Tautomerism Example in an Electroactive Ferrocene Substituted Triphenylmethyl Radical. J. Am. Chem. Soc. 2003, 125, 1462–1463. [Google Scholar] [CrossRef] [PubMed]
  13. Evangelio, E.; Ruiz-Molina, D. Valence Tautomerism: New Challenges for Electroactive Ligands. Eur. J. Inorg. Chem. 2005, 2005, 2957–2971. [Google Scholar] [CrossRef]
  14. Evangelio, E.; Ruiz-Molina, D. Valence tautomerism: More actors than just electroactive ligands and metal ions. C. R. Chim. 2008, 11, 1137–1154. [Google Scholar] [CrossRef]
  15. Tezgerevska, T.; Alley, K.G.; Boskovic, C. Valence tautomerism in metal complexes: Stimulated and reversible intramolecular electron transfer between metal centers and organic ligands. Coord. Chem. Rev. 2014, 268, 23–40. [Google Scholar] [CrossRef]
  16. Casper, L.A.; Linseis, M.; Demeshko, S.; Azarkh, M.; Drescher, M.; Winter, R.F. Tailoring Valence Tautomerism by Using Redox Potentials: Studies on Ferrocene-Based Triarylmethylium Dyes with Electron-Poor Fluorenylium and Thioxanthylium Acceptors. Chem. Eur. J. 2021, 27, 10854–10868. [Google Scholar] [CrossRef]
  17. Arnett, E.M.; Flowers, R.A.; Ludwig, R.T.; Meekhof, A.E.; Walek, S.A. Triarylmethanes and 9-arylxanthenes as prototypes amphihydric compounds for relating the stabilities of cations, anions and radicals by C-H bond cleavage and electron transfer. J. Phys. Org. Chem. 1997, 10, 499–513. [Google Scholar] [CrossRef]
  18. Cheng, J.; Handoo, K.L.; Parker, V.D. Hydride Affinities of Carbenium Ions in Acetonitrile and Dimethyl Sulfoxide Solution. J. Am. Chem. Soc. 1993, 115, 2655–2660. [Google Scholar] [CrossRef]
  19. Breslow, R.; Mazur, S. Electrochemical Determination of pKR+ for Some Antiaromatic Cyclopentadienyl Cations. J. Am. Chem. Soc. 1973, 95, 584–585. [Google Scholar] [CrossRef]
  20. Strohbusch, F. Polarographische Untersuchungen der Substituenteneffekte in Triarylmethylkationen. Ber. Bunsenges. Phys. Chem. 1972, 76, 622–628. [Google Scholar] [CrossRef]
  21. Nau, M.; Casper, L.A.; Haug, G.; Linseis, M.; Demeshko, S.; Winter, R.F. Linker permethylation as a means to foster valence tautomerism and thwart dimerization in ferrocenyl-triarylmethylium cations. Dalton Trans. 2023, 52, 4674–4677. [Google Scholar] [CrossRef] [PubMed]
  22. Prins, R. Electronic structure of the ferricenium cation. Mol. Phys. 1970, 19, 603–620. [Google Scholar] [CrossRef]
  23. Prins, R.; Reinders, F.J. Electron Spin Resonance of the Cation of Ferrocene. J. Am. Chem. Soc. 1969, 91, 4929–4931. [Google Scholar] [CrossRef]
  24. Fischer, E.O.; Öfele, K. Über Aromatenkomplexe von Metallen, XIII Benzol-Chrom-Tricarbonyl. Chem. Ber. 1957, 90, 2532–2535. [Google Scholar] [CrossRef]
  25. Berger, A.; Djukic, J.-P.; Michon, C. Metalated (η6-arene)tricarbonylchromium complexes in organometallic chemistry. Coord. Chem. Rev. 2002, 225, 215–238. [Google Scholar] [CrossRef]
  26. Rosillo, M.; Domínguez, G.; Pérez-Castells, J. Chromium arene complexes in organic synthesis. Chem. Soc. Rev. 2007, 36, 1589–1604. [Google Scholar] [CrossRef]
  27. Semmelhack, M.F. Transition Metal Arene Complexes: Nucleophilic Addition. In Comprehensive Organometallic Chemistry II; Abel, E.W., Stone, F.G.A., Wilkinson, G., Eds.; Elsevier: Oxford, UK, 1995; pp. 979–1015. [Google Scholar]
  28. Nicholls, B.; Whiting, M.C. The Organic Chemistry of the Transition Elements. Part I. Tricarbonylchromium Derivatives of Aromatic Compounds. J. Chem. Soc. 1959, 551–556. [Google Scholar] [CrossRef]
  29. Strohmeier, W. Eine verbesserte Darstellung von Aromaten- und Cycloheptatrien-Chromtricarbonylen. Chem. Ber. 1961, 94, 2490–2493. [Google Scholar] [CrossRef]
  30. Mahaffy, C.A.L.; Pauson, P.L.; Rausch, M.D.; Lee, W. (η6-Arene)Tricarbonylchromium Complexes. In Inorganic Syntheses; Shriver, D.F., Ed.; John Wiley & Sons, Inc.: Hoboken, NJ, USA, 1979; pp. 154–158. [Google Scholar]
  31. Connelly, N.G.; Demidowicz, Z.; Kelly, R.L. Reactions of Tricarbonyl(η-hexamethylbenzene)chromium Derivatives with Nitrosonium and Benzenediazonium Ions: Reversible Oxidation versus Nitrosyl- or Areneazo-complex Formation. J. Chem. Soc. Dalton Trans. 1975, 22, 2335–2340. [Google Scholar] [CrossRef]
  32. Ohrenberg, N.C.; Paradee, L.M.; DeWitte, R.J.; Chong, D.; Geiger, W.E. Spectra and Synthetic-Time-Scale Substitution Reactions of Electrochemically Produced [Cr(CO)3(η6-arene)]+ Complexes. Organometallics 2010, 29, 3179–3186. [Google Scholar] [CrossRef]
  33. Van Order, N., Jr.; Geiger, W.E.; Bitterwolf, T.E.; Rheingold, A.L. Mixed-Valent Cations of Dinuclear Chromium Arene Complexes: Electrochemical, Spectroscopic, and Structural Considerations. J. Am. Chem. Soc. 1987, 109, 5680–5690. [Google Scholar] [CrossRef]
  34. Pierce, D.T.; Geiger, W.E. Mixed-Valent Interactions in Rigid Dinuclear Systems: Electrochemical and Spectroscopic Studies of CrICr0 Ions with Controlled Torsion of the Biphenyl Bridge. Inorg. Chem. 1994, 33, 373–381. [Google Scholar] [CrossRef]
  35. Castellani, M.P.; Connelly, N.G.; Pike, R.D.; Rieger, A.L.; Rieger, P.H. EPR Spectra of [Cr(CO)2L(η-C6Me6)]+ (L= PEt3, PPh3, P(OEt)3, P(OPh)3): Analysis of Line Widths and Determination of Ground State Configuration from Interpretation of 31P Couplings. Organometallics 1997, 16, 4369–4376. [Google Scholar] [CrossRef]
  36. Momoi, Y.; Okano, K.; Tokuyama, H. Generation of Aryl Grignard Reagents from Arene Chromium Tricarbonyl Complexes by Mg(TMP)2·2LiCl and Their Application to Murahashi Coupling. Synlett 2014, 25, 2503–2507. [Google Scholar] [CrossRef]
  37. Strohmeier, W.; Hellmann, H. Photochemisch hergestellte Derivate von Aromatenchromtricarbonylen und ihre Stabilität als Funktion der Substituenten am Benzolring. Chem. Ber. 1963, 96, 2859–2866. [Google Scholar] [CrossRef]
  38. Cais, M.; Kaftory, M.; Kohn, D.H.; Tatarsky, D. Structural and catalytic activity studies on phosphine- and phosphite-dicarbonylchromium complexes of phenanthrene and naphthalene. J. Organomet. Chem. 1980, 184, 103–112. [Google Scholar] [CrossRef]
  39. Brookhart, M.; Grant, B.; Volpe, A.F., Jr. [(3,5-(CF3)2C6H3)4B]-[H(OEt2)2]+: A Convenient Reagent for Generation and Stabilization of Cationic, Highly Electrophilic Organometallic Complexes. Organometallics 1992, 11, 3920–3922. [Google Scholar] [CrossRef]
  40. Oßwald, S.; Casper, L.A.; Anders, P.; Schiebel, E.; Demeshko, S.; Winter, R.F. Electrochemical, Spectroelectrochemical, Mößbauer, and EPR Spectroscopic Studies on Ferrocenyl-Substituted Tritylium Dyes. Chem. Eur. J. 2018, 24, 12524–12538. [Google Scholar] [CrossRef]
  41. Casper, L.A.; Oßwald, S.; Anders, P.; Rosenbaum, L.-C.; Winter, R.F. Extremely Electron-Poor Bis(diarylmethylium)-Substituted Ferrocenes and the First Peroxoferrocenophane. Z. Anorg. Allg. Chem. 2020, 646, 712–725. [Google Scholar] [CrossRef]
  42. Casper, L.A.; Wursthorn, L.; Geppert, M.; Roser, P.; Linseis, M.; Drescher, M.; Winter, R.F. 4-Ferrocenylphenyl-Substituted Tritylium Dyes with Open and Interlinked C+Ar2 Entities: Redox Behavior, Electrochromism, and a Quantitative Study of the Dimerization of Their Neutral Radicals. Organometallics 2020, 39, 3275–3289. [Google Scholar] [CrossRef]
  43. Tan, Y.-L.; White, A.J.P.; Widdowson, D.A.; Wilhelm, R.; Williams, D.J. Dilithiation of arenetricarbonylchromium(0) complexes with enantioselective quench: Application to chiral biaryl synthesis. J. Chem. Soc. Perkin Trans. 2001, 24, 3269–3280. [Google Scholar] [CrossRef]
  44. Uemura, M.; Nishikawa, N.; Take, K.; Ohnishi, M.; Hirotsu, K.; Higuchi, T.; Hayashi, Y. Arene-Metal Complex in Organic Synthesis: Directed Regioselective Lithiation of (π-Substituted benzene)chromium Tricarbonyl Complexes. J. Org. Chem. 1983, 48, 2349–2356. [Google Scholar] [CrossRef]
  45. Carter, O.L.; McPhail, A.T.; Sim, G.A. Metal-Carbonyl and Metal-Nitrosyl Complexes. Part II. Crystal and Molecular Structure of the Tricarbonylchromiumanisole-1,3,5-Trinitrobenzene Complex. J. Chem. Soc. A 1966, 822–838. [Google Scholar] [CrossRef]
  46. Alberico, E.; Braun, W.; Calmuschi-Cula, B.; Englert, U.; Salzer, A.; Totev, D. Expanding the Range of “Daniphos”-Type P∩P- and P∩N-Ligands: Synthesis and Structural Characterisation of New [(η6-arene)Cr(CO)3] Complexes. Eur. J. Inorg. Chem. 2007, 2007, 4923–4945. [Google Scholar] [CrossRef]
  47. Cambie, R.C.; Clark, G.R.; Gourdie, A.C.; Rutledge, P.S.; Woodgate, P.D. Synthesis and crystal structures of the α and β stereoisomers of tricarbonyl[(8,9,11,12,13,14-η)-methyl 12-methoxypodocarpa-8,11,13-trien-19-oate]chromium. J. Organomet. Chem. 1985, 297, 177–184. [Google Scholar] [CrossRef]
  48. Gilday, J.P.; Widdowson, D.A. Lithiation of 2-, 3-, and 4-Fluoroanisole(tricarbonyl)chromium(0) Complexes: A Reversal of Normal Regiocontrol. J. Chem. Soc. Chem. Commun. 1986, 16, 1235–1237. [Google Scholar] [CrossRef]
  49. Batuecas, M.; Luo, J.; Gergelitsová, I.; Krämer, K.; Whitaker, D.; Vitorica-Yrezabal, I.J.; Larrosa, I. Catalytic Asymmetric C-H Arylation of (η6-Arene)Chromium Complexes: Facile Access to Planar-Chiral Phosphines. ACS Catal. 2019, 9, 5268–5278. [Google Scholar] [CrossRef]
  50. Camire, N.; Nafady, A.; Geiger, W.E. Characterization and Reactions of Previously Elusive 17-Electron Cations: Electrochemical Oxidations of (C6H6)Cr(CO)3 and (C5H5)Co(CO)2 in the Presence of [B(C6F5)4]. J. Am. Chem. Soc. 2002, 124, 7260–7261. [Google Scholar] [CrossRef]
  51. Hunter, A.D.; Mozol, V.; Tsai, S.D. Nonlinear Substituent Interactions and the Electron Richness of Substituted (η6-Arene)Cr(CO)3 Complexes as Measured by IR and 13C NMR Spectroscopy and Cyclic Voltammetry: Role of π-Donor and π-Acceptor Interactions. Organometallics 1992, 11, 2251–2262. [Google Scholar] [CrossRef]
  52. Connelly, N.G.; Geiger, W.E. Chemical Redox Agents for Organometallic Chemistry. Chem. Rev. 1996, 96, 877–910. [Google Scholar] [CrossRef]
  53. Lever, A.B.P. Electrochemical Parametrization of Metal Complex Redox Potentials, Using the Ruthenium(III)/Ruthenium(II) Couple to Generate a Ligand Electrochemical Series. Inorg. Chem. 1990, 29, 1271–1285. [Google Scholar] [CrossRef]
  54. Richardson, D.E.; Taube, H. Determination of E20-E10 in Multistep Charge Transfer by Stationary-Electrode Pulse and Cyclic Voltammetry: Application to Binuclear Ruthenium Ammines. Inorg. Chem. 1981, 20, 1278–1285. [Google Scholar] [CrossRef]
  55. Mahaffy, C.A.L.; Pauson, P.L.; Rausch, M.D.; Lee, W. (η6-Arene)Tricarbonylchromium Complexes. In Reagents for Transition Metal Complex and Organometallic Syntheses; Angelici, R.J., Basolo, F., Eds.; Wiley: New York, NY, USA, 1990; pp. 136–140. [Google Scholar]
  56. Trapp, C.; Wang, C.-S.; Filler, R. Electron Spin Resonance Absorption in the Tris(pentafluorophenyl)methyl Radical. J. Chem. Phys. 2004, 45, 3472–3474. [Google Scholar] [CrossRef]
  57. Hoffmann, K.F.; Battke, D.; Golz, P.; Rupf, S.M.; Malischewski, M.; Riedel, S. The Tris(pentafluorophenyl)methylium Cation: Isolation and Reactivity. Angew. Chem. Int. Ed. 2022, 61, e202203777. [Google Scholar] [CrossRef]
  58. Stoll, S.; Schweiger, A. EasySpin, a comprehensive software package for spectral simulation and analysis in EPR. J. Magn. Reson. 2006, 178, 42–55. [Google Scholar] [CrossRef]
  59. Eaton, S.S.; Eaton, G.R. Signal Area Measurements in EPR. Bull. Magn. Reson. 1979, 1, 130–138. [Google Scholar]
  60. Holden, A.N.; Kittel, C.; Merritt, F.R.; Yager, W.A. Determination of g-Values in Paramagnetic Organic Compounds by Microwave Resonance. Phys. Rev. 1950, 77, 147–148. [Google Scholar] [CrossRef]
  61. Bagchi, R.N.; Bond, A.M.; Brain, G.; Colton, R.; Henderson, T.L.E.; Kevekordes, J.E. Electrochemical, Chemical and Spectroscopic Characterization of the trans-[Tetracarbonylbis(triphenylphosphine)chromium]+/0 Redox Couple. Organometallics 1984, 3, 4–9. [Google Scholar] [CrossRef]
  62. Bond, A.M.; Colton, R.; Kevekordes, J.E. Redox Reactions of Chromium Tetracarbonyl and Tricarbonyl Complexes: Thermodynamic, Kinetic, and Catalytic Aspects of Isomerization in the fac/mer-Tricarbonyltris(trimethyl phosphite)chromium(1+/0) System. Inorg. Chem. 1986, 25, 749–756. [Google Scholar] [CrossRef]
  63. Hunter, A.D.; Shilliday, L.; Furey, W.S.; Zaworotko, M.J. Systematic X-ray Crystallographic Study of the Structural Manifestations of π-Donor and π-Acceptor Substituent Effects in Substituted (η6-Arene)Cr(CO)3 Complexes. Organometallics 1992, 11, 1550–1560. [Google Scholar] [CrossRef]
  64. Reger, D.L.; Wright, T.D.; Little, C.A.; Lamba, J.J.S.; Smith, M.D. Control of the Stereochemical Impact of the Lone Pair in Lead(II) Tris(pyrazolyl)methane Complexes. Improved Preparation of Na{B[3,5-(CF3)2C6H3]4}. Inorg. Chem. 2001, 40, 3810–3814. [Google Scholar] [CrossRef] [PubMed]
  65. Li, Y.; Josowicz, M.; Tolbert, L.M. Diferrocenyl Molecular Wires. The Role of Heteroatom Linkers. J. Am. Chem. Soc. 2010, 132, 10374–10382. [Google Scholar] [CrossRef] [PubMed]
  66. Hunter, G.; Weakley, T.J.R.; Weissensteiner, W. The Triphenylphosphine Cone Angle and Restricted Rotation about the Chromium-Phosphorus Bond in Dicarbonyl(η6-hexa-alkylbenzene)(triphenylphosphine)chromium(0) Complexes. Crystal and Molecular Structure of Dicarbonyl(η6-hexa-n-propylbenzene)(triphenylphosphine)chromium(0). J. Chem. Soc. Dalton Trans. 1987, 6, 1545–1550. [Google Scholar] [CrossRef]
  67. Kratzert, D.; Holstein, J.J.; Krossing, I. DSR: Enhanced modelling and refinement of disordered structures with SHELXL. J. Appl. Crystallogr. 2015, 48, 933–938. [Google Scholar] [CrossRef]
  68. Sheldrick, G.M. SHELXT—Integrated space-group and crystal-structure determination. Acta Crystallogr. A 2015, 71, 3–8. [Google Scholar] [CrossRef]
  69. Dolomanov, O.V.; Bourhis, L.J.; Gildea, R.J.; Howard, J.A.K.; Puschmann, H. OLEX2: A complete structure solution, refinement and analysis program. J. Appl. Crystallogr. 2009, 42, 339–341. [Google Scholar] [CrossRef]
Scheme 1. Valence tautomerism (VT) in literature-known ferrocene–trityl(ium) complexes relevant to this work [12,16].
Inorganics 11 00448 sch001
Scheme 2. Anticipated valence tautomeric equilibrium between diamagnetic [(η6-arene)Cr(CO)2L]–triarylmethylium complexes 1+3+ (left) and their paramagnetic valence tautomers 1+••3+•• (right).
Inorganics 11 00448 sch002
Scheme 3. Synthesis of carbinol precursors 1-OH3-OH and subsequent conversion to tritylium complexes 1+3+: (i) 4-trifluoromethylphenyl lithium, THF, −78 °C— r.t., 16 h; (ii) corresponding ligand L, THF for 2-OH, toluene for 3-OH, , r.t., 5–10 min; (iii) HBArF24, CH2Cl2, −70 °C, 5 min.
Inorganics 11 00448 sch003
Figure 1. ORTEP of the Sp enantiomer of carbinol 3-OH with atomic numbering and the hydrogen-bonded ether molecule. Ellipsoids are displayed at the 50% probability level. The hydrogen atoms of the triphenylphosphine ligand, a second ether solvent molecule, and disorders of the CF3 groups are omitted for clarity reasons. Color code: Cr, blue; O, red; F, green; P, purple; C, black.
Inorganics 11 00448 g001
Figure 2. (a) Cyclic voltammograms of carbinols 1-OH3-OH (293 ± 3 K). (b) Cyclic voltammograms of cations 1+3+ (293 ± 3, resp. 195 ± 3 K for 3+) and identified decomposition products 1-H and L+. Vertical lines in grey and blue indicate the half-wave potentials of the decomposition products. (c) Three-segment cyclic voltammogram of 3+ (195 ± 3 K), starting at the open circuit potential marked by the arrow. Supporting electrolyte: CH2Cl2/0.1 M [NBu4]+ [BArF24]; scan rate v = 100 mV s−1. The arrow marks the starting potential from where the sweep was initiated.
Inorganics 11 00448 g002
Figure 3. (a) IR spectra of 1-OH and 1+ in CH2Cl2 at −70 °C, (b) IR spectra of 3-OH and 3+ in CH2Cl2 at −70 °C, and (c) baseline-corrected IR spectra of 3+ within the temperature range from −75 to −40 °C.
Inorganics 11 00448 g003
Figure 4. Experimental and simulated EPR spectra of diradical 3+•• at different temperatures. (a) Solution spectra at −70 °C; (b) in the temperature range from −90 to −40 °C; (c) in frozen CH2Cl2 at 77 K.
Inorganics 11 00448 g004
Scheme 4. Schematic representation of the quantitative EPR spectroscopy procedure of 3+ and the dimerization of the paramagnetic valence tautomer 3+•• to 3+•-3+•. (1) Double integration of the EPR signal (DI), (2) comparison of the DI to a regression line recorded from the stable 2,2-diphenyl-1-picrylhydrazyl radical (dpph) to yield the effective spin concentration, and (3) comparison of the spin concentration to the nominal concentration [42].
Inorganics 11 00448 sch004
Scheme 5. Identified decomposition products of the tritylium complex 3+.
Inorganics 11 00448 sch005
Figure 5. 1H-NMR spectra of 1+ in CD2Cl2 after 12 h at r.t. (top) and purified decomposition products 1-H (middle) and L-H (bottom). [BArF24] signals are marked with asterisks. NMR resonances that are common to both 1-H and L-H are shaded in gray, those specific to 1-H are shaded in light blue, and those specific to L-H are shaded in light violet.
Inorganics 11 00448 g005
Figure 6. ORTEPs of the Rp enantiomer of 1-H (left) and L-H (right) with atomic numbering. Ellipsoids are displayed at the 50% probability level. Disorders are omitted for clarity reasons. Color code: Cr, blue; O, red; F, green; C, black.
Inorganics 11 00448 g006
Table 1. Comparison of important bond lengths and angles of complexes 1′, 3-OH, 1-H, and L-H (see Scheme 5 for molecular structures of 1-H and L-H).
1′3-OH1-HL-H
Crystal systemtriclinicmonoclinicmonoclinicorthorhombic
Space groupP 1 ¯ P21/cP21/nPbca
PhCr-Ph153.63(17)°52.55(14)°55.3(5)°47.09(8)°
Ph1-Ph2n.a.75.00(16)°78.1(5)°77.00(8)°
Ph1-Ph3n.a.76.50(18)°84.1(5)°82.95(8)°
Ph1-C-OHn.a.110.1(3)°n.a.n.a.
Ph2-C-OHn.a.105.9(3)°n.a.n.a.
Ph3-C-OHn.a.106.8(3)°n.a.n.a.
d C-OHn.a.1.433(4)n.a.n.a.
d Cr-PhCr1.7151(5)1.703(5)1.720(5)n.a.
d Cr-CO11.837(4)1.821(3)1.819(12)n.a.
d Cr-CO21.837(3)1.810(3)1.786(12)n.a.
d Cr-CO3/P1.844(5)2.303(1)1.801(12)n.a.
Bond length d in Å; n.a. = non applicable.
Table 2. Electrochemical data for carbinol precursors, cations, and decomposition products.
OxidationReductionPotential
Difference
E1/2ΔEpE1/2ΔEpΔE1/2
1-OH36071---
2-OH11081---
3-OH−26568---
1+[a]7509617578575
2+[b]4457715579290
3+[c]−180110−180110< 50
1-H43583---
L+--13572-
All potentials in mV (± 5 mV) relative to the Cp2Fe0/+ redox couple. Measured in CH2Cl2/0.1 M [NBu4]+ [BArF24] at 293 ± 3 K at a scan rate v of 100 mV s−1. [a] Additional redox wave at E1/2 = 435 mV can be assigned to 1-H. [b] Tentative assignment; see text. [c] Measured at 195 ± 3 K; ΔE1/2 estimated from the wave broadening of the convoluted redox wave according to ref. [54].
Table 3. CO stretching vibrations for all complexes.
v ~ C O (cm−1) average   v ~ C O (cm−1) [a]
1-OH1965, 18861912
2-OH1910, 18531872
3-OH1880, 18211840
1+1965, 18861912
2+2012, 1964 [b]
1904, 1848
1980 [b]
1867
3+1988, 1940 [b]
1878, 1819
1956 [b]
1839
1-H1965, 18881914
Measured in CH2Cl2 at 293 ± 3 K (neutral carbinols) and 203 ± 3 K (cationic complexes). [a] Weighted average counting the doubly degenerate asymmetric vibration twice. [b] IR data for the diradical valence tautomer.
Table 4. EPR data of the diradical valence tautomers 1+•• and 3+•• at different temperatures.
T in KMetal-Centered SpinOrganic Spin
g1g2g3A1A2A3gisoA
1+••77-[a]2.003-[b]
203-2.0055.4 (4H), 1.4 (2H), 2.7 (6F), 1.4 (1H)
3+••772.0952.0311.99134.6 (31P)33.9 (31P)27.8 (31P)2.003-[b]
203-2.0035.1 (4H), 1.4 (2H), 2.7 (6F), 1.4 (1H)
Hyperfine splitting constant A is provided in Gauss (G) with the number of equivalent nuclei in parentheses as taken from simulations. [a] No metal-centered spin could be detected. [b] No hyperfine splitting resolved.
Disclaimer/Publisher’s Note: The statements, opinions and data contained in all publications are solely those of the individual author(s) and contributor(s) and not of MDPI and/or the editor(s). MDPI and/or the editor(s) disclaim responsibility for any injury to people or property resulting from any ideas, methods, instructions or products referred to in the content.

