Article

Effect of the Annealing Temperature of Lithiophilic Ag–Cu Co-Deposition on the Cycling Performance of Li-Metal Anodes

1
Department of Advanced Materials Engineering, Tech University of Korea, Siheung-si 15073, Republic of Korea
2
Korea Photonics Technology Institute (KOPTI), Gwangju 61007, Republic of Korea
*
Author to whom correspondence should be addressed.
Inorganics 2023, 11(11), 440; https://doi.org/10.3390/inorganics11110440
Submission received: 30 September 2023 / Revised: 4 November 2023 / Accepted: 15 November 2023 / Published: 17 November 2023
(This article belongs to the Special Issue Novel Materials in Li–Ion Batteries)

Abstract

:
Practical applications of Li-metal anodes are limited by dendrite formation, Li loss, and poor reaction, resulting in a low Coulombic efficiency. In this study, we investigated the effects of island-shaped Ag atoms on the electrochemical behavior of Li-metal anodes. A Ag–Cu film was co-deposited through sputtering and subsequent annealing to anchor the Ag atoms with an island shape on a Cu substrate. The Ag target was co-sputtered with Cu with controlled atomic ratios in the Ag–Cu alloy. The sputtering thickness was set to 100 nm, and various annealing conditions were applied. The embedded island-shaped Ag atoms provided effective nucleation sites for Li deposition during the electrochemical nucleation of Li, increasing the nucleation density and spatial uniformity while decreasing the nucleation size and potential. Compact dendrite-free high-density Li deposition was achieved by annealing the Ag–Cu current collector (CC) at 600 °C. Under repetitive Li plating and stripping for 110 cycles at a current density of 0.5 mAcm−2 and capacity of 1 mAhcm−2, a high Coulombic efficiency of 98.5% was achieved. Conversely, the bare Cu CC had a life of up to 67 cycles under the same test conditions.

1. Introduction

Li-ion batteries are employed in various applications to help mitigate the effects of climate change and environmental pollution. They have previously been employed in devices with small batteries, such as electronic gadgets, expanding to medium- and large-battery applications at present, such as electric vehicles and energy storage systems [1,2,3]. Currently, the increasing demand for energy storage, particularly in electric vehicles wherein reducing the charging time and extending the range of a single charge are major concerns, has amplified the need for high-energy-density batteries for electrical appliances and electric vehicles worldwide. Consequently, research on batteries based on different materials, such as Li metal, Li–S, and Li–O2, has garnered momentum [4,5,6]. Among these, Li metal has the highest capacity (3860 mAhg−1) and lowest operating potential (−3.040 vs. standard hydrogen electrode), making it an ideal anode material. However, the practical applications of Li-metal anodes (LMAs) are limited by dendrite formation, Li loss, and poor reaction, resulting in a low Coulombic efficiency (CE) [7,8,9].
Most studies have focused on extending the lifespan of Li-ion batteries using metallic Li as the anode material [10]. However, the excessive use of Li metal can result in safety issues in batteries, including increased susceptibility to fire and explosion [11,12,13,14]. Consequently, researchers have been investigating methods for reducing the use of LMAs. Among these, an anode-free battery is a setup where cathode materials are paired with a current collector (CC). The Li ions from the cathode can be deposited on the CC as Li metal. Moreover, the negative/positive area capacity ratio of this battery is close to zero; thus, it is considered as an alternative approach with reduced LMA use [15]. However, even anode-free batteries suffer from a low CE because of dendrite formation, Li loss, and poor reactivity [16,17,18].
To date, various methods, such as forming an artificial solid–electrolyte interphase (SEI), optimizing the electrolyte composition, and controlling the Li-ion flux at the electrode interface, have been widely studied to mitigate dendrite formation [19,20,21]. This includes the promoted formation of MxLiy alloys by providing nucleation sites on the CC surface to control lithiation [22]. Similar studies are being conducted using Ni, Zn, and Au. However, Ni and other elements have lower Li nucleation overpotential compared to Cu, but they still exhibit Li nucleation overpotential. Additionally, Au and Pt are disadvantageous from a cost perspective. Based on various combinations of Li–Ag alloys, including AgLi12, among the noble metals, Ag, which is reasonably priced, is considered a promising metal candidate for an anode-free battery because it has the highest electrical conductivity and lower potential (0–0.250 VLi+/Li) than other metals [22,23]. Although the effect of Ag under cycling has been extensively investigated, the use of a CC to address the volumetric changes and concentrations of Ag atoms has not been thoroughly studied [24].
In this study, we examined the effect of Ag atoms embedded with an island shape on a Cu CC. We fabricated a CC with Ag atoms embedded on a Cu collector by co-sputtering Ag and Cu on the top surface, followed by heat treatment in an H2 atmosphere. The fabricated CCs were used as the anode collector in an LMA to control its lithiophilic surface. Ag and Cu were atomically mixed during Ag–Cu co-sputtering. We observed the characteristics of the fabricated CCs at increasing heat treatment temperatures of 400, 500, and 600 °C.

2. Results and Discussion

2.1. Structural Characterization of Different CCs

In this study, co-sputtering was performed using a magnetron DC-sputter system, as shown in Figure 1. To achieve Ag area ratios of 62.5%, 75%, and 100%, Cu foil pieces were precisely cut to match the desired area ratios and placed on the Ag circular target (99.99%, VTM, Incheon, Korea), followed by co-deposition.
Figure 2a shows the X-ray diffraction (XRD) pattern of the Ag–Cu film deposited via co-sputtering on a silicon wafer with different area ratios. The XRD patterns were analyzed to determine the lattice constant of the film. The Ag (111) peak is located at 40.34° and 38.69° when the area ratios of the Ag target are 62.5% and 75.0%, respectively. The lattice constants are calculated to be 0.387 and 0.403 nm, respectively. The calculated lattice constants and Vegard’s law confirm the Ag:Cu atomic ratios of 6:4 and 9:1, respectively [25].
Figure 2b shows the XRD spectra of the film with the Ag:Cu ratio of 9:1 deposited through co-sputtering on a glass substrate and annealed in a H2 (4%)/Ar (96%) atmosphere. The intensities of the Ag and Cu peaks increase with increasing annealing temperature. Additionally, from the XRD results (Ag(111) peak), the particle-size calculations yielded the sizes of 146.5, 63.7, and 27.6 nm for 400, 500, and 600 °C, respectively. This result suggests that the Ag and Cu atoms are metalized with increasing annealing temperature. In particular, the intensity becomes more pronounced at temperatures above 600 °C, suggesting that metallization occurs at 500–600 °C. Table 1 summarizes the measured surface resistivities of the heat-treated Ag–Cu film deposited with a Ag:Cu ratio of 9:1.
The resistivity decreases with increasing heat treatment temperature. When the temperature exceeds 500 °C, the resistance becomes extremely low and cannot be measured with the measuring instrument.

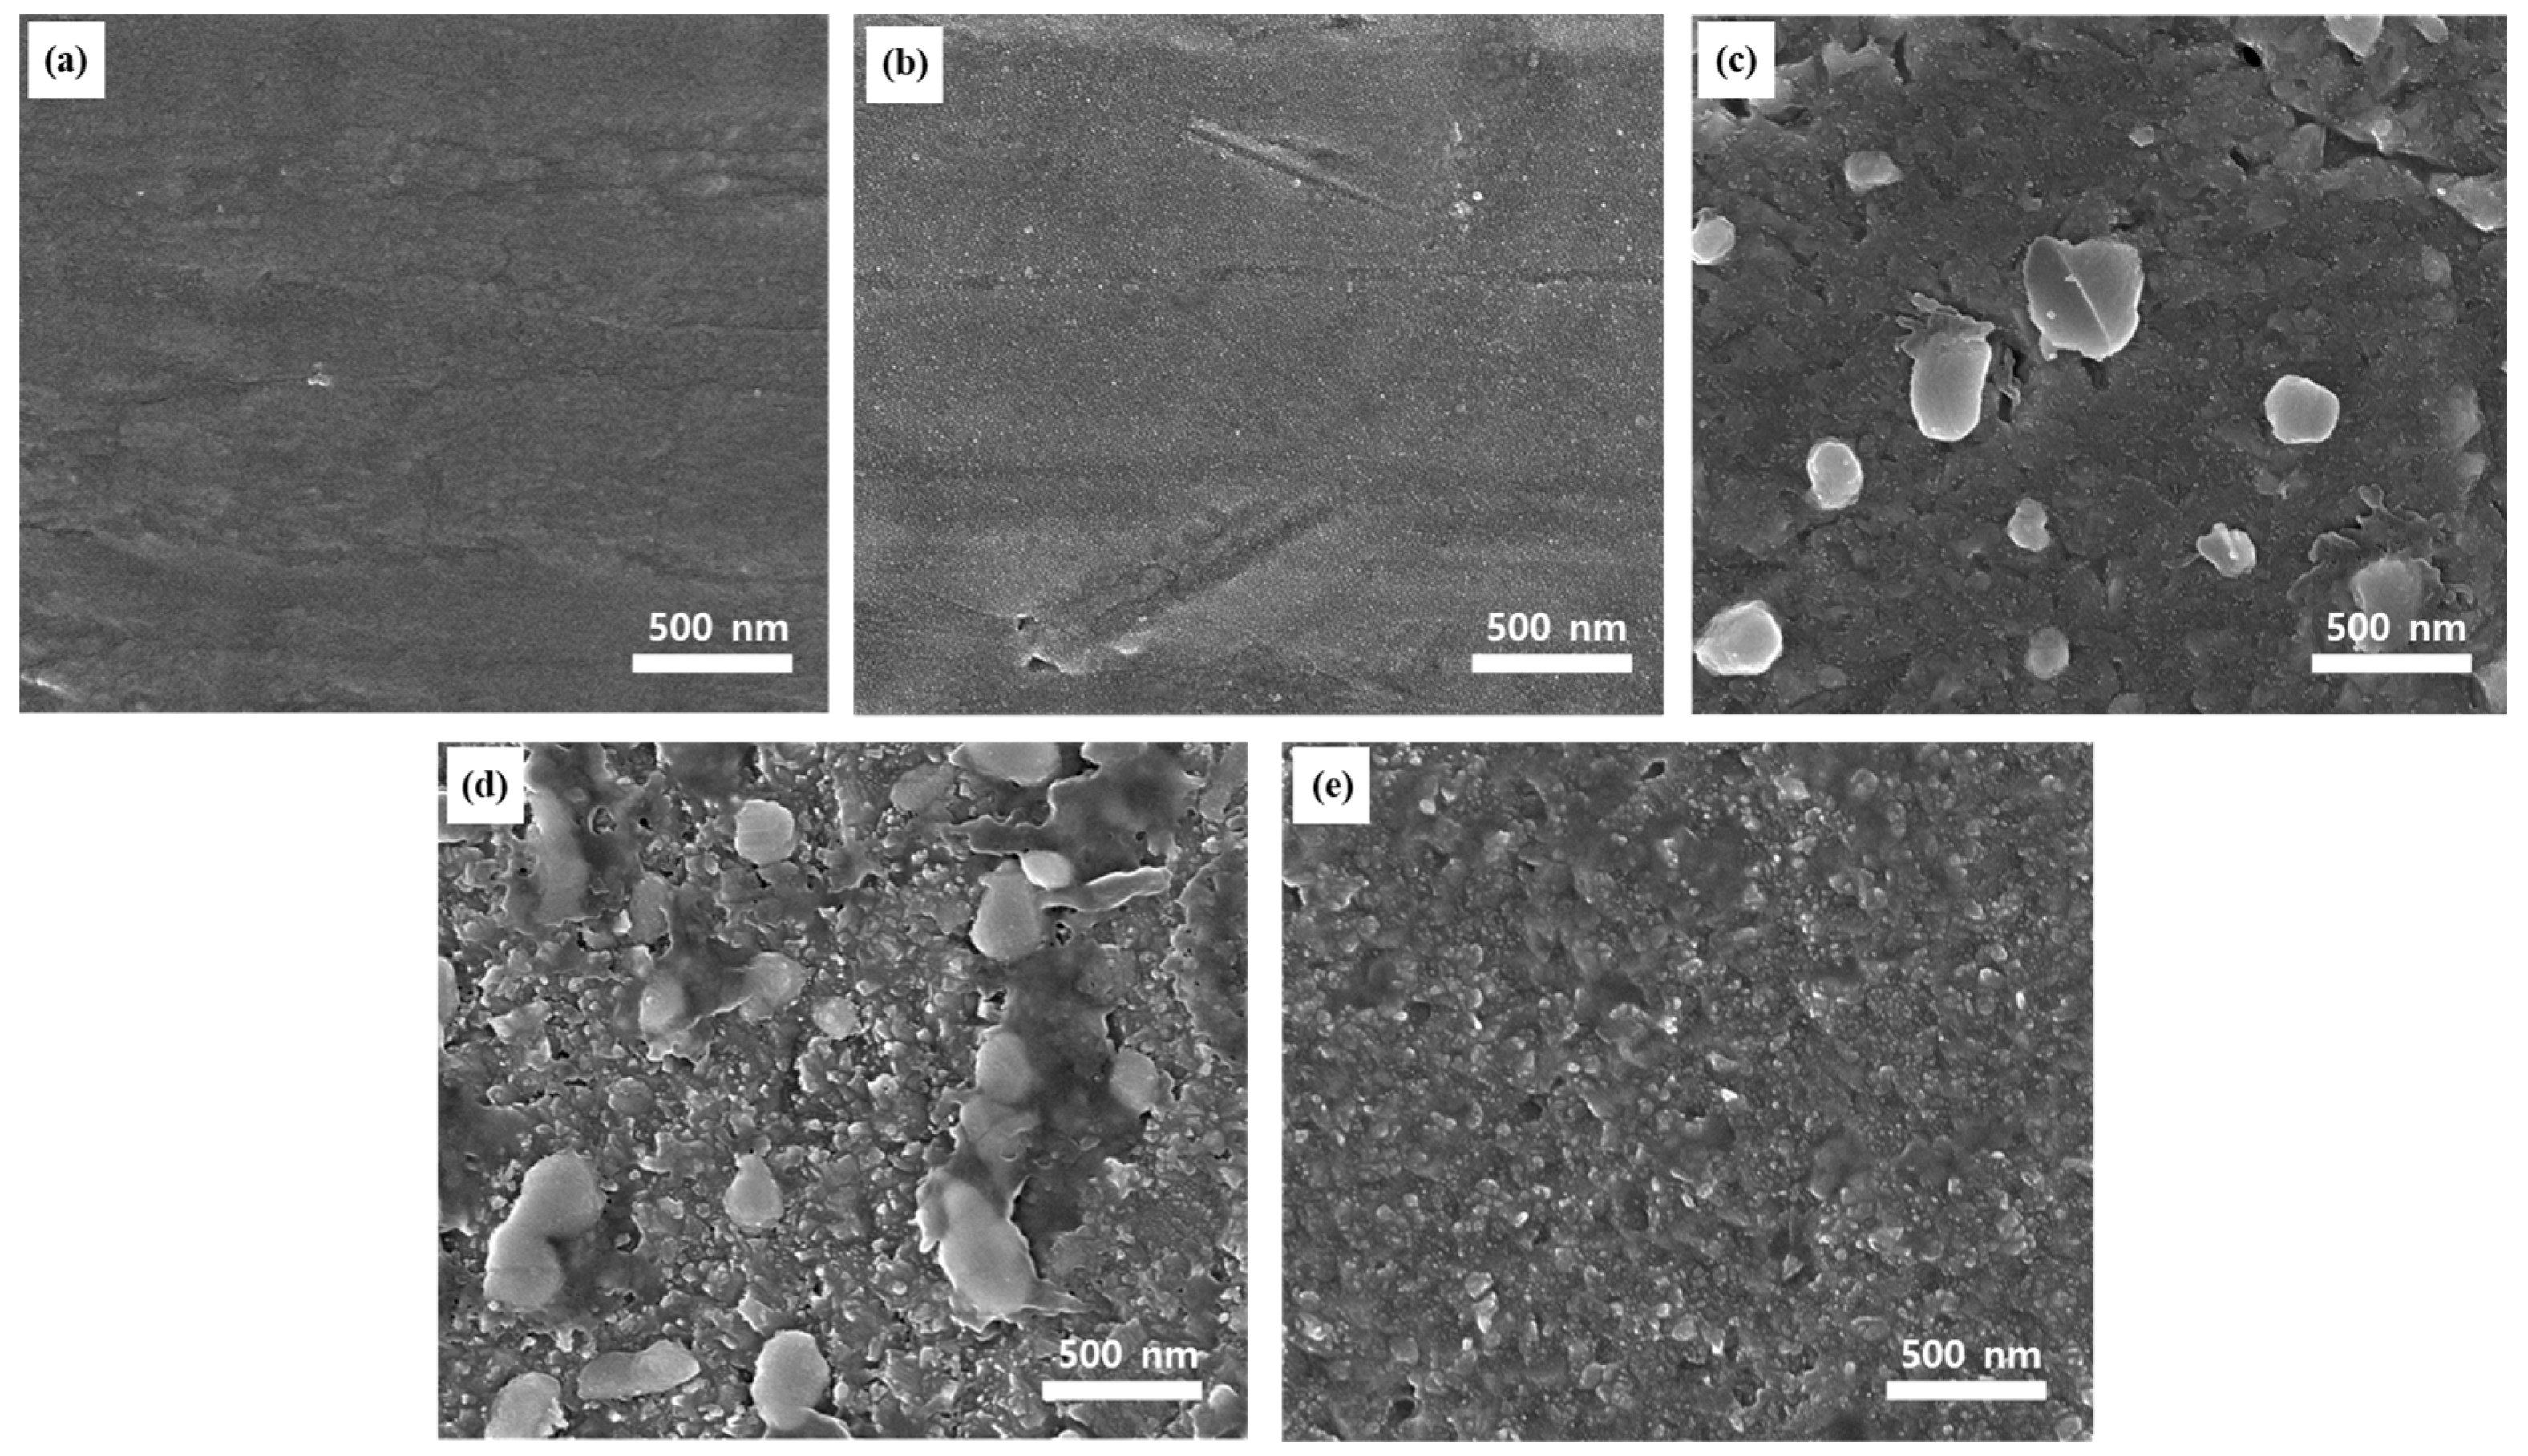
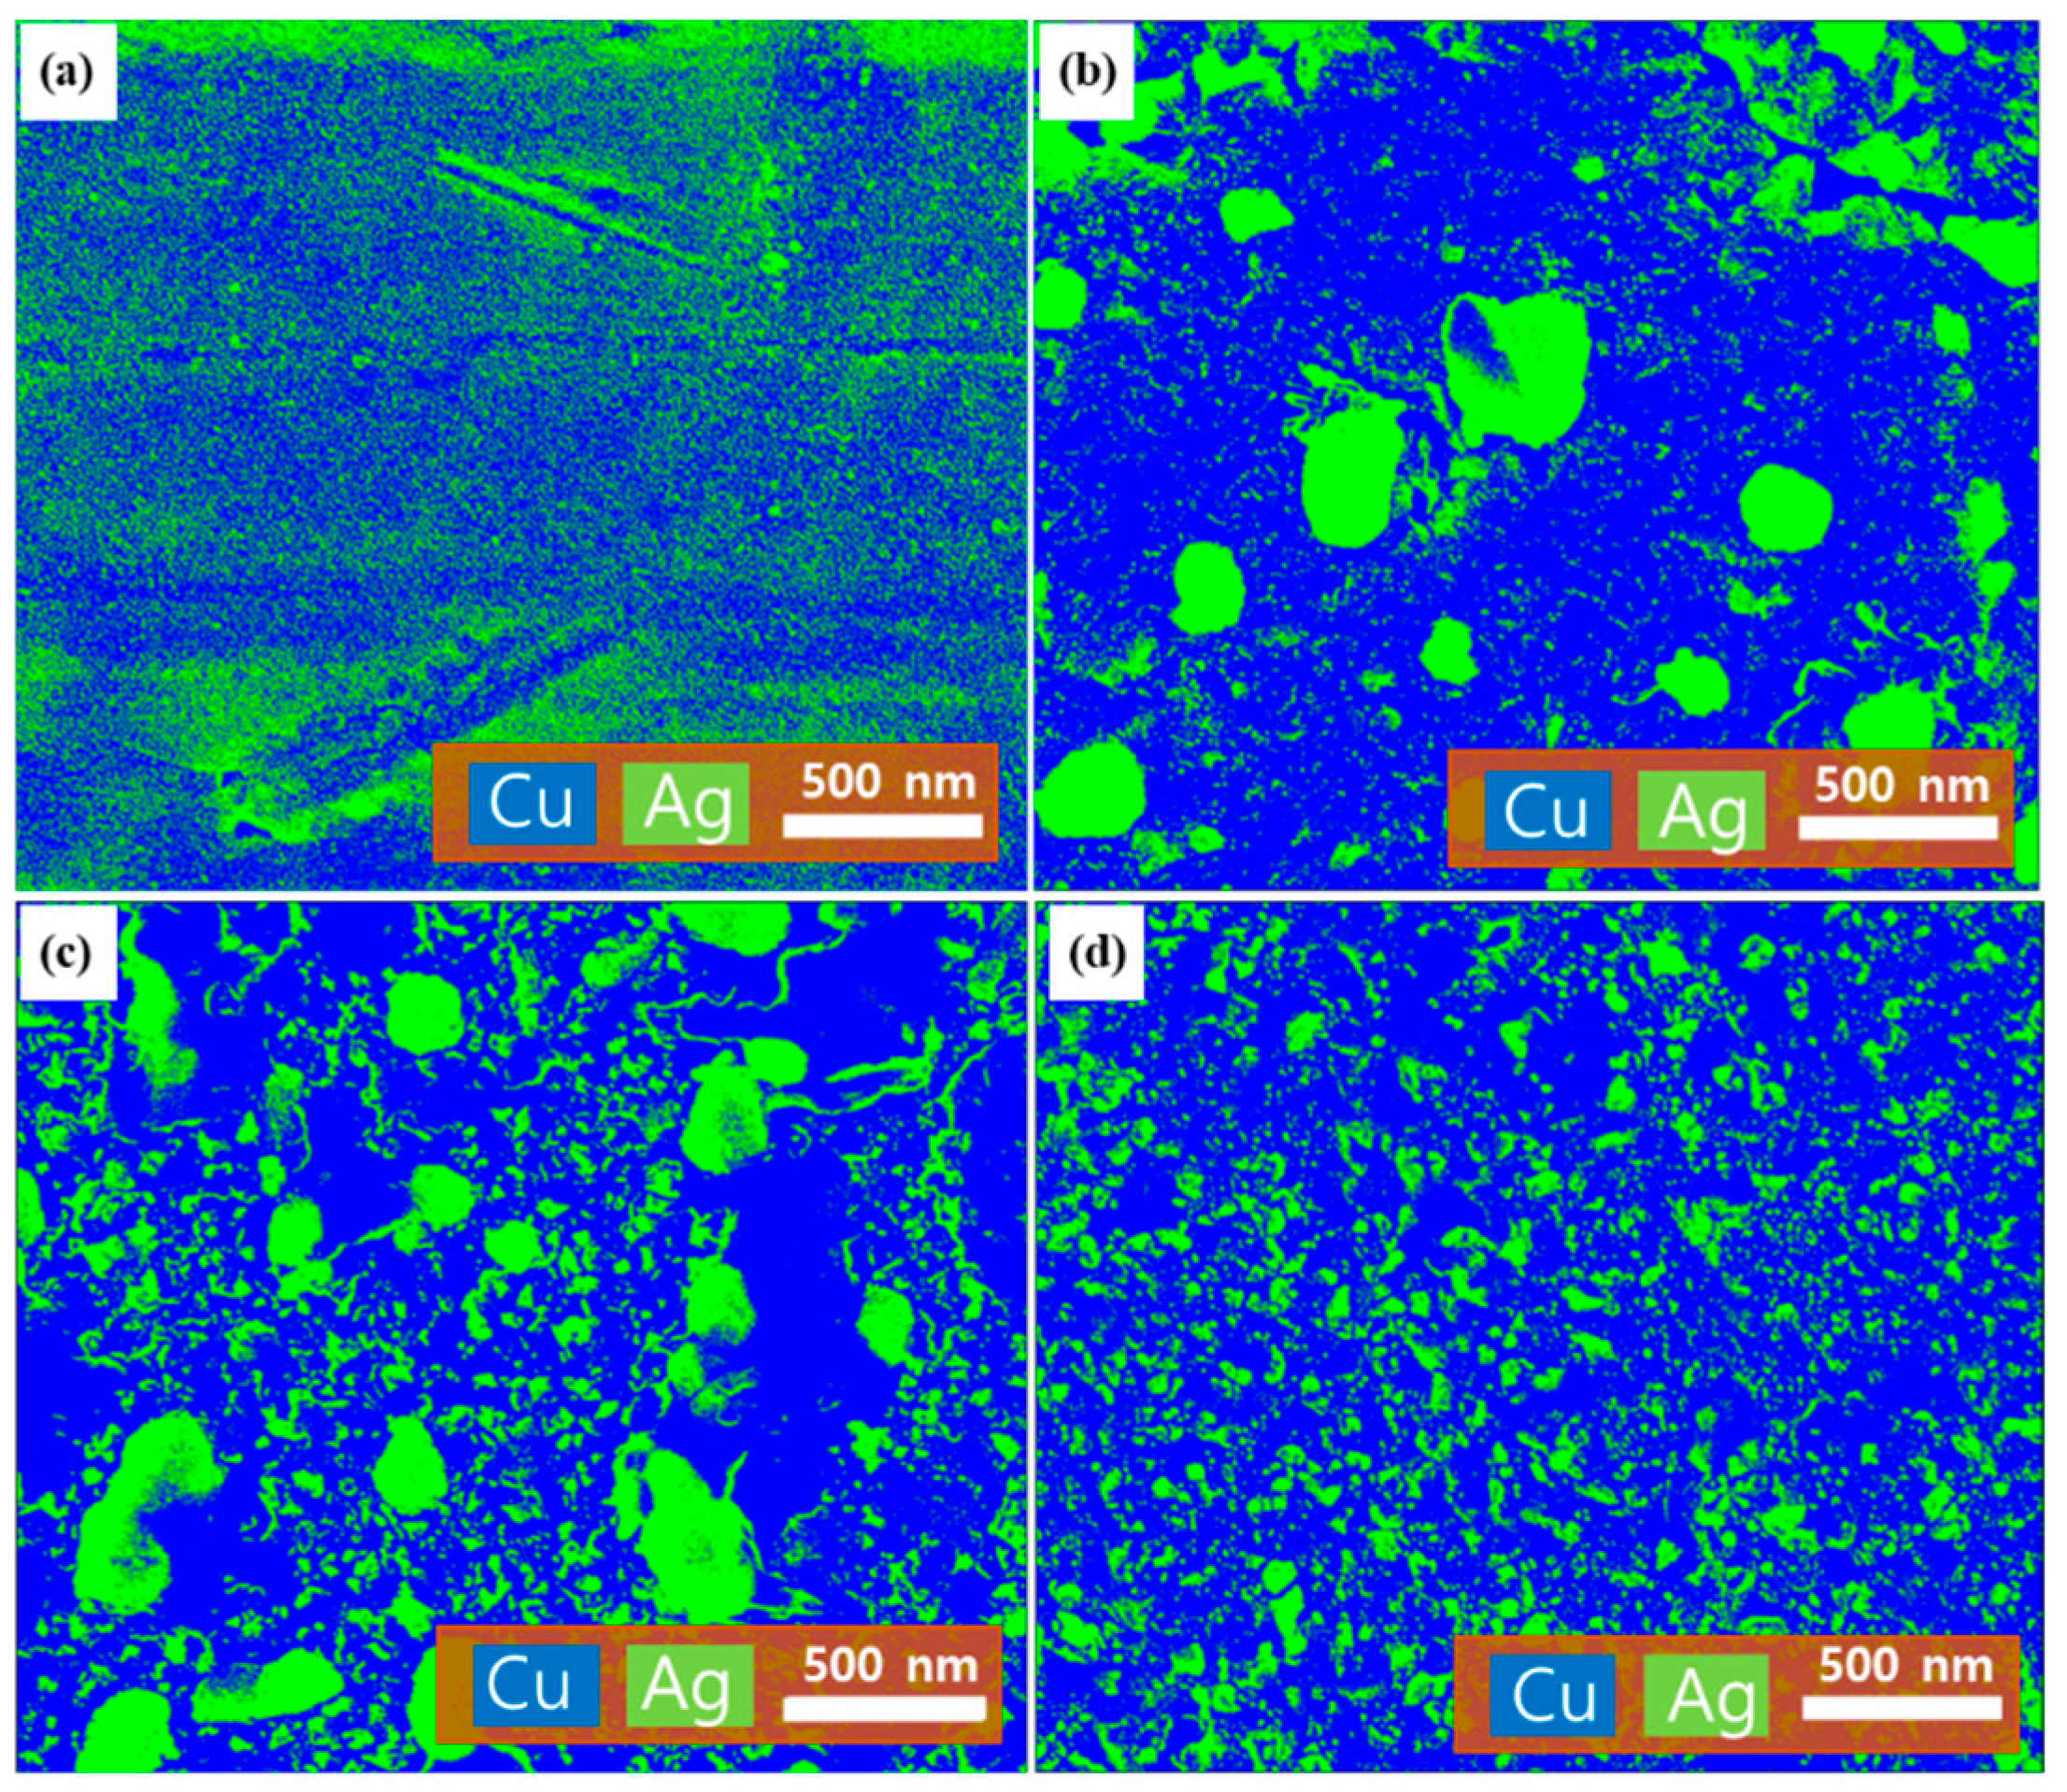
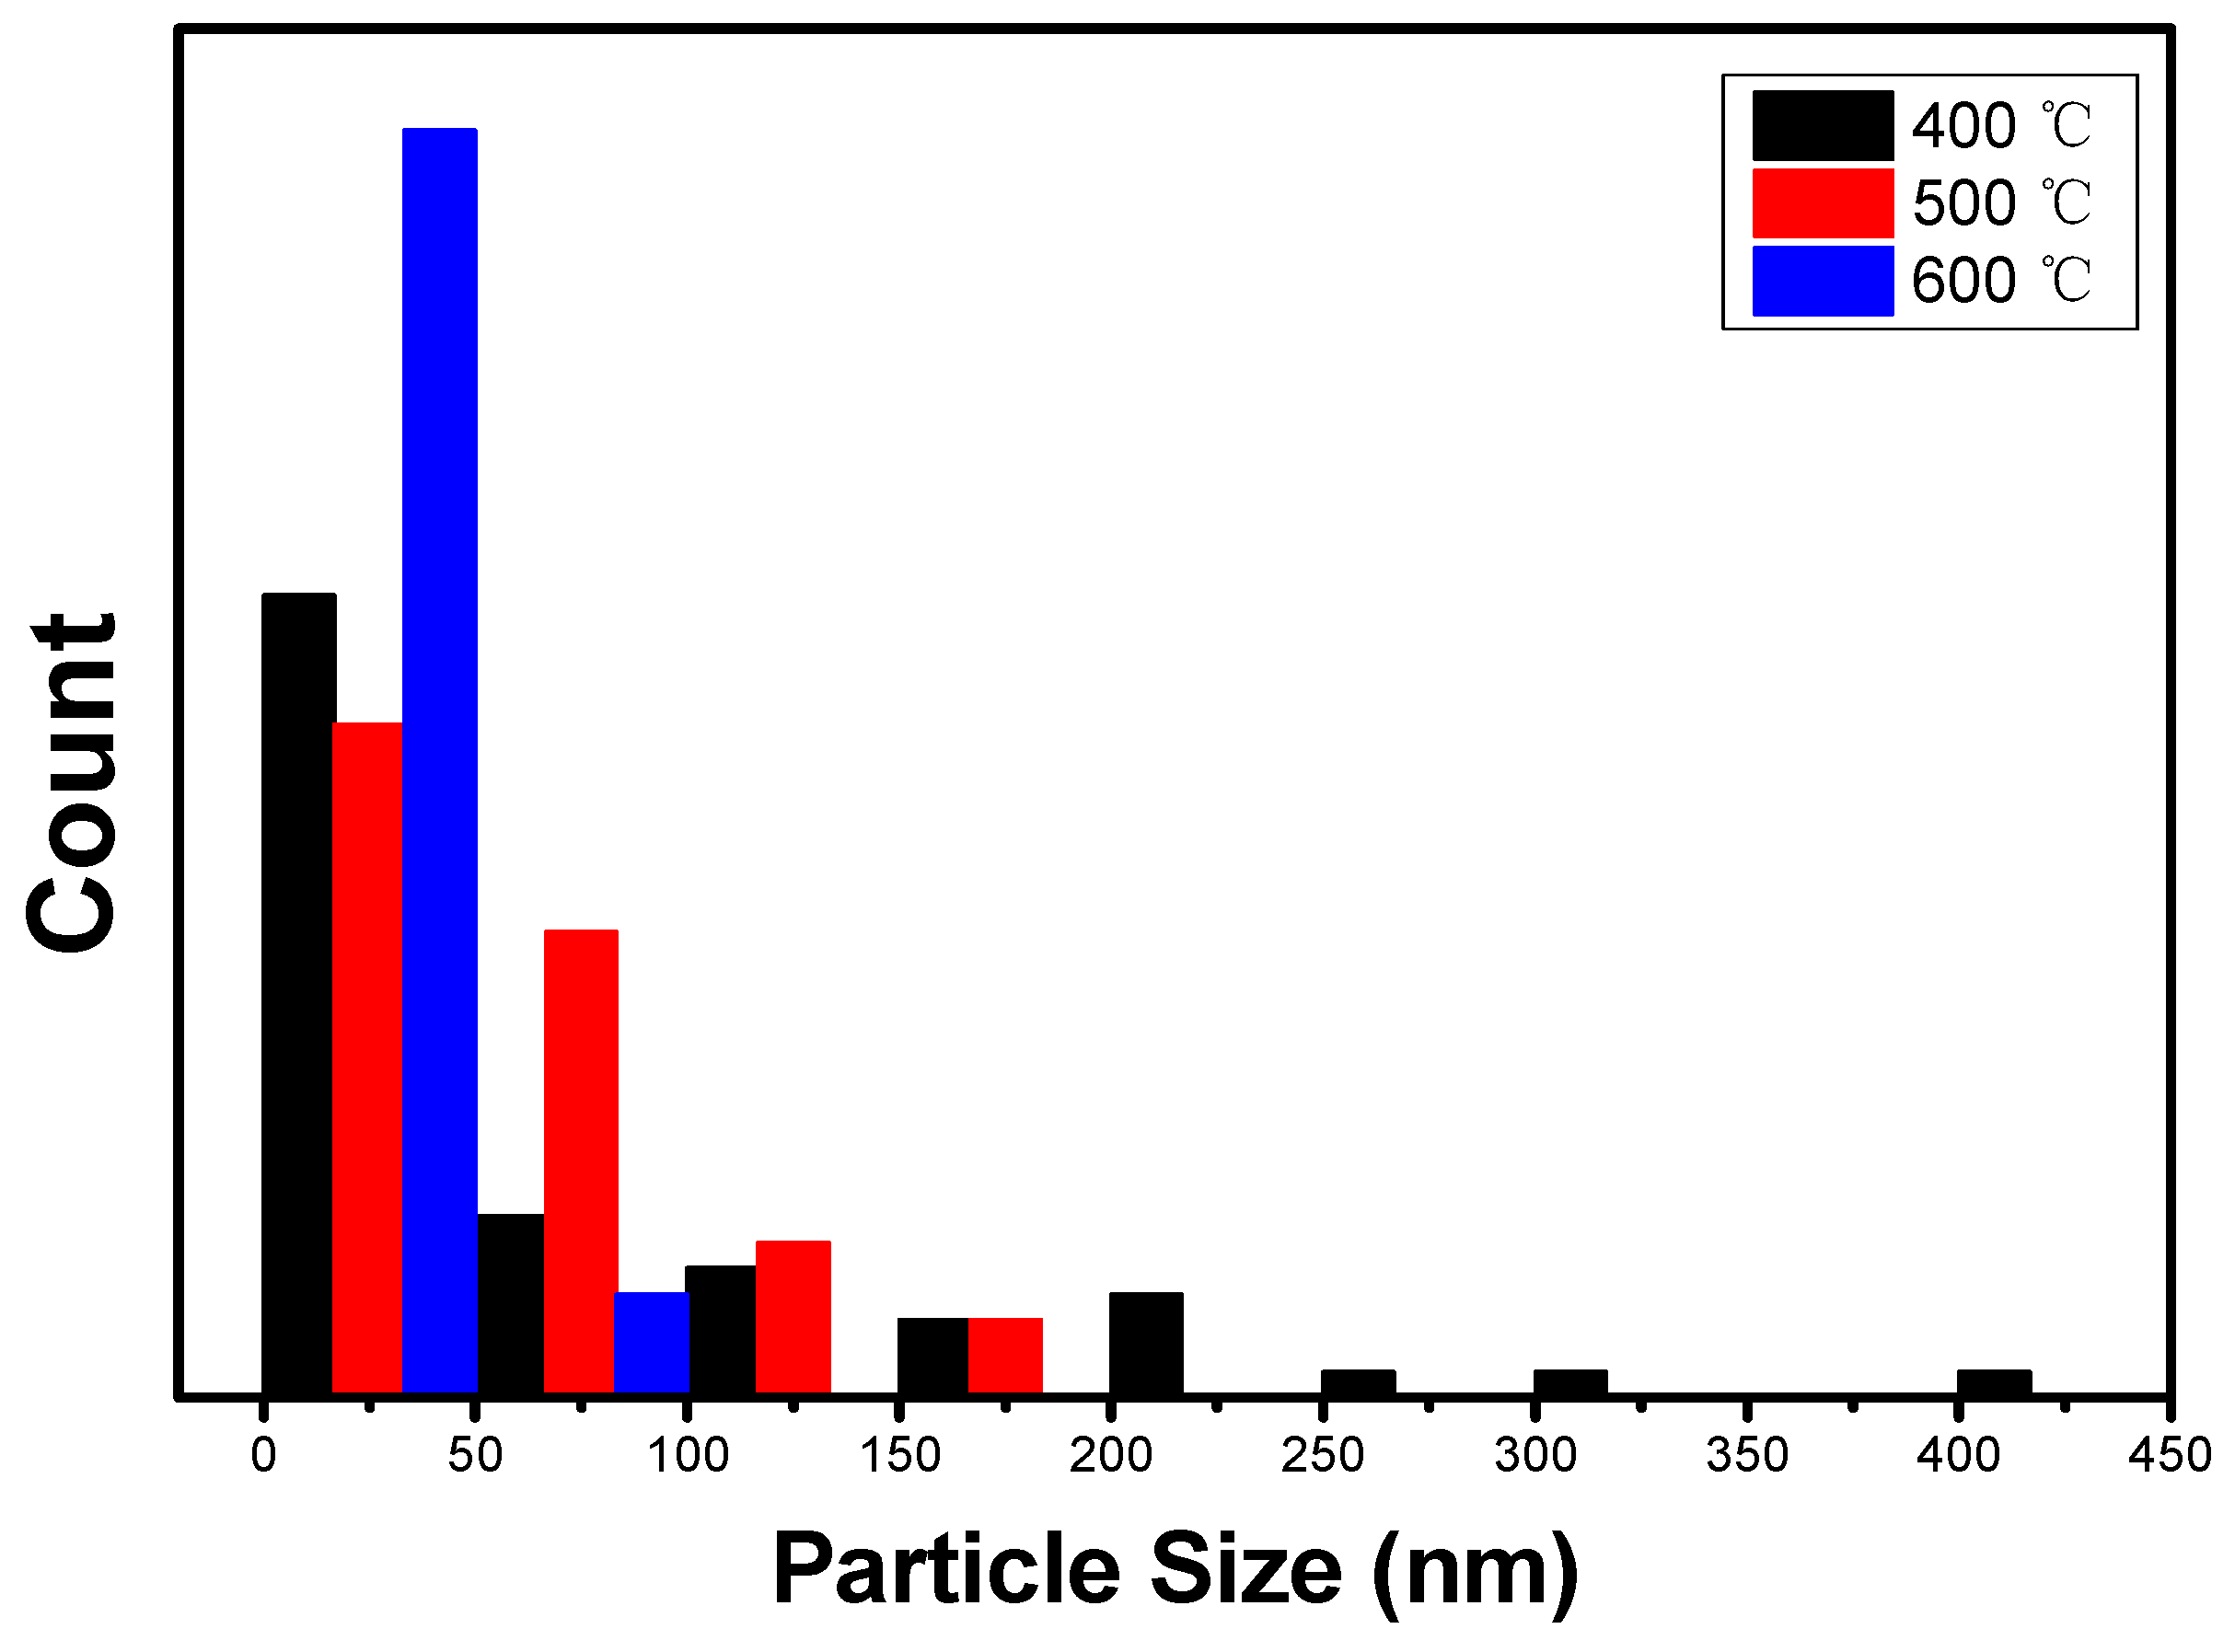
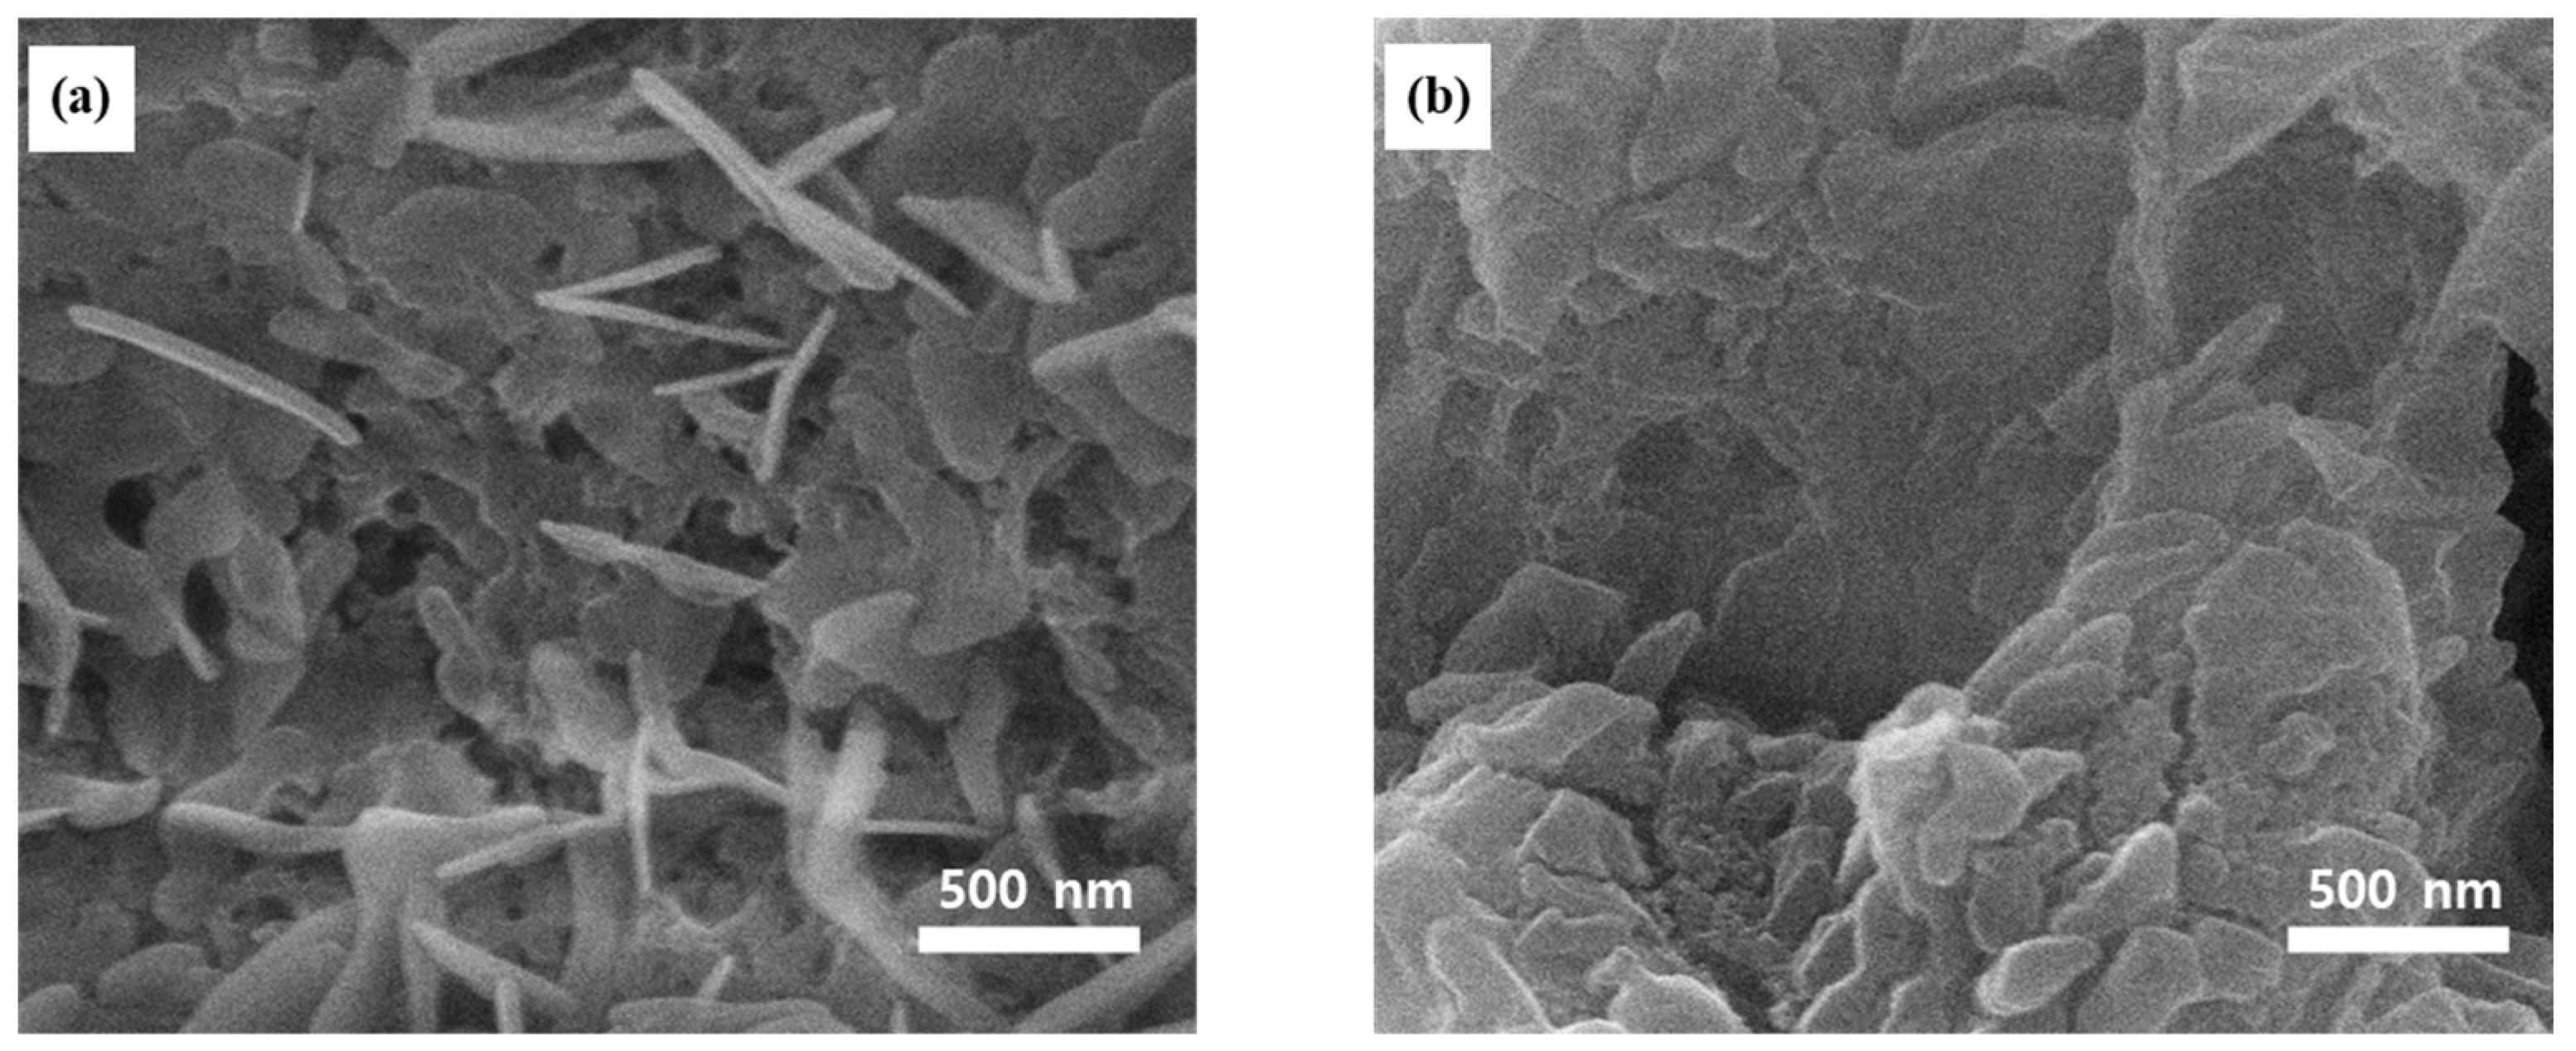
2.2. Surface Morphology and Elemental Composition Analyses of the Ag–Cu CCs under Different Annealing Conditions

Figure 3 shows the SEM images of the Cu collector surface, whereby the Ag–Cu film was deposited through co-sputtering. The bare Cu collector exhibits a clean surface, as shown in Figure 3a. The Ag–Cu CCs were nucleated through the well-known Volmer–Weber growth mode, in which thin metal films initially grow into stable islands after nucleation on the substrate (Figure 3b). Specifically, co-sputtering was conducted until the point where separate, round nuclei in island-like shapes formed simultaneously on the extensive substrate surface [26]. The observation of the annealed collectors revealed that small Ag particles were dissolved and redeposited on large particles as the heat treatment temperature was increased. Moreover, the increase in the heat treatment temperature through Ostwald ripening increased the receptivity of large Ag particles to small particles and increased the size (Figure 3c,d). In Figure 3c,d, the influence of Ostwald ripening can be observed, leading to the formation of Ag particles in island-like structures that continue to grow. Furthermore, in Figure 3d,e, it can be observed that the Ag particles remain fixed in island-like shapes without continuous growth. Moreover, the surface of the Ag–Cu CC obtained at 600 °C exhibits grains of the same size because the Cu diffusion rate increased from that at 500 °C, thereby inhibiting the growth of Ag particles. In contrast, at 600 °C, the diffusion coefficient of Cu increased, and the size of the Ag and Cu became similar [27]. Based on these observations, it is expected that by adjusting the heat treatment conditions, large Ag particles will be embedded and exist in the form of islands. Figure 4 shows the EDS mapping images of the CC subjected to different heat treatment conditions after the Ag–Cu deposition.
The Ag distribution according to different heat treatment conditions was confirmed. The surface of the Ag–Cu CC without heat treatment shows a uniform distribution of Ag nuclei grown through the Volmer–Weber growth mode (Figure 4a). In contrast, the surface of the Ag–Cu CC (400 °C) shows the distribution of aggregated Ag particles (Figure 4b). Although the agglomeration of Ag particles is observed on the surface of the Ag–Cu CC (500 °C), the agglomerated Ag particles are relatively small and widely distributed compared to those on the surface of the Ag–Cu CC (400 °C). These results indicate the temperature at which the diffusion rate of Cu atoms increases and begins to hinder the diffusion of Ag atoms. The Ag–Cu CC (600 °C) is expected to contain large Ag aggregates owing to Ostwald ripening; however, the diffusion rate of the Cu atoms further increases, thereby hindering the growth of the Ag nuclei. Accordingly, we can conclude that Ag aggregates of appropriate sizes are widely distributed on this CC (Figure 4d). In addition, the SEM surface image confirms the formation of particles with uniform sizes, and the surface roughness is relatively high as well (Figure 3e). These results indicate that metallization occurs between the heat treatment temperatures of 500 °C and 600 °C, and the Ag particles diffuse and become embedded in the Cu CC. The Ag–Cu CC Ag atoms at 600 °C were embedded and presented as islands that uniformly deliver the current density, improving the durability against volume change during charge/discharge cycles and cycle life. The Ag–Cu CC (600 °C) is expected to exhibit an improved cycle stability by dispersing the current density. The embedded Ag particles are expected to enhance the durability of the CC against volume changes during charge/discharge cycles. In addition, a Ag–Cu CC of a desired shape can be fabricated by adjusting the heat treatment temperature.
Figure 5 displays the Ag particle size distributions determined via image analysis at different annealing temperatures. The size distribution of the Ag atoms in the Ag–Cu CC (400 °C), containing Ag particles in the size range of 200–500 nm, is different from that in other CCs. Only a small number of Ag particles with sizes in the range of 50–150 nm are visible, whereas a large number of particles with sizes of ≤25 nm are present. The surface of the Ag–Cu CC (500 °C) shows that Ag particles with a size distribution in the range of 25–75 nm are dominant, whereas there are few particles with sizes of ≥150 nm. Conversely, the surface of the Ag–Cu CC (600 °C) primarily contains Ag particles with the size of ~50 nm without particles with sizes of >100 nm. This quantitative analysis confirms that the diffusion coefficient of the Cu atoms increases from a temperature ≥500 °C and hinders the diffusion of the Ag particles. Therefore, the size of the Ag particles does not increase even if the heat treatment temperature is increased. In other words, a Ag–Cu CC with the desired particle distribution can be realized by adjusting the heat treatment conditions, such as time, temperature, and pressure.

2.3. Evaluation of the Electrochemical Properties of LMAs

Figure 6 shows the overpotential measured at the current density of CC at 50 and 0.5 mAcm−2 for different heat treatment conditions after the deposition of bare Cu and Ag–Cu film. The nucleation overpotential and growth overpotential at the corresponding current densities are summarized in Table 2 and Table 3, respectively. At a current density of 50 µAcm−2, the Ag–Cu CC without heat treatment has the lowest nucleation overpotential. The nucleation overpotential of the heat-treated CCs is increased, and eventually, a sharp overpotential peak is observed, which can be attributed to the growth of the Ag atoms on the Cu surface. In this case, the nucleation overpotential is lower than that of Cu. However, the nucleation overpotential of the heat-treated CC is lower than those of the bare Cu and Ag–Cu CC without heat treatment. At a current density of 0.5 mAcm−2, the nucleation overpotential of the annealed CC is the lowest and similar to that of the unannealed Ag–Cu CC. These results suggest that the LMA with the CC annealed at 600 °C exhibits the best performance.
Figure 7 shows the Nyquist plots of the Ag–Cu CC (500 °C) and Ag–Cu (600 °C) after 50 cycles of Li plating/stripping at a current density of 1 mAcm−2 and fixed capacity of 1 mAcm−2. The resistance values calculated by fitting the equivalent circuit are summarized in Table 4. The SEI resistance (RSEI) of the Ag–Cu CC (500 °C) and Ag–Cu CC (600 °C) are 67.16 and 51.07 Ωcm−2, respectively, confirming a further decrease in the RSEI of the Ag–Cu CC (600 °C). Further, the charge transfer resistance (Rct) of the Ag–Cu CC (600 °C) is significantly reduced, indicating that the Ag–Cu CC (600 °C) surface is more favorable for electrodeposition.

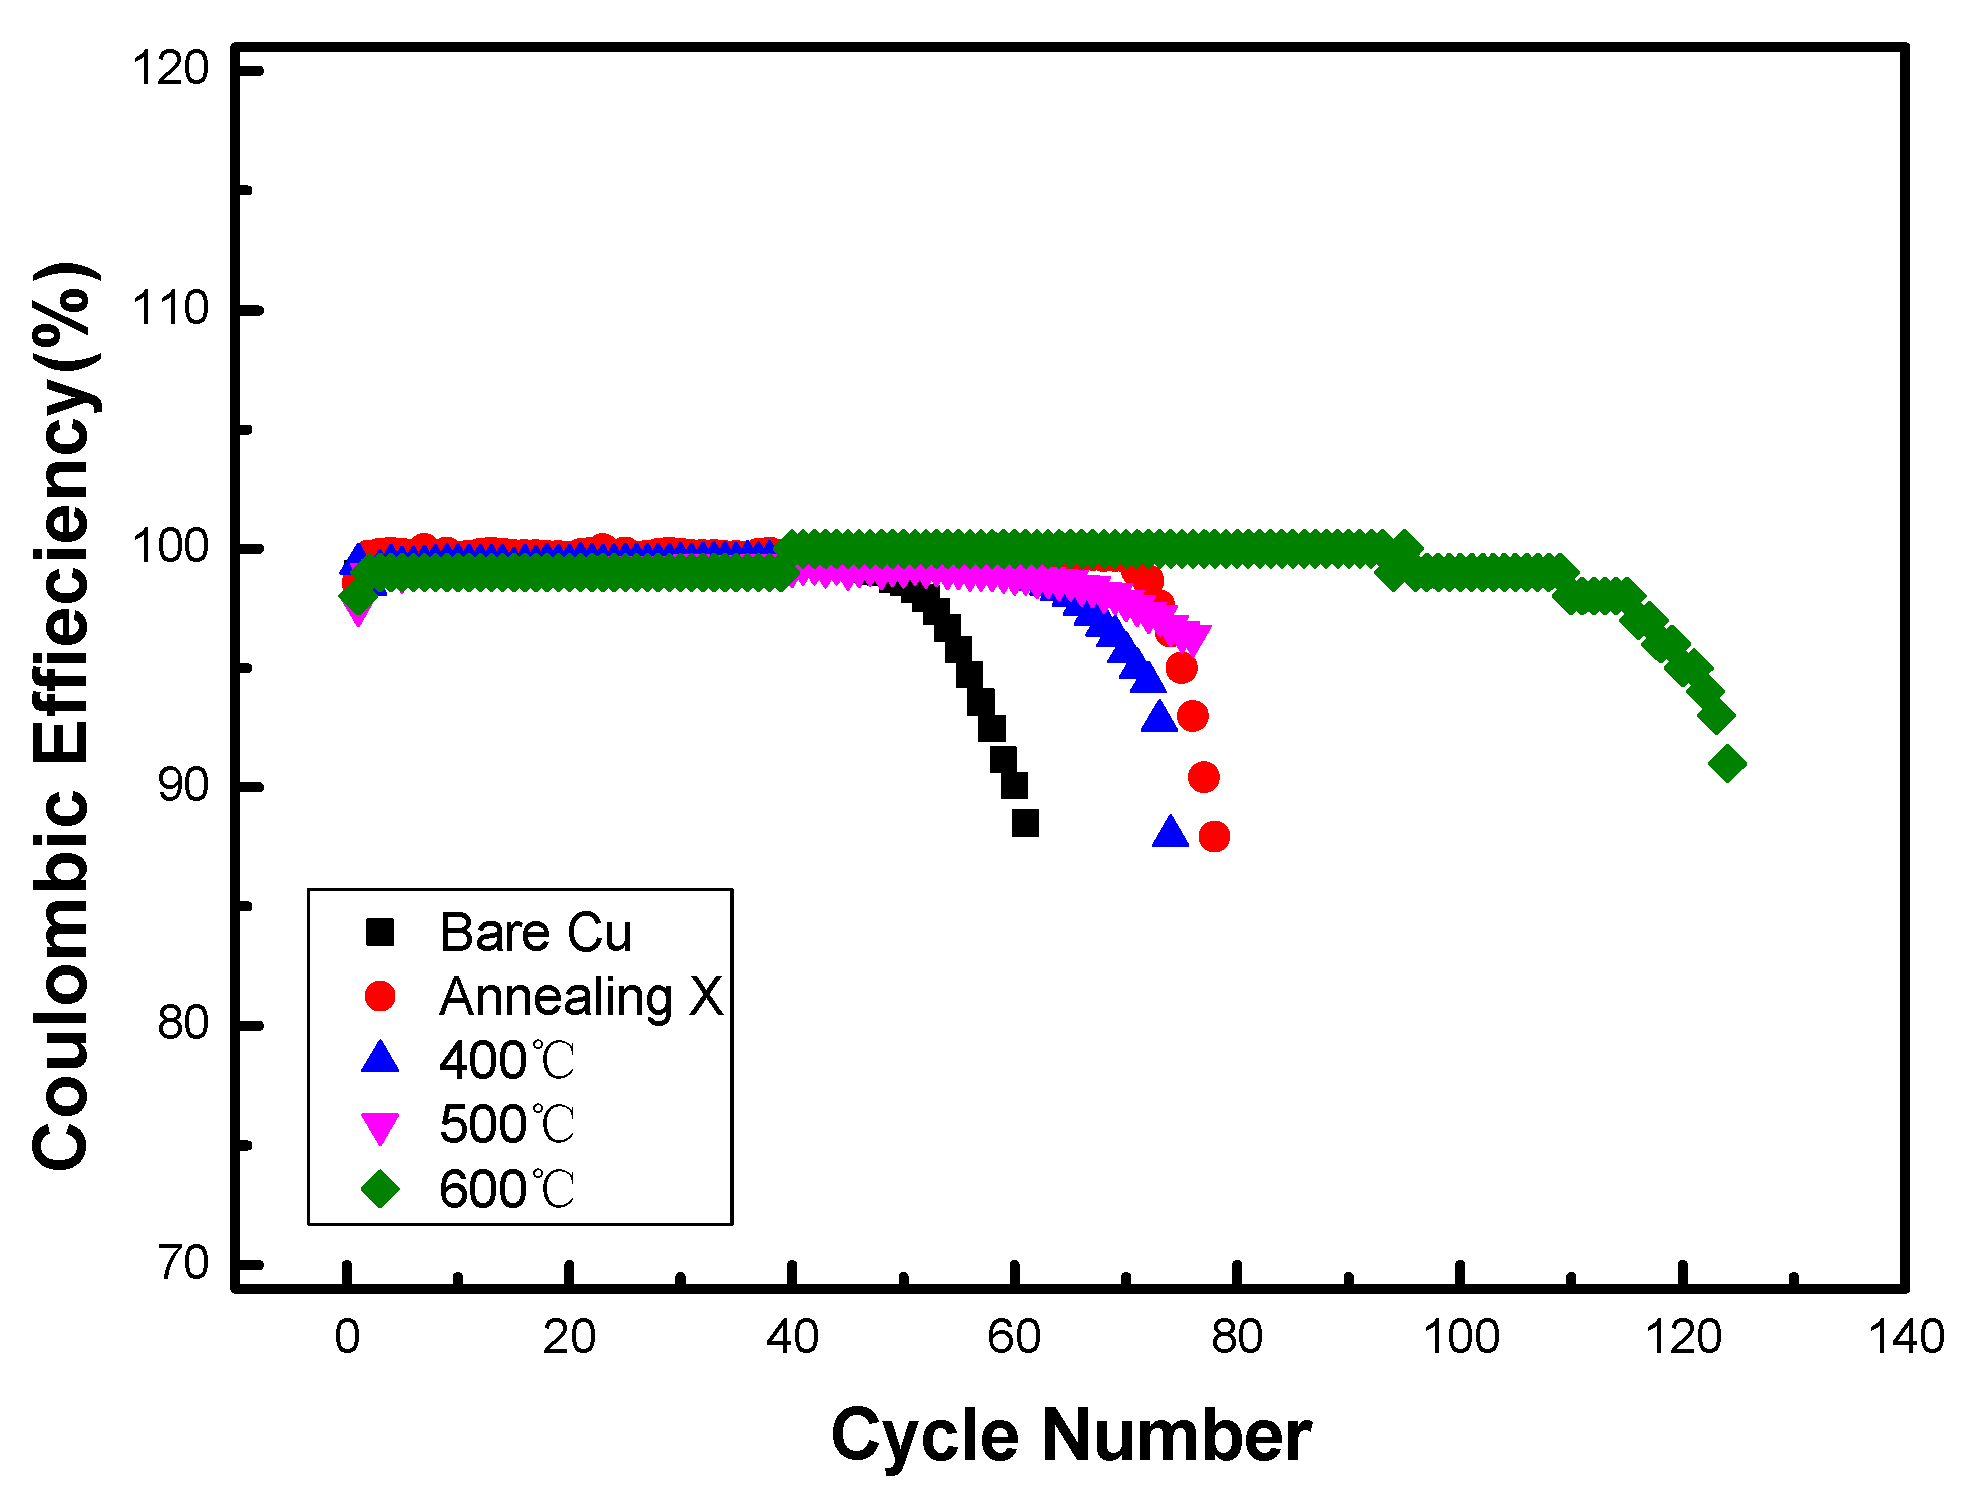
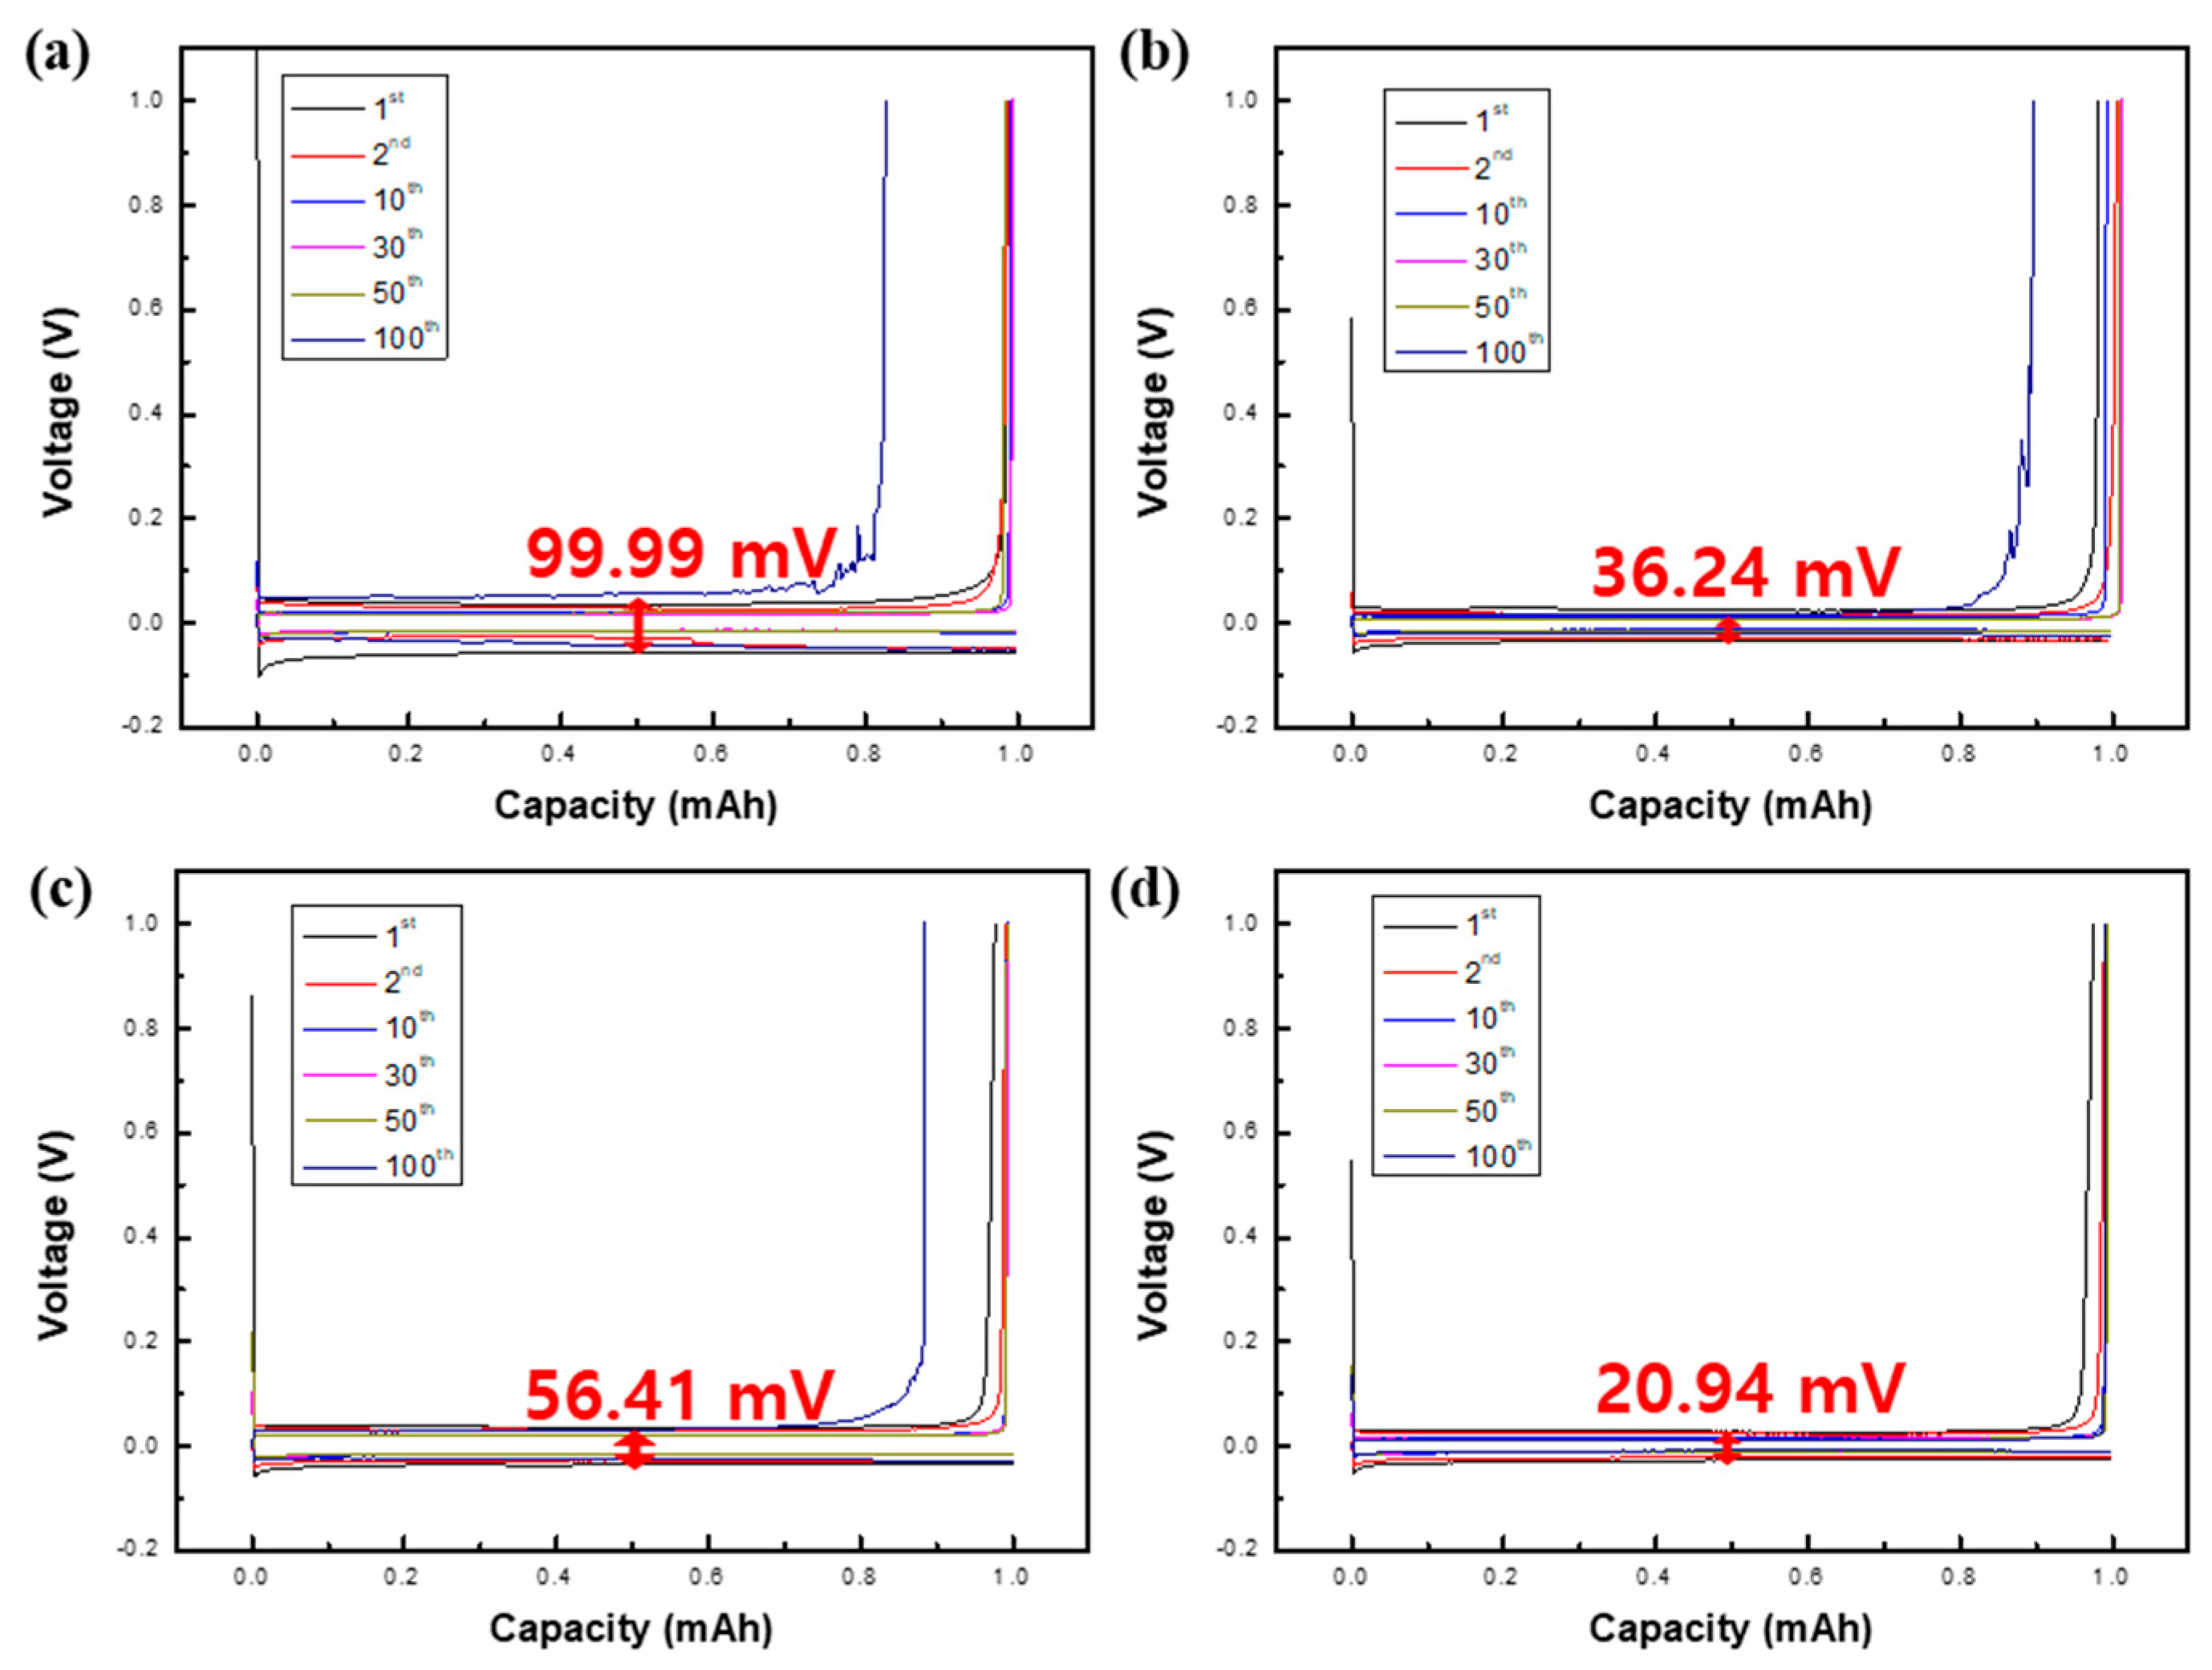
2.4. Evaluation of the Cycling Performance of LMA

Figure 8 presents the change in CE during the Li plating/stripping cycle at a fixed capacity of 1 mAhcm−2 and current density of 0.5 mAcm−2. The bare Cu CC maintained more than 98.5% of its initial CE for 50 cycles. In contrast, the Ag–Cu CC without heat treatment maintained more than 98.5% of its CE for 72 cycles, whereas the Ag–Cu CCs heat-treated at 400, 500, and 600 °C maintained >98.5% of the initial CE for 63, 66, and 110 cycles, respectively. Only the CC heat-treated at 600 °C maintained its initial CE for more than 100 cycles. This result is consistent with our expectation of cycling performance improvement upon Ag metallization and embedding. The heat treatment with Ag metallization and embedding into the Cu CC is anticipated to confer resistance to the volume expansion of Ag during charge–discharge cycles, improving the cycle performance. Although this study was conducted using a half-cell configuration, better cycle performance and CE can be achieved in full-cell configurations because they involve using cathode materials, instead of Li metal, allowing for better control of the relevant subreactions. The voltage profiles of the bare Cu, Ag–Cu film, Ag–Cu (500 °C), and Ag–Cu (600 °C) CCs obtained during the Li plating/stripping cycle at a fixed capacity of 1 mAhcm−2 and current density of 0.5 mAcm−2 are shown in Figure 9.
The voltage profile of each cell exhibits stable polarization up to the 50th cycle with Li plating/stripping. As shown in Figure 8, the capacity of bare Cu CC decreases after 50 cycles. An unstable polarization of 99.99 mV at 100 cycles can be observed in Figure 9a. The capacities of the Ag–Cu and Ag–Cu (500 °C) CCs also decrease at the 72nd and 66th cycles, respectively, as shown in Figure 8. Furthermore, the polarization of 36.24 and 56.41 mV can be observed at the 100th cycle in Figure 9b,c, respectively. However, the Ag–Cu (600 °C) CC shows a relatively low polarization of 20.94 mV without capacity reduction until the 100th cycle. These results suggest that the cycle performance can be improved by forming homogeneous Ag and Cu particles under appropriate heat treatment conditions during their embedding and metallization.
Figure 10 shows the SEM images of the surface of the Li-deposited collectors after 100 cycles. As shown in Figure 10a, the Li dendrites deposited on the exposed Cu surface were formed after 100 cycles. Figure 10b depicts the relative of absence of dendrites for Li deposited on the surface of the Ag–Cu CC (600 °C) after 100 cycles compared to Li deposited on the surface of Cu CC. These results depict the stable nucleation and growth of the Ag–Cu CC (600 °C) during Li plating, suppressing the side reactions during cycling to improve the cycle performance.

3. Materials and Methods

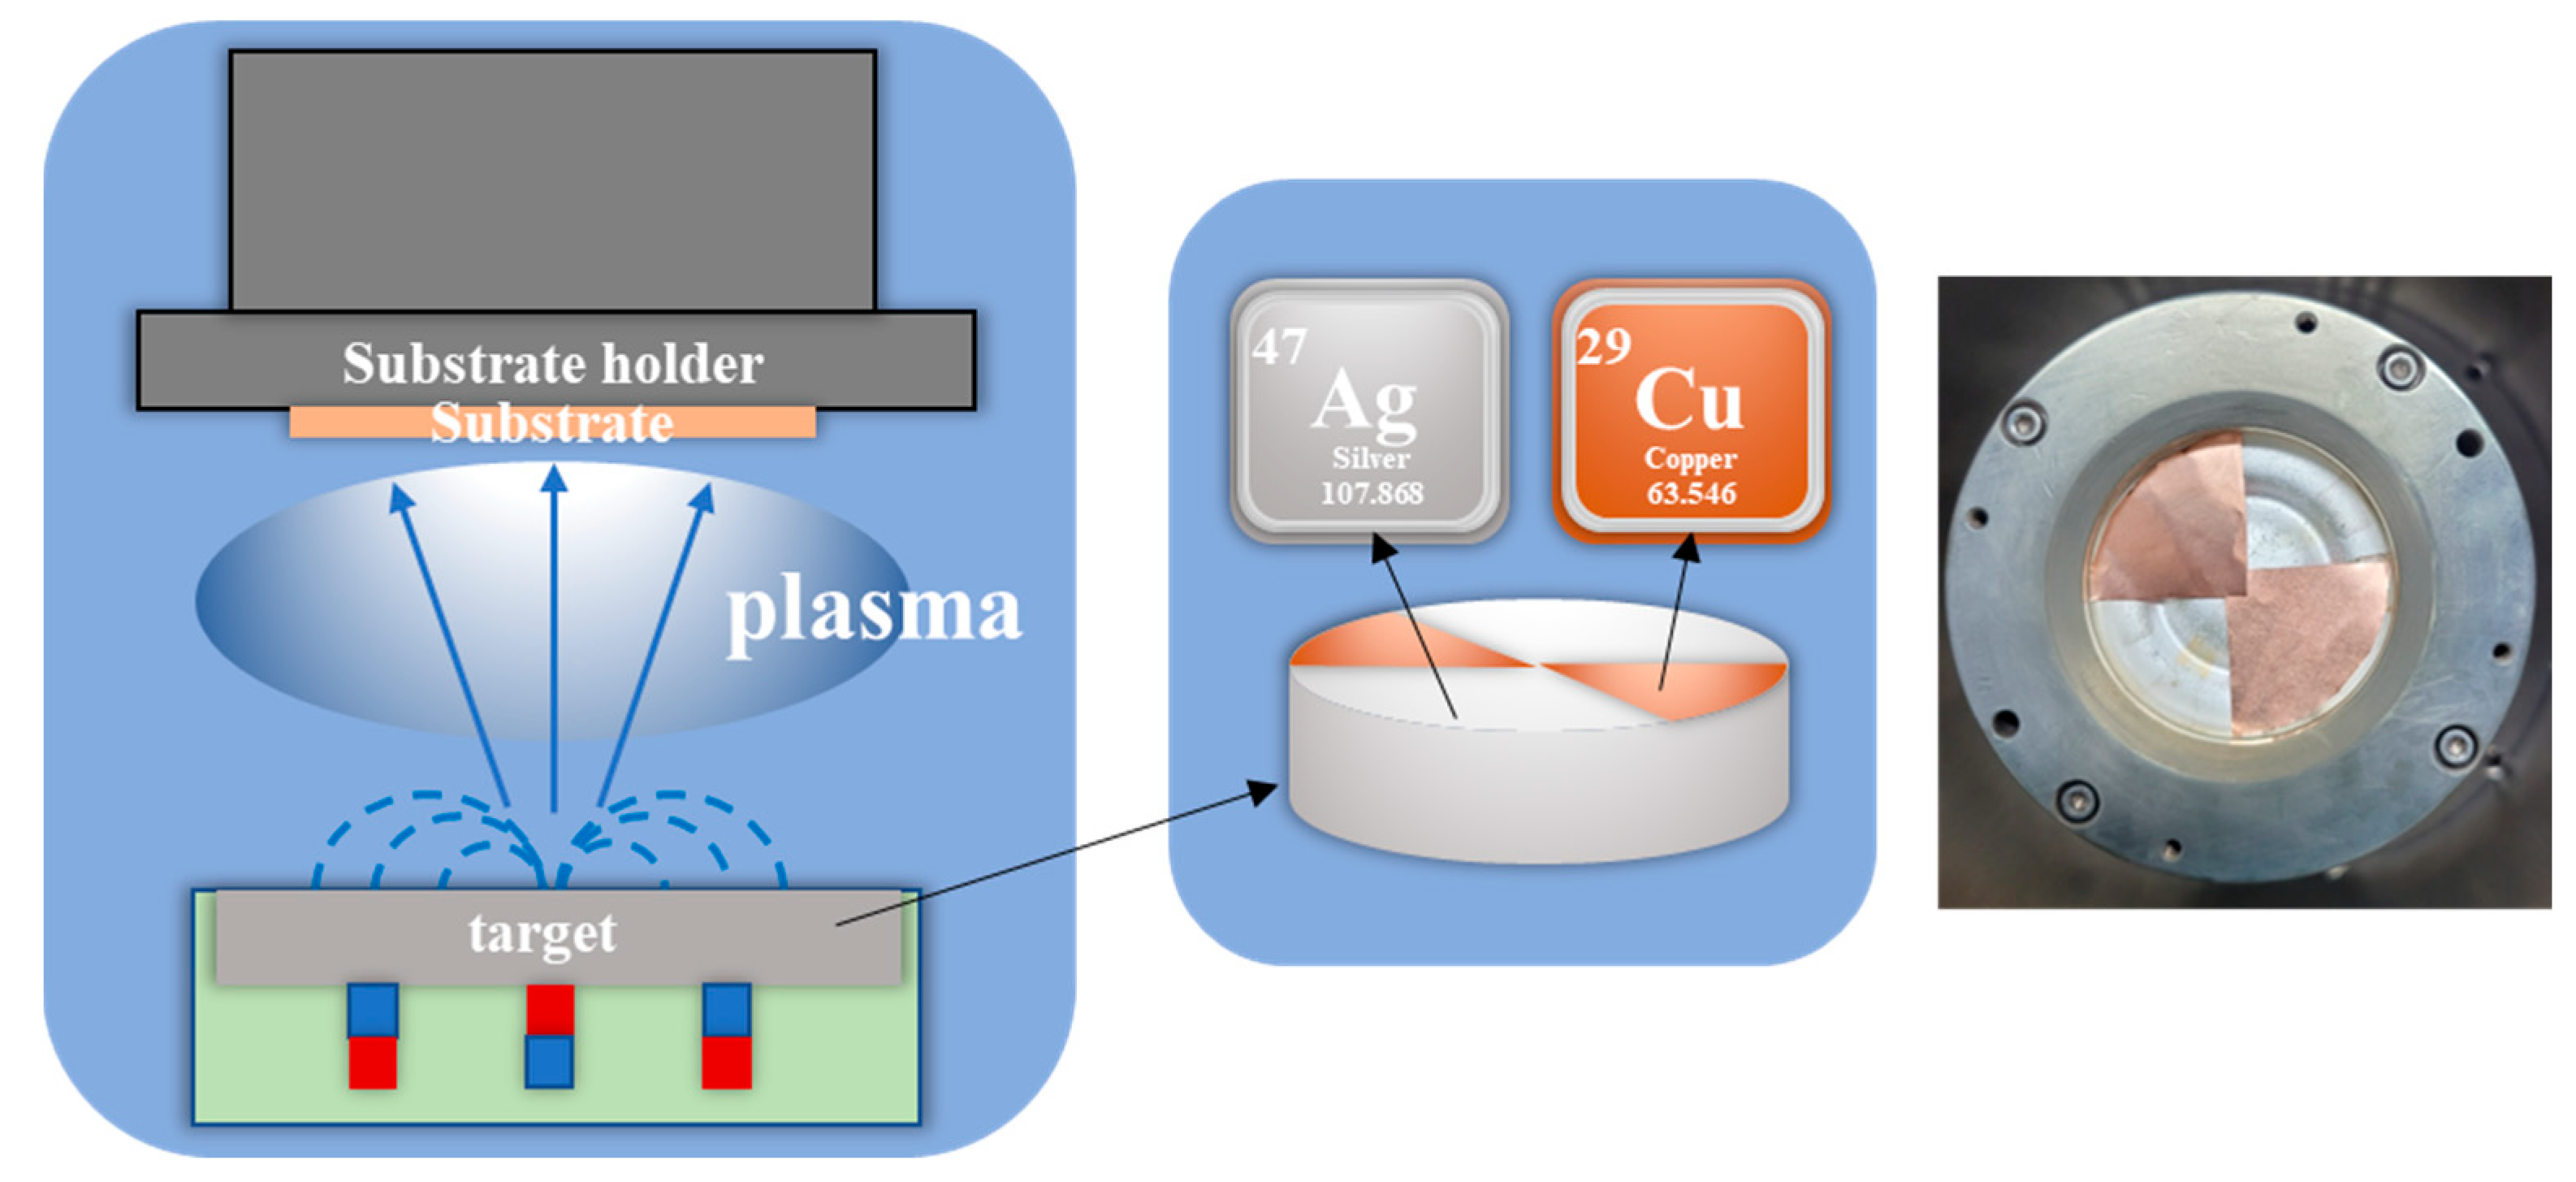
3.1. Fabrication of Ag–Cu CCs

In this study, co-sputtering was performed using a magnetron DC-sputter system (DC-Sputter, BLS, Pyeongtaek-si, Gyeonggi-do, Korea). To achieve Ag area ratios of 62.5%, 75%, and 100%, Cu foil pieces were precisely cut to match the desired area ratios and placed on the Ag circular target (99.99%, VTM, Incheon, Korea), followed by co-deposition. To remove surface oxide layers and impurities prior to the co-deposition of lithiophilic Ag and Cu, a diluted HCl solution (10 mL HCl and 100 mL DI water) was used for acid treatment, and the treatment was carried out for 10 min. Subsequently, a cleaning process was performed in 100 mL acetone for 10 min. After the pickling process, the Cu foil (thickness of 18 µm) was used as the substrate for the deposition [25]. The pressure in the sputter chamber was increased to 1 × 10⁻⁵ Torr, and Ar gas was injected at 10 sccm and 0.15 Torr for 30 s with a power of 40 W. After the completion of co-deposition of Ag-Cu, the as-deposited CC (copper-clad) samples were annealed under a 4% H2/96% Ar atmosphere in a furnace (PyroTech, Namyangju-si, Gyeonggi-do, Korea) at temperatures of 400 °C, 500 °C, and 600 °C, respectively. The heating rate was set to 5 °C/min, and a mixed gas flow of 20 SCCM was maintained until the end of the process. Subsequently, the samples were cooled to room temperature in the furnace after reaching the desired processing temperature.

3.2. Characterization of the Ag–Cu CCs

To analyze the crystal structure and elemental composition of the co-deposited Ag–Cu film, we used an X-ray diffractometer (D2 PHASER, Bruker, MA, USA). For the scan, a copper (Cu) tube with a wavelength (λ) of 1.54184 Å was used, allowing us to scan the sample meticulously at a steady pace of 1 degree per minute within the scattering angle range of 20° to 80° (2θ).
The surface characteristics and morphology of the Ag–Cu collectors were thoroughly scrutinized under vacuum conditions using an advanced high-resolution field-emission scanning electron microscope (SEM, Nova NanoSEM 450, FEI, Hillsboro, OR, USA). Furthermore, to ascertain the distribution of elements on the Ag–Cu collector surface, we conducted energy-dispersive spectroscopy (EDS) analysis. This technique enabled us to precisely map the distribution of silver (Ag) and copper (Cu) elements on the collectors.
Additionally, we carried out image analysis using Image-J (NIH, Bethesda, MD, USA). This image analysis was a crucial step in ensuring the visibility and comprehensive understanding of the spatial arrangement of Ag and Cu atoms distributed across the surface.
To evaluate the effects of annealing on the film, we measured the electrical resistivity of the co-deposited film on a glass substrate using a highly accurate four-point-probe surface resistivity meter (CMT-SR1000N, AIT, Suwon-si, Gyeonggi-do, Korea). These comprehensive analyses collectively served to verify the effects of the annealing process.

3.3. Electrochemical Measurements

To conduct electrochemical experiments on the Ag–Cu CCs (Ag-Cu film thickness 100 nm, weight 0.0001 g), a CR2032-type coin cell was assembled within a glove box, meticulously maintaining oxygen and water contents at levels below 1 ppm. The Ag-Cu CCs were cut into a diameter of 13mm for conducting electrochemical and charge–discharge experiments. This setup was crucial to ensure precise control of the experimental environment.
The half-cell configuration included the custom-fabricated Ag–Cu CCs (C1100, Wellcos Corporation, Gunpo-si, Gyeonggi-do, Korea) serving as the working electrode, a lithium (Li) metal disk as the counter electrode, and a polypropylene film (2400, Wellcos Corporation, Gunpo-si, Gyeonggi-do, Korea) as the separator. Each component played a specific role in the electrochemical experiment.
In addition, the electrolyte used was a solution of 1 M lithium bis(trifluoromethanesulfonyl)imide (LiTFSI, 99.5%, Lees Chem International, Incheon, Korea) dissolved in a 1:1 molar mixture of 1,3-diolsolane (Sigma Aldrich, Seoul, Korea) and 1,2-dimethoxyethane (DME, Sigma Aldrich, Seoul, Korea). As an electrolyte additive, 4.5 wt% lithium nitrate (LiNO3, Alfa Aesar, Seoul, Korea) was introduced to enhance the electrochemical performance of the system.
Before commencing the electrochemical measurements, it was essential to stabilize the solid–electrolyte interphase (SEI) layers. These SEI layers were achieved through pre-cycling each coin cell by running charge and discharge cycles from 0 to 1 V at a fixed current density of 50 µAcm−2.
The electrochemical cycling experiments were carried out using a battery charge and discharge tester (WBCS 3000 Cycler, WonATech, Seoul, Korea), ensuring precise control over the electrochemical processes. The efficiency of the electrodeposition process of the lithium metal anode (LMA) was assessed by conducting constant-current plating of lithium at a fixed capacity of 1 mAhcm−2 and then stripping the lithium at a current density of 0.5 mAhcm−2 up to a cut-off voltage of 1 V. The Coulombic efficiency (CE) was calculated by dividing the stripping capacity by the plating capacity. Impedance measurements were performed over a frequency range from 100 Hz to 100 kHz with a voltage amplitude of 5 mV using electrochemical impedance spectroscopy (EIS) equipment (VersaSTAT 3, Princeton Applied Research, Oak Ridge, TN, USA). These impedance measurements provided valuable information about the system’s electrochemical behavior.

4. Conclusions

In this study, Ag–Cu was co-sputtered on a bare Cu collector and heat-treated to develop a stable LMA CC. Homogeneous Ag–Cu nuclei were produced and grown on the surface of the collector heat-treated at 600 °C, and Ag atoms were embedded and metalized. The fabricated collectors provided nucleation sites and distributed the current density, enabling a dendrite-free Li nucleation in the LMA. Furthermore, the cycle performance was improved because the unstable Ag atoms were immobilized as the cycle progressed. Ag–Cu (600 °C) CC significantly reduced the nucleation and growth overpotentials and the electrochemical impedance, thereby stabilizing the nucleation during the Li deposition cycle. Owing to the cycling performance, a high CE of over 99% was obtained for 100 cycles of Li plating/stripping with a fixed capacity of 1 mAhcm−2 at a current density of 0.5 mAcm−2. The voltage profile exhibited a stable polarization of 20.94 mV after 100 cycles. In contrast, the bare Cu CC could maintain 99% of its CE for 50 cycles, and the polarization was relatively high at 99.99 mV after 100 cycles.
The results indicate that a lithiophilic collector with a homogeneous distribution and immobilization of Ag and Cu atoms can be developed through the co-deposition of Ag and Cu on a Cu collector followed by heat treatment. This method can effectively improve the cycling performance.

Author Contributions

Conceptualization, S.G.K.; methodology, S.G.K., J.K. and D.H.K.; validation, C.-B.Y. and B.J.K.; investigation, S.G.K.; writing—original draft preparation, S.G.K. and D.H.K.; writing—review and editing, H.L., S.G.K. and C.-B.Y. All authors have read and agreed to the published version of the manuscript.

Funding

This work was supported by the Technology Innovation Program (RS-2023-00243593, Development of Oxide Based Solid Electrolytes anode materials/electrode) funded by the Ministry of Trade, Industry & Energy (MOTIE, Korea).

Data Availability Statement

The data that support the findings of this study are available from the corresponding author upon reasonable request.

Conflicts of Interest

The authors declare no conflict of interest.

References

  1. Zubi, G.; Dufo-Lopez, R.; Carvalho, M.; Pasaoglu, G. The lithium-ion battery: State of the art and future perspectives. Renew. Sustain. Energy Rev. 2018, 89, 292–308. [Google Scholar] [CrossRef]
  2. Jun, M.; Bingbing, C.; Longlong, W.; Guanglei, C. Progress and prospect on effects of potassium substitution failure mechanisms of solid-state lithium batteries. J. Power Source 2018, 392, 94–115. [Google Scholar]
  3. Yang-kook, S. Promising all-solid-state batteries for future electric vehicles. ACS Energy Lett. 2020, 5, 3221–3223. [Google Scholar]
  4. Liu, B.; Zhang, J.G.; Xu, W. Advancing lithium metal batteries. Joule 2018, 2, 833–845. [Google Scholar] [CrossRef]
  5. Lin, D.; Liu, Y.; Cui, Y. Reviving the lithium metal anode for high-energy batteries. Nat. Nanotechnol. 2017, 12, 194–206. [Google Scholar] [CrossRef] [PubMed]
  6. Cheng, X.B.; Zhang, R.; Zhao, C.Z.; Zhang, Q. Toward safe lithium metal anode in rechargeable batteries: A review. Chem. Rev. 2017, 117, 10403–10473. [Google Scholar] [CrossRef] [PubMed]
  7. Zhang, R.; Chen, X.R.; Chen, X.; Cheng, X.B.; Zhang, X.Q.; Yan, C.; Zhang, Q. Lithiophilic sites in doped graphene guide uniform lithium nucleation for dendrite-free lithium metal anodes. Angew. Chem. 2017, 129, 7872–7876. [Google Scholar] [CrossRef]
  8. Liu, J.; Bao, Z.; Cui, Y.; Dufek, E.J.; Goodenough, J.B.; Khalifah, P.; Li, Q.; Liaw, B.Y.; Liu, P.; Manthiram, A.; et al. Pathways for practical high-energy long-cycling lithium metal batteries. Nat. Energy 2019, 4, 180–186. [Google Scholar] [CrossRef]
  9. Xu, W.; Wang, J.; Ding, F.; Chen, X.; Nasybulin, E.; Zhang, Y.; Zhang, J.G. Lithium metal anodes for rechargeable batteries. Energy Environ. Sci. 2014, 7, 513–537. [Google Scholar] [CrossRef]
  10. Fang, C.; Wang, X.; Meng, Y.S. Key issues hindering a practical lithium-metal anode. Trends Chem. 2019, 1, 152–158. [Google Scholar] [CrossRef]
  11. Li, X.; Yang, G.; Zhang, S.; Wang, Z.; Chen, L. Improved lithium deposition on silver plated carbon fiber paper. Nano Energy 2019, 66, 104144. [Google Scholar] [CrossRef]
  12. Li, H. Practical evaluation of Li-ion batteries. Joule 2019, 3, 911–914. [Google Scholar] [CrossRef]
  13. Liu, K.; Liu, Y.; Lin, D.; Pei, A.; Cui, Y. Materials for lithium-ion battery safety. Sci. Adv. 2018, 4, eaas9820. [Google Scholar] [CrossRef] [PubMed]
  14. Lai, X.; Jin, C.; Yi, W.; Han, X.; Feng, X.; Zheng, Y.; Ouyang, M. Mechanism, modeling, detection, and prevention of the internal short circuit in lithium-ion batteries: Recent advances and perspectives. Energy Storage Mater. 2021, 35, 470–499. [Google Scholar] [CrossRef]
  15. Qian, J.; Adams, B.D.; Zheng, J.; Xu, W.; Henderson, W.A.; Wang, J.; Bowden, M.E.; Xu, S.; Hu, J.; Zhang, J.G. Anode-free rechargeable lithium metal batteries. Adv. Funct. Mater. 2016, 26, 7094–7102. [Google Scholar] [CrossRef]
  16. Pei, A.; Zheng, G.; Shi, F.; Li, Y.; Cui, Y. Nanoscale nucleation and growth of electrodeposited lithium metal. Nano Lett. 2017, 17, 1132–1139. [Google Scholar] [CrossRef]
  17. Thirumalraj, B.; Hagos, T.T.; Huang, C.J.; Teshager, M.A.; Cheng, J.H.; Su, W.N.; Hwang, B.J. Nucleation and growth mechanism of lithium metal electroplating. J. Am. Chem. Soc. 2019, 141, 18612–18623. [Google Scholar] [CrossRef]
  18. Wang, S.H.; Yue, J.; Dong, W.; Zuo, T.T.; Li, J.Y.; Liu, X.; Zhang, X.D.; Liu, L.; Shi, J.-L.; Yin, Y.-X.; et al. Tuning wettability of molten lithium via a chemical strategy for lithium metal anodes. Nat. Commun. 2019, 10, 4930. [Google Scholar] [CrossRef]
  19. Yan, K.; Lee, H.W.; Gao, T.; Zheng, G.; Yao, H.; Wang, H.; Lu, Z.; Zhou, Y.; Liang, Z.; Liu, Z.; et al. Ultrathin two-dimensional atomic crystals as stable interfacial layer for improvement of lithium metal anode. Nano Lett. 2014, 14, 6016–6022. [Google Scholar] [CrossRef]
  20. Ding, F.; Xu, W.; Graff, G.L.; Zhang, J.; Sushko, M.L.; Chen, X.; Shao, Y.; Engelhard, M.H.; Nie, Z.; Xiao, J.; et al. Dendrite-free lithium deposition via self-healing electrostatic shield mechanism. J. Am. Chem. Soc. 2013, 135, 4450–4456. [Google Scholar] [CrossRef]
  21. Yang, C.P.; Yin, Y.X.; Zhang, S.F.; Li, N.W.; Guo, Y.G. Accommodating lithium into 3D current collectors with a submicron skeleton towards long-life lithium metal anodes. Nat. Commun. 2015, 6, 8058. [Google Scholar] [CrossRef] [PubMed]
  22. Yan, K.; Lu, Z.; Lee, H.W.; Xiong, F.; Hsu, P.C.; Li, Y.; Zhao, J.; Chu, S.; Cui, Y. Selective deposition and stable encapsulation of lithium through heterogeneous seeded growth. Nat. Energy 2016, 1, 16010. [Google Scholar] [CrossRef]
  23. Cho, K.Y.; Hong, S.H.; Kwon, J.; Song, H.; Kim, S.; Jo, S.; Eom, K. Effects of a nanometrically formed lithiophilic silver@copper CC on the electrochemical nucleation and growth behaviors of lithium metal anodes. Appl. Surf. Sci. 2021, 554, 149578. [Google Scholar] [CrossRef]
  24. Lee, Y.G.; Fujiki, S.; Jung, C.; Suzuki, N.; Yashiro, N.; Omoda, R.; Ko, D.S.; Shiratsuchi, T.; Sugimoto, T.; Ryu, S.; et al. High-energy long-cycling all-solid-state lithium metal batteries enabled by silver–carbon composite anodes. Nat. Energy 2020, 5, 299–308. [Google Scholar] [CrossRef]
  25. Suryanarayana, C. Phase formation under non-equilibrium processing conditions: Rapid solidification processing and mechanical alloying. J. Mater. Sci. 2018, 53, 13364–13379. [Google Scholar] [CrossRef]
  26. Ohring, M. Materials Science of Thin Films: Deposition and Structure; Elsevier: Amsterdam, The Netherlands, 2001. [Google Scholar]
  27. McNaught, A.D. Compendium of Chemical Terminology; Blackwell Science: Oxford, UK, 1997; Volume 1669. [Google Scholar]
Figure 1. Schematic of the Ag–Cu co-deposition method.
Inorganics 11 00440 g001
Figure 2. XRD patterns of the Ag–Cu films with (a) different co-sputtered area ratios and (b) different annealing temperatures with the Ag:Cu atomic ratio of 9:1.
Inorganics 11 00440 g002
Figure 3. SEM surface morphology of different CCs: (a) bare Cu CC, (b) Ag–Cu CC, (c) Ag–Cu (400 °C) CC, (d) Ag–Cu (500 °C) CC, and (e) Ag–Cu (600 °C) CC.
Inorganics 11 00440 g003
Figure 4. EDS mapping image analysis of various CCs: (a) Ag–Cu CC, (b) Ag–Cu (400 °C) CC, (c) Ag–Cu (500 °C) CC, and (d) Ag–Cu (600 °C) CC.
Inorganics 11 00440 g004
Figure 5. Ag particle size distribution determined via image analysis at different annealing temperatures.
Inorganics 11 00440 g005
Figure 6. Li plating test results of different CCs for comparison of the nucleation and growth overpotential: (a) at a current density of 50 µAcm−2 with a fixed capacity of 1 mAhcm−2 and (b) at a current density of 0.5 mAcm−2 with a fixed capacity of 1 mAhcm−2.
Inorganics 11 00440 g006
Figure 7. Nyquist plots obtained after Li plating/stripping for 50 cycles at a current density of 1 mAcm−2 and fixed capacity of 1 mAhcm−2.
Inorganics 11 00440 g007
Figure 8. CE values of different CCs at a current density of 0.5 mAcm−2.
Inorganics 11 00440 g008
Figure 9. Voltage profiles of different CCs at a current density of 0.5 mAcm−2: (a) bare Cu CC, (b) Ag–Cu CC, (c) Ag–Cu (500 °C) CC, and (d) Ag–Cu (600 °C) CC.
Inorganics 11 00440 g009
Figure 10. SEM images of the morphology of Li deposited after cycling: (a) bare Cu and (b) Ag–Cu CC (600 °C).
Inorganics 11 00440 g010
Table 1. Sheet resistances of the Ag–Cu films at different annealing temperatures. Sheet resistance was measured using the four-point probe method.
Annealing TemperatureSheet Resistance (ohm/sq)
w/o annealing55.51
400   ° C 25.24
500   ° C X
600   ° C X
Table 2. Experimental results obtained at the current density of 50 µAcm−2 and fixed capacity of 1 mAhcm−2.
Annealing TemperatureNucleation
Overpotential (mV)
Plateau
Overpotential (mV)
Bare Cu37.31 mV14.98 mV
Annealing X0.62 mV13.60 mV
400   ° C 12.70 mV9.78 mV
500   ° C 18.04 mV8.41 mV
600   ° C 15.60 mV9.78 mV
Table 3. Experimental results obtained at a current density of 0.5 mAcm−2 and fixed capacity of 1 mAhcm−2.
Annealing
Temperature
Nucleation
Overpotential (mV)
Plateau
Overpotential (mV)
Bare Cu36.84 mV65.59 mV
Annealing X18.81 mV41.58 mV
400   ° C 20.49 mV41.89 mV
500   ° C 19.88 mV39.90 mV
600   ° C 19.84 mV32.41 mV
Table 4. Fitting results obtained using the equivalent circuit shown in the inset of Figure 7 (Rs: solution resistance; RSEI: film resistance of the SEI; and Rct: charge transfer resistance).
Resistance [Ω cm2]RsRSEIRct
500 °C9.167.2210.4
600 °C7.938.855.3
Disclaimer/Publisher’s Note: The statements, opinions and data contained in all publications are solely those of the individual author(s) and contributor(s) and not of MDPI and/or the editor(s). MDPI and/or the editor(s) disclaim responsibility for any injury to people or property resulting from any ideas, methods, instructions or products referred to in the content.

