Article

The Crystal Structure of Carbonic Acid †

1
Chair of Solid-State and Quantum Chemistry, Institute of Inorganic Chemistry, RWTH Aachen University, D-52056 Aachen, Germany
2
Hoffmann Institute of Advanced Materials, Shenzhen Polytechnic, Shenzhen 518055, China
3
Research Neutron Source Heinz Maier-Leibnitz (FRM II), Technical University Munich, D-85748 Garching, Germany
*
Author to whom correspondence should be addressed.
Dedicated to Professor Bernt Krebs on the occasion of his 84th birthday.
These authors contributed equally to this work.
Inorganics 2022, 10(9), 132; https://doi.org/10.3390/inorganics10090132
Submission received: 15 August 2022 / Revised: 27 August 2022 / Accepted: 29 August 2022 / Published: 3 September 2022
(This article belongs to the Special Issue Inorganics: 10th Anniversary)

Abstract

:
Ubiquitous carbonic acid, H2CO3, a key molecule in biochemistry, geochemistry, and also extraterrestrial chemistry, is known from a plethora of physicochemical studies. Its crystal structure has now been determined from neutron-diffraction data on a deuterated sample in a specially built hybrid clamped cell. At 1.85 GPa, D2CO3 crystallizes in the monoclinic space group P21/c with a = 5.392(2), b = 6.661(4), c = 5.690(1) Å, β = 92.66(3)°, Z = 4, with one symmetry-inequivalent anti-anti shaped D2CO3 molecule forming dimers, as previously predicted. Quantum chemistry evidences π bonding within the CO3 molecular core, very strong hydrogen bonding between the molecules, and a massive influence of the crystal field on all bonds; phonon calculations emphasize the locality of the vibrations, being rather insensitive to the extended structure.

1. Introduction

Carbonic acid, H2CO3, is the simple hydrate of carbon dioxide and a ubiquitous molecule whose name has been mistakenly used for carbon dioxide itself at the end of the 19th century [1]; the H2CO3 molecule must have been touched by the alchemists already. As given in any standard chemistry textbook [2,3], carbonic acid forms directly from water and carbon dioxide according to the equilibrium equation:
H2O(l) + CO2(g) ⇄ H2CO3(aq) ⇄ H+(aq) + HCO3 (aq) ⇄ 2 H+(aq) + CO32−(aq)
The two acid constants are KA1 = 1.3 · 10−4 and KA2 = 4.84 · 10−11. Since H2CO3 not only behaves as a weak acid but seemingly decays quite easily into the two starting molecules and, hence, makes bubbles in everyday soda water, preparing “free” carbonic acid has been falsely considered plainly impossible for many decades. Already in 1965, however, a pioneering low-temperature direct synthesis in dimethyl ether according to
Na2CO3 + 2 HCl → H2CO3 + 2 NaCl
was successfully carried out [4] on the gram scale, including an estimate of its exothermic formation enthalpy (−649 ± 42 kJ mol−1). The astonishing kinetic stability of carbonic acid devoid of any coordinating molecules has also been demonstrated from both experiment and quantum chemistry [5], including the crucial role of excess water molecules in catalyzing the H2CO3 decay, essentially an autocatalytic process.
It does not come as a surprise that characterizing carbonic acid has therefore been mainly performed by spectroscopic methods, in particular as regards infrared data [6,7], and even two different polymorphs (α and β) of carbonic acid were claimed based on matrix IR techniques [7,8,9] given prior sublimation to prepare the pure compound. Only recently, however, “α-H2CO3” was characterized as being a monomethyl ester of H2CO3 while β-H2CO3 appears to be the only form of carbonic acid known up to the present day [10]. Admittedly, parts of the (molecular) literature look slightly controversial, possibly due to spectroscopic ambiguities (frequency and phase assignments, see above), including hidden priority claims.
Despite the fundamental character of H2CO3 and its (biochemical) paramount importance for the regulation of the blood’s pH, the acidification of the world oceans, its predicted chemistry in the outer planets, and a true plethora of other issues (see references above and further references within), its crystal structure is still unknown, seemingly mirroring tremendous experimental challenges. Hence, the shape of the molecule in the crystal, the intermolecular connectivity, the details of the hydrogen bonds, the entire solid-state energetics and other related chemical and also physical questions are still unsolved, at least experimentally. With regard to theory, however, there have been density-functional/force-field attempts [11] and a groundbreaking DFT prediction for H2CO3 having orthorhombic Pnma symmetry at about 1 GPa pressure (and beyond) based on evolutionary algorithms [12], in harmony with high-pressure spectroscopic data [13]. This has been followed by the proposal of a unit cell for high-pressure water-CO2 phases [14] being of triclinic, not orthorhombic symmetry, however. The present study aims to experimentally determine the crystal structure of carbonic acid at high pressure.

2. Results and Discussion

To solve the puzzle, in particular the necessity of correctly localizing the hydrogen atoms and prevent the notorious problem of incoherent neutron-protium scattering, a neutron-diffraction study on deuterated carbonic acid, D2CO3, seemed similar to an optimum choice but this would require a comparatively large sample volume of about 0.4 mL for GPa conditions not being commercially available; earlier unpublished calculations of ours assuming approximate isotypism of H2CO3 with urea firmly indicated stability slightly below 2 GPa [15]. Hence, we started with almost equimolar solid mixtures of crystalline H2O and CO2 manipulated at liquid-nitrogen temperature [16] for orienting tests using tiny amounts with a standard diamond anvil cell and laboratory X-ray diffraction. For the decisive neutron-diffraction experiment, a much larger D2O/CO2 mixture with an intentional CO2 excess was ground and inserted into a unique self-built pre-cooled hybrid pressure cell [17] which was closed and pressurized with a load of 4 tons. After returning to room temperature, it was further pressurized to a final pressure of 1.85 GPa as measured in situ by ruby fluorescence [17]. Neutron powder diffraction patterns were collected at the STRESS-SPEC instrument [18]. Three phases (D2CO3, CO2, and the Ni-Cr-Al fcc alloy of the container) were simultaneously taken into account for the neutron-data analysis, with no experimental evidence whatsoever for additional phases. Manual structure solution inspired by the previous structure proposal [12] and further Rietveld refinements were carried out [19] but a reduction to the translationengleich subgroup P1121/a (= P21/c) was needed and yielded unit cell parameters as given in Table A1. Excess CO2-I served as an internal standard for the isotropic atomic displacement parameters while the Uiso parameters of the deuterium atoms were based on the D2O-VIII neutron study [20]. All refined atomic parameters are found in 
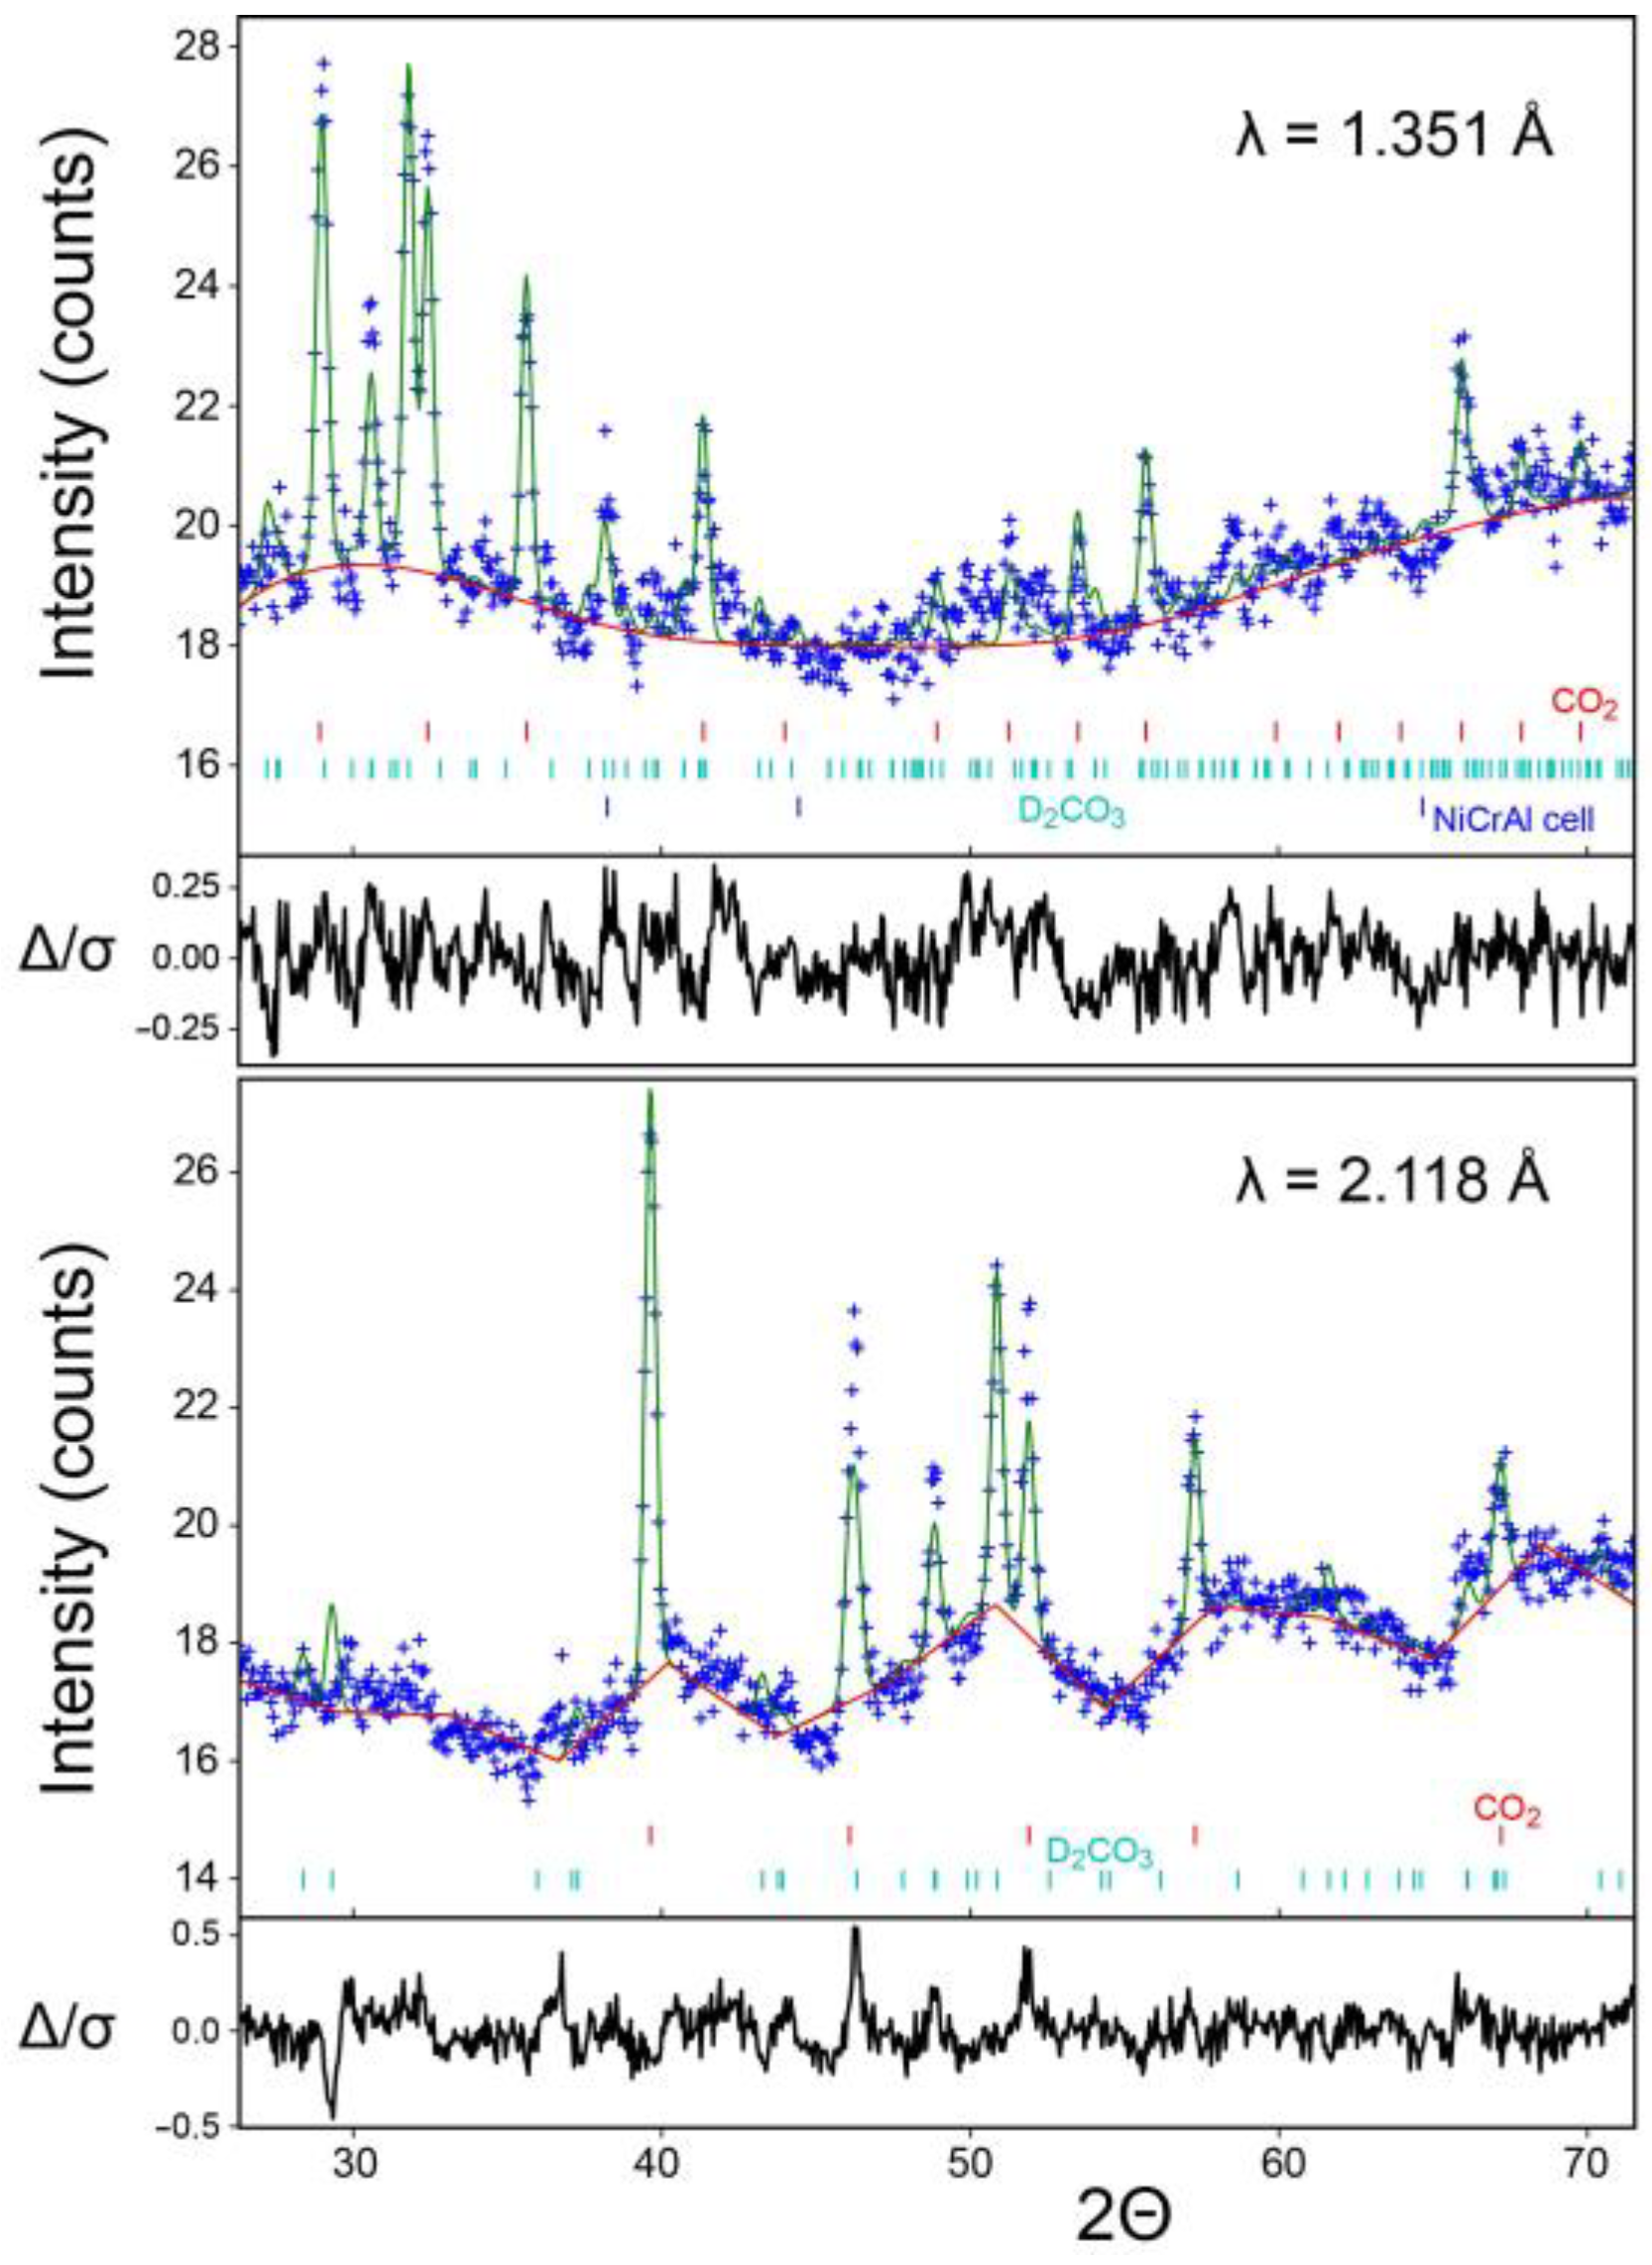
Table A2. An overview of the final Rietveld result is provided in Figure 1. The ruby-determined pressure of 1.85 GPa was also independently verified [21,22,23].
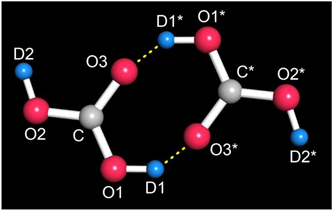
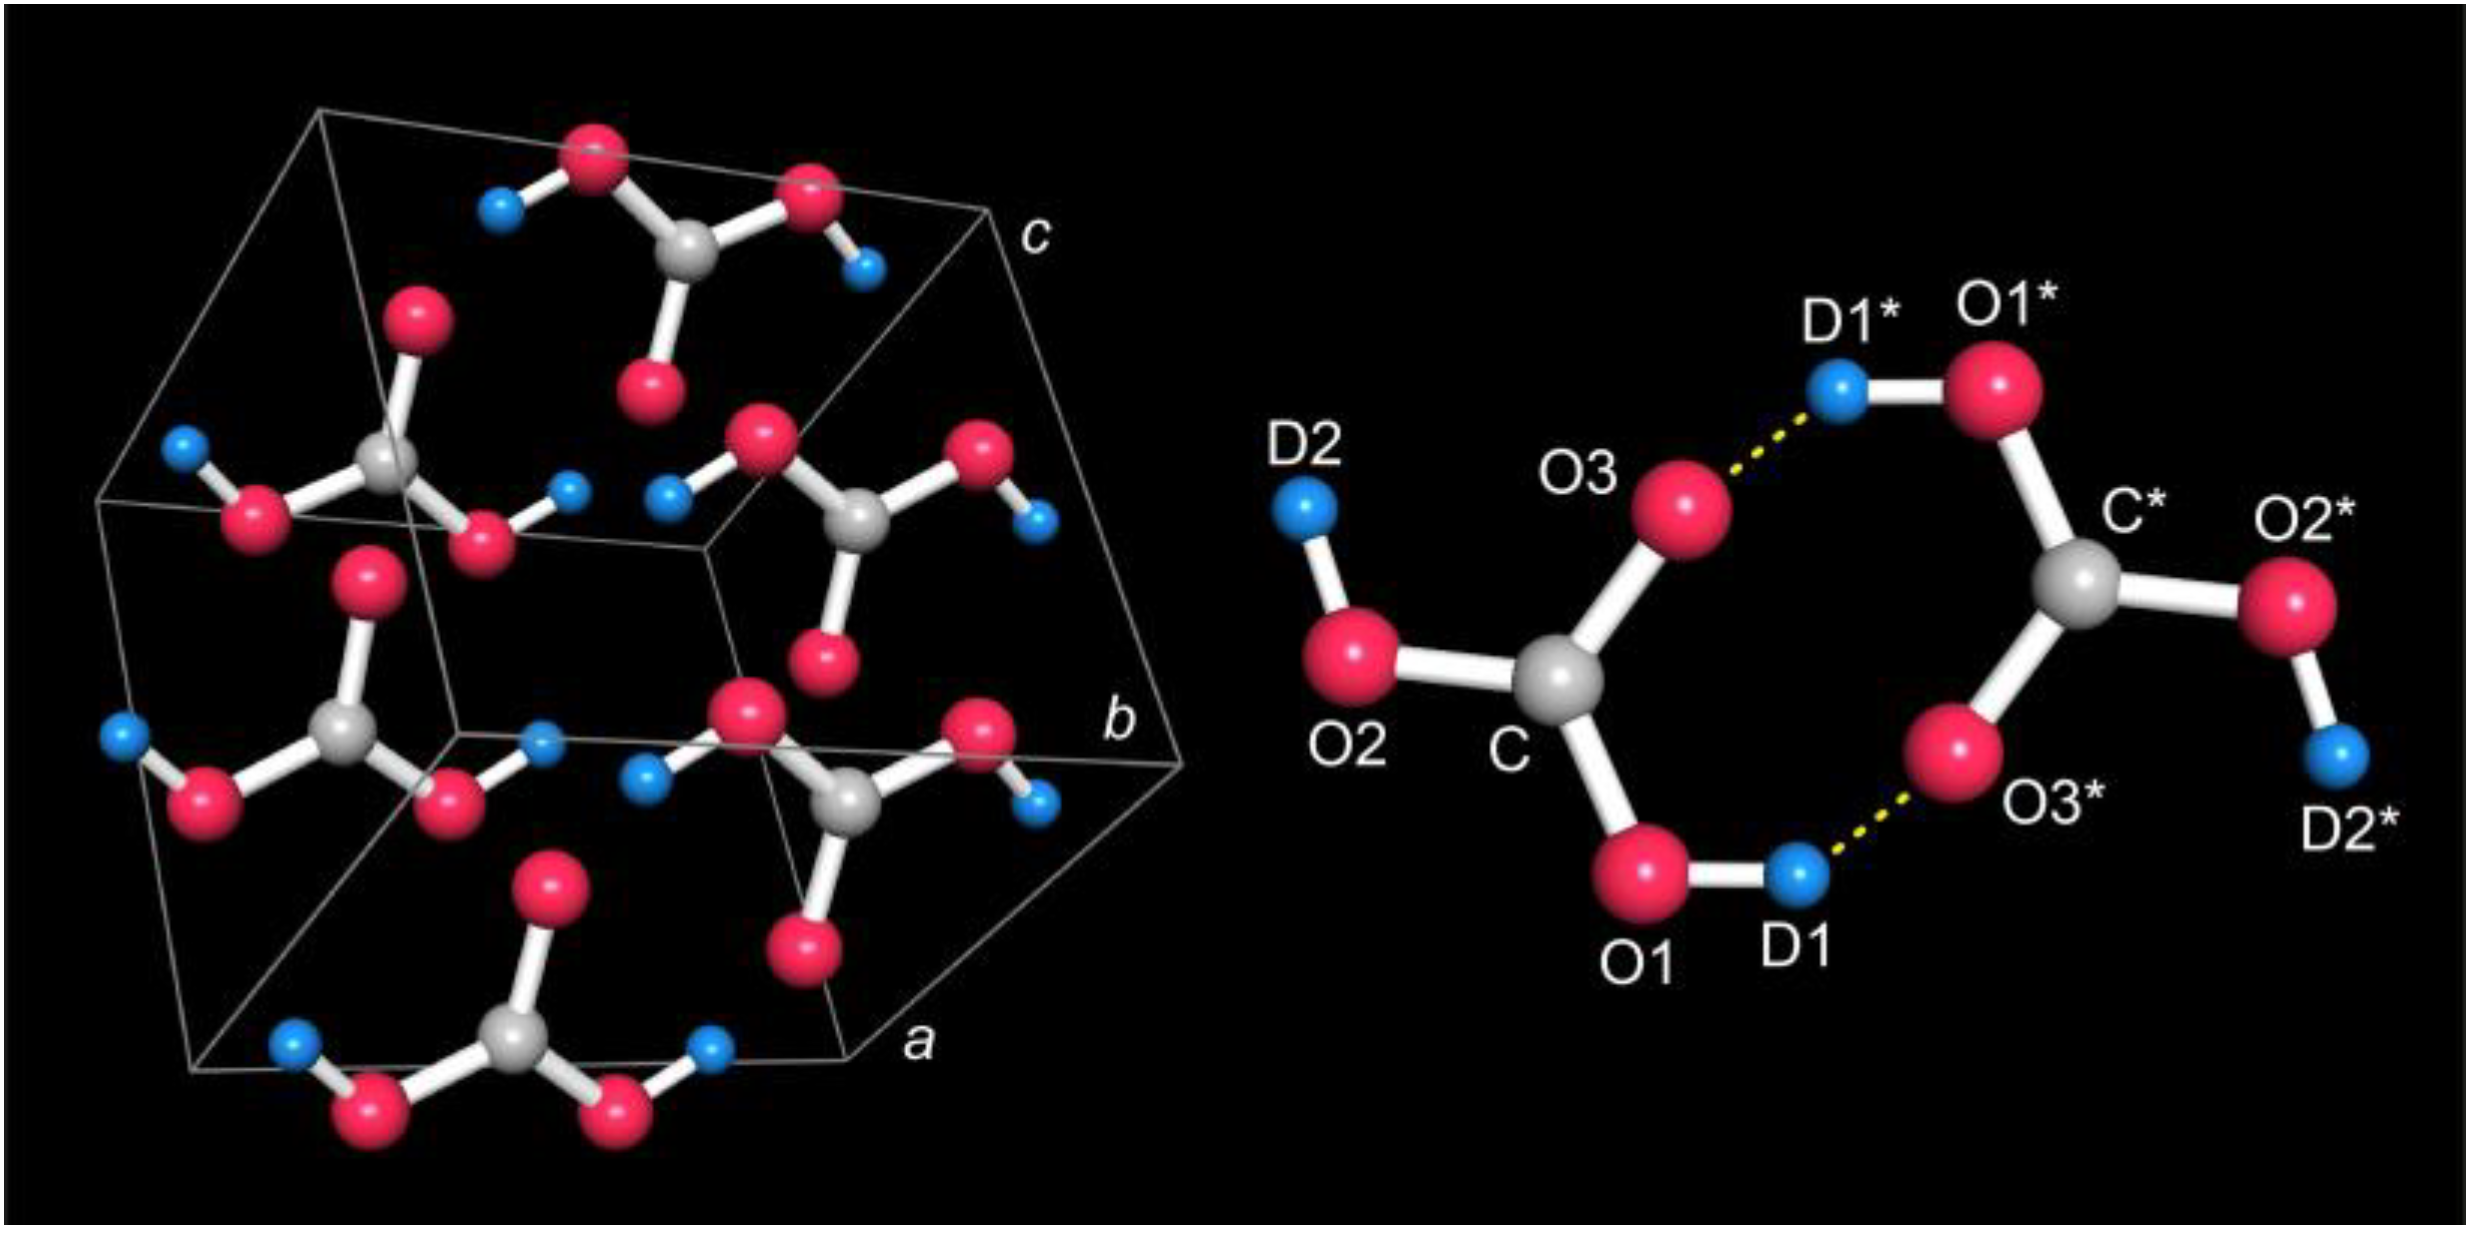
As regards the crystal structure itself, the unit cell of carbonic acid contains just one symmetry-independent D2CO3 molecule adopting the anti-anti conformation and four molecular units in total, see Figure 2 (left). In the D2CO3 molecule, the central carbon atom is bonded to the O1 and O2 hydroxyl atoms with d = 1.33(2) and 1.34(2) Å, clearly too short if compared to a standard C–O single bond (1.43 Å); for atomic labels, see 
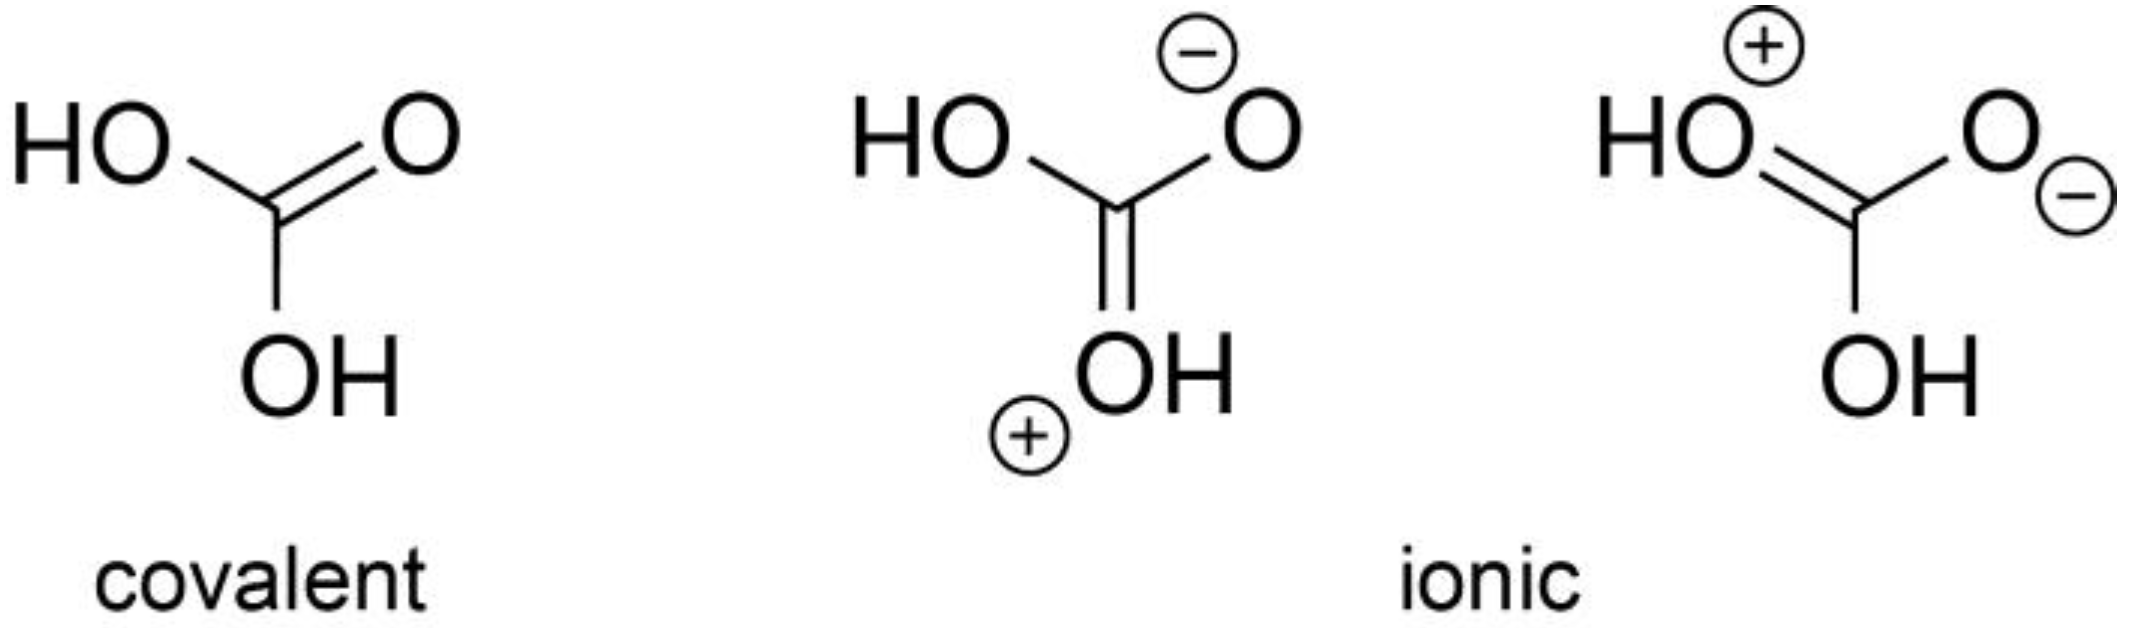
Figure 2 (right). The two hydroxyl O atoms further bond to the D1 and D2 atoms at 0.99(2) Å both. The formally double-bonded O3 atom is found at about the same C–O distance of 1.34(2) Å, this time too long compared to a standard C=O = 1.23 Å double bond. Even given the restricted resolution of the data due to the low neutron counts, both bond-length irregularities must be taken seriously and directly point towards other mesomeric structures in the spirit of valence-bond theory, see Figure 3, involving delocalized π bonding in the central CO3 triangle through well-overlapping C 2pz and O 2pz atomic orbitals. Hence, it is not surprising that even with a dramatically reduced restraining weight factor, the atoms within D2CO3 are in an almost perfect planar arrangement, the π bonding being in control of the molecular shape. We note that this phenomenon has been found before in related molecular units, for example, in guanidinate salts involving a central CN3 core such as in SrC(NH)3 [24].
Two D2CO3 molecules arrange in dimers, see Figure 2 (right), connected via two C–O1–D1∙∙∙O3*=C* hydrogen bonds with a short O1–O3* distance of 2.13(3) Å and a rather acute O1–D1···O3* angle of 136(5)°. The molecular planes are slightly shifted within the dimer to a distance of about 0.45 Å. We note that the symmetric double hydrogen-bridging bonds would be classified as strong in terms of distance and medium in terms of angle [26], the angle being less reliable in this case, however (see below). The dimeric structure seemingly resembles the most stable molecular arrangement of carbonic acid already theoretically predicted in 1997 [27] and further theoretically explored recently [28,29]. At the same time, this very dimer shape makes alternative D split positions with half occupancy less likely, as also corroborated experimentally from significantly worse neutron-data refinements.
Due to the restricted resolution, it is instructive and also advantageous to compare the experimental structural data with those theoretical ones derived from DFT optimization using plane waves, PAW pseudopotentials, and a DFT-D3(BJ) or HSE exchange-correlation functional, also using P21/c space-group symmetry [30,31,32,33,34,35,36,37,38,39,40]. All geometrical data are found in 
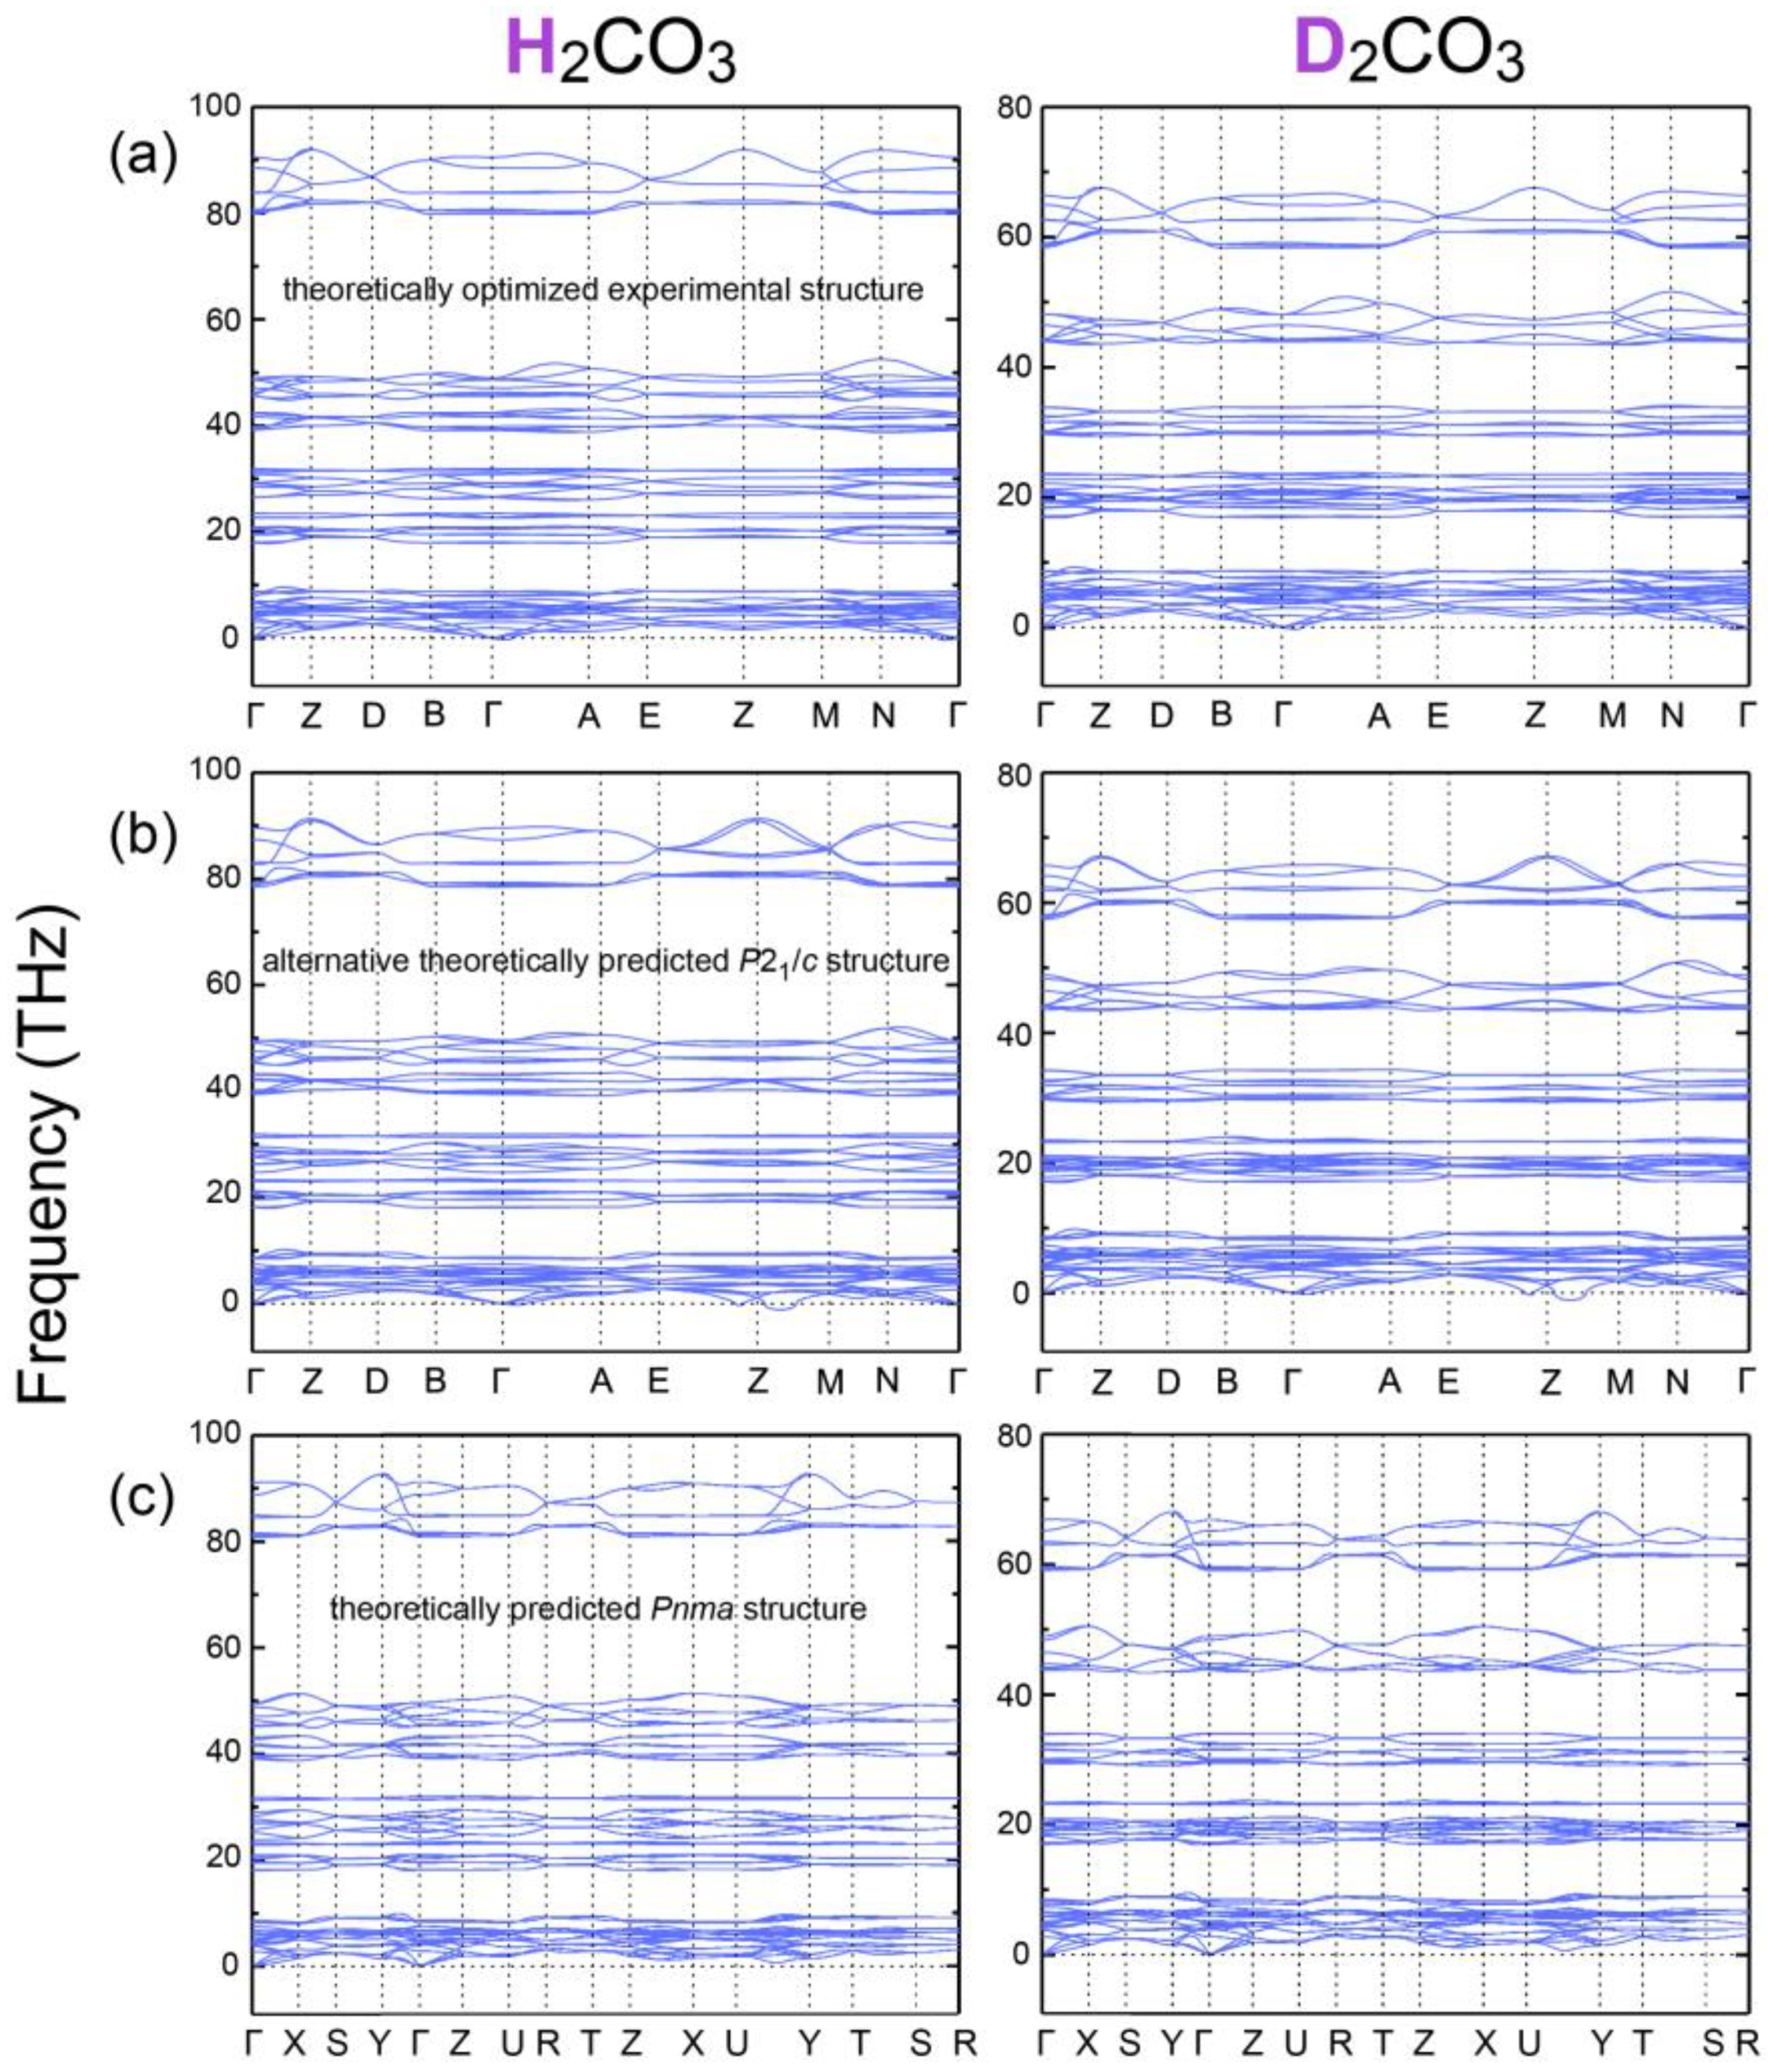
Table A3. While this DFT-optimized experimental structure is mechanically stable in terms of phonons [41] showing no imaginary frequencies (
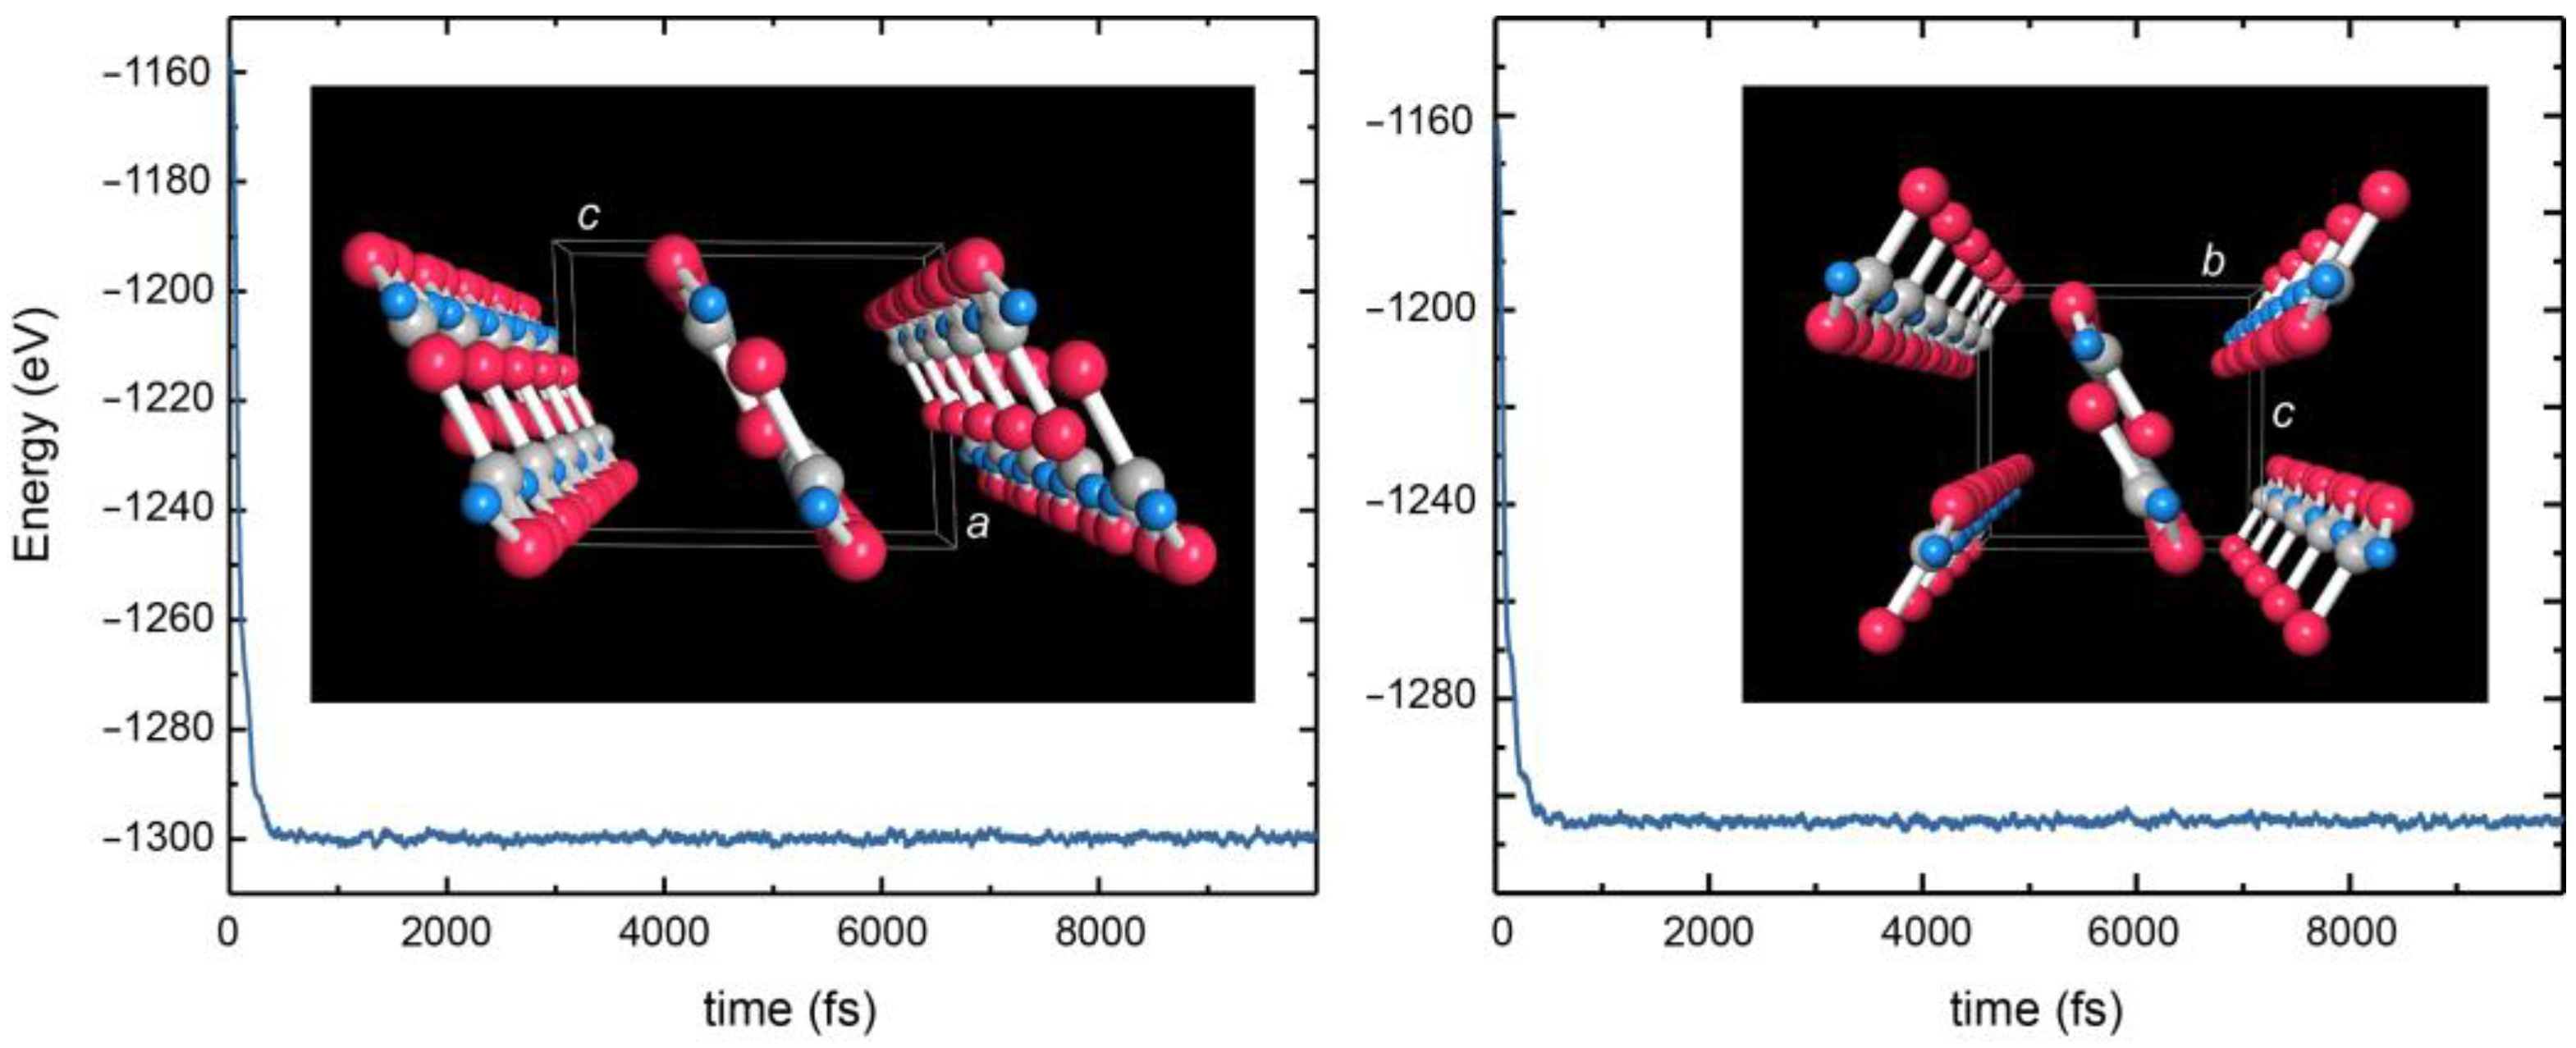
Figure A2), also in an NPT molecular-dynamics (MD) simulation [42], see Figure A3, the C–O1/O2 bonds arrive at an even shorter 1.30 Å instead of the expected single-bond 1.43 Å whereas O–D is confirmed as 1.02 Å. The theoretical O1–O3* distance and O1–D1···O3* angle (as well as O2–D2···O3* because the H-bonding mode becomes slightly more symmetric) widen to 2.57 Å and 176°. Most significant, however, is the C=O3 bond which then comes out shorter (1.26 Å) but not as short as in the prototype double bond. As such, π bonding over the entire CO
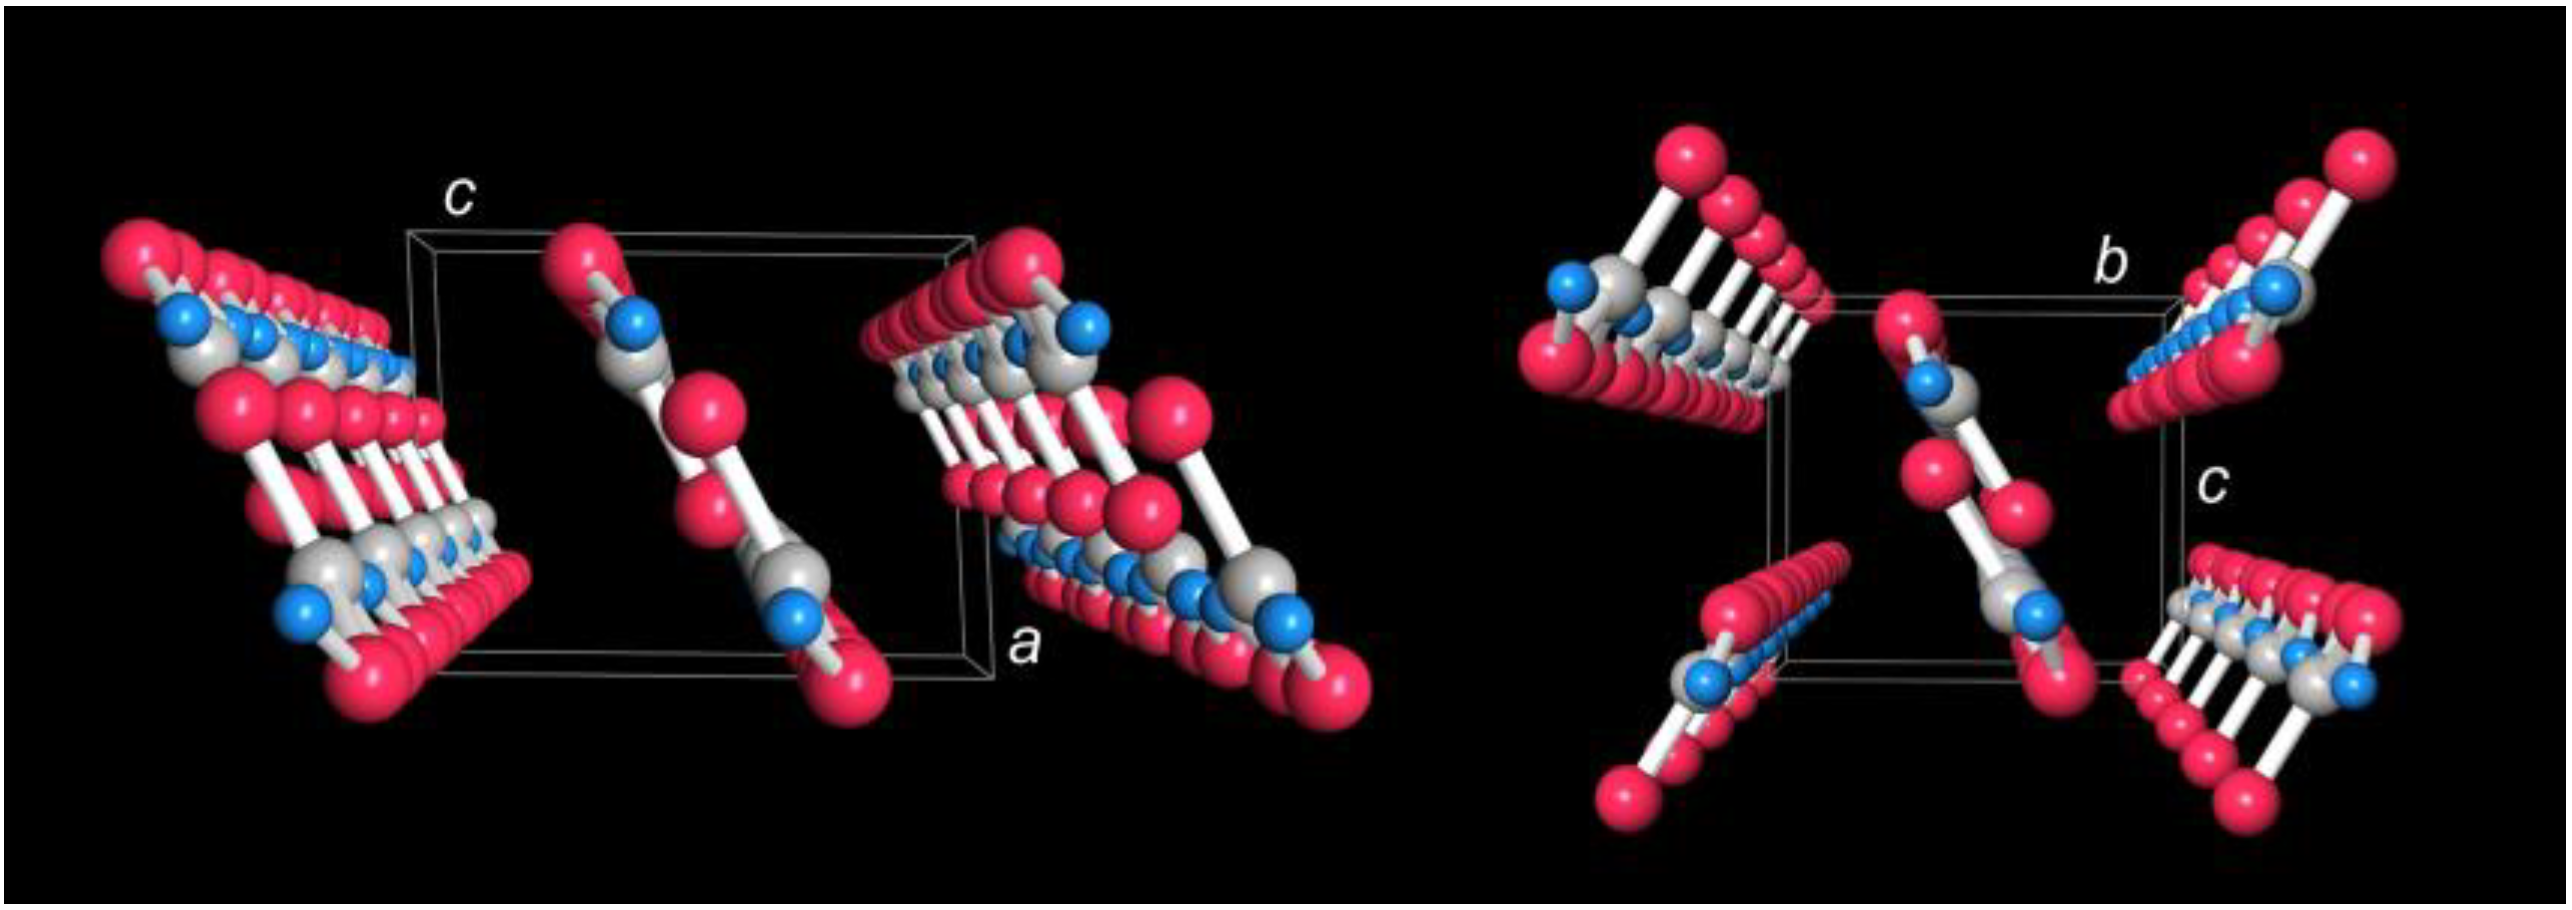
3 triangle is nicely corroborated from DFT, as analyzed in more detail below. In what follows, we will refer to these theoretical bond distances because they look superior to the experimental ones (due to the limited neutron count) while still capturing all the experimentally determined structural motifs. Before doing so, a look at Figure 4 (left) shows the packing of the dimers which essentially form infinite stripes along the b direction.
The theoretical free energy of formation of D2CO3 at 2 GPa including zero-point energies arrives at −684 kJ mol−1 at 300 K and slightly lowers to −687 kJ mol−1 as the temperature cools down to 0 K, assuming a direct reaction from solid D2 in P63/mmc [43], diamond-like C [44], and solid O2 in Cmcm [44]. This theoretical energy exceeds the 1965 experimental estimate by only 6% and is within a single standard deviation of that value, thus highlighting the applaudable precision of the early contribution.
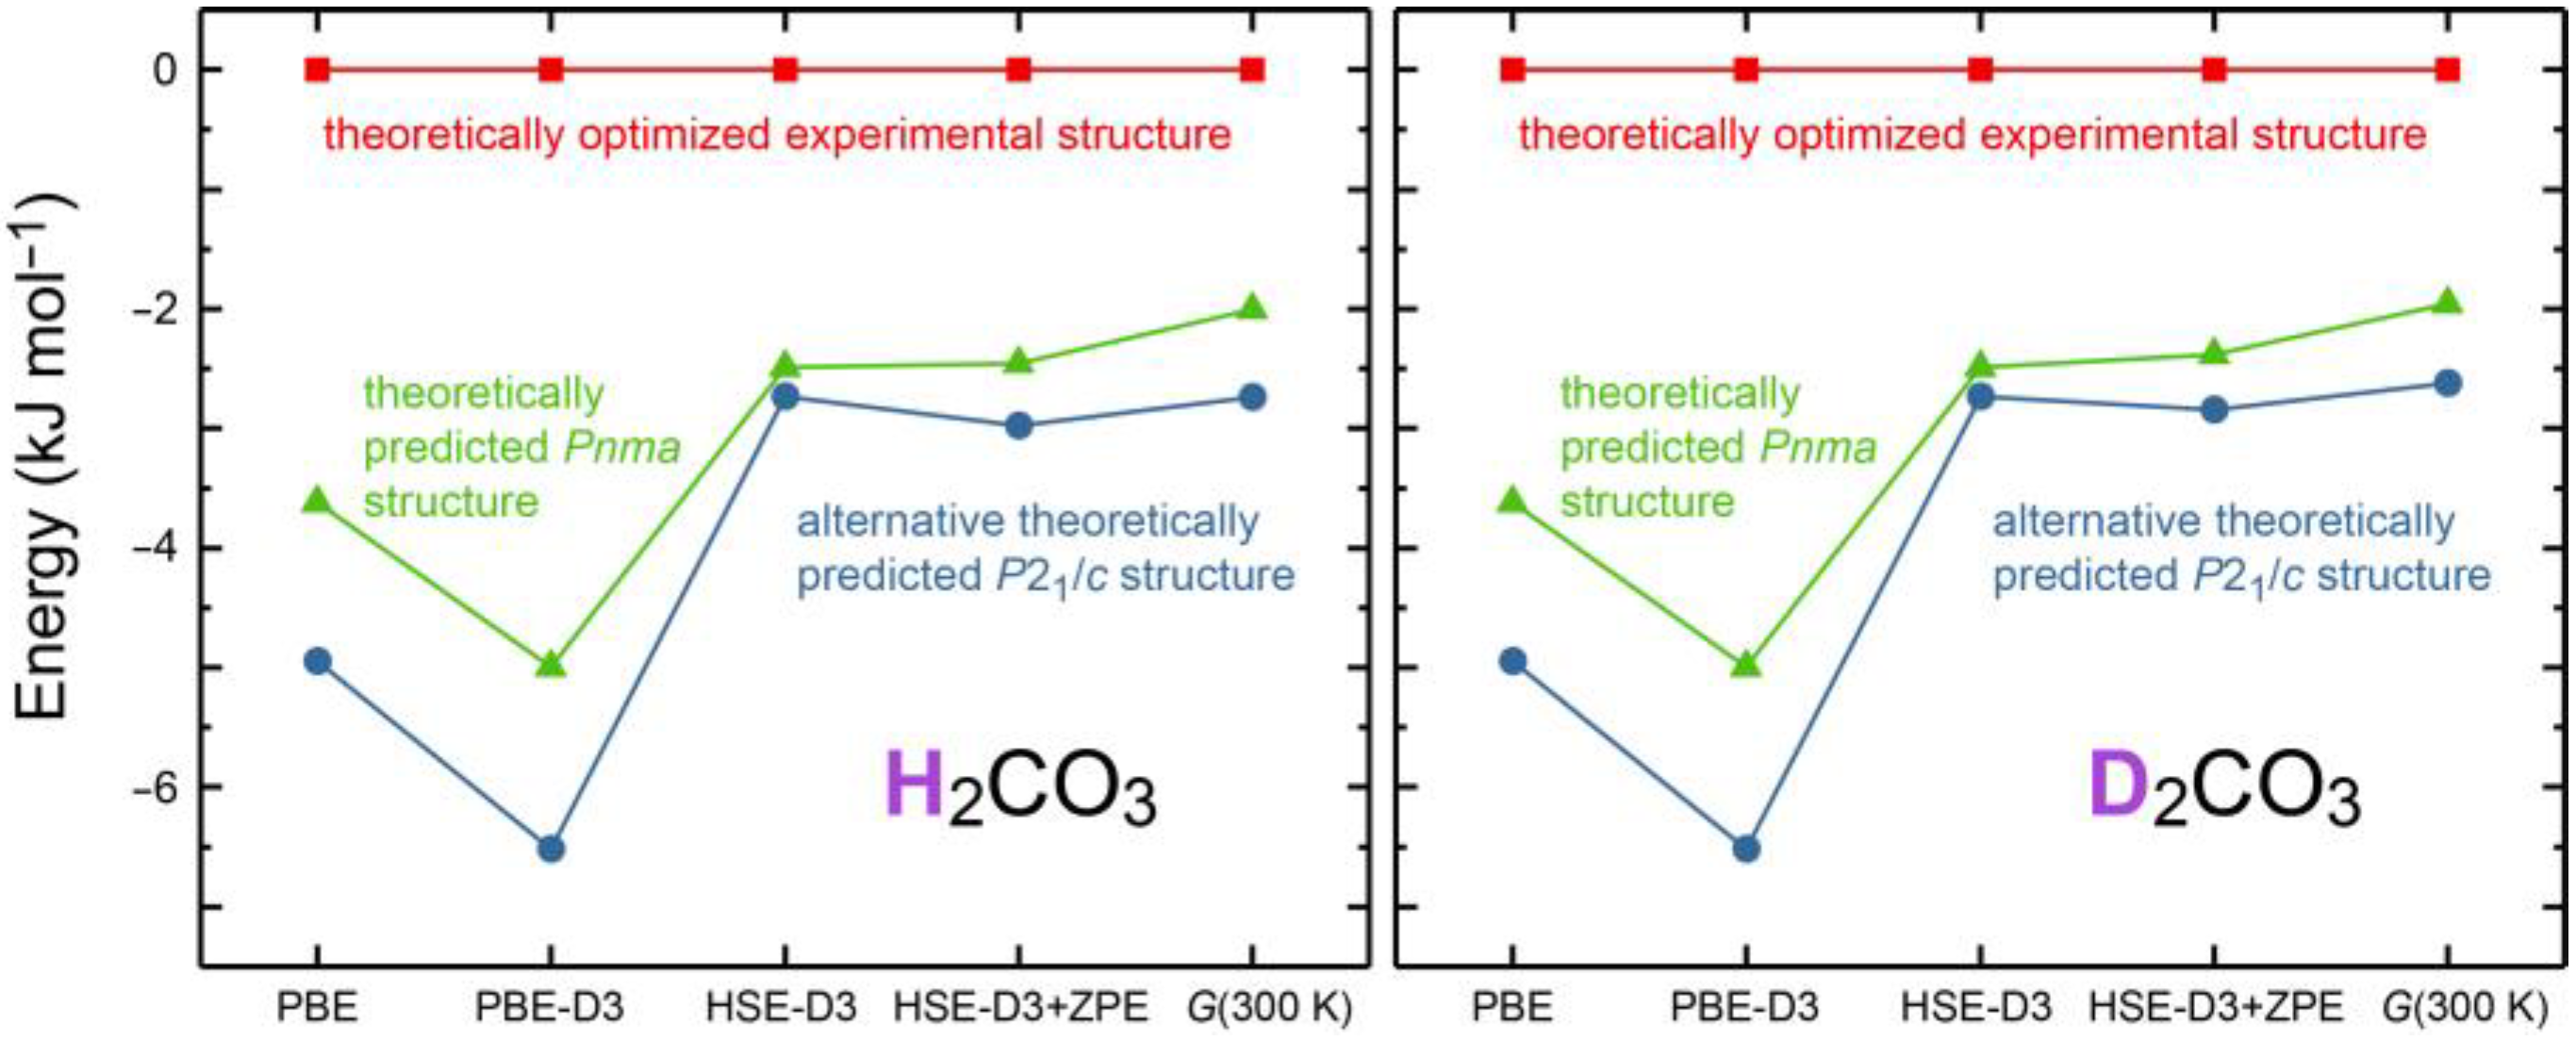
There are two more puzzling theoretical findings which relate to the existence of hypothetic molecular polymorphs. First, the theoretically predicted crystal structure of H2CO3 in Pnma space-group symmetry [12], also found here by means of structural searches via particle swarm optimization [45,46], can be firmly ruled out given the experimental data. It nonetheless turns out as being electronically lower in energy, stabilized by about 5 kJ mol−1 as calculated by PBE-D3, surprisingly enough. While this small energy difference clearly challenges density-functional theory by its minute size (note that the atomic connectivity is identical), it is at least thinkable that the Pnma polymorph may exist and can be made using other growing conditions, yet to be found, but only if sufficient activation barriers exist between the polymorphs. Likewise, there is yet another monoclinic P21/c polymorph including the same D2CO3 molecule with identical interatomic distances and O–D···O* angle; its data have been compiled in Table A4. This hypothetical polymorph, also stable in terms of phonons and NPT MD simulations (see Figure A2 and Figure A3), turns out as being even lower by 1.5 kJ mol−1 (PBE-D3) and by almost 1 kJ mol−1 in terms of Gibbs free energies; it exhibits identical dimers and the same connectivity leading to molecular stripes but this time allowing for another stacking, running along the a direction as shown in Figure 4 (right); only the difference in stacking is causing the minute energetic change. Further experimental and theoretical studies may evidence whether those two hypothetical polymorphs go back to theoretical deficiencies (say, inaccurate dispersion correction and/or neglect of nuclear anharmonic vibrational contributions) or must be considered real; for an overview of relative energies including various functional approaches, zero-point energy and other corrections as well as (negligible) H/D mass impact by phonon contributions, see Figure A1. The latter figure makes different polymorphs for H2CO3 and D2CO3 very unlikely. Likewise, more accurate non-local vdW-DF functionals such as optB88 do not lead to quantitatively different energy courses. If the here found experimental structure were only metastable, Ostwald’s step rule would be at play and render it as the polymorph with the smallest energy barrier for crystallization [47].
In terms of chemical bonding, an analytical unitary transformation from the delocalized plane-wave picture into a localized representation was carried out [48,49,50,51,52]. The various bonds are easily evaluated by their integrated crystal-orbital bond indices (ICOBI) given in Table A5 [53]. As anticipated already from the mesomeric structures in Figure 3 and the bond lengths themselves, the “single” bonds (ICOBI ≈ 1.21, not 1) come out stronger, and the “double” bond (ICOBI ≈ 1.39, not 2) is weaker. Indeed, the π bonding originating from the pzpz interaction alone amounts to a bond order of about ⅓, in harmony with MO theory [24], see also below. The O–D bonds (ICOBI ≈ 0.66) appear as slightly weaker than expected, a clear consequence of the astonishingly strong hydrogen-bridging bonds (ICOBI ≈ 0.18) into the opposite direction. Upon looking at the isolated monomer (also Table A5), the “single” bonds become closer to single (ICOBI ≈ 1.08) and the “double” bond becomes closer to double bond character (ICOBI ≈ 1.72) while the isolated O–D hydroxyl bonds (devoid of H bonding) also become more typical (ICOBI ≈ 0.79). Clearly, the bonding of carbonic acid is heavily affected by the periodic structure since the crystal field equilibrates the C–O and O–D bond orders.
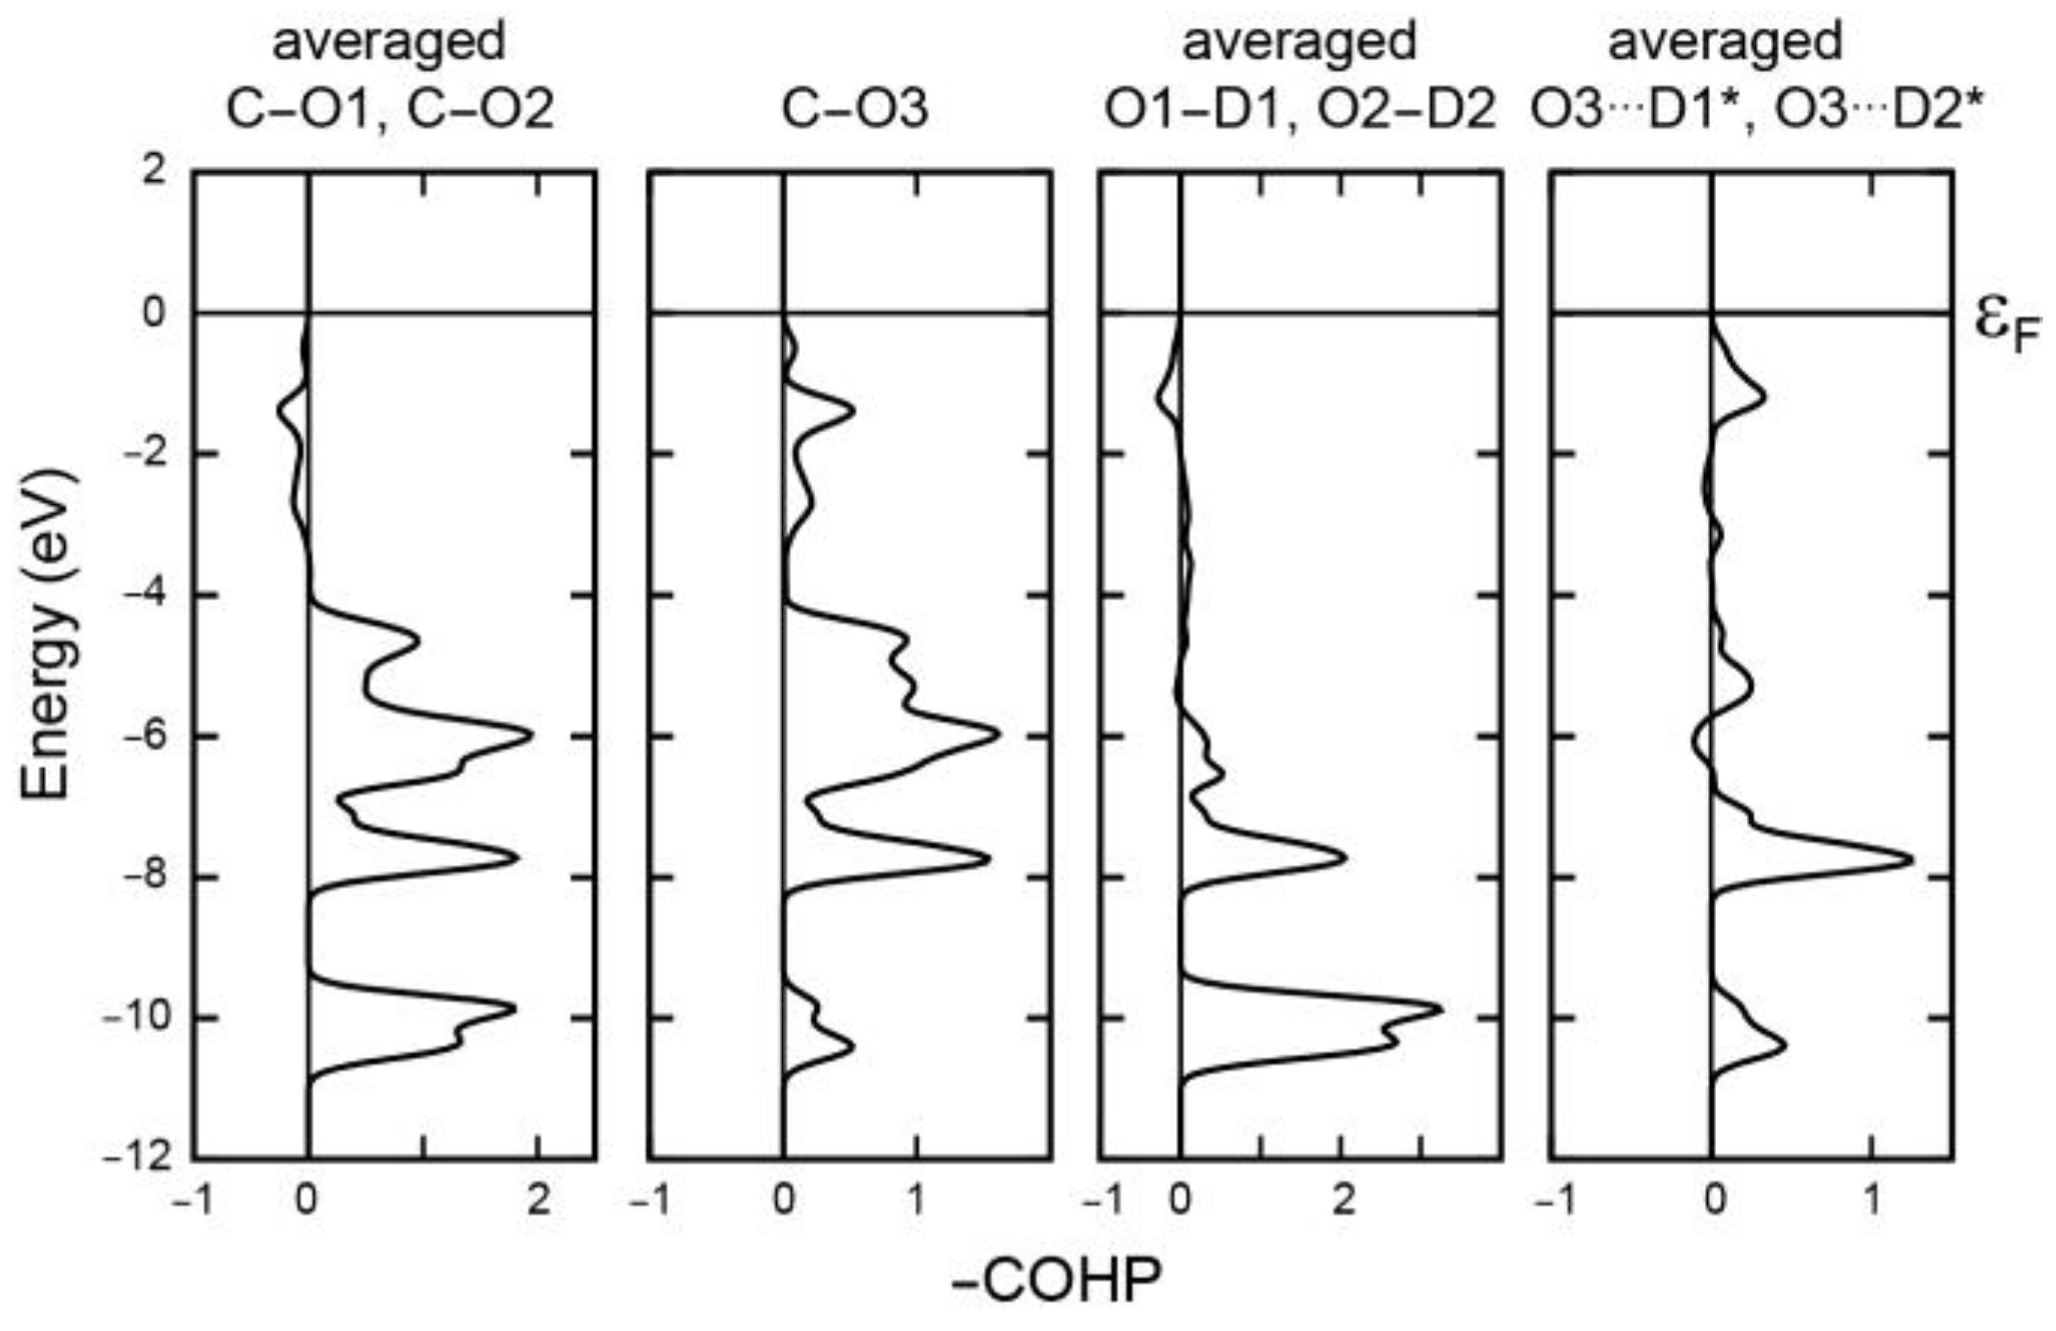
Energywise, similar conclusions can be drawn from Crystal Orbital Hamilton Population (COHP) plots depicted in Figure 5 whose numerical data are found in Table A6. The strongest C–O3 “double” bond exclusively exhibits bonding levels over the entire energy region, and the highest π part, between −3 eV and the Fermi level, shows up antibondingly for the “single” C–O1 and C–O2 bonds. A small antibonding level of the hydroxyl O1–D1 and O2–D2 single bonds in the proximity of the Fermi level reappears bondingly in the hydrogen-bridging bonds O3···D1* and O3···D2* which come out exceedingly strong, with ICOHP values of about −1.84 eV (Table A6) corresponding to ca. 178 kJ mol−1. A while ago we have shown how covalency contributes to hydrogen bonding, measured by ICOHP [54], and the current value is even larger than for the H bond in the DFT-optimized benzoylacetone molecule [54]. While ICOHP does not exactly equal the covalent bond energy but measures the covalent part of the band-structure energy, it nonetheless serves as a reliable numerical criterion, even when density-based schemes (say, bond-critical points etc.) may fail. Clearly, this hydrogen bond is extraordinarily strong.
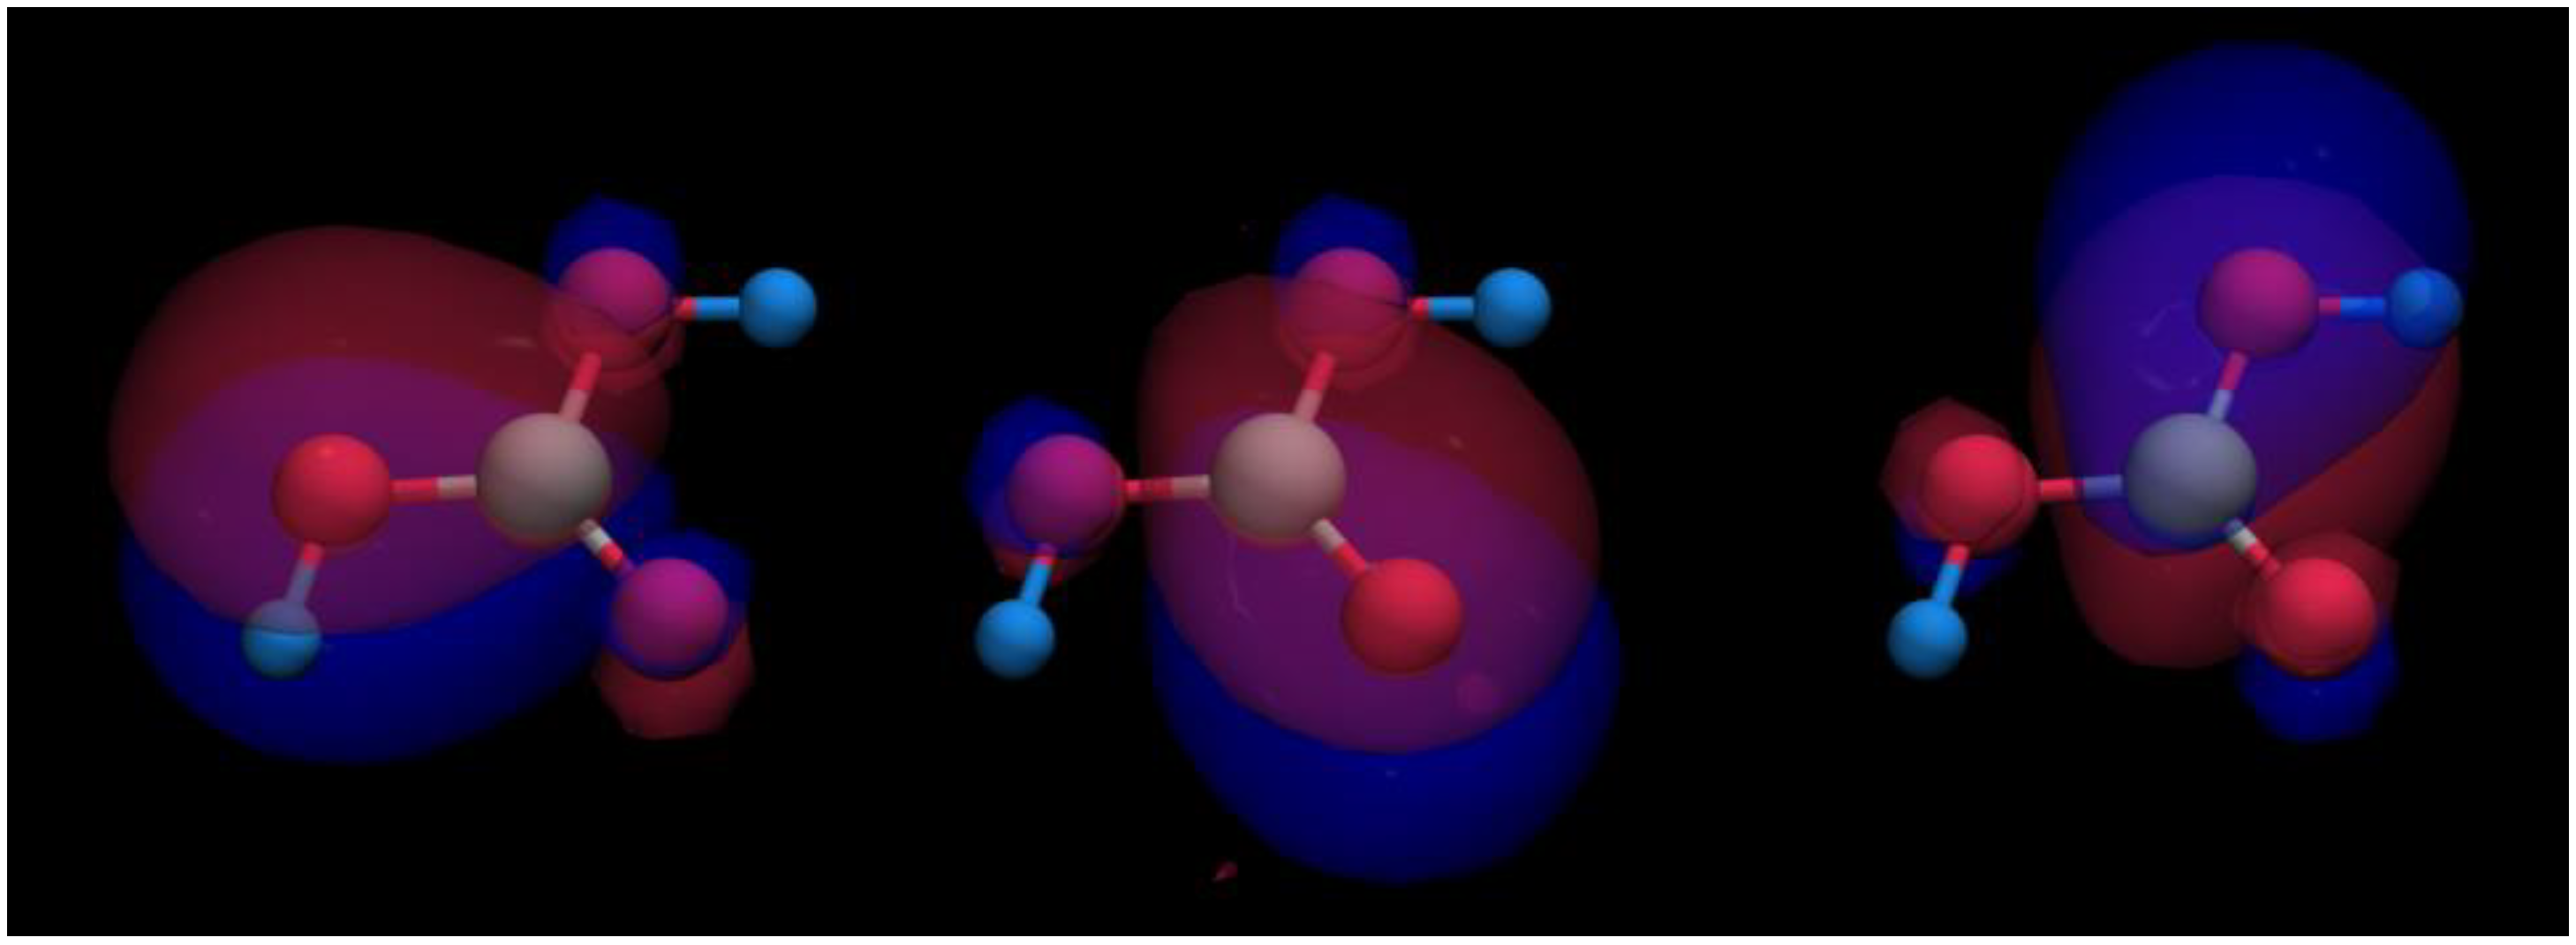
The π bonding already alluded to in Figure 5 is easily visualized by transforming those bonding interactions between −3 eV and the Fermi level from reciprocal into real space using a molecular-orbital based representation depicted in Figure A4 [55,56]. In the crystal, one finds three visually identical π orbitals of mostly bonding nature, as expected, localized on the three carbon–oxygen bonds, in harmony with the three mesomeric structures depicted in Figure 3.
In terms of a general comparison of the covalent bonding energetics in carbonic acid in the crystal and in the isolated monomer (without any H bonding), the numerical entries (Table A6) provide an unexpected finding. When the monomer condenses into the crystal, all intramolecular bonds strengthen quite a lot energywise, in particular the C–O “single” bonds (ca. + 30%) but also the C=O “double” bond (ca. + 2%) and also the O–D hydroxyl bonds (ca. + 4%). As anticipated from the aforementioned bond-order data, the crystal field also affects the intramolecular bond energies, in this case by stabilizing everything collectively.
As regards ionic contributions, the wavefunction-based Löwdin charges as projected from plane waves are given in Table A7 and arrive at +0.64 for C, −0.42 for the hydroxyl O atoms, −0.50 for the carbonyl O atom, and +0.35 for hydrogen; for the isolated molecule not profiting from a periodic Madelung field, the charges must be somewhat higher (and they are) to establish about the same Coulomb forces. In any case, either solid-state or molecular, ionicity is also at play, besides the dominating covalency. For the crystalline solid, ionicity straightforwardly leads to the aforementioned Madelung field and a (electrostatically defined) lattice energy for crystalline carbonic acid. This electrostatic part of the lattice energy is easily calculated based on Löwdin charges [53], and it arrives at about −980 kJ mol−1, a truly substantial amount for a molecular crystal, on the order of rock salt, NaCl. Admittedly, such point-charge model for a molecular solid must be considered with some caution. Interestingly enough, the alternative lowest-energy polymorph proposed by DFT has a 1.9% larger lattice energy, so its stabilization does not only go back to better packing but reflects a collective ionicity-based electrostatic effect.
If we focus on an isolated dimer of carbonic acid in vacuo, the transition state for the concerted deuterium transfer was localized from ab initio molecular-orbital calculations [34,57,58]. The associated barrier arrives at ΔG = +0.5 kJ mol−1, which would result in rapid conversion at room temperature. In the extended solid, however, there is a stabilization of the ground state or a destabilization of the transition state by the surrounding periodic units, that is, by the aforementioned Madelung field. Attempts localizing the product resulting from such concerted proton transfer on the periodic potential-energy surface failed, indicating that it is indeed destabilized to the point of not appearing as a stationary point on the latter, in perfect harmony with the neutron data.
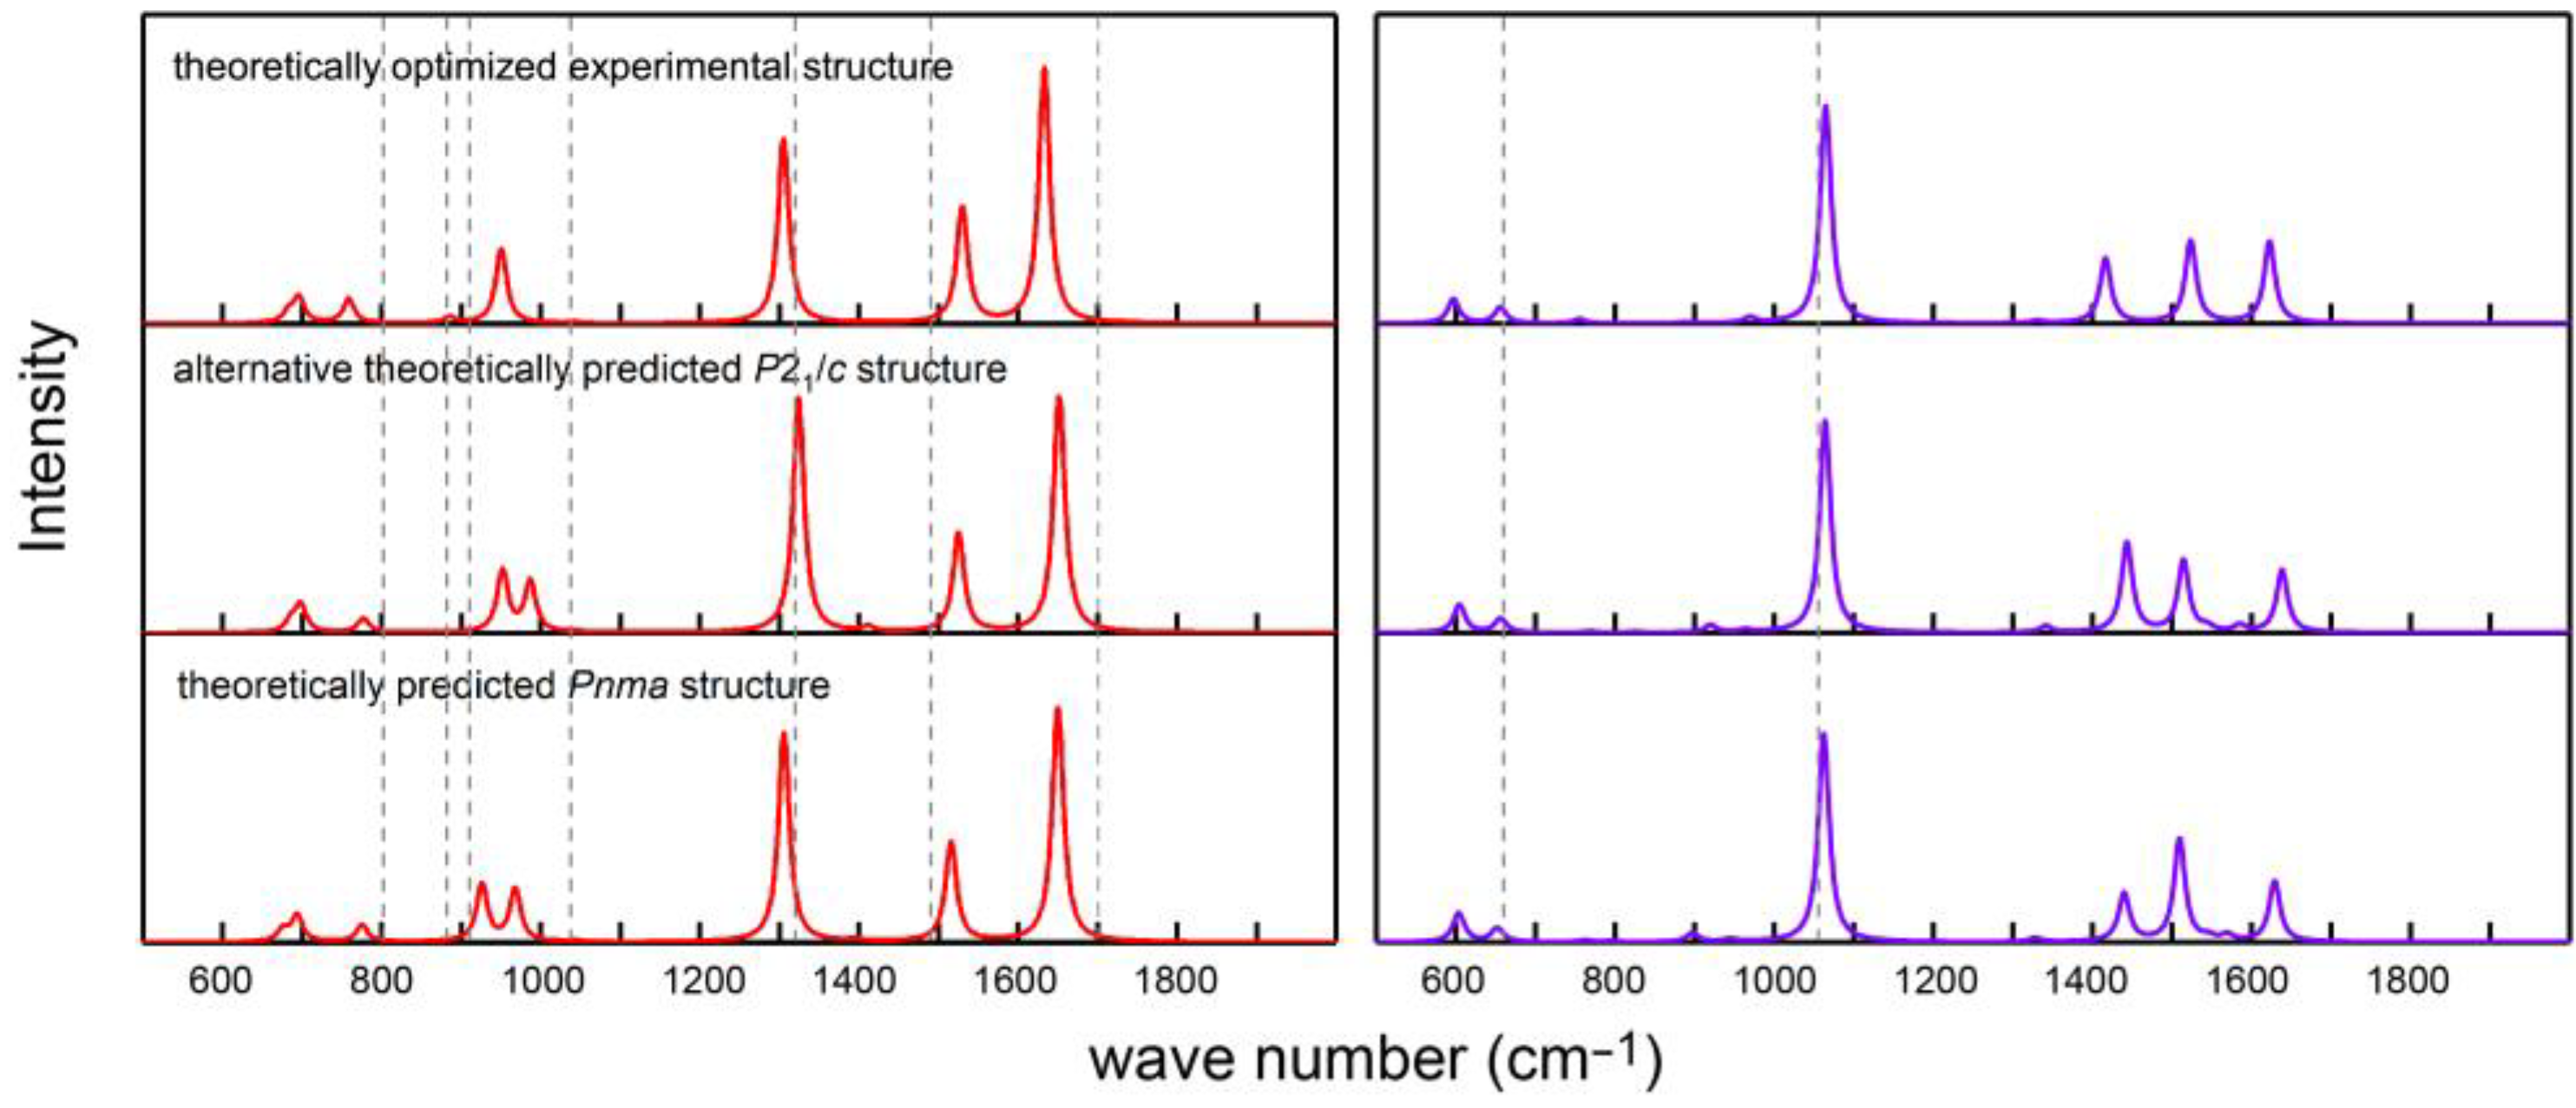
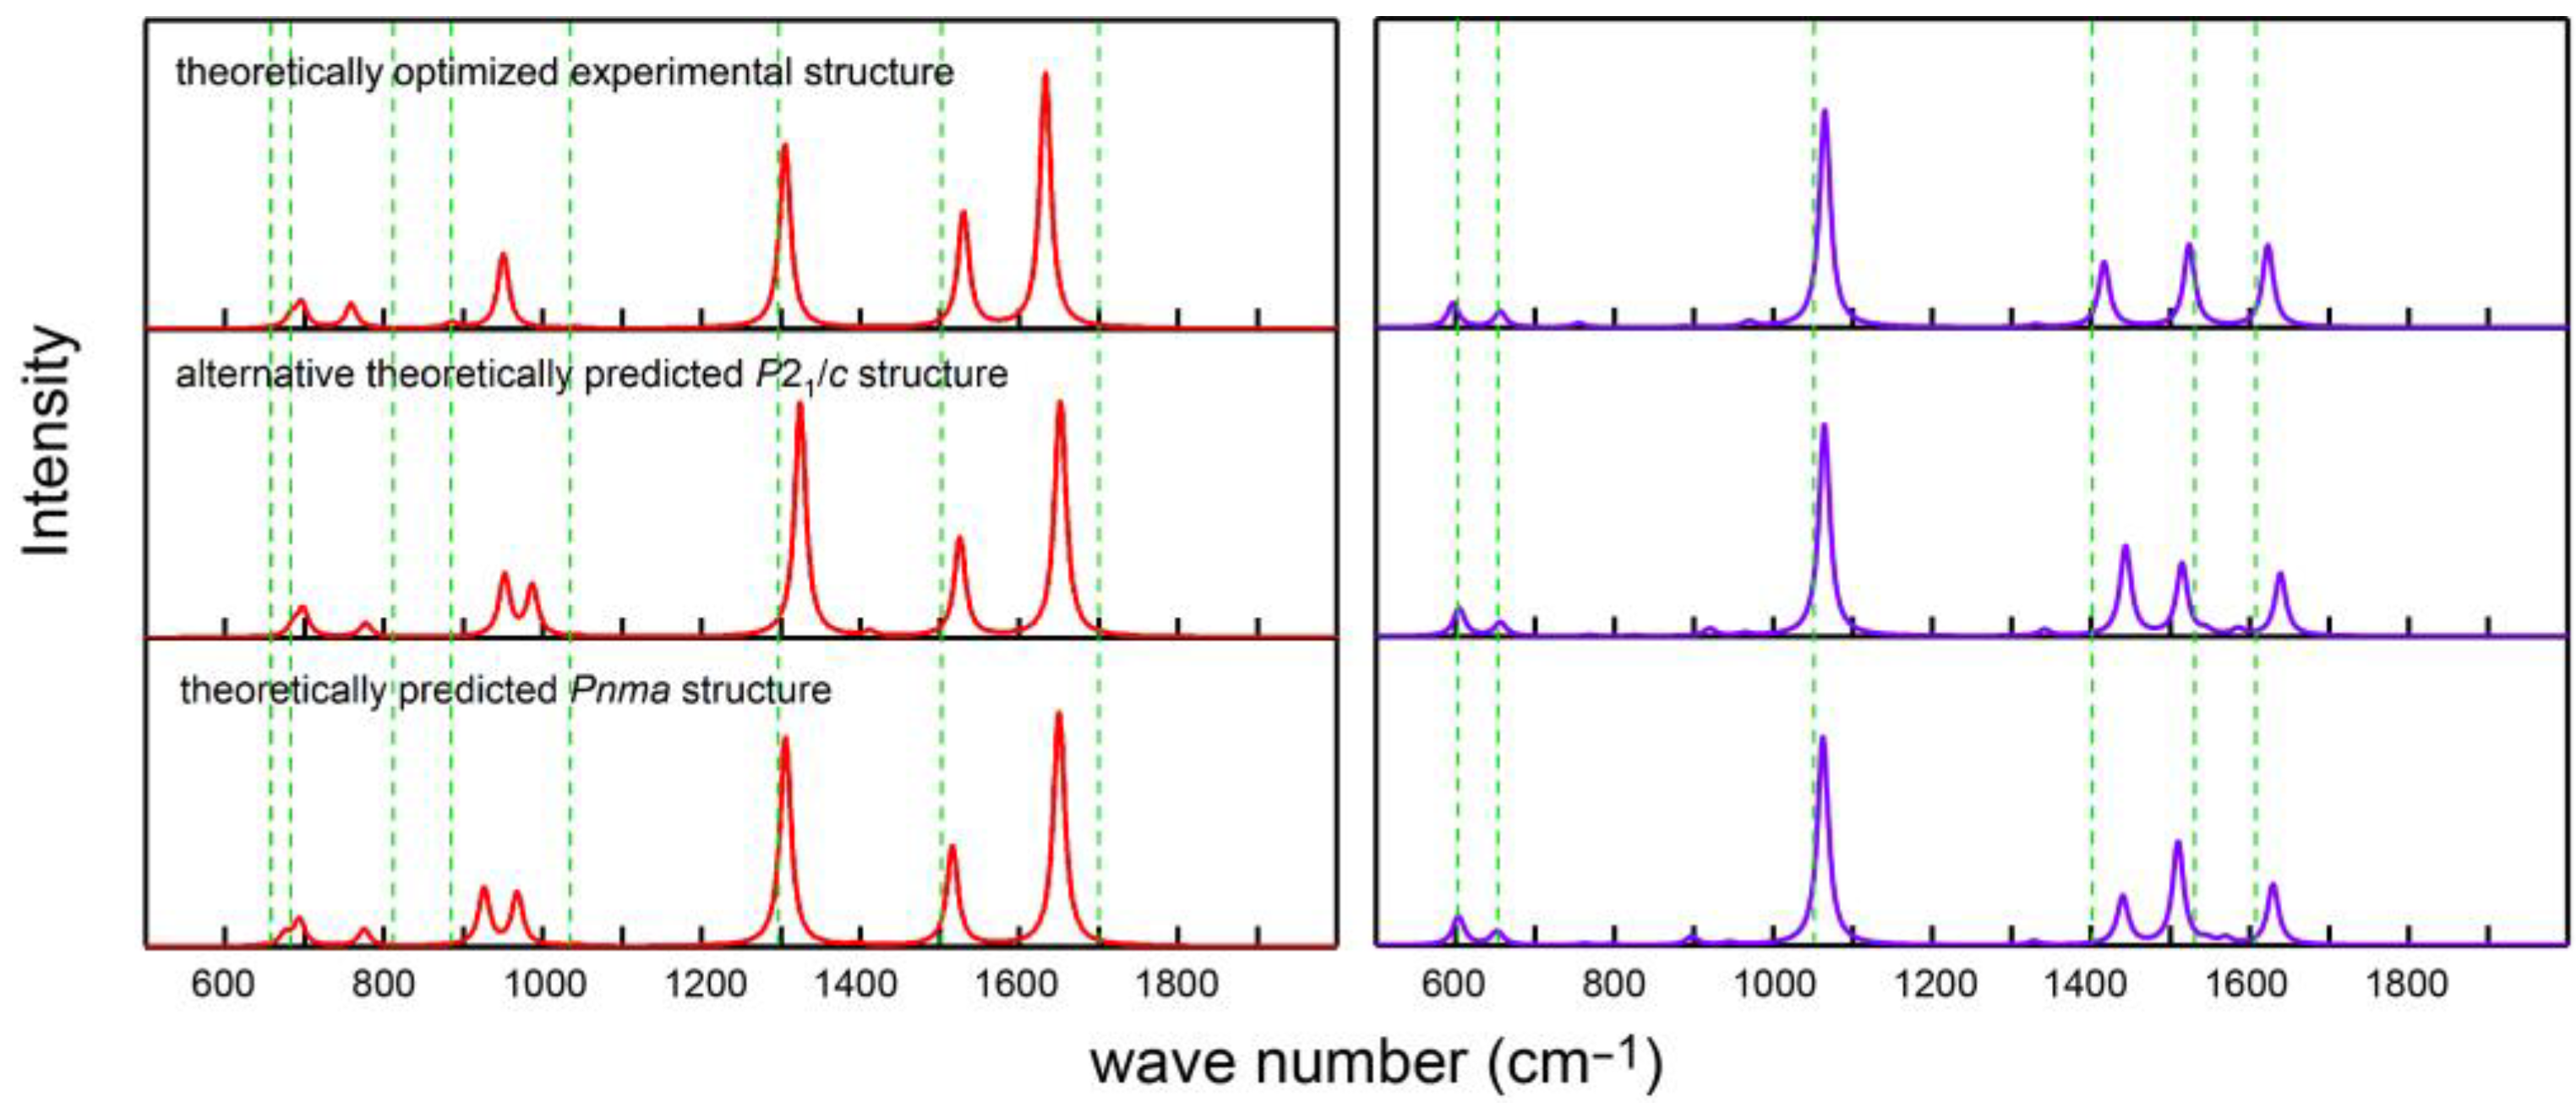
It is instructive to compare the calculated IR and Raman spectra of carbonic acid with those that have been published before. Figure 6 shows such a comparison with the experimental results [59] at ambient pressure indicating moderate (IR) to good (Raman) agreement, in particular for the experimental DFT-optimized structure; residual deviations may be related to the neglect of anharmonicity, temperature, in addition to other factors, as previously reported [12,60]. On the other hand, the calculations clearly evidence that the positions of the IR and Raman signals are almost unaffected by the crystal symmetry, thereby unsurprisingly highlighting the local nature of the molecular vibrations. It is somewhat surprising, however, that the match between theory and experiment does not become better if one analyzes the high-pressure experimental data [13] depicted in Figure A5, in particular because these lack some of the important Raman signals, probably due to experimental difficulties. Nonetheless, the influence of the pressure on the peak positions must be considered weak, simply by visually comparing Figure 6 with Figure A5.
The crystal structure of carbonic acid is fundamental in character and also unique, as other simple species for potential comparison are rather rare. One exception would be given by formic acid, H2CO2 = HCOOH, also exhibiting symmetric double hydrogen bonding in all known physical phases [61], namely gas, liquid, solid, matrix, and molecular beam, and its enthalpy of dimerization by two H bonds is 150.7 ± 0.8 kJ mol−1. A probably even more fitting species to compare to is given by trithio carbonic acid, H2CS3, thus including the higher homologue of oxygen. That molecule likewise crystallizes at lower temperature, but this time without external pressure, hence it was structurally clarified decades ago already [62,63]. In that pioneering study one finds planar SC(SH)2 molecules in the same P21/c space group with mean C=S = 1.65 and C–S = 1.73 Å distances, also linked through hydrogen-bridging bonds but leading to a helical arrangement of chains along the a direction and three-dimensionally connected by weaker contacts. We also note that this single-crystal X-ray structure analysis of H2CS3 made the authors recognize the C–S “single” bonds being shorter than the normal value (1.78 Å) and the C=S “double” bonds longer than anticipated (1.61 Å) such that significant π bonding in the CS3 triangle originating from C 2pz and S 3pz orbitals is indicated, a simple consequence of the molecular shape.

3. Conclusions

Summarizing, the monoclinic crystal structure of carbonic acid has been elucidated from a high-pressure neutron-diffraction study of the deuterated molecule and further analyzed from density-functional theory. One finds anti-anti shaped dimers with a symmetric double H bonding motif, the latter bonds being extraordinarily strong, and this structural motif further leads to molecular stripes along the monoclinic b axis; other polymorphs might be possible but there is no experimental evidence as yet. Careful inspection of the molecular shape reflects substantial π bonding in the central CO3 core, and a detailed comparison between molecule and periodic structure makes evident a massive influence of the internal crystal (Madelung) field affecting bond lengths, bond orders, bond energies, and also atomic charges. Hence, besides being a rather trivial molecular crystal, solid-state carbonic acid also resembles a typical inorganic salt. Prior experimental vibrational data are in moderate (IR) or good (Raman) accord with the theoretical simulations, but theory evidences their local character and their insensitivity to the given pressure. By means of this fundamental small-molecule structural study, we hope to catalyze further high-pressure experiments as regards the chemical reactivity of carbonic acid.

4. Materials and Methods

Neutron powder diffraction patterns were collected at the STRESS-SPEC instrument at the FRM II neutron source in Garching [18] using two wavelengths, 1.351 and 2.118 Å, and two 2θ ranges of 22.441–75.543° and 22.387–75.599°, respectively. To avoid reflections caused by the pressure apparatus, a radial collimator (field view = 2 mm) was used. Despite the (111), (200), and (220) reflections of the inner-cylinder alloy being visible at 38.25°, 44.45°, and 64.67° in the 1.351 Å diffraction pattern, no other pressure-cell signals were recorded. Three phases (D2CO3, CO2, and the Ni-Cr-Al fcc alloy of the container) were simultaneously taken into account for the neutron-data analysis. There was no evidence whatsoever for additional phases.
Manual structure solution inspired by the previous structure proposal [12] in space group Pnma (reproduced by our structure prediction) and further Rietveld refinement were carried out using the GSAS-II program system [19]. Despite some qualitative similarity of the data with the predicted Pnma structure for the strongest reflections around d = 2.35–2.6 Å, orthorhombic symmetry was clearly missing, so a reduction to the translationengleich subgroup P1121/a (= P21/c) was needed which eventually yielded unit cell parameters of a = 5.392(2) Å, b = 6.660(3) Å, c = 5.690(1) Å, and β = 92.66(3)°. Hence, the Z = 4 unit-cell volume is 204.1 Å3 and corresponds to a 30.1 cm3 molar D2CO3 volume, thereby questioning the previous triclinic unit cell [14]. To save parameters in the Rietveld refinement, the atomic distances and angles were softly restrained to C–O = 1.3 Å, O–D = 0.98 Å, O–C–O = 120°, and C–O–D = 109.54°, with all atoms also restrained to be in-plane. An alternative C–O restraining model using C–O = 1.43 Å and C=O = 1.23 Å proved inferior for quantum-chemical reasons, see text. Likewise, due to the intended presence of excess carbon dioxide in the form of CO2-I, its pattern served as an internal standard for the isotropic atomic displacement parameters under identical conditions in terms of p and T [17], namely Uiso = 0.040 Å2 for all carbon and 0.056 Å2 for all oxygen atoms. The Uiso parameters of the deuterium atoms were set to the 1.47-fold value of those of the neighboring oxygen atoms, as derived from the neutron study on D2O-VIII at about the same conditions [20]. Full details concerning the structure determination including two sets of raw diffraction data are available in CIF format and have been deposited as CCDC 2176140–2176141. These data can be obtained free of charge via www.ccdc.cam.ac.uk/data_request/cif accessed on 14 August 2022, or by emailing [email protected], or by contacting The Cambridge Crystallographic Data Centre, 12 Union Road, Cambridge CB2 1EZ, UK; fax: +44-1223-336033.
To verify the pressure measured by ruby fluorescence, it was additionally determined from the reflections of CO2-I using a three parameter Vinet equation-of-state model [21,22] namely,
p ( V ) = 3 B 0 X 2 ( 1 X ) e η ( 1 X ) ,
where X = (V/V0), η = 3/2(B0′ − 1), V0 = 50.63 Å3, B0 = 2.54 GPa and B0′ = 9.23. To obtain reasonable values of B0′, B0 and V0, the molecular volume of CO2-I was extrapolated to ambient pressure using experimental data [23]. As such, the molecular volume of 39.633 Å3 is equivalent to a calculated pressure of 1.85 GPa, in perfect numerical agreement with the pressure determined from ruby fluorescence.
Periodic DFT calculations were performed utilizing VASP 5.4.4.18 [30,31,32,33] using either the PBE exchange–correlation [34] or the HSE functional [35] and hard PAW pseudopotentials [36,37] together with dispersion corrections by the DFT-D3(BJ) approach [38,39]. Plane-wave basis functions up to an energy cutoff of 850 eV were included in the calculation and an external pressure of 2 GPa was considered throughout. For geometry optimizations, accurate convergence precision and a k-point spacing of 0.2 Å−1 were used; single-point calculations were performed using a 6 × 6 × 6 Monkhorst–Pack mesh [40].
Phonon calculations were conducted using the supercell approach in the PHONOPY code [41], with calculational parameters as in the static calculation. The phonon calculations also served to calculate the Born charges and dielectric constants for simulating the IR and Raman spectra [42]. Molecular dynamics (MD) simulations were carried out using NPT ensembles with a time step of 1 fs as implemented in MedeA VASP code [32,33,37]. A plane-wave energy cutoff of 500 eV and a single Γ point were used. The simulations were performed in 2 × 2 × 2 supercells containing 192 atoms for all structures at 2 GPa and 298 K.
Structural searches were conducted through a particle swarm optimization algorithm implemented in the CALYPSO code [45,46] resting on density-functional theory (see above). To ensure the diversity and reliability of the predicted structures, structure simulations were performed with models containing up to four formula units at 1, 2, 10, 20, 30, and 40 GPa, respectively.
The periodic single-point delocalized wavefunctions were unitarily transformed into a complete set of atomic-orbital-like wavefunctions of contracted Slater type by means of LOBSTER 4.1.0 [48,49,50,51,52]. The results were further analyzed by calculating Crystal Orbital Bond Indices (COBI), projected Crystal Orbital Hamilton Populations (COHP), wavefunction-based Löwdin charges, and automatic Madelung energies based on the latter.
Molecular bonding orbitals were generated from the plane-wave data using an accurate top-down frozen-density embedding approach [55] and a subsequent localization following the Pipek–Mezey algorithm [56], implemented into a development version of LOBSTER.
Molecular optimizations of ground-state and transition-state structures were carried out using Turbomole 7.5.1 [57] employing a PBE0-D3 hybrid density-functional approach [34] based on the def2-QZVP basis set [58]. Stationary points were verified by frequency analysis.

Supplementary Materials

The following supporting information can be downloaded at: https://www.mdpi.com/article/10.3390/inorganics10090132/s1. Data S1/2: Crystallographic information files (CIF) of deuterated carbonic acid including original neutron-diffraction data for λ = 1.351 Å/λ = 2.118 Å.

Author Contributions

Conceptualization, R.D.; methodology, S.B., D.C., A.M., M.H., D.S. and R.D.; investigation, S.B., D.C., A.M., M.H., D.S. and R.D.; structure determination, S.B., D.C., D.S. and R.D.; visualization, D.C., D.S. and R.D.; funding acquisition, R.D.; project administration, S.B. and R.D.; supervision, S.B., D.S. and R.D.; writing—original draft, R.D.; writing—review and editing, S.B., D.C., A.M., M.H., D.S. and R.D. All authors have read and agreed to the published version of the manuscript.

Funding

This work was supported by Deutsche Forschungsgemeinschaft through the Excellence Initiative of the German Federal and State Governments.

Data Availability Statement

The crystallographic data of D2CO3 for long and short wavelengths are provided in Supplementary Materials.

Acknowledgments

It is a pleasure to thank Ulli Englert and Gerhard Raabe for insightful comments.

Conflicts of Interest

The authors declare no conflict of interest.

Appendix A

Figure A1. Relative energies of various DFT-derived polymorphs of regular (left) and deuterated (right) carbonic acid at 2 GPa. PBE = Perdew–Burke–Ernzerhof functional, D3 = Grimme D3 dispersion correction, HSE = Heyd–Scuseria–Ernzerhof functional, ZPE = zero-point energy correction, G(300 K) = Gibbs energy at 300 K.
Inorganics 10 00132 g0a1
Figure A2. Phonon band structures of carbonic acid at a pressure of 2 GPa. Shown are those of (a) the theoretically optimized experimental structure based on a 3 × 3 × 3 supercell with 648 atoms, (b) the alternative theoretically predicted P21/c structure based on a 3 × 3 × 3 supercell with 648 atoms, and (c) the theoretically predicted Pnma structure based on a 2 × 3 × 2 supercell with 288 atoms.
Inorganics 10 00132 g0a2
Figure A3. Molecular-dynamics simulation of carbonic acid at 2 GPa and 298 K. Shown are the behaviors of the theoretically optimized experimental structure (left) and the alternative theoretically predicted P21/c structure (right).
Inorganics 10 00132 g0a3
Figure A4. π-bonding molecular orbitals in solid-state carbonic acid. The MOs have been localized from the periodic plane-wave data using an embedding approach (see text).
Inorganics 10 00132 g0a4
Figure A5. Calculated infrared (left) and Raman (right) spectra of H2CO3 at a pressure of 2 GPa. For comparison, the positions of the experimentally determined vibrations according to the high-pressure measurements [13] interpolated to 2 GPa are indicated as dashed grey lines.
Inorganics 10 00132 g0a5
Table A1. Neutron-diffraction based experimentally determined crystallographic data of deuterated carbonic acid.
FormulaD2CO3
Formula weight (g mol−1)64.04
Crystal systemMonoclinic
Space groupP21/c
Temperature (K)298
Pressure (GPa)1.85
a (Å)5.3917(22)
b (Å)6.661(4)
c (Å)5.6900(12)
β (°)92.657(28)
V3)204.12(12)
Z4
Density (g cm–3)2.0838
Radiationconstant-wavelength neutron
Wavelengths1.351 Å/2.118 Å
No. reflections refined869 (for 1.351 Å), 808 (for 2.118 Å)
R F 2   /   w R (%) 27.442/2.569 (for 1.351 Å), 23.847/2.696 (for 2.118 Å)
Table A2. Neutron-refined spatial parameters for deuterated carbonic acid at 1.85 GPa with all atoms on Wyckoff position 4e; the isotropic displacement parameters (Å2) were set to 0.040 for C, 0.056 for O, and 0.082 for D; see also text.
Atomxyz
C0.302(6)0.174(4)0.591(6)
O10.204(8)0.004(6)0.667(6)
O20.212(11)0.350(6)0.660(9)
O30.494(6)0.170(6)0.452(7)
D10.284(12)−0.119(5)0.608(9)
D20.295(11)0.469(5)0.595(10)
Table A3. DFT-optimized (PBE-D3) spatial parameters for deuterated carbonic acid at 2 GPa based on the experimentally refined crystal structure in space group P21/c; a = 4.8787, b = 6.5089, c = 6.2482 Å, β = 93.14°; see also text.
Atomxyz
C0.3410.2500.582
O10.2110.0840.633
O20.2110.4160.633
O30.5690.2500.496
D10.302−0.0450.577
D20.3020.5450.577
Table A4. Alternative lowest-energy DFT-optimized (PBE-D3) spatial parameters for deuterated carbonic acid at 2 GPa in space group P21/c with a = 6.4970, b = 5.6645, c = 5.2611 Å, β = 90.77°; see also text.
Atomxyz
C0.2480.5510.330
O10.0800.6180.213
O20.4140.6140.210
O30.2510.4350.534
D1−0.0480.5830.317
D20.5440.5800.315
Table A5. Integrated crystal-orbital bond indices (ICOBI) of carbonic acid extracted from plane waves for the experimentally determined crystal structure, the DFT-optimized experimental crystal structure (in bold face, see text), the lowest-energy theoretical crystal structure, and the isolated monomer (in bold face, see text).
BondExperimental Crystal StructureDFT-Optimized Experimental Crystal Structure (pzpz Contribution)Lowest-Energy Theoretical Crystal StructureIsolated Monomer
C–O11.23451.2116 (0.2892)1.20881.0795
C–O21.20221.2134 (0.2911)1.20881.0795
C–O31.34371.3860 (0.3814)1.40131.7151
O1–D10.77170.65690.65520.7852
O2–D20.77170.65690.65500.7852
O3···D1*0.27880.18240.1817
O3···D2*0.01780.18460.1849
Table A6. Integrated crystal-orbital Hamilton population (ICOHP, in eV) of carbonic acid extracted from plane waves for the experimentally determined crystal structure, the DFT-optimized experimental crystal structure (in bold face, see text), the lowest-energy theoretical crystal structure, and the isolated monomer (in bold face, see text).
BondExperimental Crystal StructureDFT-Optimized Experimental Crystal Structure (pzpz Contribution)Lowest-Energy Theoretical Crystal StructureIsolated Monomer(pzpz Contribution)
C–O1−14.798−14.619(−1.743)−14.659−11.236 (−1.344)
C–O2−14.830−14.645(−1.737)−14.658−11.236 (−1.344)
C–O3−15.199−16.315 (−2.176)−16.382−15.934 (−2.874)
O1–D1−7.519−7.833−7.885−7.511
O2–D2−7.519−7.833−7.883−7.511
O3···D1*−3.230−1.831−1.843
O3···D2*−0.070−1.856−1.892
Table A7. Wavefunction-based Löwdin atomic charges of carbonic acid extracted from plane waves for the experimentally determined crystal structure, the DFT-optimized experimental crystal structure (in bold face, see text), the lowest-energy theoretical crystal structure, and the isolated monomer (in bold face, see text).
AtomExperimental Crystal StructureDFT-Optimized Experimental Crystal StructureLowest-Energy Theoretical Crystal StructureIsolated Monomer
C0.660.640.650.66
O1−0.48−0.42−0.42−0.51
O2−0.48−0.42−0.42−0.51
O3−0.57−0.50−0.50−0.49
D10.380.350.350.43
D20.370.350.350.43
Synopsis The alchemical molecule carbonic acid and its crystal structure have been firmly established by a neutron-diffraction study, further corroborated by first-principles electronic-structure theory.
Inorganics 10 00132 i001

References

  1. Arrhenius, S. On the Influence of Carbonic Acid in the Air upon the Temperature of the Ground. Philos. Mag. 1896, 41, 237–276. [Google Scholar] [CrossRef]
  2. Ebbing, D.D.; Gammon, S.D. General Chemistry, 9th ed.; Houghton Mifflin Company: Boston, MA, USA; New York, NY, USA, 2009. [Google Scholar]
  3. Holleman, A.F.; Wiberg, E. Lehrbuch der Anorganischen Chemie, 102nd ed.; De Gruyter: Berlin, Germany, 2007. [Google Scholar]
  4. Gattow, G.; Gerwarth, U. On the Preparation of “Free Carbonic Acid”. Angew. Chem. Int. Ed. Engl. 1965, 4, 149. [Google Scholar] [CrossRef]
  5. Loerting, T.; Tautermann, C.; Kroemer, R.T.; Kohl, I.; Hallbrucker, A.; Mayer, E.; Liedl, K.R. On the Surprising Kinetic Stability of Carbonic Acid (H2CO3). Angew. Chem. Int. Ed. 2000, 39, 891–894. [Google Scholar] [CrossRef]
  6. Moore, M.H.; Khanna, R.K. Infrared and mass spectral studies of proton irradiated H2O + CO2 ice: Evidence for carbonic acid. Spectrochim. Acta A 1991, 4, 255–262. [Google Scholar] [CrossRef]
  7. Hage, W.; Hallbrucker, A.; Mayer, E. A polymorph of carbonic acid and its possible astrophysical relevance. J. Chem. Soc. Faraday Trans. 1995, 91, 2823–2826. [Google Scholar] [CrossRef]
  8. Bernard, J.; Seidl, M.; Kohl, I.; Liedl, K.R.; Mayer, E.; Gálvez, Ó.; Grothe, H.; Loerting, T. Spectroscopic Observation of Matrix-Isolated Carbonic Acid Trapped from the Gas Phase. Angew. Chem. Int. Ed. 2011, 50, 1939–1943. [Google Scholar] [CrossRef] [PubMed]
  9. Bernard, J.; Huber, R.G.; Liedl, K.R.; Grothe, H.; Loerting, T. Matrix Isolation Studies of Carbonic Acid—The Vapor Phase above the β-Polymorph. J. Am. Chem. Soc. 2013, 135, 7732−7737. [Google Scholar] [CrossRef]
  10. Reisenauer, H.P.; Wagner, J.P.; Schreiner, P.R. Gas-Phase Preparation of Carbonic Acid and Its Monomethyl Ester. Angew. Chem. Int. Ed. 2014, 53, 11766–11771. [Google Scholar] [CrossRef]
  11. Reddy, S.K.; Kulkarni, C.H.; Balasubramanian, S. Theoretical investigations of candidate crystal structures for β-carbonic acid. J. Chem. Phys. 2011, 134, 124511. [Google Scholar] [CrossRef]
  12. Saleh, G.; Oganov, A.R. Novel Stable Compounds in the C-H-O Ternary System at High Pressure. Sci. Rep. 2016, 6, 32486. [Google Scholar] [CrossRef] [Green Version]
  13. Wang, H.; Zeuschner, J.; Eremets, M.; Troyan, I.; Willams, J. Stable solid and aqueous H2CO3 from CO2 and H2O at high pressure and high temperature. Sci. Rep. 2016, 6, 19902. [Google Scholar] [CrossRef]
  14. Abramson, E.H.; Bollengier, O.; Brown, J.M. Water-carbon dioxide solid phase equilibria at pressures above 4 GPa. Sci. Rep. 2017, 7, 821. [Google Scholar] [CrossRef] [PubMed]
  15. George, J.; RWTH Aachen University, Aachen, Germany; Dronskowski, R.; RWTH Aachen University, Aachen, Germany. Internal unpublished data. 2014.
  16. Möller, A.; Marioneck, T.; Dronskowski, R. Efficient, low-cost cooling system for gloveboxes. Rev. Sci. Instrum. 2016, 87, 106102. [Google Scholar] [CrossRef] [PubMed]
  17. Benz, S.; Möller, A.; Marioneck, T.; Hofmann, M.; Brenk, J.; Dronskowski, R. Construction of a hybrid clamped cell for high-pressure neutron-diffraction experiments with a large diamond window. Rev. Sci. Instrum. 2019, 90, 026103. [Google Scholar] [CrossRef]
  18. Hofmann, M.; Schneider, R.; Seidl, G.A.; Rebelo-Kornmeier, J.; Garbe, U.; Schneider, R.; Wimpory, R.C.; Wasmuth, U.; Noster, U. The new materials science diffractometer STRESS-SPEC at FRM-II. Phys. B 2006, 385–386, 1035–1037. [Google Scholar] [CrossRef]
  19. Toby, B.H.; van Dreele, R.B. GSAS-II: The genesis of a modern open-source all purpose crystallography software package. J. Appl. Cryst. 2013, 46, 544–549. [Google Scholar] [CrossRef]
  20. Jorgensen, J.D.; Beyerlein, R.A.; Watanabe, N.; Worlton, T.G. Structure of D2O ice VIII from in situ powder neutron diffraction. J. Chem. Phys. 1984, 81, 3211–3214. [Google Scholar] [CrossRef]
  21. Vinet, P.; Ferrante, J.; Smith, J.R.; Rose, J.H. A universal equation of state for solids. J. Phys. C Solid State Phys. 1986, 19, L467–L473. [Google Scholar] [CrossRef]
  22. Schlosser, H.; Ferrante, J. Universality relationships in condensed matter: Bulk modulus and sound velocity. Phys. Rev. B 1988, 37, 4351–4357. [Google Scholar] [CrossRef]
  23. Olinger, B. The compression of solid CO2 at 296 K to 10 GPa. J. Chem. Phys. 1982, 77, 6255–6258. [Google Scholar] [CrossRef]
  24. Missong, R.; George, J.; Houben, A.; Hoelzel, M.; Dronskowski, R. Synthesis, Structure, and Properties of SrC(NH)3, a Nitrogen-Based Carbonate Analogue with the Trinacria Motif. Angew. Chem. Int. Ed. 2015, 54, 12171–12175. [Google Scholar] [CrossRef] [PubMed]
  25. Ozawa, T.C.; Kang, S.J. Balls&Sticks: Easy-to-use structure visualization and animation program. J. Appl. Crystallogr. 2004, 37, 679. [Google Scholar]
  26. Steiner, T. The Hydrogen Bond in the Solid State. Angew. Chem. Int. Ed. 2002, 41, 48–76. [Google Scholar] [CrossRef]
  27. Liedl, K.R.; Sekušak, S.; Mayer, E. Has the Dimer of Carbonic Acid a Lower Energy Than Its Constituents Water and Carbon Dioxide? J. Am. Chem. Soc. 1997, 119, 3782–3784. [Google Scholar] [CrossRef]
  28. Murillo, J.; David, J.; Restrepo, A. Insights into the structure and stability of the carbonic acid dimer. Phys. Chem. Chem. Phys. 2010, 12, 10963–10970. [Google Scholar] [CrossRef]
  29. Zapata–Escobar, A.D.; Andrea Murillo–López, J.; Hadad, C.Z.; Restrepo, A. Understanding the nature of bonding interactions in the carbonic acid dimers. J. Mol. Model. 2019, 25, 20. [Google Scholar] [CrossRef]
  30. Kresse, G.; Hafner, J. Ab initio molecular dynamics for liquid metals. Phys. Rev. B 1993, 47, 558. [Google Scholar] [CrossRef]
  31. Kresse, G.; Hafner, J. Ab initio molecular-dynamics simulation of the liquid-metal–amorphous-semiconductor transition in germanium. Phys. Rev. B 1994, 49, 14251. [Google Scholar] [CrossRef]
  32. Kresse, G.; Furthmüller, J. Efficiency of ab-initio total energy calculations for metals and semiconductors using a plane-wave basis set. Comput. Mat. Sci. 1996, 6, 15. [Google Scholar] [CrossRef]
  33. Kresse, G.; Furthmüller, J. Efficient iterative schemes for ab initio total-energy calculations using a plane-wave basis set. Phys. Rev. B 1996, 54, 11169–11186. [Google Scholar] [CrossRef]
  34. Perdew, J.P.; Burke, K.; Ernzerhof, M. Generalized Gradient Approximation Made Simple. Phys. Rev. Lett. 1996, 77, 3865–3868. [Google Scholar] [CrossRef] [PubMed] [Green Version]
  35. Krukau, A.V.; Vydrov, O.A.; Izmaylov, A.F.; Scuseria, G.E. Influence of the exchange screening parameter on the performance of screened hybrid functionals. J. Chem. Phys. 2006, 125, 224106. [Google Scholar] [CrossRef]
  36. Blöchl, P.E. Projector augmented-wave method. Phys. Rev. B 1994, 50, 17953–17979. [Google Scholar] [CrossRef] [PubMed]
  37. Kresse, G.; Joubert, D. From ultrasoft pseudopotentials to the projector augmented-wave method. Phys. Rev. B 1999, 59, 1758–1775. [Google Scholar] [CrossRef]
  38. Grimme, S.; Antony, J.; Ehrlich, S.; Krieg, H. A consistent and accurate ab initio parametrization of density functional dispersion correction (DFT-D) for the 94 elements H-Pu. J. Chem. Phys. 2010, 132, 154104. [Google Scholar] [CrossRef] [PubMed]
  39. Grimme, S.; Ehrlich, S.; Goerigk, L. Effect of the damping function in dispersion corrected density functional theory. J. Comput. Chem. 2011, 32, 1456–1465. [Google Scholar] [CrossRef]
  40. Monkhorst, H.J.; Pack, J.D. Special points for Brillouin-zone integrations. Phys. Rev. B 1976, 13, 5188–5192. [Google Scholar] [CrossRef]
  41. Togo, A.; Oba, F.; Tanaka, I. First principles phonon calculations in materials science. Scr. Mater. 2015, 108, 1–5. [Google Scholar] [CrossRef]
  42. Skelton, J.M.; Burton, L.A.; Jackson, A.J.; Oba, F.; Parker, S.C.; Walsh, A. Lattice dynamics of the tin sulphides SnS2, SnS and Sn2S3: Vibrational spectra and thermal transport. Phys. Chem. Chem. Phys. 2017, 19, 12452. [Google Scholar] [CrossRef]
  43. Hazen, R.M.; Mao, H.K.; Finger, L.W.; Hemley, R.J. Single-crystal X-ray diffraction of n-H2 at high pressure. Phys. Rev. B 1987, 36, 3944. [Google Scholar] [CrossRef]
  44. Oganov, A.R.; Glass, C.W. Crystal structure prediction using ab initio evolutionary techniques: Principles and applications. J. Chem. Phys. 2006, 124, 244704. [Google Scholar] [CrossRef] [PubMed] [Green Version]
  45. Wang, Y.; Lv, J.; Zhu, L.; Ma, Y. Crystal structure prediction via particle-swarm optimization. Phys. Rev. B 2010, 82, 094116. [Google Scholar] [CrossRef]
  46. Wang, Y.; Lv, J.; Zhu, L.; Ma, Y. CALYPSO: A method for crystal structure prediction. Comput. Phys. Commun. 2012, 183, 2063. [Google Scholar] [CrossRef]
  47. van Santen, R.A. The Ostwald step rule. J. Phys. Chem. 1984, 88, 5768–5769. [Google Scholar] [CrossRef]
  48. Dronskowski, R.; Blöchl, P.E. Crystal orbital Hamilton populations (COHP): Energy-resolved visualization of chemical bonding in solids based on density-functional calculations. J. Phys. Chem. 1993, 97, 8617–8624. [Google Scholar] [CrossRef]
  49. Deringer, V.L.; Tchougréeff, A.L.; Dronskowski, R. Crystal Orbital Hamilton Population (COHP) Analysis As Projected from Plane-Wave Basis Sets. J. Phys. Chem. A 2011, 115, 5461–5466. [Google Scholar] [CrossRef]
  50. Maintz, S.; Deringer, V.L.; Tchougréeff, A.L.; Dronskowski, R. Analytic projection from plane-wave and PAW wavefunctions and application to chemical-bonding analysis in solids. J. Comput. Chem. 2013, 34, 2557–2567. [Google Scholar] [CrossRef]
  51. Maintz, S.; Deringer, V.L.; Tchougréeff, A.L.; Dronskowski, R. LOBSTER: A tool to extract chemical bonding from plane-wave based DFT. J. Comput. Chem. 2016, 37, 1030–1035. [Google Scholar] [CrossRef]
  52. Nelson, R.; Ertural, C.; George, J.; Deringer, V.L.; Hautier, G.; Dronskowski, R. LOBSTER: Local orbital projections, atomic charges, and chemical-bonding analysis from projector-augmented-wave-based density-functional theory. J. Comput. Chem. 2020, 41, 1931–1940. [Google Scholar] [CrossRef]
  53. Müller, P.C.; Ertural, C.; Hempelmann, J.; Dronskowski, R. Crystal Orbital Bond Index: Covalent Bond Orders in Solids. J. Phys. Chem. C 2021, 125, 7959–7970. [Google Scholar] [CrossRef]
  54. Deringer, V.L.; Englert, U.; Dronskowski, R. Covalency of hydrogen bonds in solids revisited. Chem. Commun. 2014, 50, 11547–11549. [Google Scholar] [CrossRef]
  55. Schnieders, D.; Neugebauer, J. Accurate Embedding through Potential Reconstruction: A Comparison of Different Strategies. J. Chem. Phys. 2018, 149, 054103. [Google Scholar] [CrossRef] [PubMed]
  56. Pipek, J.; Mezey, P.G. A fast intrinsic localization procedure applicable for ab initio and semiempirical linear combination of atomic orbital wave functions. J. Chem. Phys. 1989, 90, 4916. [Google Scholar] [CrossRef]
  57. TURBOMOLE V7.5.1 2021. A Development of University of Karlsruhe and Forschungszentrum Karlsruhe GmbH, 1989–2007, TURBOMOLE GmbH, Since 2007. Available online: https://www.turbomole.org (accessed on 14 August 2022).
  58. Weigend, F.; Furche, F.; Ahlrichs, R. Gaussian basis sets of quadruple zeta valence quality for atoms H–Kr. J. Chem. Phys. 2003, 119, 12753–12762. [Google Scholar] [CrossRef]
  59. Kohl, I.; Winkel, K.; Bauer, M.; Liedl, K.R.; Loerting, T.; Mayer, E. Raman Spectroscopic Study of the Phase Transition of Amorphous to Crystalline β-Carbonic Acid. Angew. Chem. Int. Ed. 2009, 48, 26902694. [Google Scholar] [CrossRef]
  60. Malik, M.; Wysokiński, R.; Zierkiewicz, W.; Helios, K.; Michalska, D. Raman and Infrared Spectroscopy, DFT Calculations, and Vibrational Assignment of the Anticancer Agent Picoplatin: Performance of Long-Range Corrected/Hybrid Functionals for a Platinum(II) Complex. J. Phys. Chem. A 2014, 118, 6922–6934. [Google Scholar] [CrossRef]
  61. Balabin, R.M. Polar (Acyclic) Isomer of Formic Acid Dimer: Gas-Phase Raman Spectroscopy Study and Thermodynamic Parameters. J. Phys. Chem. A 2009, 113, 4910–4918. [Google Scholar] [CrossRef]
  62. Krebs, B.; Gattow, G. Kristallstruktur von Kohlenstoffsulfid-bis(hydrogensulfid) (Trithiokohlensäure). Naturwissenschaften 1964, 51, 554. [Google Scholar] [CrossRef]
  63. Krebs, Β.; Henkel, G.; Dinglinger, H.-J.; Stehmeier, G. Neubestimmung der Kristallstruktur von Trithiokohlensäure α-H2CS3 bei 140 Κ. Z. Krist. 1980, 153, 285–296. [Google Scholar]
Figure 1. Rietveld refinement of deuterated carbonic acid at 1.85 GPa. Shown are the results of the simultaneous refinement against the shorter (top) and longer (bottom) wavelengths with the measured (blue crosses), fitted (dark green line), and background (red) data including the Bragg peaks of CO2 (red), D2CO3 (light green), and the Ni-Cr-Al cell (blue) as well as the difference signal.
Inorganics 10 00132 g001
Figure 2. The crystal structure of carbonic acid. Shown is a perspective view [25] into the experimentally determined crystal structure (left) and the atomic numbering (right) of a dimer bonded through hydrogen-bridging bonds (dashed yellow lines); atoms generated by inversion have been indicated by asterisks, e.g., D1*.
Inorganics 10 00132 g002
Figure 3. Mesomerism of carbonic acid. Covalent (left) and ionic (right) mesomeric structures contribute to the shape of carbonic acid; the latter ionic ones widen the “double” and shorten the “single” bond, as found both in experiment and theory.
Inorganics 10 00132 g003
Figure 4. Possible molecular packings of carbonic acid. Packing in the experimental crystal structure on the left, showing stripes of H-bonded molecules running along the b direction (Table A3). On the right, we provide an alternative, energetically even lower polymorph found by density-functional theory in which the same stripes run along a but this time in a zig-zag stacking mode (Table A4).
Inorganics 10 00132 g004
Figure 5. Projected Crystal Orbital Hamilton Populations (COHP) of the bonds in solid-state carbonic acid. The plots indicate bonding/antibonding levels going to the right/left, in particular C–O “single” (far left), C=O “double” (left), O–D single (right) and hydrogen-bridging bonds (far right). The Fermi level has been set to zero.
Inorganics 10 00132 g005
Figure 6. Calculated infrared (left) and Raman (right) spectra of H2CO3 at a pressure of 2 GPa. For comparison, the positions of the experimentally determined vibrations under ambient-pressure conditions [59] are indicated as dashed green lines. O–H stretching vibrations appear at higher wavenumbers and have not been included.
Inorganics 10 00132 g006
Publisher’s Note: MDPI stays neutral with regard to jurisdictional claims in published maps and institutional affiliations.

