Article

Tutorial on Development of 3D Vasculature Digital Phantoms for Evaluation of Photoacoustic Image Reconstruction Algorithms

1
Richard and Loan Hill Department of Bioengineering, University of Illinois at Chicago, Chicago, IL 60607, USA
2
Department of Dermatology, University of Illinois at Chicago, Chicago, IL 60607, USA
*
Author to whom correspondence should be addressed.
Photonics 2022, 9(8), 538; https://doi.org/10.3390/photonics9080538
Submission received: 11 June 2022 / Revised: 12 July 2022 / Accepted: 26 July 2022 / Published: 31 July 2022
(This article belongs to the Special Issue Photoacoustic Imaging for Biomedical Applications)

Abstract

:
A synthetic phantom model is typically utilized to evaluate the initial performance of a photoacoustic image reconstruction algorithm. The characteristics of the phantom model (structural, optical, and acoustic) are required to be very similar to those of the biological tissue. Typically, generic two-dimensional shapes are used as imaging targets to calibrate reconstruction algorithms. However, these structures are not representative of complex biological tissue, and therefore the artifacts that exist in reconstructed images of biological tissue vasculature are ignored. Real data from 3D MRI/CT volumes can be extrapolated to create high-quality phantom models; however, these sometimes involve complicated pre-processing and mostly are challenging, due to the inaccessibility of these datasets or the requirement for approval to utilize the data. Therefore, it is necessary to develop a 3D tissue-mimicking phantom model consisting of different compartments with characteristics that can be easily modified. In this tutorial, we present an optimized development process of a generic 3D complex digital vasculature phantom model in Blender. The proposed workflow is such that an accurate and easily editable digital phantom can be developed. Other workflows for creating the same phantom will take much longer to set up and require more time to edit. We have made a few examples of editable 3D phantom models, which are publicly available to test and modify.

1. Introduction

Photoacoustic imaging (PAI) is an emerging hybrid modality based on photoacoustic techniques, where a nanosecond pulsed laser is utilized to induce thermoelastic expansion of tissue chromophores, which results in the emission of acoustic waves that are detected by ultrasound transducers for image formation [1,2,3,4,5,6,7]. PAI has gained popularity due to the utilization of high-contrast optical imaging and the superior penetration depth of ultrasound imaging [8,9,10,11]. PAI has shown promising capabilities, in terms of visualizing vascular, functional, and molecular changes within living tissue [11,12,13,14,15,16,17,18,19,20,21,22,23]. The choice of PA image reconstruction technique has a significant contribution to the quality of the final image. Therefore, comprehensive and effective evaluation of image reconstruction algorithms plays a crucial role in providing the best quality PA images. Digital phantoms are used in both photoacoustic microscopy and tomography [7,17,24,25,26,27,28,29,30,31,32,33,34,35,36,37,38,39].
After an image reconstruction method is tested on synthetic phantoms, it will be evaluated by more complex in vitro biological tissue phantoms and, eventually, on animals in vivo [40,41]. The main objective of synthetic phantom-based testing is to understand the preliminary performance of the image reconstruction technique and to optimize its parameters. Therefore, the characteristics of the synthetic phantom model (structural, optical, and acoustic) are required to be very similar to those of the actual biological tissue, so as to conduct an effective performance evaluation. Most of the time, computer-simulation employs simple numerical phantoms (generic two-dimensional structures of different shapes, i.e., circles, stars, straight lines, tubes, spheres) that oversimplify the PA imaging target and are in no way similar to actual complex anatomical structures [42]. Lou et al. [43] proposed a technique for developing a synthetic human breast phantom based on clinical contrast-enhanced magnetic resonance imaging (MRI). Their method was capable of incorporating the volumetric information and complex vasculature structures of human breast tissue. However, this method is complicated and without the freedom of modifying the vasculature pattern. Moreover, an image reconstruction expert may not have access to clinical datasets [43]. Therefore, a complex simulated imaging target development method that allows easy modifications, and yet actually represents the characteristics of a biological tissue with the flexibility for tuning its optical and acoustic properties, is essential.
In this tutorial, we explain the process of creating a 3D synthetic vasculature phantom using the Blender design tool, which allows the user to easily modify (size and orientation) and segment the designed phantom, to represent different vasculature patterns within specific organs. Blender is a free and open-source 3D computer graphics software toolset that was initially released in 1994 and developed by Blender Foundation, an independent public benefit organization. One of the implemented 3D phantoms was tested in k-wave simulation. The process steps for creating a 3D vasculature digital phantom are depicted in Figure 1. The 3D phantom model examples demonstrated in this tutorial have been made available to the public to test (data availability). More details on how to modify the different characteristics of the vasculature model are given in Appendix A.

2. Methods

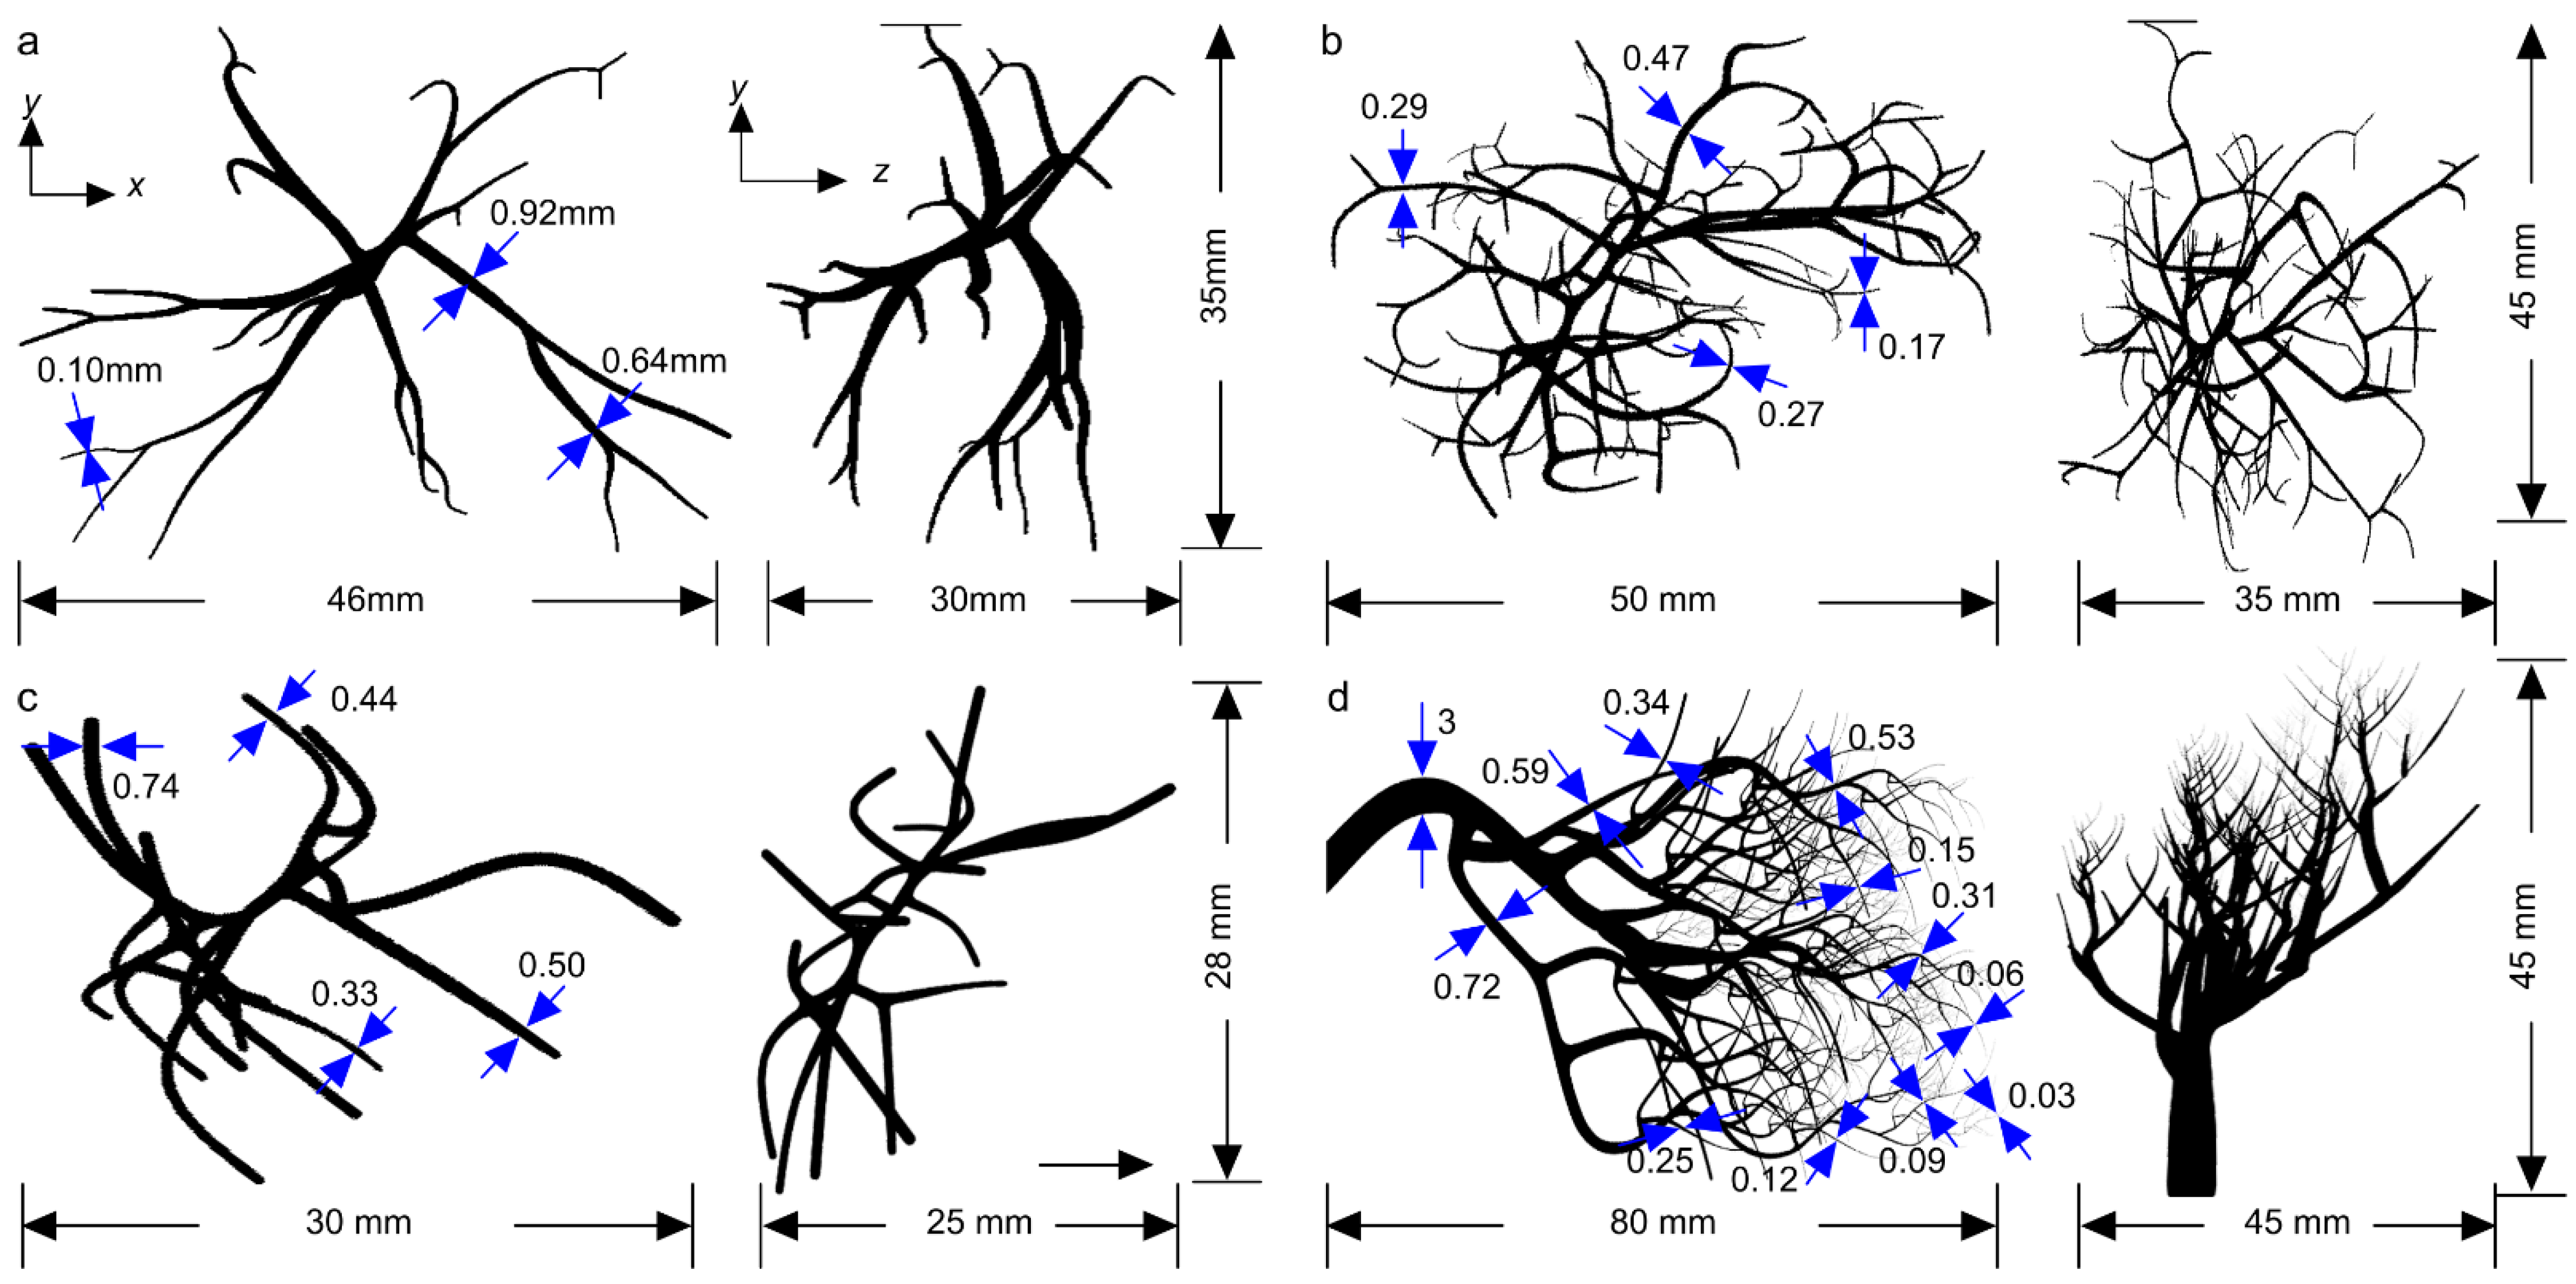
The process of mimicking a vasculature model in Blender starts with a flat square plane consisting of four vertex points, following with deletion of two of the vertex points, to make a line; this approach is used to make a line, because Blender does not have a tool to create a two-point (vertex point) line. Next, one of the points is extruded to make a new vertex point connected to the prior line. Using this process, branches of lines in the shape of the vasculature are created. Branches consisting of 4 vertex points in the shape of a “Y” and lines that have a curvature would have an additional point to bend the line. Next, modifier functions (a non-destructive way to manipulate the mesh data, without applying those changes) are utilized. There are several modifiers in Blender that simulate adding a dimension mesh. Modifiers can also be stacked on top of each other, to make more changes and give order to the mesh. After creating all the points of the vasculature, a subdivision modifier of level 3 is used to smooth all the lines. A modifier known as skin is added, which converts all vertex points into 2D planes perpendicular to their original lines. Vertices of adjacent planes are connected to create edges, and the edges are connected to form more complex planes. The skin modifier allows for scaling, so the diameter is gradually decreased toward the end of the vessel. The last step is to add an additional subdivision surface modifier of level 3, to make all the vessels circular. Several 3D vasculature phantom examples are illustrated in Figure 2.
The models developed in Blender consist of varying sizes of vasculatures, to represent a generic vasculature pattern, from µm to mm, (see the annotations in Figure 2) and with different orientations. Depending on the central frequency and bandwidth of the transducer, as well as its active area, number of elements, and element size, the vasculature diameters and overall size of the model are designed.

3. Results

The prepared 3D model in Blender is exported as a voxelized file (.stl format) and imported into Zemax software, to simulate the light propagation and eventually form the initial pressure map. With Zemax, various types of scattering and absorption phenomena similar to what take place in a biological tissue can be implemented. We chose Zemax for optical simulation because, unlike MMC, MCX, or TOAST, Zemax is capable of simulating light propagation with different optical sources, lenses, and optical fiber bundles. The Zemax simulation is as follow. First, the laser source (including the characteristics of the optical fiber, if applicable) and all the other optical components are defined in the Non-sequential Component Editor. Then, a detector is added. Next, the vessel is added inside the detector; the detector is a 3D matrix in which the voxel-wise fluence and absorbance values are stored.
An example of an optical setup in Zemax is shown Figure 3a. First, the material type for optical components is defined and optical characteristics are assigned to the voxels of the digital vessel phantom (we used the vessel phantom in Figure 1a as an example). For all the optical components, we use N-BK7 (a standard material available in the SCHOTT catalog). The optical properties assigned to the vessel phantom are as follow: refractive index, 1.37; absorption coefficient, 111.99 cm−1; scattering coefficient, 100 cm−1; mean path, 0.1; and anisotropy factor, 0.9. We then run a ray-tracing simulation; the number of rays in the simulation depends on the desired accuracy and precision; a typical number of rays is 10 million. In the ray trace control window, we check box the split rays and scatter rays and then click on trace to start the ray tracing, and the volume detector voxel values are saved using the detector viewer window. Figure 3b,c shows the absorbance and fluence map at the 87th slice of the detector volume, respectively. For the acoustic simulation, we modeled an L7-4 linear array transducer in the k-wave Matlab toolbox. A total of 234-point sources (78 × 3) were used to construct a single element of the L7-4 (the size of a single element is 7 mm × 0.283 mm), to account for directivity; the same design was used for all 128 elements of L7-4. The number of voxels in k-wave and grid size are determined according to the central frequency of the transducer and its bandwidth. Figure 4a shows the vasculature phantom simulated in a linear array configuration. In Figure 4b, the cross-section of the initial pressure map at the specified imaging plane, indicated by a dotted line in Figure 4a, is shown. The reconstructed image of the specified imaging plane using the time-reversal algorithm is shown in Figure 4c. The reconstructed image contains some artifacts generated from the PA signals of other branches of the vasculature.
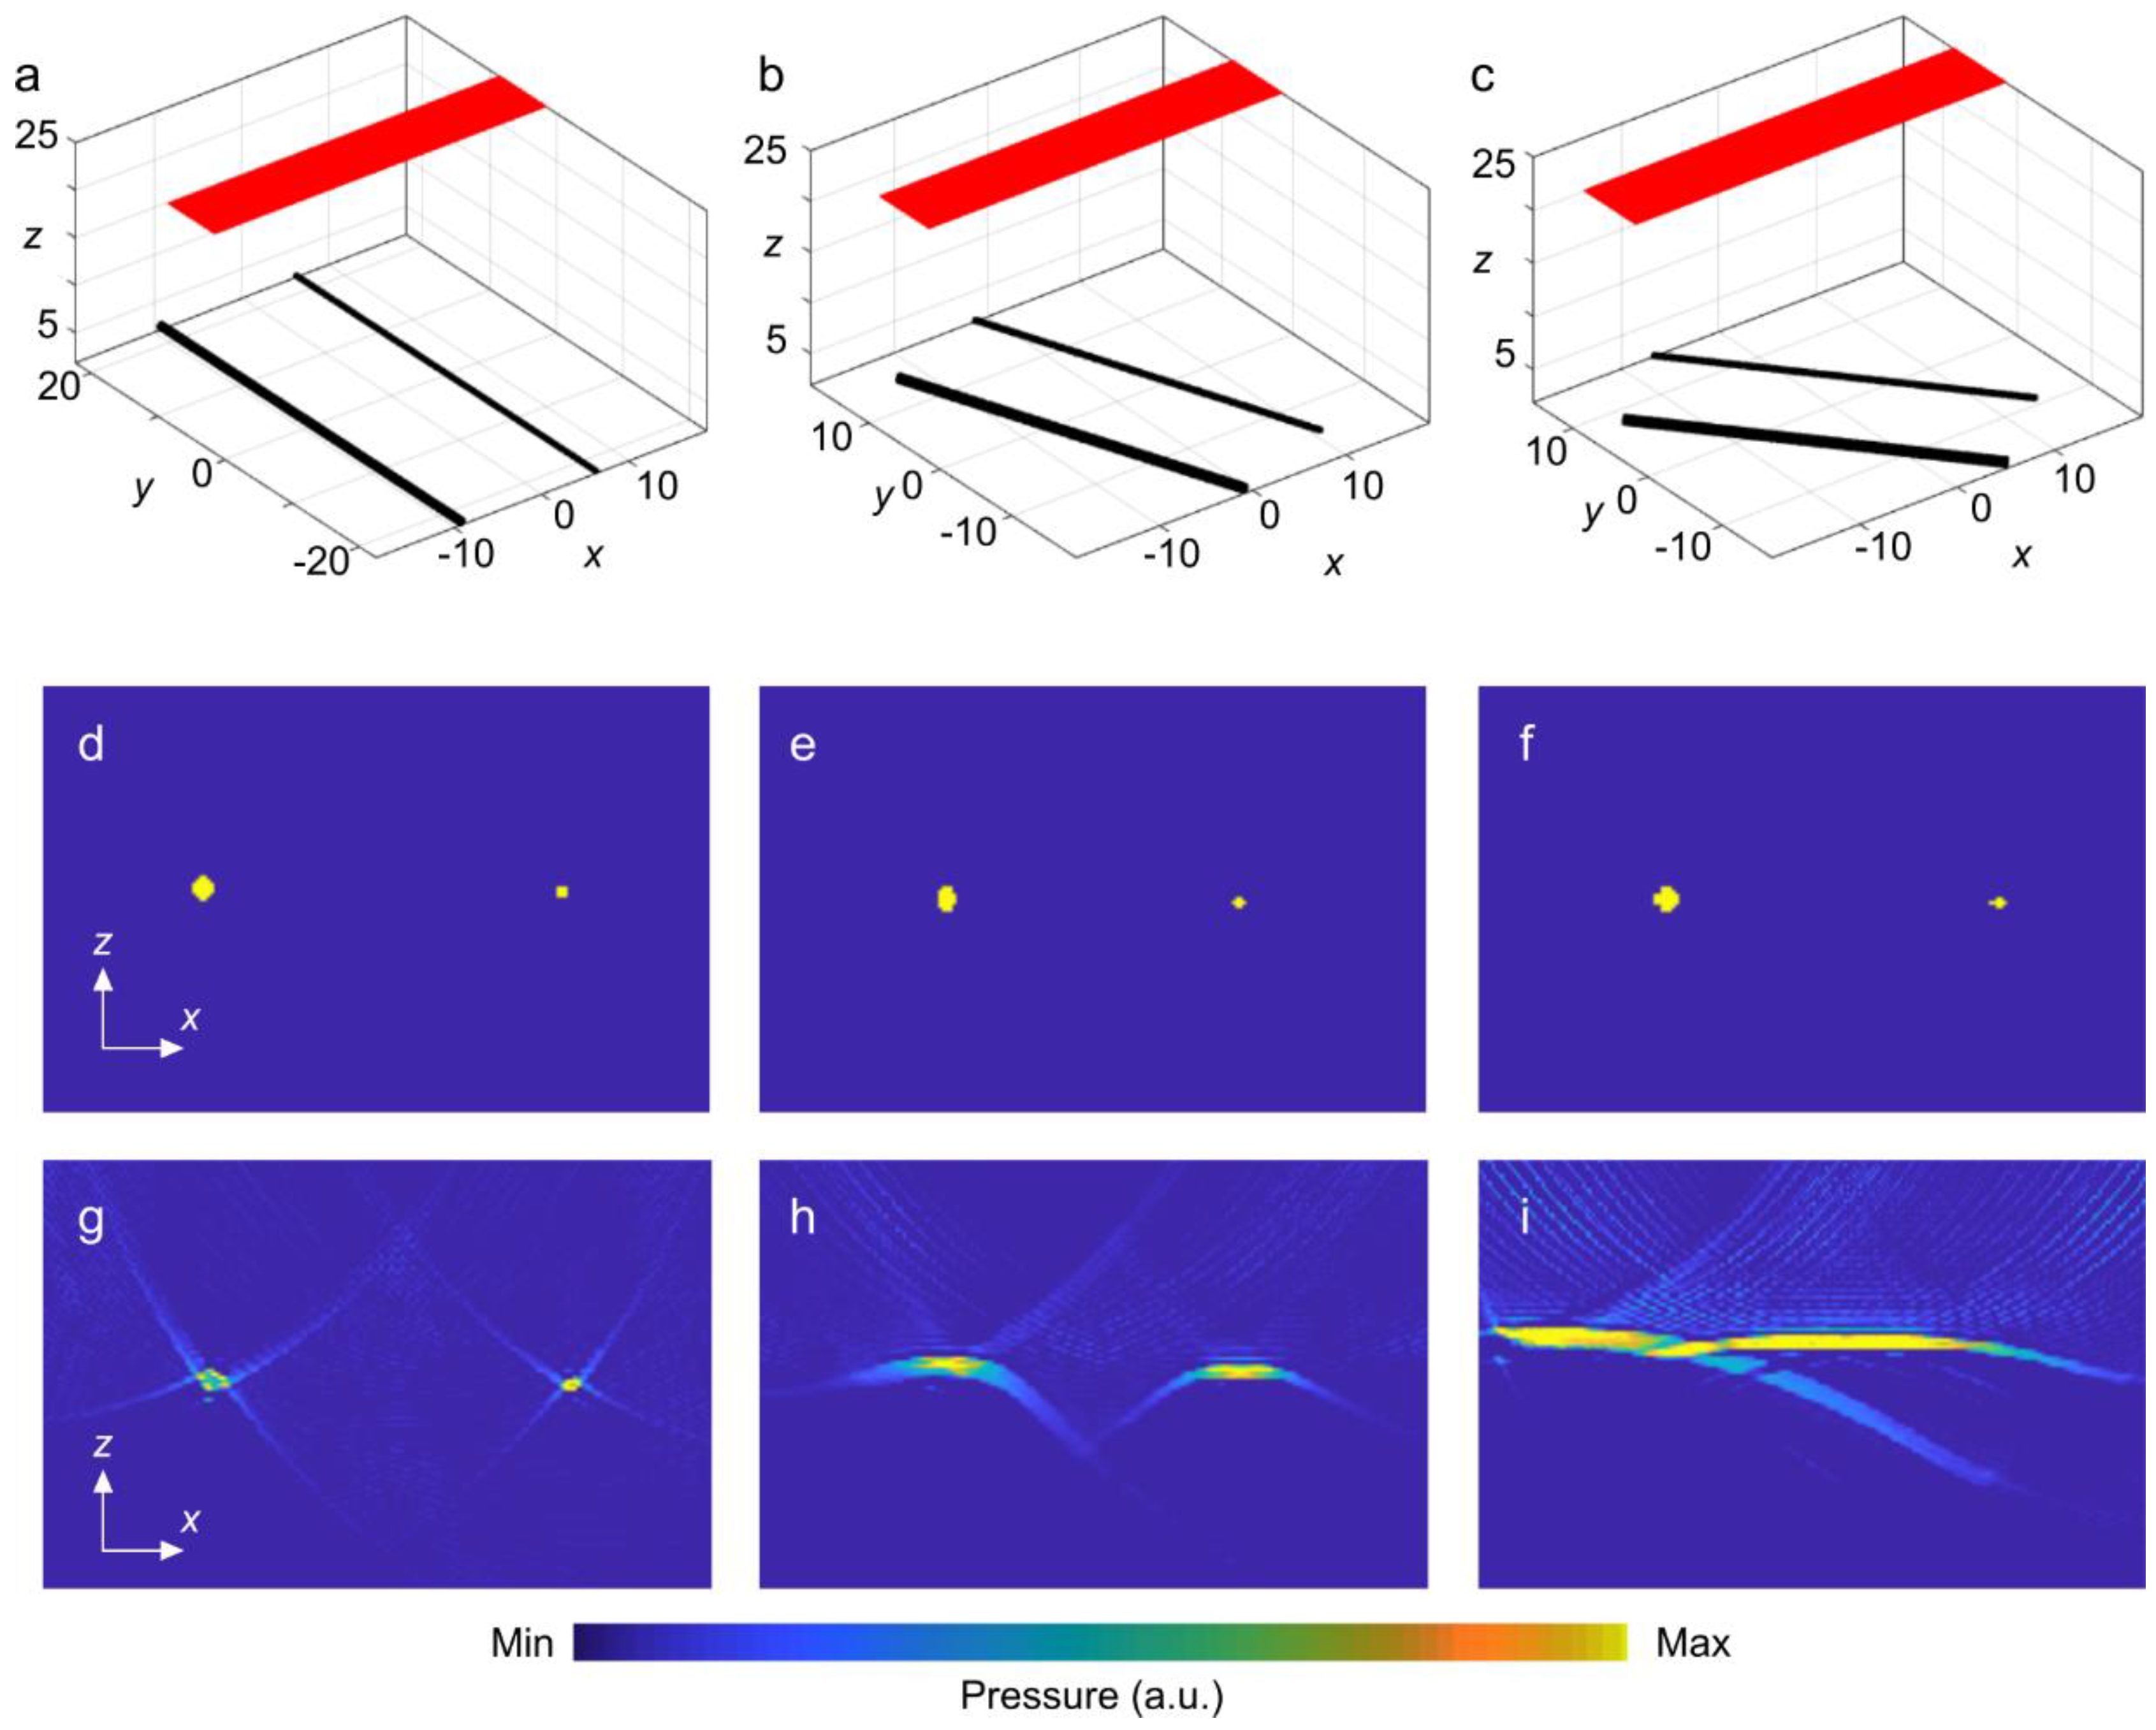
To demonstrate the effect of PA signals generated from other branches on image quality, i.e., the limited view problem, which is a common phenomenon in complex biological tissue (e.g., brain vasculature), we considered simple cylinders aligned to the elevational plane (90 degrees to the lateral plane) of the simulated L7-4 probe. In the next two simulations, they were rotated in the lateral plane by 20° and 45° (Figure 5b,c). The diameters of these cylinders were 0.5 mm and 1 mm. The distance between the transducer array and imaging targets was 25 mm in the axial direction. The initial pressure maps are depicted in Figure 5d–f. It is evident from the reconstructed images (Figure 5g–i) that the artifact becomes more apparent with the rotation angle versus the orientation of the transducer.

4. Conclusions

It is common practice to evaluate and compare the performance of a newly developed or updated reconstruction algorithm with other commonly used image reconstruction techniques. The evaluation is usually performed on simple imaging targets, with no resemblance to actual biological tissue. Therefore, many reconstruction techniques fail to perform well when utilized on an actual experimentally acquired dataset. Preparing digital phantoms using established imaging modalities such as MRI or CT is challenging, mainly because of the availability of data and sometimes due to postprocessing. Here, we presented steps for the development of an easily modifiable 3D complex imaging target using Blender. Editable versions of the digital phantoms shown in Figure 2 have been made available to the public to test and modify.

Author Contributions

Conceptualization, K.A.; methodology, S.M.R., A.K. and R.M.; software, S.M.R., A.K. and R.M. validation, S.M.R., R.M. and K.A.; formal analysis, S.M.R., A.K. and R.M.; resources, K.A.; writing-original draft preparation, S.M.R., A.K., R.M. and K.A.; writing-review and editing, R.M. and K.A.; visualization, R.M. and K.A.; supervision, K.A.; funding acquisition, K.A. All authors have read and agreed to the published version of the manuscript.

Funding

This work was supported by the National Institutes of Health R01EB027769-01 and R01EB028661-01.

Institutional Review Board Statement

Not applicable.

Informed Consent Statement

Not applicable.

Data Availability Statement

The Blender .stl and SVid_1.mp4 files are available in FigShare at: https://doi.org/10.6084/m9.figshare.19765582.v3, accessed on 12 July 2022.

Conflicts of Interest

The authors declare no conflict of interest.

Appendix A

Some further information on the workflow of Blender is provided below. With any project in Blender, there are many ways to get to the final result. The workflow intended for this project was selected because it is very easy to create, is accurate, and allows for quick editing. Other workflows to create the same result will take much longer to set up and additionally will require more time to edit. Since the scope of this tutorial was to create a vasculature phantom, and not intended to teach the program Blender, it is highly recommended that new users familiarize themselves with the user interfaces (UIs) beforehand. There are many free tutorials for understanding UI elements, shortcuts, and viewport controls.
In a new document, proceed to create a plane by using the quick keys Shift + A and creating a plane. Next, we need to press Tab to enter edit mode. This mode allows manipulating individual vertex points. Holding the Shift key down, we need to select two of the four vertex points. Press X to bring up the deletion menu and select delete vertices. We are now left with a line. By selecting one of the points on the line and by pressing E and by dragging the cursor, we can extrude the line. To finish extruding and lock into the desired last point, we need to press the select button (left mouse button). This process will create as many lines as E is pressed. At this point, if we want to manipulate the position of any point on the line, we can select it and press G to move it. After it is in the new position, we need to press down the select button to lock the new position. To create a branch, we need to select the root point that we want to use as the branch and make multiple extrusions from that point. Next, we use a procedural modifier that is non-destructive to simulate the smoothness and diameter of the vessels. We need to go to the Modifiers menu and select Subdivision Surface, then add a new modifier called Skin. We then need to make sure that we are in wireframe viewport mode on the top right of our viewport screen, to see vertex points within the structure. Additionally, the levels were increased to 3 on the Subdivision Surface modifier. Next, we need to select the first vertex point on the vasculature model and select the mark root button. This denotes the center of the vasculature. To increase or decrease the size of the branches, we need to press Ctrl + a and drag the cursor closer or further away from the selected vertex point. We can lock to the new size by pressing select. Once all the vertex points are adjusted to the right size, the last step is to add another Subdivision surface modifier to smooth out the vasculature edge. At this point, we need to change the viewport shading to solid. Please note, a level 3 Subdivision Surface was used. Any of these steps can be used to edit and change the structure without needing any new information on the workflow. A supplementary video (SVid_1.mp4) is available that demonstrates the process steps of creating and modifying the vasculature pattern, with the flexibility of defining the vessel diameters.

References

  1. Fatima, A.; Kratkiewicz, K.; Manwar, R.; Zafar, M.; Zhang, R.; Huang, B.; Dadashzadeh, N.; Xia, J.; Avanaki, K.M. Review of cost reduction methods in photoacoustic computed tomography. Photoacoustics 2019, 15, 100137. [Google Scholar] [CrossRef] [PubMed]
  2. Manwar, A.; Kratkiewicz, K.; Nasiriavanaki, M.R. Photoacoustic Imaging: A Promising Alternative to Transcranial Ultrasound. Res. J. Photonics 2018, 2, 411–420. [Google Scholar]
  3. Zafar, M.; Kratkiewicz, K.; Manwar, R.; Avanaki, M. Low-cost fast photoacoustic computed tomography: Phantom study. In Proceedings of the Photons Plus Ultrasound: Imaging and Sensing 2019, San Francisco, CA, USA, 1–6 February 2019; p. 108785V. [Google Scholar]
  4. Mozaffarzadeh, M.; Mahloojifar, A.; Orooji, M.; Adabi, S.; Nasiriavanaki, M. Double-Stage Delay Multiply and Sum Beamforming Algorithm: Application to Linear-Array Photoacoustic Imaging. IEEE Trans. Biomed. Eng. 2017, 65, 31–42. [Google Scholar] [PubMed] [Green Version]
  5. Mozaffarzadeh, M.; Mahloojifar, A.; Orooji, M.; Kratkiewicz, K.; Adabi, S.; Nasiriavanaki, M. Linear-array photoacoustic imaging using minimum variance-based delay multiply and sum adaptive beamforming algorithm. J. Biomed. Opt. 2018, 23, 026002. [Google Scholar] [CrossRef]
  6. Omidi, P.; Zafar, M.; Mozaffarzadeh, M.; Hariri, A.; Haung, X.; Orooji, M.; Nasiriavanaki, M. A novel dictionary-based image reconstruction for photoacoustic computed tomography. Appl. Sci. 2018, 8, 1570. [Google Scholar] [CrossRef] [Green Version]
  7. Mohammadi, L.; Behnam, H.; Tavakkoli, J.; Avanaki, M.R.N. Skull’s Photoacoustic Attenuation and Dispersion Modeling with Deterministic Ray-Tracing: Towards Real-Time Aberration Correction. Sensors 2019, 19, 345. [Google Scholar] [CrossRef] [PubMed] [Green Version]
  8. Zhang, P.; Li, L.; Lin, L.; Shi, J.; Wang, L.V. Applications. In vivo superresolution photoacoustic computed tomography by localization of single dyed droplets. Light Sci. Appl. 2019, 8, 36. [Google Scholar] [CrossRef] [Green Version]
  9. Schoonover, R.W.; Anastasio, M.A. Image reconstruction in photoacoustic tomography involving layered acoustic media. JOSA A 2011, 28, 1114–1120. [Google Scholar] [CrossRef] [Green Version]
  10. Bar-Hillel, Y. An examination of information theory. Philos. Sci. 1955, 22, 86–105. [Google Scholar] [CrossRef]
  11. Xia, J.; Yao, J.; Wang, L.V. Photoacoustic tomography: Principles and advances. Electromagn. Waves Camb. Mass. 2014, 147, 1–22. [Google Scholar] [CrossRef] [Green Version]
  12. Wang, L.V. Tutorial on Photoacoustic Microscopy and Computed Tomography. IEEE J. Sel. Top. Quantum Electron. 2008, 14, 171–179. [Google Scholar] [CrossRef] [Green Version]
  13. Wang, L.V.; Hu, S. Photoacoustic Tomography: In Vivo Imaging from Organelles to Organs. Science 2012, 335, 1458–1462. [Google Scholar] [CrossRef] [PubMed] [Green Version]
  14. Yao, J.; Wang, L.V. Photoacoustic microscopy. Laser Photonics Rev. 2013, 7, 758–778. [Google Scholar] [CrossRef] [PubMed]
  15. Zhou, Y.; Yao, J.; Wang, L.V. Tutorial on photoacoustic tomography. J. Biomed. Opt. 2016, 21, 061007. [Google Scholar] [CrossRef] [Green Version]
  16. Manwar, R.; Hosseinzadeh, M.; Hariri, A.; Kratkiewicz, K.; Noei, S.; Avanaki, M.R.N. Photoacoustic Signal Enhancement: Towards Utilization of Low Energy Laser Diodes in Real-Time Photoacoustic Imaging. Sensors 2018, 18, 3498. [Google Scholar] [CrossRef] [Green Version]
  17. Zafar, M.; Kratkiewicz, K.; Manwar, R.; Avanaki, M. Development of Low-Cost Fast Photoacoustic Computed Tomography: System Characterization and Phantom Study. Appl. Sci. 2019, 9, 374. [Google Scholar] [CrossRef] [Green Version]
  18. Manwar, R.; McGuire, L.; Shoo, A.; Charbel, F.; Pillers, D.-A.; Avanaki, K. Cerebral blood oxygenation measurement in sheep brain in-vivo using transfontanelle photoacoustic spectroscopy. In Proceedings of the Photons Plus Ultrasound: Imaging and Sensing 2022, San Francisco, CA, USA, 3 March 2022; Volume 11960, pp. 248–255. [Google Scholar]
  19. Wang, L.V. Photoacoustic Imaging and Spectroscopy; CRC Press: Boca Raton, FL, USA, 2009. [Google Scholar]
  20. Wang, L.V.; Yao, J. A practical guide to photoacoustic tomography in the life sciences. Nat. Methods 2016, 13, 627. [Google Scholar] [CrossRef]
  21. Kratkiewicz, K.; Manwar, R.; Rajabi-Estarabadi, A.; Fakhoury, J.; Meiliute, J.; Daveluy, S.; Mehregan, D.; Avanaki, K.M. Photoacoustic/Ultrasound/Optical Coherence Tomography Evaluation of Melanoma Lesion and Healthy Skin in a Swine Model. Sensors 2019, 19, 2815. [Google Scholar] [CrossRef] [PubMed] [Green Version]
  22. Manwar, R.; Kratkiewicz, K.; Avanaki, K. Overview of Ultrasound Detection Technologies for Photoacoustic Imaging. Micromachines 2020, 11, 692. [Google Scholar] [CrossRef] [PubMed]
  23. MManwar, R.; Zafar, M.; Xu, Q. Signal and Image Processing in Biomedical Photoacoustic Imaging: A Review. Optics 2020, 2, 1–24. [Google Scholar] [CrossRef]
  24. Manwar, R.; Li, X.; Mahmoodkalayeh, S.; Asano, E.; Zhu, D.; Avanaki, K. Deep learning protocol for improved photoacoustic brain imaging. J. Biophotonics 2020, 13, e202000212. [Google Scholar] [CrossRef] [PubMed]
  25. Kratkiewicz, K.; Manwar, R.; Zafar, M.; Ranjbaran, S.M.; Mozaffarzadeh, M.; de Jong, N.; Ji, K.; Avanaki, K. Development of a Stationary 3D Photoacoustic Imaging System Using Sparse Single-Element Transducers: Phantom Study. Appl. Sci. 2019, 9, 4505. [Google Scholar] [CrossRef] [Green Version]
  26. Matchynski, J.I.; Manwar, R.; Kratkiewicz, K.J.; Madangopal, R.; Lennon, V.A.; Makki, K.M.; Reppen, A.L.; Woznicki, A.R.; Hope, B.T.; Perrine, S.A. Direct measurement of neuronal ensemble activity using photoacoustic imaging in the stimulated Fos-LacZ transgenic rat brain: A proof-of-principle study. Photoacoustics 2021, 24, 100297. [Google Scholar] [CrossRef] [PubMed]
  27. Mozaffarzadeh, M.; Mahloojifar, A.; Nasiriavanaki, M.; Orooji, M. Eigenspace-based minimum variance adaptive beamformer combined with delay multiply and sum: Experimental study. In Proceedings of the Photonics in Dermatology and Plastic Surgery 2018, San Francisco, CA, USA, 27–28 January 2018; p. 1046717. [Google Scholar]
  28. Zafar, M.; Manwar, R.; Avanaki, K. High-fidelity compression for high-throughput photoacoustic microscopy systems. J. Biophotonics 2022, 15, e202100350. [Google Scholar] [CrossRef] [PubMed]
  29. Manwar, R.; Kratkiewicz, K.; Avanaki, K. Investigation of the effect of the skull in transcranial photoacoustic imaging: A preliminary ex vivo study. Sensors 2020, 20, 4189. [Google Scholar] [CrossRef]
  30. Manwar, R.; Benavides Lara, J.; Prakash, R.; Ranjbaran, S.M.; Avanaki, K. Randomized Multi-Angle Illumination for Improved Linear Array Photoacoustic Computed Tomography in Brain. J. Biophotonics 2022, e202200016. [Google Scholar] [CrossRef] [PubMed]
  31. Hariri, A.; Omidi, P.; Nasiriavanaki, M. Resting-state functional connectivity measurement in the mouse brain using a low cost photoacoustic computed tomography. In Proceedings of the Laser Science, Rochester, NY, USA, 17–21 October 2016; p. JW4A.62. [Google Scholar]
  32. Mohammadi, L.; Behnam, H.; Tavakkoli, J.; Avanaki, K. Skull acoustic aberration correction in photoacoustic microscopy using a vector space similarity model: A proof-of-concept simulation study. Biomed. Opt. Express 2020, 11, 5542–5556. [Google Scholar] [CrossRef] [PubMed]
  33. Kratkiewicz, K.; Manwar, R.; Zhou, Y.; Mozaffarzadeh, M.; Avanaki, K. Technical considerations in the Verasonics research ultrasound platform for developing a photoacoustic imaging system. Biomed. Opt. Express 2021, 12, 1050–1084. [Google Scholar] [CrossRef]
  34. Hariri, A.; Fatima, A.; Mohammadian, N.; Bely, N.; Nasiriavanaki, M. Towards low cost photoacoustic microscopy system for evaluation of skin health. In Proceedings of the Imaging Spectrometry XXI, San Diego, CA, USA, 19 September 2016; p. 99760X. [Google Scholar]
  35. Hariri, A.; Bely, N.; Chen, C.; Nasiriavanaki, M. Towards ultrahigh resting-state functional connectivity in the mouse brain using photoacoustic microscopy. In Proceedings of the Photons Plus Ultrasound: Imaging and Sensing 2016, San Francisco, CA, USA, 14–16 February 2016; p. 97085A. [Google Scholar]
  36. Manwar, R.; Islam, T.; Ranjbaran, S.M.; Avanaki, K. Transfontanelle photoacoustic imaging: Ultrasound transducer selection analysis. Biomed. Opt. Express 2022, 13, 676–693. [Google Scholar] [CrossRef] [PubMed]
  37. Avanaki, K.; Gelovani, J.G. Ultrasound and Multispectral Photoacoustic Systems and Methods for Brain and Spinal Cord Imaging through Acoustic Windows. U.S. Patent 16/566,212, 12 March 2020. [Google Scholar]
  38. Mahmoodkalayeh, S.; Kratkiewicz, K.; Manwar, R.; Shahbazi, M.; Ansari, M.A.; Natarajan, G.; Asano, E.; Avanaki, K. Wavelength and pulse energy optimization for detecting hypoxia in photoacoustic imaging of the neonatal brain: A simulation study. Biomed. Opt. Express 2021, 12, 7458–7477. [Google Scholar] [CrossRef] [PubMed]
  39. Manwar, R.; Saint-Martin, L.; Avanaki, K. Couplants in Acoustic Biosensing Systems. Chemosensors 2022, 10, 181. [Google Scholar] [CrossRef]
  40. Garcia-Pardo, C.; Andreu, C.; Fornes-Leal, A.; Castelló-Palacios, S.; Perez-Simbor, S.; Barbi, M.; Vallés-Lluch, A.; Cardona, N. Ultrawideband technology for medical in-body sensor networks: An overview of the human body as a propagation medium, phantoms, and approaches for propagation analysis. IEEE Antennas Propag. Mag. 2018, 60, 19–33. [Google Scholar] [CrossRef]
  41. Lamouche, G.; Kennedy, B.F.; Kennedy, K.M.; Bisaillon, C.-E.; Curatolo, A.; Campbell, G.; Pazos, V.; Sampson, D.D. Review of tissue simulating phantoms with controllable optical, mechanical and structural properties for use in optical coherence tomography. Biomed. Opt. Express 2012, 3, 1381–1398. [Google Scholar] [CrossRef] [PubMed]
  42. Treeby, B.E.; Cox, B.T. k-Wave: MATLAB toolbox for the simulation and reconstruction of photoacoustic wave fields. J. Biomed. Opt. 2010, 15, 021314. [Google Scholar] [CrossRef] [PubMed]
  43. Lou, Y.; Zhou, W.; Matthews, T.P.; Appleton, C.M.; Anastasio, M.A. Generation of anatomically realistic numerical phantoms for photoacoustic and ultrasonic breast imaging. J. Biomed. Opt. 2017, 22, 041015. [Google Scholar] [CrossRef] [PubMed]
Figure 1. Process steps to develop a 3D vasculature digital phantom and test it in a photoacoustic simulation.
Photonics 09 00538 g001
Figure 2. Three-dimensional vasculature phantom model examples developed using Blender. (a) Example 1, (b) example 2, (c) example 3, and (d) example 4. Three-dimensional model files are available in the data availability statement.
Photonics 09 00538 g002
Figure 3. Optical illumination modelling using Zemax. (a) Three-dimensional model of Zemax simulation, the yellow dashed line corresponds to the plane shown as (b) absorbance map, and (c) fluence map.
Photonics 09 00538 g003
Figure 4. Photoacoustic imaging simulation of one of the example vasculature phantoms. (a) Three-dimensional visualization of the vasculature phantom (black color) and linear array L7-4 (red color), (b) cross-section (along white dashed line in b) of initial pressure, (c) reconstructed image.
Photonics 09 00538 g004
Figure 5. Shadow effect of the imaging target with an angular orientation. (a) Two cylinders are perpendicular to L7-4, (b) the angle between two cylinders and L7-4 is 60 degrees, and (c) the angle between two cylinders and L7-4 is 45 degrees. (df) Cross-section images of initial pressure, (gi) are cross-sections of the PA reconstructed image for (ac) digital phantoms.
Photonics 09 00538 g005
Publisher’s Note: MDPI stays neutral with regard to jurisdictional claims in published maps and institutional affiliations.