Communication

Smartphone Based Fluorescence Imaging for Online Control of Cattle Fodder Preparation

by
Vasily N. Lednev
1,*,
Ivan A. Kucherenko
1,2,
Vladislav A. Levshin
1,2,
Pavel A. Sdvizhenskii
1,
Mikhail Ya. Grishin
1,
Alexey S. Dorohov
3 and
Sergey M. Pershin
1
1
Prokhorov General Physics Institute, Russian Academy of Sciences, 38 Vavilova Street, 117942 Moscow, Russia
2
Faculty of Physics, Lomonosov Moscow State University, 2 Leninsky Gory, 119991 Moscow, Russia
3
FSBSI (Federal Scientific Agroengineering Center VIM), 109428 Moscow, Russia
*
Author to whom correspondence should be addressed.
Photonics 2022, 9(8), 521; https://doi.org/10.3390/photonics9080521
Submission received: 27 June 2022 / Revised: 22 July 2022 / Accepted: 23 July 2022 / Published: 27 July 2022
(This article belongs to the Section Biophotonics and Biomedical Optics)

Abstract

:
A simple and cost-effective technique has been suggested for online monitoring of grist concentration in fodder. The technique is based on fluorescence imaging with grow light lamp excitation and a consumer CMOS camera (DSLR or smartphone) for photo capturing. A prototype instrument has been developed and tested in the laboratory for quantitative express determination of rapeseed grist concentration in fodder. In situ measurement of grist concentration during cattle food preparation has been demonstrated, and the perspectives were discussed. The developed instrument has the potential to ensure more accurate preparation of individual cattle diets compared to currently available methods, which will improve the efficiency of the cattle food production.

1. Introduction

A cow’s individual feed intake and efficiency of cattle food production has a strong impact on farm economy [1,2,3,4,5]. Depending on the cow production cycle, the concentration of the energetic component (grist) should be controlled in cattle food to ensure a cow’s good health and high quality milk. Modern dairy farming focuses on individual cow efficiency which requires estimation of feeding behavior by automatic monitoring [6]. Online monitoring of cow feed intake determines the effectiveness in terms of feed conversion. Grist is an important component of fodder and is a significant part of farm expenses so recognition of inefficient cows and creation of individual cow diets can increase the farm’s overall feed efficiency [7,8,9,10,11]. To obtain satisfactory and steady results, automated systems should be implemented and built into the quality inspection process together with mechanization.
Modern feed intake measuring systems utilize different online diagnostic techniques including video cameras [2,12,13,14,15,16], video cameras with in-depth profiling [17,18] and light detection and ranging (LIDAR) systems [19,20,21]. Computer vision based image analysis has been widely and successfully utilized to monitor different steps of food supply production [22]. However, discrimination of rapeseed grist in maize silage matrix by means of color imaging is very challenging (if even possible) due to similarity of the component colors. Chlorophyll concentration, on the other hand, is significantly lower in grist compared to that in silage and may be used as an indicator, but consumer-grade CCD/CMOS cameras cannot be used to differentiate the 680 nm chlorophyll absorption band due to wide spectral windows of the color filter mask on the CCD/CMOS matrix. To solve this problem, we suggest a fluorescence imaging technique combining grow light excitation and simple CMOS camera capture since grist and silage fluorescence spectra have intense bands in different spectral ranges which correspond to different color channels of the CMOS camera. In this study, we suggest and describe a cost-effective and simple technique for grist quantitative determination during cattle food mixture preparation. The fluorescence imaging technique was successfully utilized in laboratory experiments but has not been utilized for more practical applications such as online measurements during cattle food preparation on a farm [23].

2. Materials and Methods

2.1. Materials

One-year-old maize silage was taken from the silage pit at Zelenogradskoe Farm (Moscow region, Russia) and transported within 1 h to the lab. Rapeseed grist pelleted material (Figure 1a) was purchased from Rusagro LLC (Tambov, Russia). Different mixtures of maize silage and rapeseed grist were prepared in the lab and then mixed for 2 min until uniform distribution was achieved. After preparation, the samples were measured with color and fluorescence imaging.

2.2. Instrument

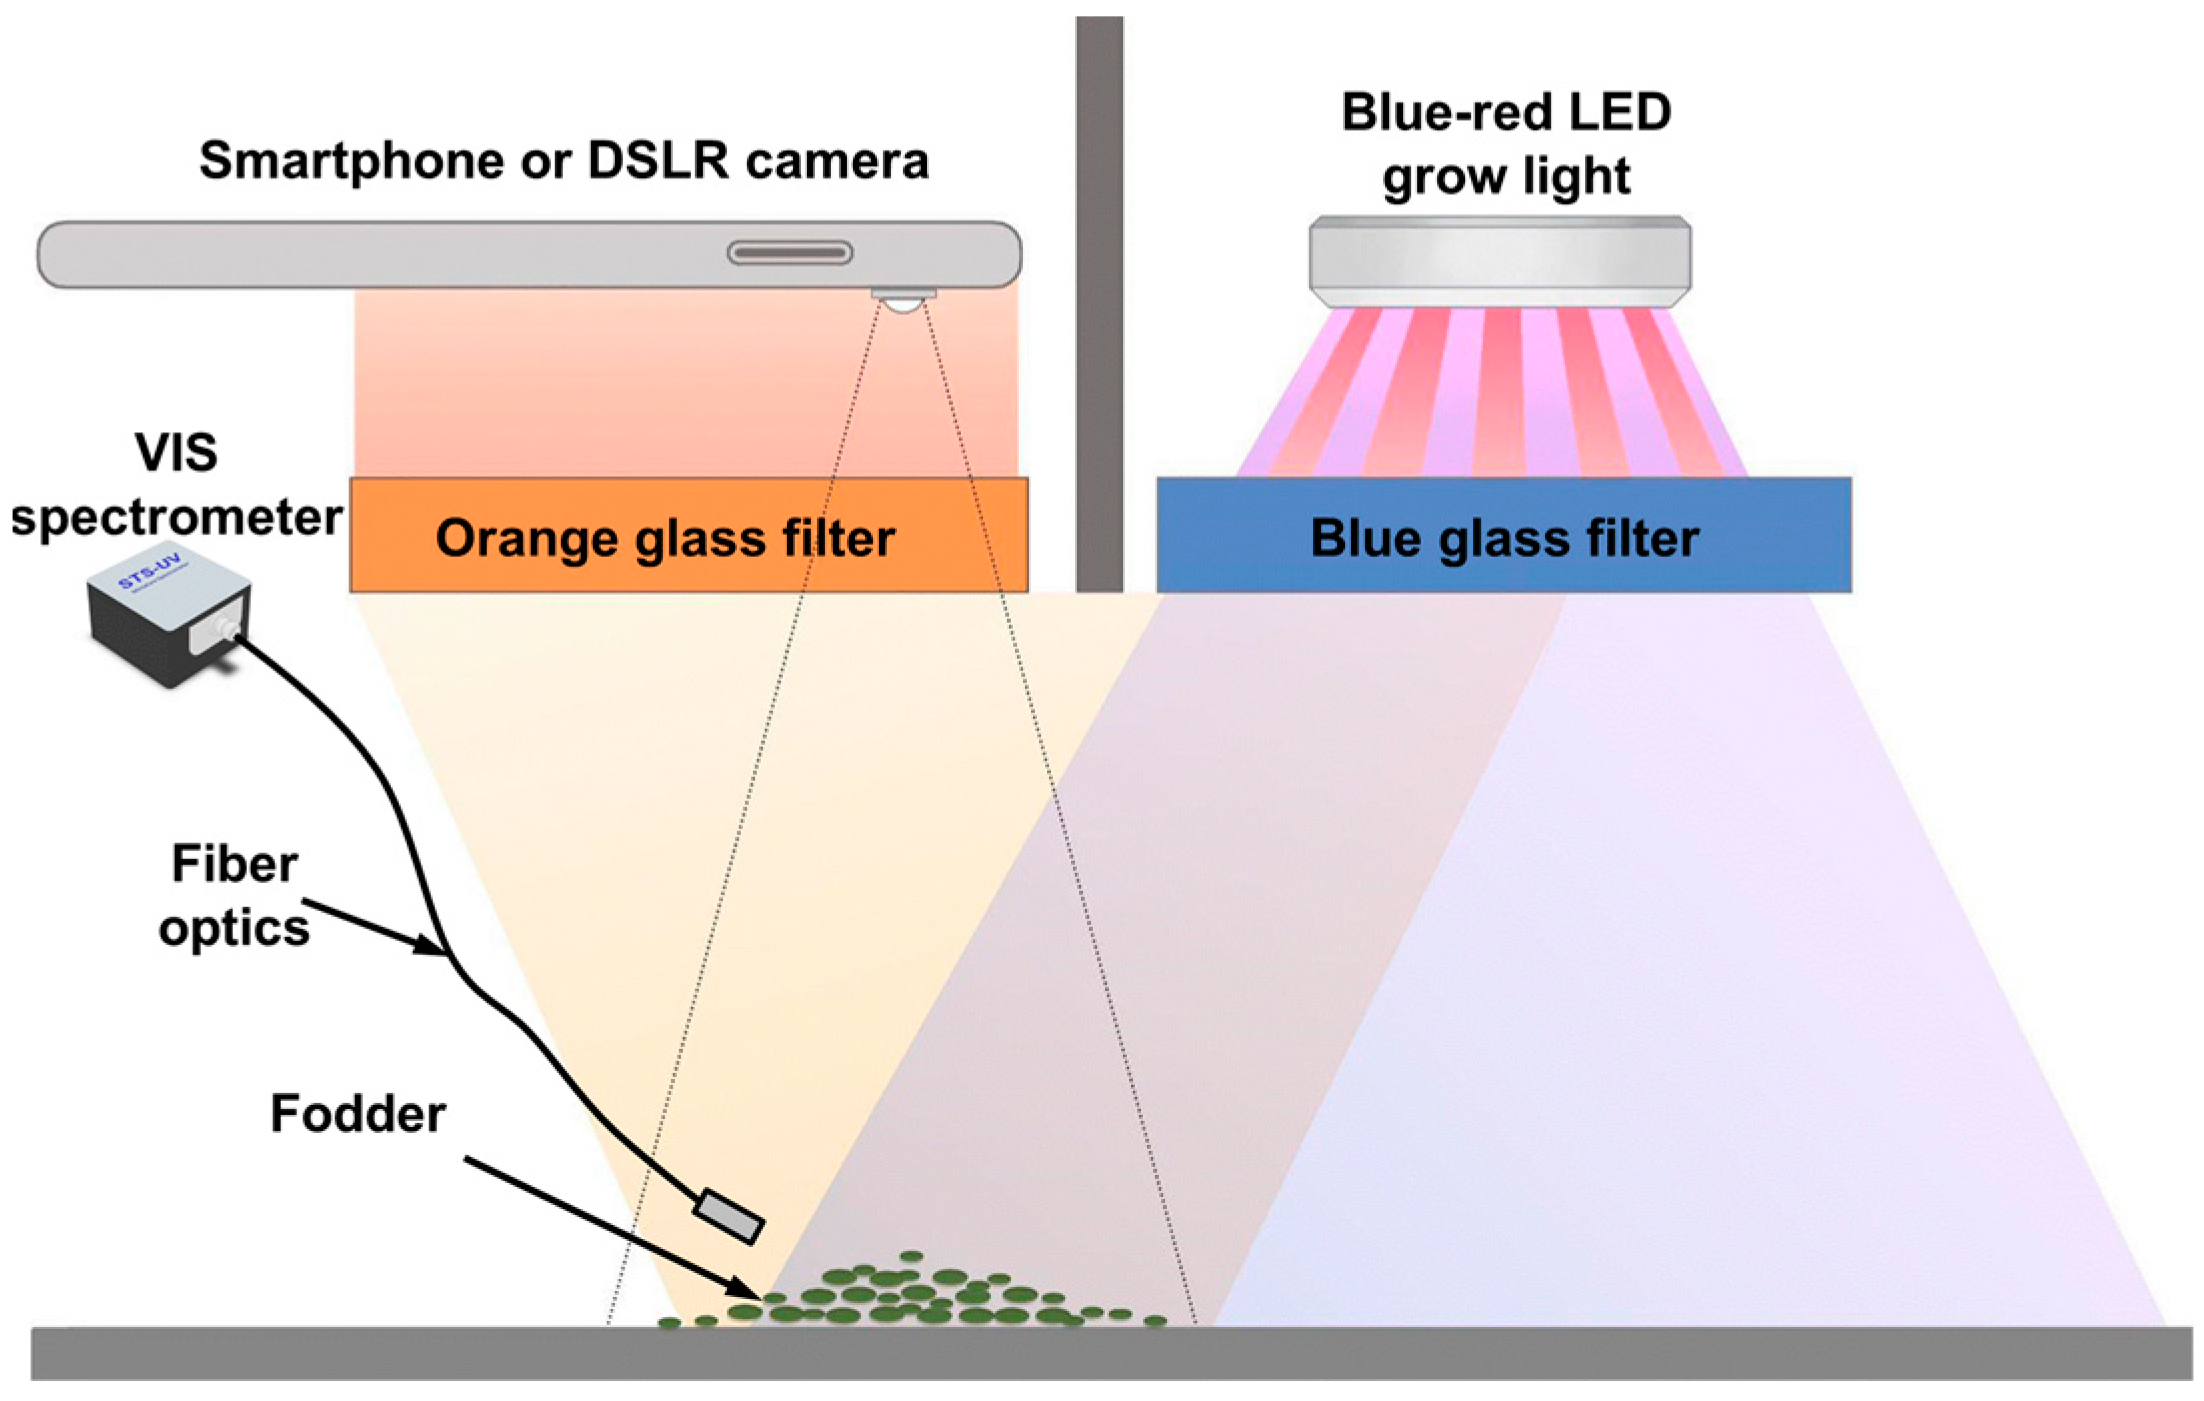
The laboratory experiment setup for color and fluorescence imaging is presented in Figure 2. The instrument was based on a tungsten incandescent/light emitting diode (LED) lamp as a source for excitation and a consumer CMOS camera as a detector (Canon 650D with Canon 18–50 mm lens). Color imaging was carried out with the tungsten lamp (color temperature 2200 K) that lit the mixture of grist and silage from a distance of 50 cm. The Canon 650D camera utilized for color image capturing was installed at a 50 mm distance as well. The color balance and exposure time (0.5 s) were the same for all the experiments. The camera was remotely controlled from a personal computer over USB using open-source software (digiCamControl). For fluorescence excitation, we used a commercially available grow light of 30 W electric power (450 and 630 nm color LEDs, LED and tungsten lamp emission spectra are presented in Figure A1). Currently, 450 nm diodes have a rather narrow spectral width, provide few watts of power and are very cheap due to mass scale production of grow light lamps so they are a good choice for constructing low cost and robust instruments. In order to filter out the blue light (450 nm) and to induce fluorescence, we have utilized a blue glass optical filter (SZS-8, transparent in 350–550 nm spectral region). Fluorescence quantum yield for silage and grist was lower than the elastics scattering so an orange glass optical filter (OS-13, transmission in 520–2500 nm spectral region) was installed in front of the camera lens. An OS-13 glass filter was required since the camera’s color channels had too wide spectral bands (see Figure 3 below) and without such a filter the “blue” channel would be saturated before “green” and “red” channels obtain meaningful signals. Moreover, the “low energy” photons from the spectral wing of 450 nm excitation will produce a signal in the “green” channel originated by elastic scattering rather than by fluorescence. The backscattered tungsten lamp light (color imaging) and fluorescence spectra were also quantified with a miniature spectrometer (STS-VIS by Ocean Optics) equipped with a quartz-core optical fiber cable that was directed to the sample from a distance of 5 cm. The fluorescence intensity is significantly lower than daylight so all the experiments were conducted in a dark room.

3. Results and Discussion

The similarity in silage and grist color images makes the discrimination of grist components very difficult, even impossible, with color imaging. For example, in Figure 1 we present pure components as well as the mixtures but discrimination of rapeseed grist pellets from the maize green leaves is not possible. For correct spectroscopic comparison, we have acquired the reflectance spectrum (color spectrum) for grist and different silage components with a conventional mini spectrometer. According to Figure 3b, the major difference in reflectance spectra between the rapeseed grist and the silage components is the 680 nm band which corresponds to chlorophyll-a absorption. In order to discriminate rapeseed grist, it can be convenient to acquire images in a narrow spectral range of 670–690 nm but this cannot be achieved with consumer-grade color cameras since the spectral width of the red channel of the CMOS matrix is too big for meaningful measurements (Figure 3c). Though multispectral cameras have a narrower spectral range it is not enough to complete this task. The spectral band resolution of hyperspectral cameras is high enough (spectral window 1–10 nm) so rapeseed grist can be easily discriminated from the maize green leaves but such instruments are very expensive to be installed at farms [15] and currently are primarily used for satellite and airborne imaging [24].
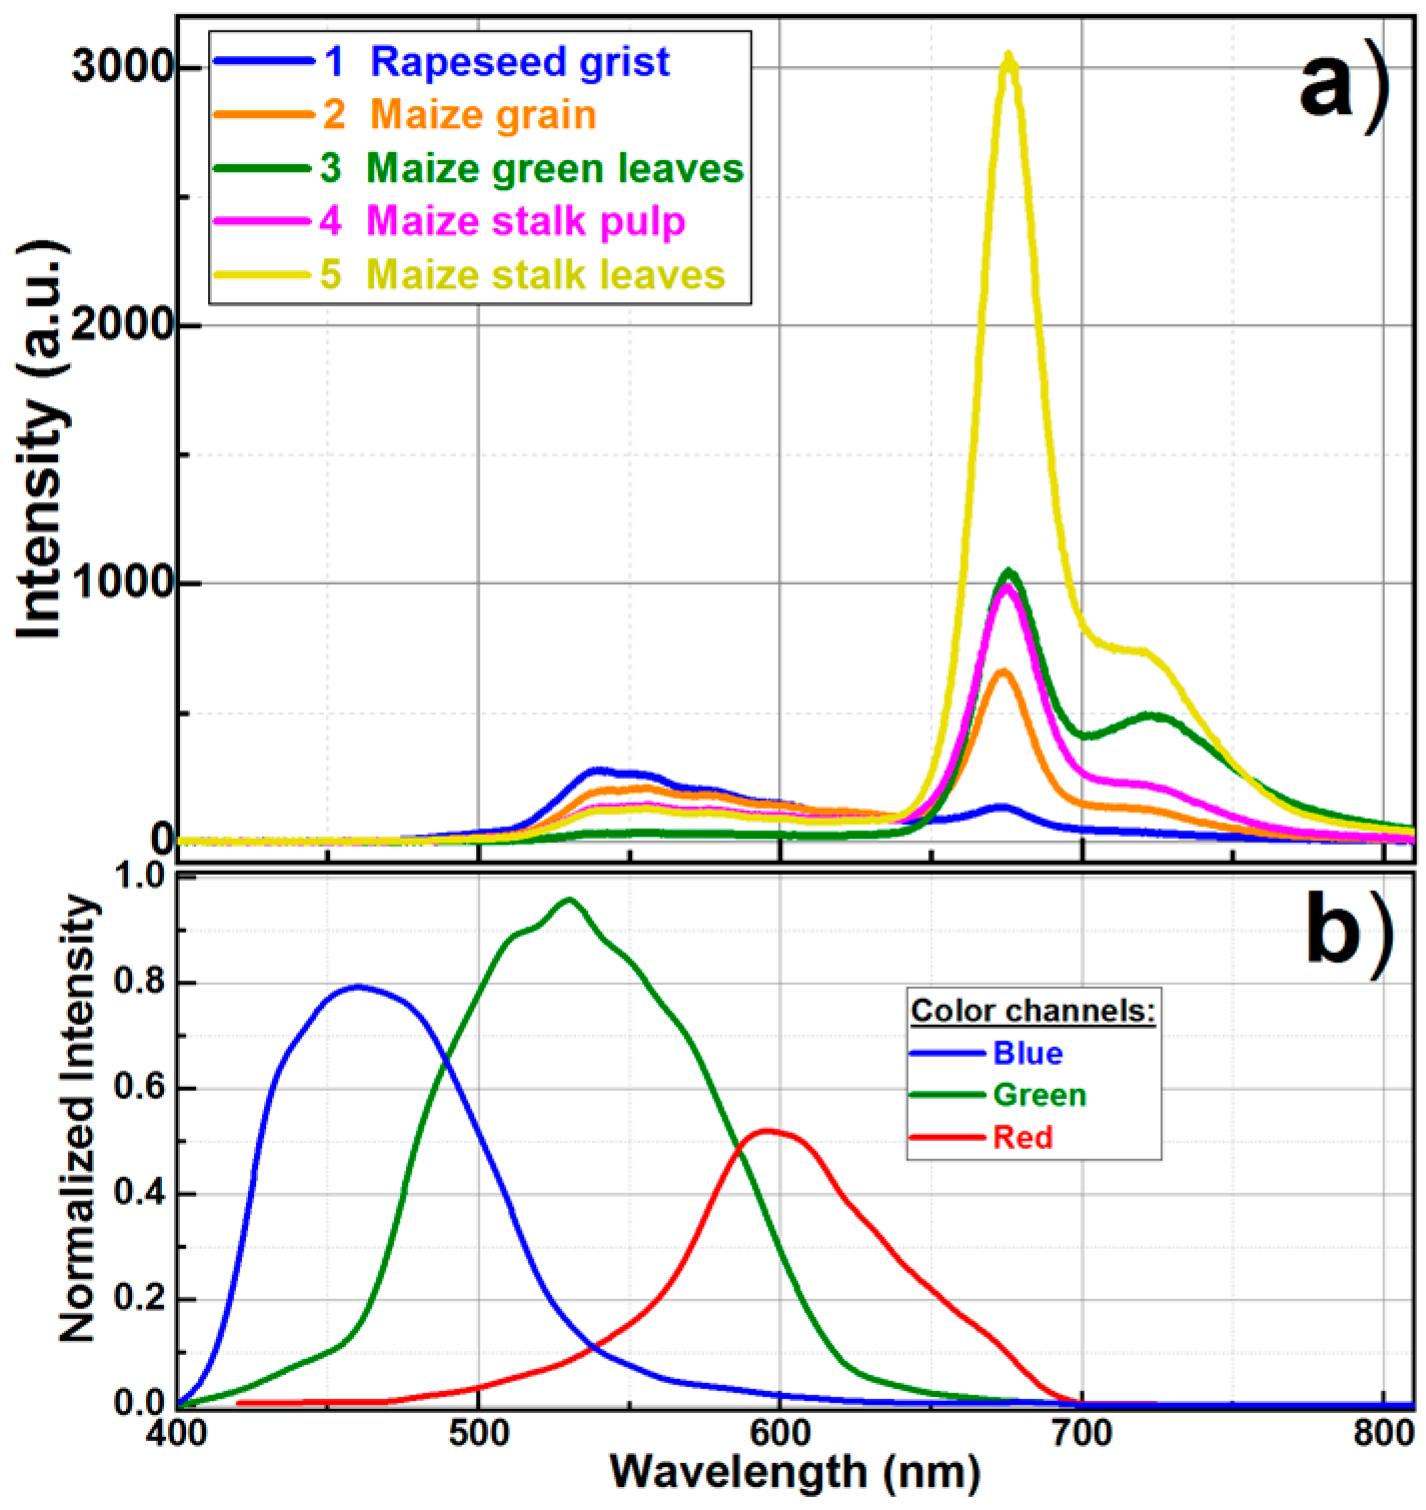
Fluorescence imaging is a good technique [25,26,27,28] to visualize the difference in chlorophyll concentration in plants, so this technique would be a good choice to distinguish rapeseed grist (low chlorophyll concentration) [29,30] from the maize silage components (high chlorophyll concentration) [31,32]. The fluorescence spectra of grist and individual silage components have been acquired with the 450 nm wavelength excitation (Figure 4b). It can be clearly observed that the smallest intensity of the 680 nm band corresponds to the rapeseed grist. Zero intensity of fluorescence spectrum in the 400–450 nm range is due to orange color filter utilization (absorbs in 400–450 nm, see Figure A1c for OS-13 filter) that is needed to prevent spectrometer detector saturation by elastically backscattered excitation emission. Still, the 680 nm band width of 25 nm is not enough to discriminate grist when utilizing only the red channel of CMOS matrix. The fluorescence spectra of grist and silage components at 550 and 680 nm are changed inversely: the intensity is smallest for the 680 nm band while highest in the 520–600 nm range for the rapeseed grist. These spectral regions are well separated and correspond to the different channels of the color CMOS matrix (Figure 4b). Consequently, capturing fluorescence images and calculating the ratio of green and red channel pixel values is a good way to discriminate the rapeseed grist pellets.
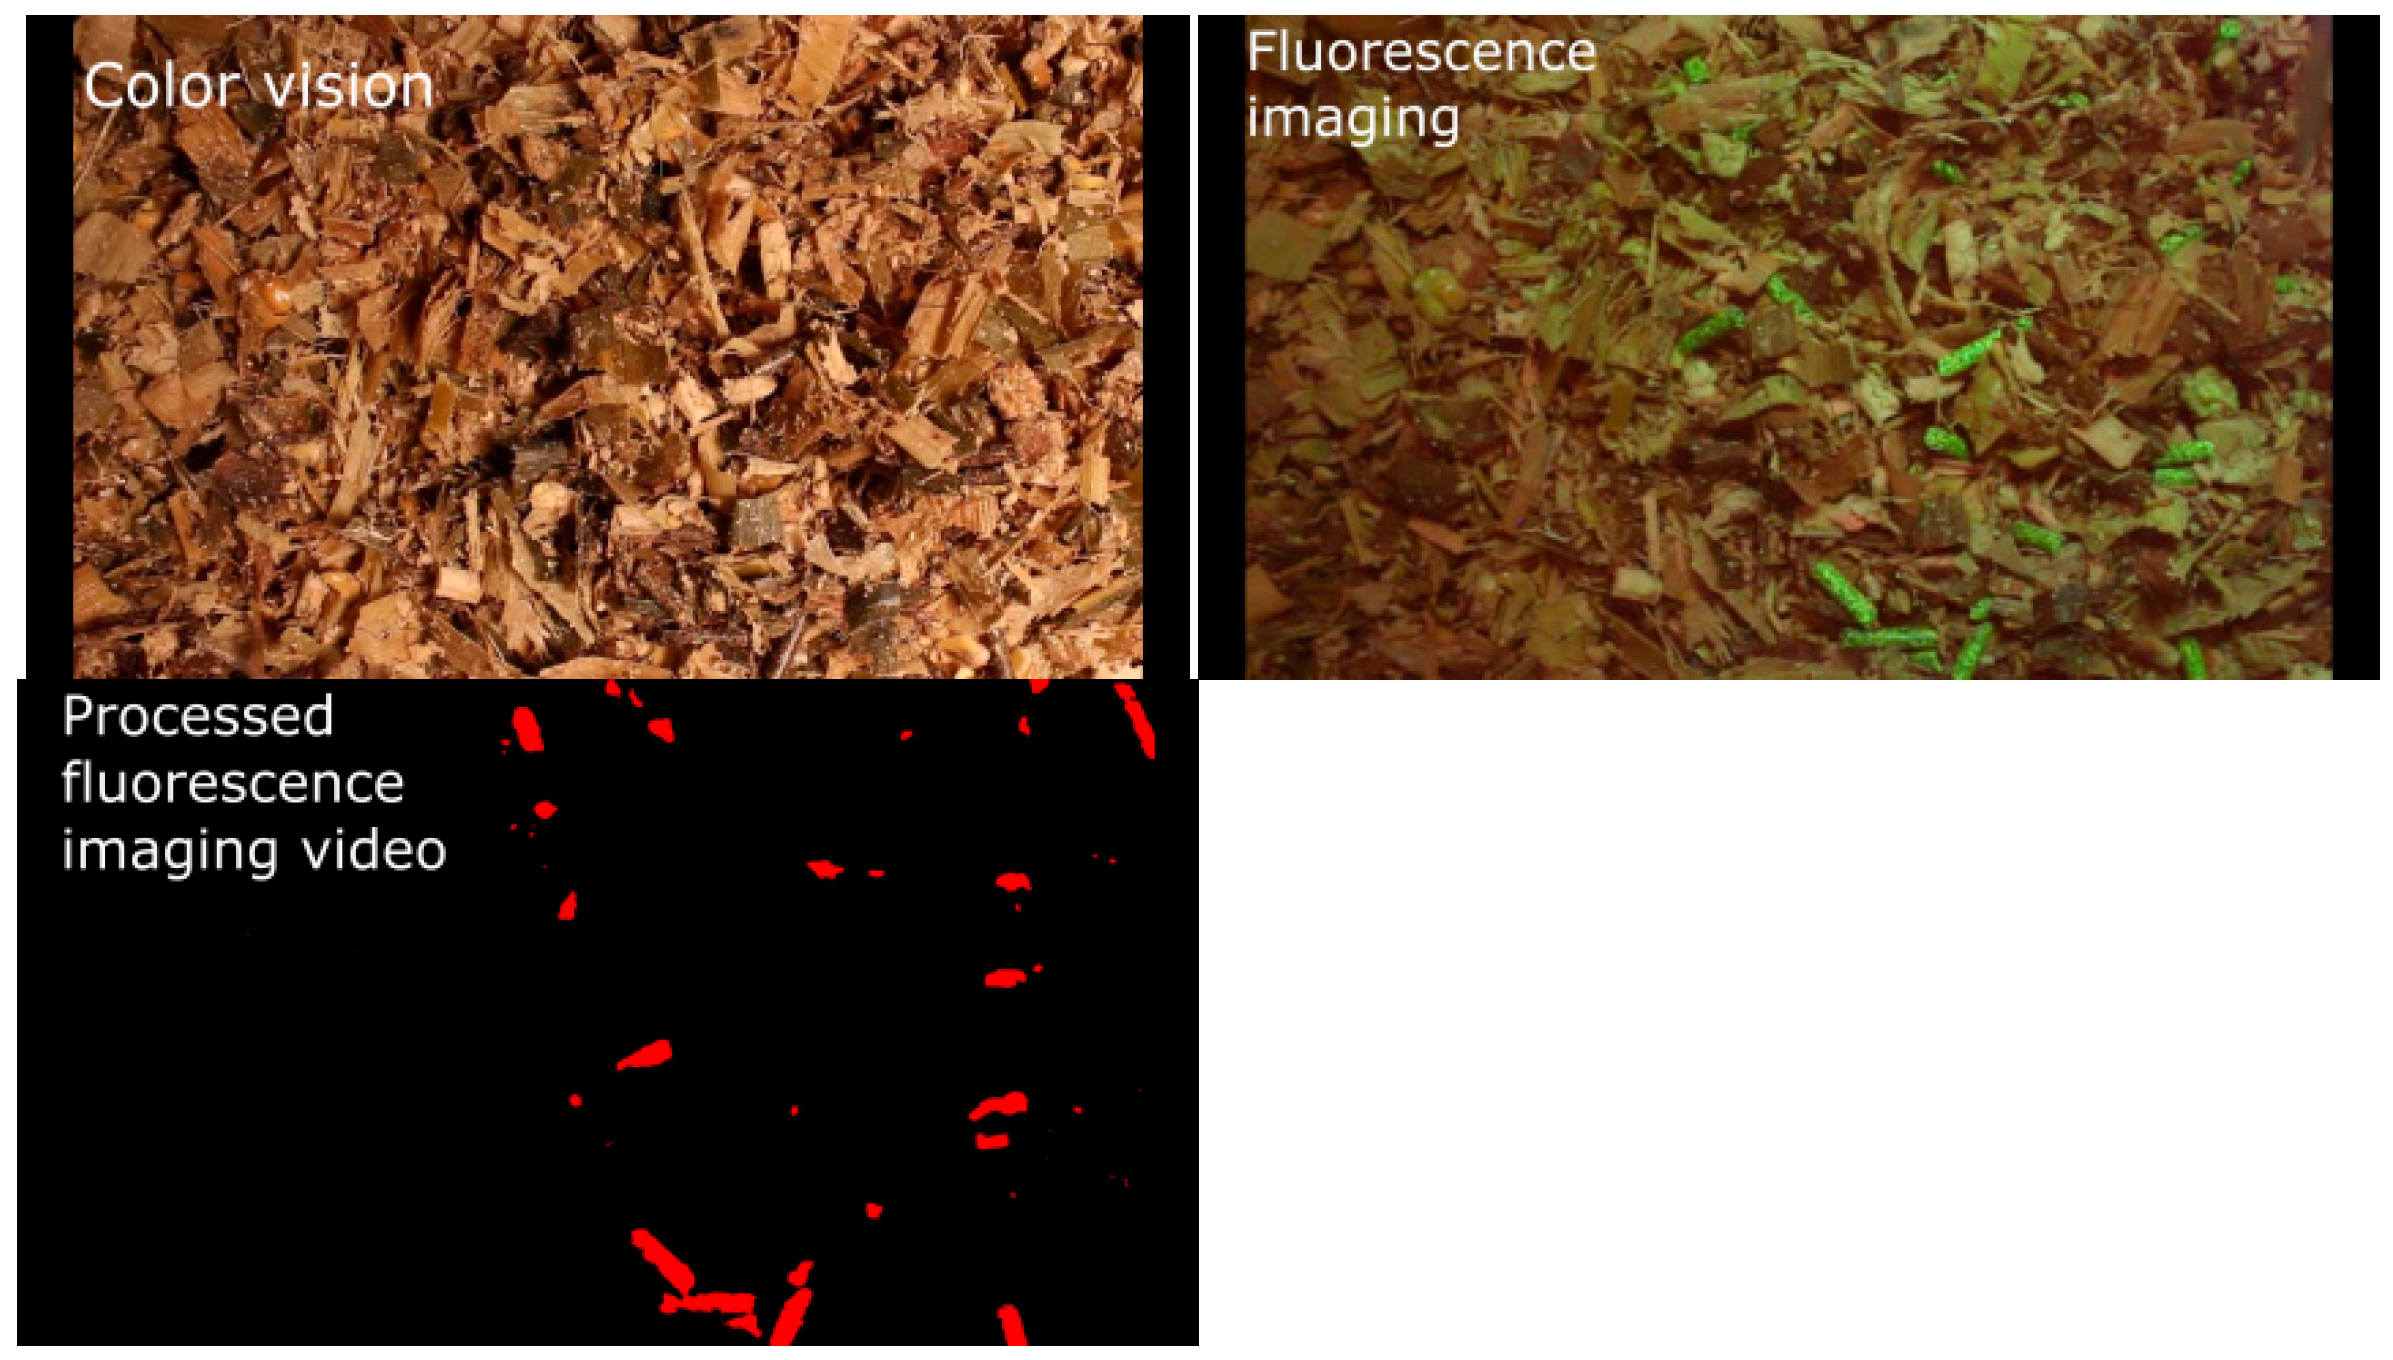
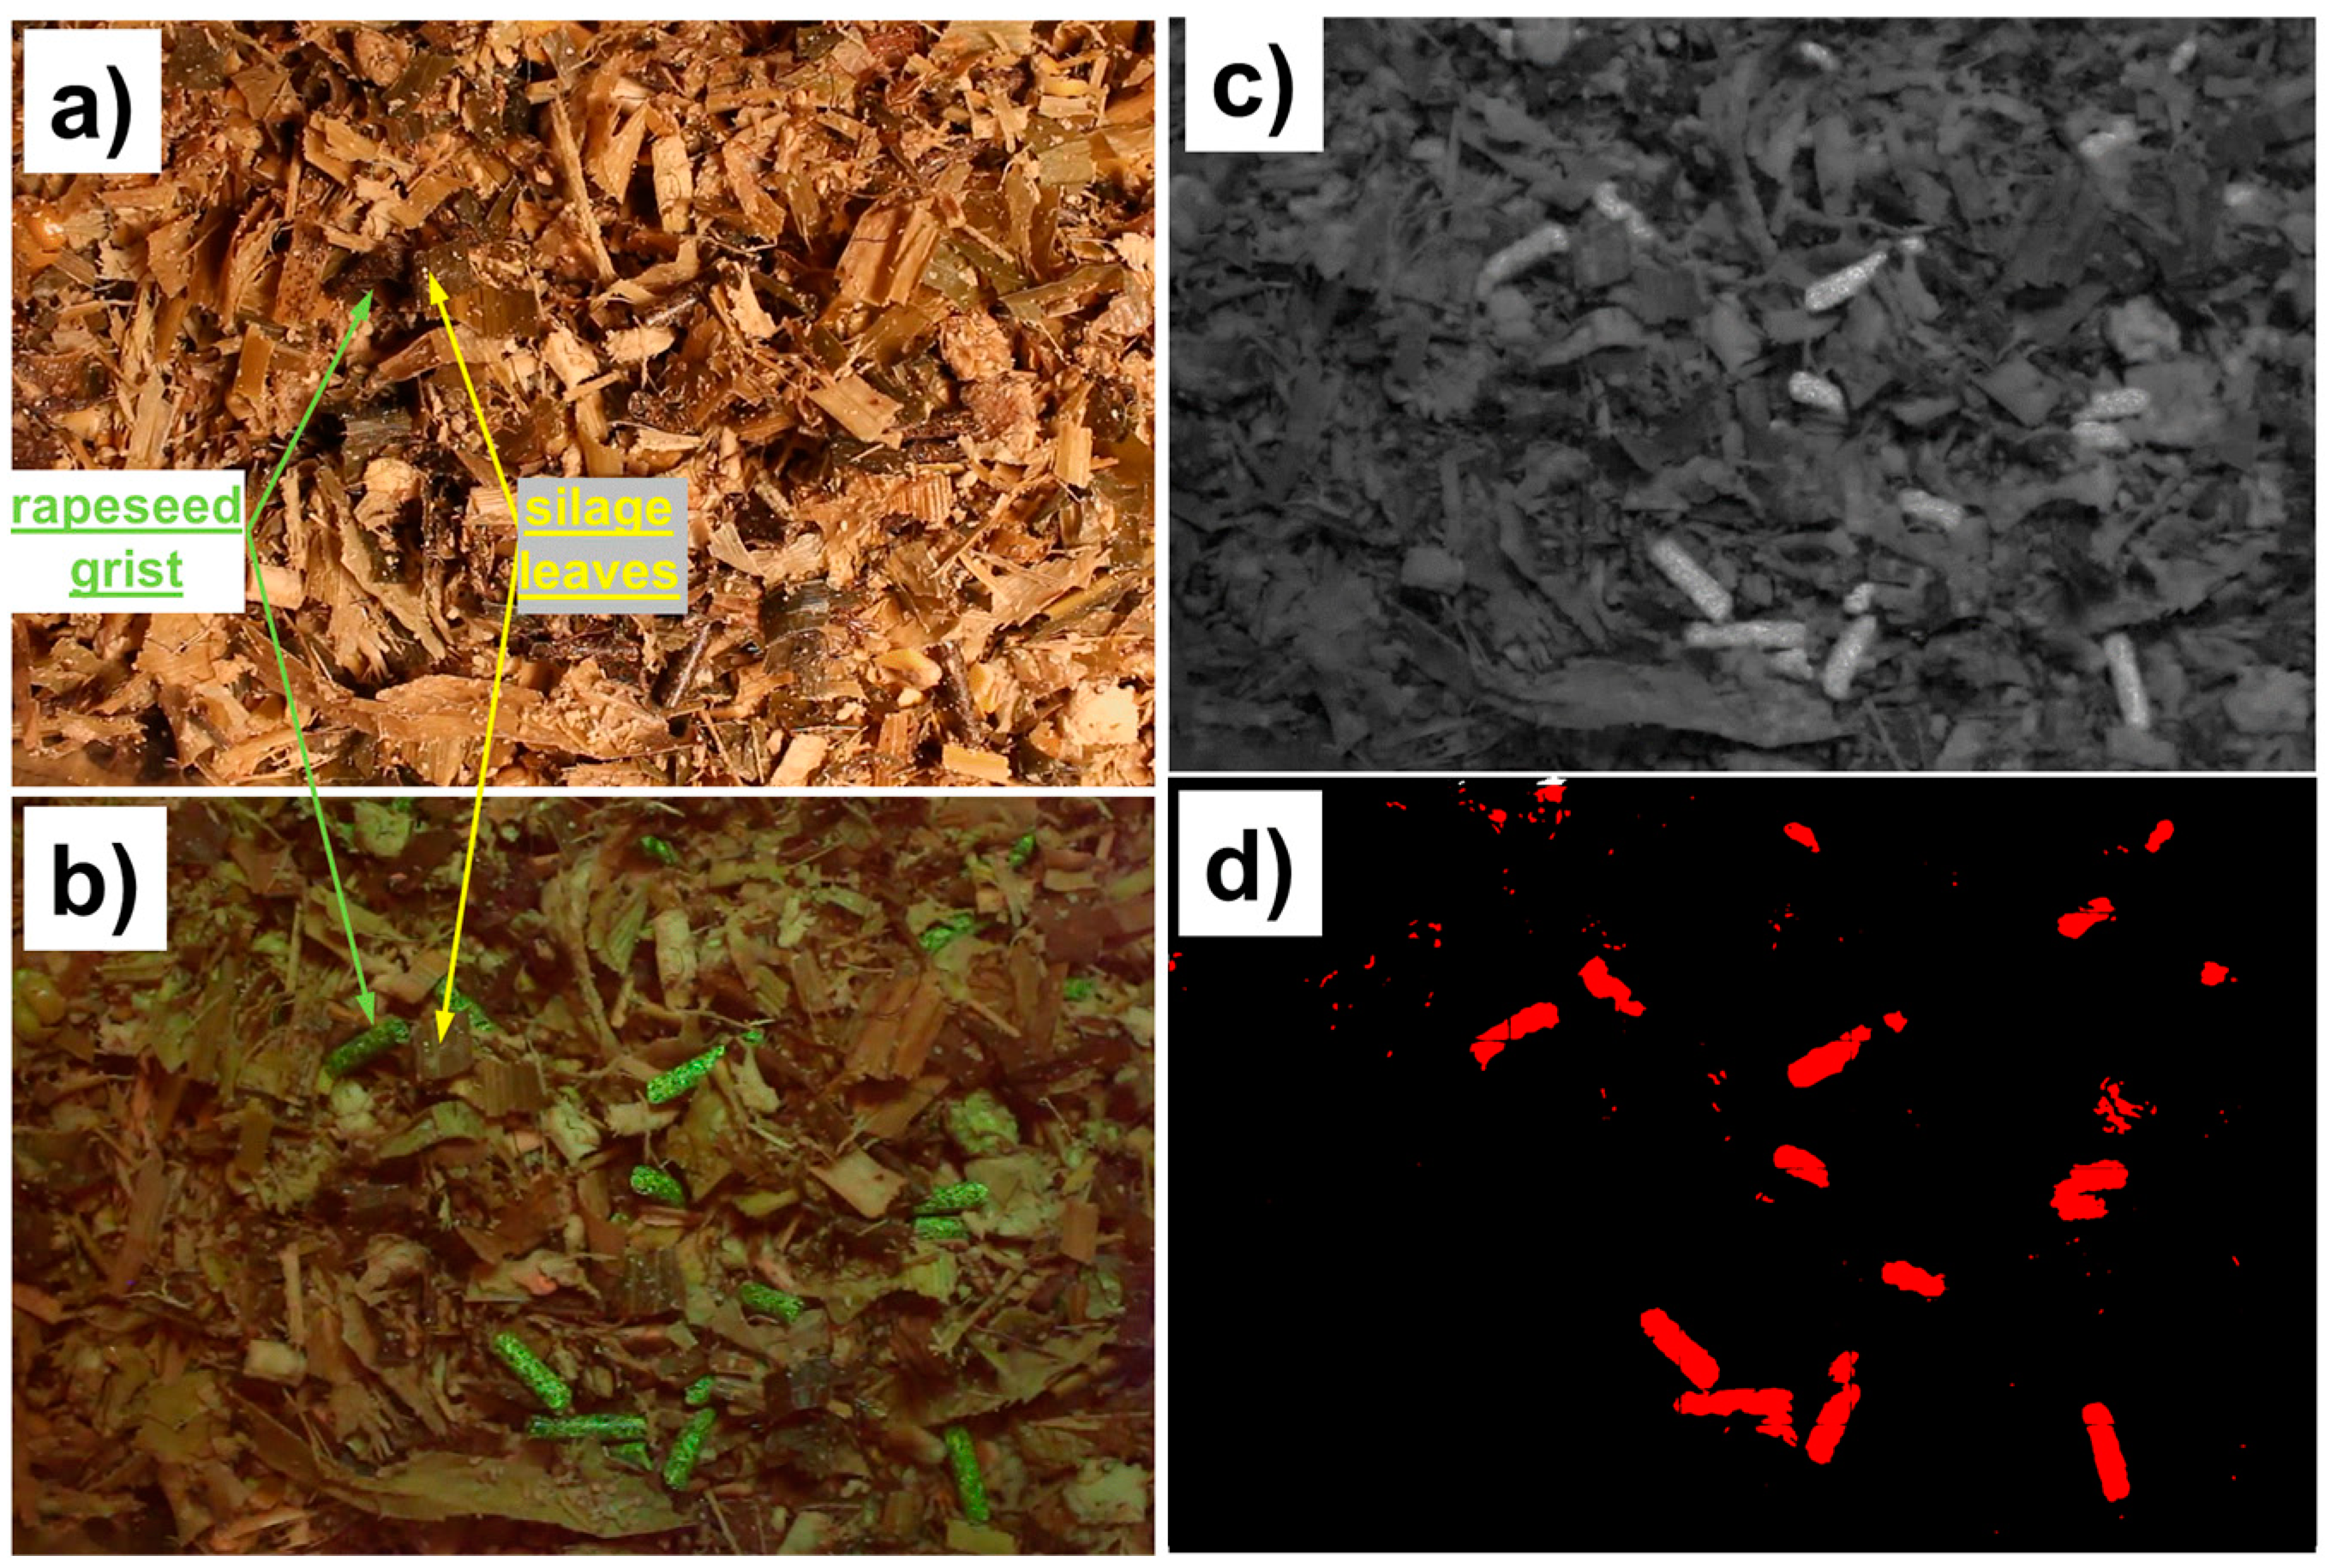
The example of fluorescence imaging with rapeseed grist discrimination is presented in Figure 5. According to the color image (Figure 5a), it was not possible to discriminate rapeseed grist pellets from maize green leaves in silage (see example area marked with arrows). We tried different approaches to differentiate the grist in images but failed to obtain meaningful results, including color histogram analysis and artificial neutral network approaches. In the case of the fluorescence image, the same grist pellets can be easily discriminated with the naked eye. For the fluorescence image presented in Figure 5b, the distinguishing can be done easily due to green color of grist (greater fluorescence in 520–600 nm spectral range, see Figure 4b). In order to further improve the discrimination of the grist, the green-to-red channel ratio was constructed from the fluorescence image, and the result is presented in Figure 5c. Finally, we have developed a simple artificial neural network program for better grist discrimination. Using a standard set of TensorFlow libraries [33], a neural network was built. The model uses three convolutional layers. The dataset was prepared from the fluorescence images taken in the laboratory and then cropped in an image editor program. A 95% result has been achieved on the test sample. Summarizing, the fluorescence image was processed to obtain a view of rapeseed grist with high contrast as is shown in Figure 5d. A video clip with the color and fluorescence imaging as well as the processed data is presented in the Appendix A (Figure A2).
For quantitative determination of rapeseed grist mass fraction, the developed instrument has been calibrated in the laboratory. A series of fodder mixtures was prepared with different mass fractions of grist in the range of 0–30% mass. The total mass of each sample was about 1 kg and in order to obtain a uniform distribution, the sample was mixed for 15 min. The sample mixture was deposited on a laboratory table to cover a 50 × 50 cm square. The captured image almost fit the square for proper representation of the sample. Each sample mixture was deposited and then a fluorescence image was captured. The procedure was repeated ten times (mixing, deposition, fluorescence imaging) to obtain statistically meaningful results. Then, fluorescence images were processed as described above. A grist signal was defined as the fraction of red pixels in the processed fluorescence image (see Figure 5d). The grist calibration curve was constructed for the samples with different grist mass fractions, and the result is presented in Figure 6. The calibration curve was then fitted with a linear function due to linear dependence of the number of grist pellets at the surface and grist mass fraction for proper mixing and absence of pellet crushing. For conventional mixer trailers on farms, both conditions (homogeneous mixture and no pellet milling) are typically fulfilled. If pellets are crushed during mixing, then false results will be achieved since the pellet surface fraction is not proportional to the mass of the grist. However, poor mixing can be traced by the developed instrument: large oscillations of the measured mass fraction at the start of mixing will be continuously flattened out until uniform grist distribution is achieved. The grist mass fraction measurement error was estimated from the confidence band intervals of the fit. Here, we defined the grist concentration accuracy as the corresponding abscissa interval between the upper and the lower confidence band curves at the selected ordinate value. Consequently, accuracy is a trade-off between the grist signal reproducibility, concentration region of interest and the level of probability used for the confidence band estimation. Typically, a 2σ-criterion is used in regression analysis, so we choose the corresponding probability level (0.95). According to this definition, the accuracy of the grist mass fraction measurement was estimated as ±2.5%.
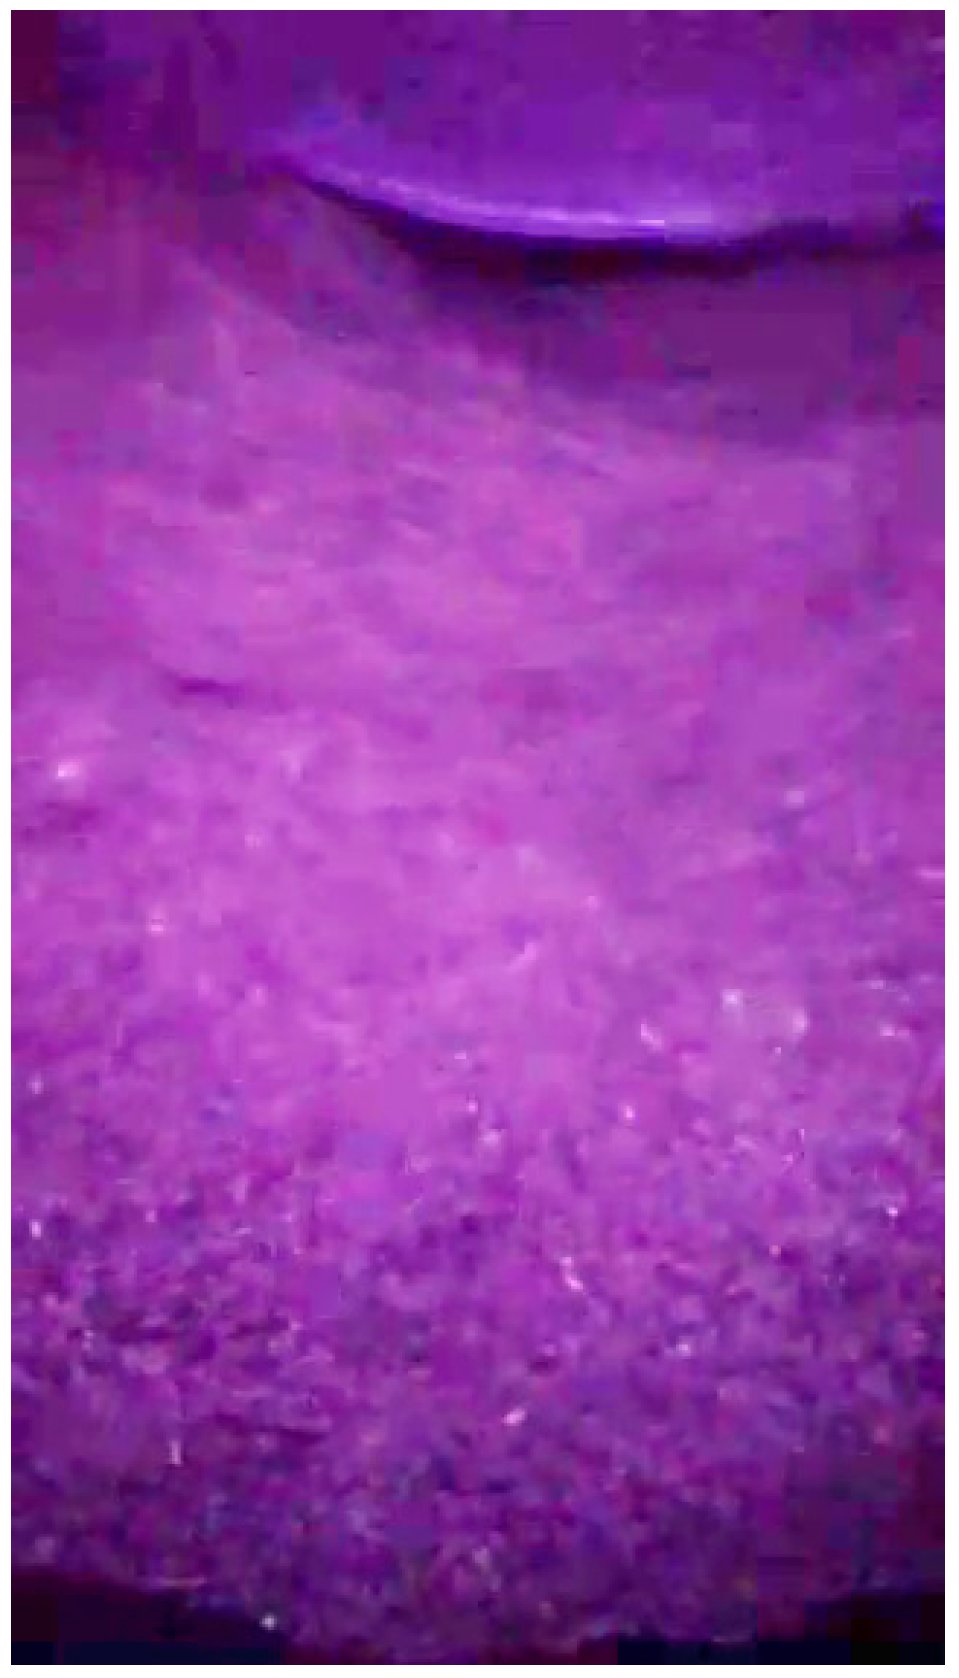
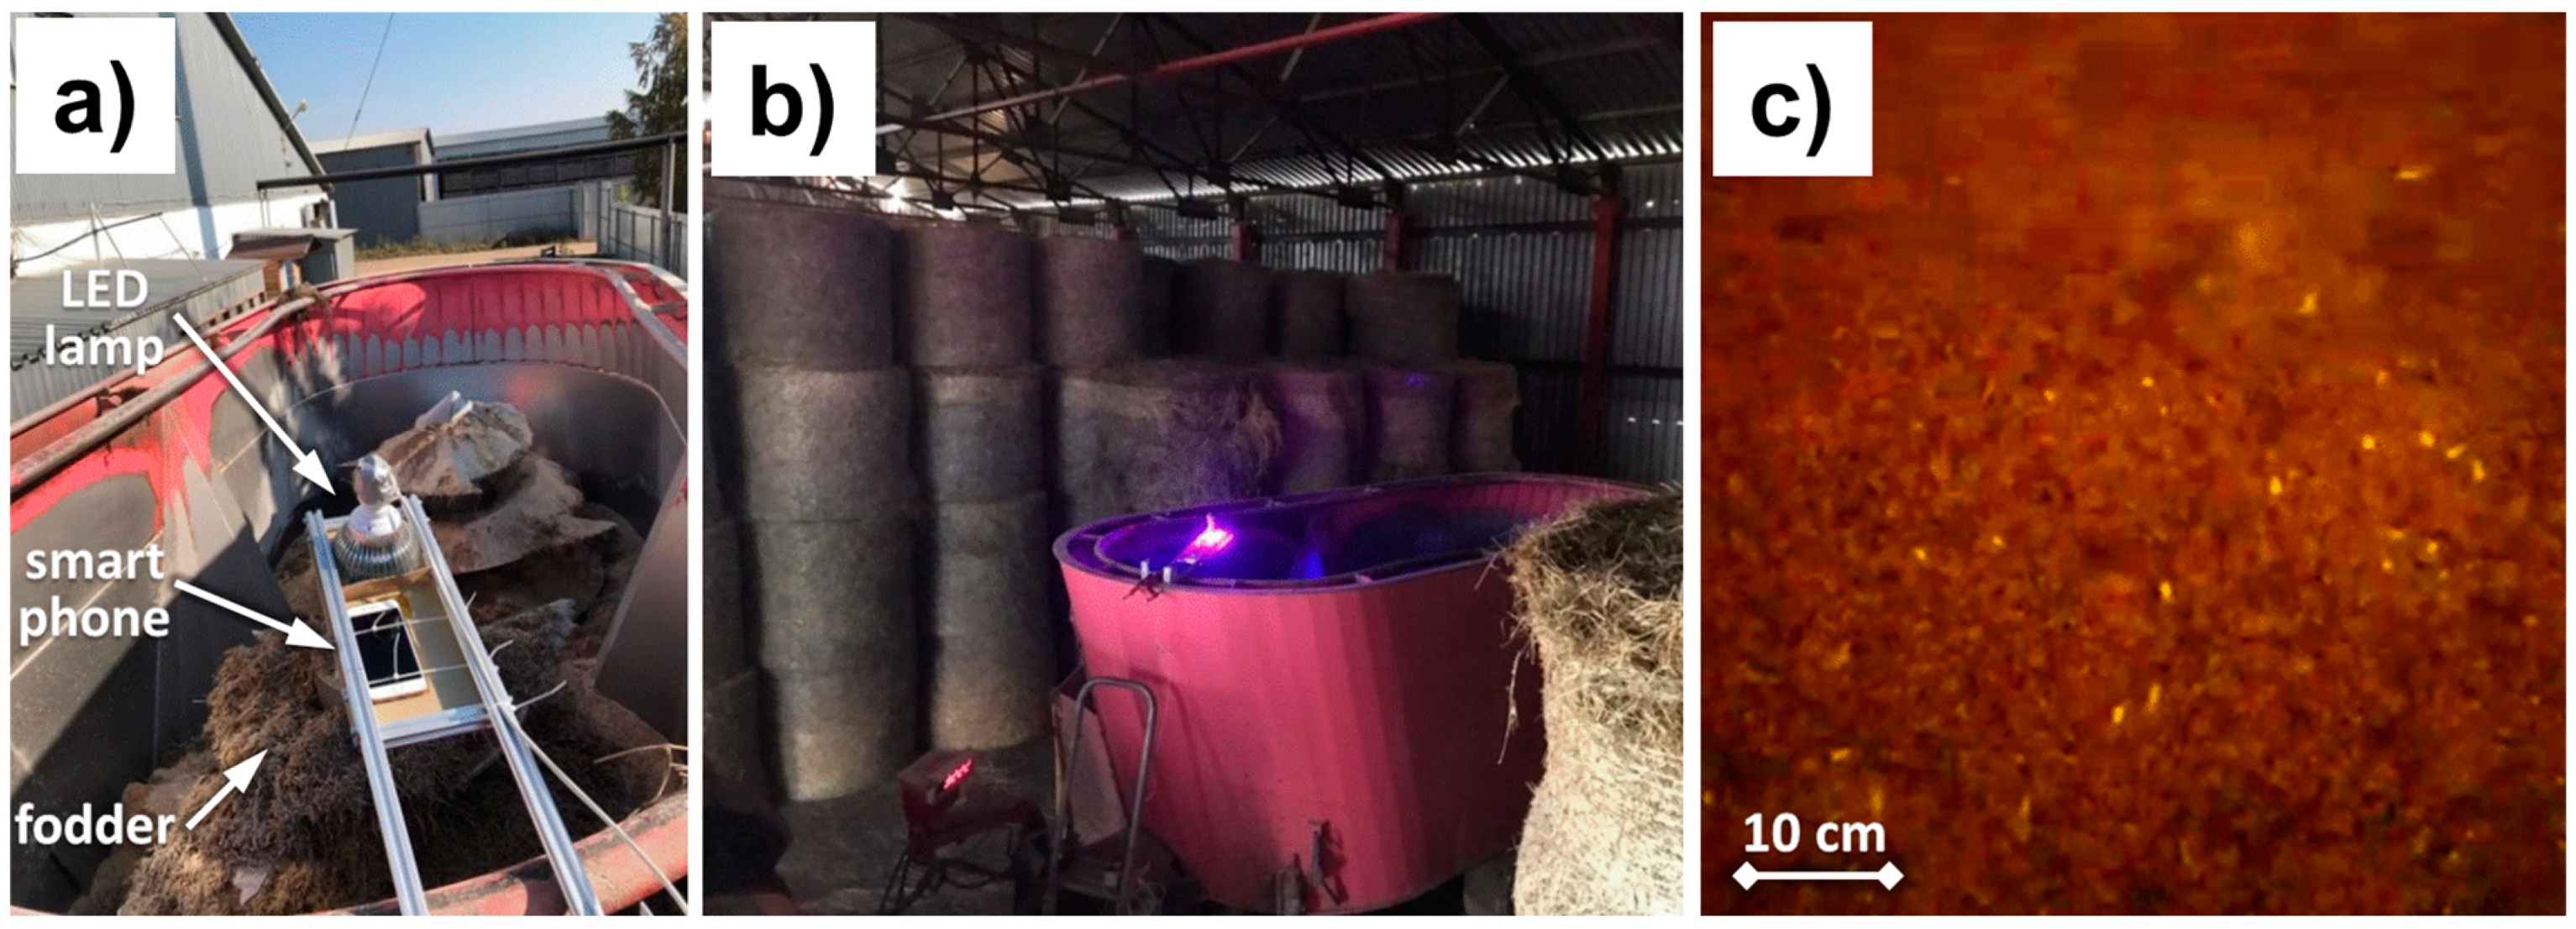
For field tests, we have slightly modified the system and substituted the Canon 650D camera with a compact and lightweight smartphone (iPhone 7, Apple Inc.). The smartphone was remotely controlled by commercial software (CLOS App) through Wi-Fi connection. In order to power the grow light, we utilized a small 12 V battery with a DC12V-to-AC220V converter. The developed system was installed on the board of a cattle feed mixer (Hozain, Russia) as illustrated in Figure 7a. In order to avoid direct sunlight illumination, we installed the mixer in a closed shed (Figure 7b) to capture fluorescence images with a good enough signal-to-noise ratio. An example of a fluorescence image with the rapeseed pellets (bright spots) is presented in Figure 7c. A video of the fodder mixing process can be found in Figure A3.

4. Conclusions

In this study, we have suggested a simple and cost-effective technique for online monitoring of grist concentration in cattle food mixture. Rapeseed grist and maize silage are very similar in color but are notably different in chlorophyll concentration. In order to use a consumer-grade color camera, we suggested to induce fluorescence since it is rather different for rapeseed grist and maize silage components. To demonstrate the feasibility of online rapeseed grist quantification during fodder preparation, a simple and low cost fluorescence imaging system was constructed: 450 nm blue LED lamp for fluorescence excitation and color images capturing by a consumer-grade camera. Online fodder preparation monitoring required daylight avoidance but the achieved accuracy of rapeseed grist mass fraction measurement was estimated as ±2.5%. To the best of our knowledge, the developed smartphone fluorescence imager is the first instrument suitable (low cost, simple, reliable) for fodder preparation control on a real farm. The developed system was capable of measuring grist concentration at a speed of 2 Hz but the sampling rate can be improved to 100 Hz if a modern camera and PC are used. To summarize, the suggested smartphone based fluorescence imaging technique provides a useful tool for online automatic inspection of the fodder preparation procedure, and it can be actively involved in the decision-making process where rapid control is needed. The alternative ways of cattle food mixture control (near infrared spectroscopy and wet-chemistry methods) cannot provide online measurements to date but cost 10–25 times more compared to the developed smartphone based instrument.

Supplementary Materials

The following supporting information can be downloaded at: https://www.mdpi.com/article/10.3390/photonics9080521/s1, color and fluorescence video.

Author Contributions

V.N.L.: Conceptualization, Methodology, Investigation, Writing—Original Draft; I.A.K.: Validation, Investigation, Data Curation, Visualization; V.A.L.: Software, Validation, Formal analysis, Investigation, Visualization; P.A.S.: Validation, Visualization, Writing—Review and Editing; M.Y.G.: Validation, Writing—Review and Editing; A.S.D.: Resources, Funding Acquisition, Project Administration, S.M.P.: Supervision, Writing—Review and Editing. All authors have read and agreed to the published version of the manuscript.

Funding

This work was supported by a grant of the Ministry of Science and Higher Education of the Russian Federation for large scientific projects in priority areas of scientific and technological development (grant number 075-15-2020-774).

Institutional Review Board Statement

Not applicable.

Informed Consent Statement

Not applicable.

Conflicts of Interest

The authors declare no conflict of interest.

Appendix A

Figure A1. (a) Tungsten lamp emission spectrum. (b) Grow light emission spectrum with two types of light emitting diodes (LEDs) at 450 and 630 nm. (c) Color glass optical filter transmission spectra, to filter out LED excitation wavelength (SZS-8) and to suppress elastic scattering reaching the detector (OS-13).
Photonics 09 00521 g0a1
Figure A2. The color and fluorescence videos are presented to illustrate the perspectives of the suggested approach for quantitative grist concentration determination in fodder mixture; the rapeseed grist pellets are shown with green color in fluorescence images (no image processing has been carried out—the camera exposure and color balance were the same as for color video) and red color for processed fluorescence video (red color was chosen for a better view). The video was captured in real time, so after the color video one can see the LED lamp (405 nm) switching on (violet colors) and the orange glass filter is installed before the camera objective (darkening and then green pellets’ appearance), see Supplementary Materials.
Photonics 09 00521 g0a2
Figure A3. The fluorescence imaging video of fodder preparation procedure in the mixer. Bright particles are rapeseed grist pellet fluorescence captured by the developed smartphone based system (see Figure 7 for details).
Photonics 09 00521 g0a3

References

  1. National Research Council. Nutrient Requirements of Small Ruminants: Sheep, Goats, Cervids, and New World Camelids; The National Academies Press: Washington, DC, USA, 2007; 384p, ISBN 0309102138. [CrossRef]
  2. Bloch, V.; Levit, H.; Halachmi, I. Assessing the potential of photogrammetry to monitor feed intake of dairy cows. J. Dairy Res. 2019, 86, 34–39. [Google Scholar] [CrossRef] [PubMed]
  3. Mahmud, M.S.; Zahid, A.; Das, A.K.; Muzammil, M.; Khan, M.U. A systematic literature review on deep learning applications for precision cattle farming. Comput. Electron. Agric. 2021, 187, 106313. [Google Scholar] [CrossRef]
  4. Lukas, M.; Hartinger, T.; Südekum, K.-H.; Susenbeth, A. Estimation of diet organic matter digestibility in grazing dairy cows. Arch. Anim. Nutr. 2021, 75, 153–166. [Google Scholar] [CrossRef] [PubMed]
  5. Sharma, V.K.; Kundu, S.S.; Prusty, S.; Datt, C.; Kumar, M. Nutrient utilisation, growth performance and blood metabolites in Murrah buffalo calves (Bubalus bubalis) divergently selected for residual feed intake. Arch. Anim. Nutr. 2016, 70, 455–469. [Google Scholar] [CrossRef]
  6. González, L.A.; Tolkamp, B.J.; Coffey, M.P.; Ferret, A.; Kyriazakis, I. Changes in Feeding Behavior as Possible Indicators for the Automatic Monitoring of Health Disorders in Dairy Cows. J. Dairy Sci. 2008, 91, 1017–1028. [Google Scholar] [CrossRef] [Green Version]
  7. Shepherd, M.; Turner, J.A.; Small, B.; Wheeler, D. Priorities for science to overcome hurdles thwarting the full promise of the ‘digital agriculture’ revolution. J. Sci. Food Agric. 2020, 100, 5083–5092. [Google Scholar] [CrossRef] [PubMed] [Green Version]
  8. Monteiro, A.; Santos, S.; Goncalves, P. Precision Agriculture for Crop and Livestock Farming-Brief Review. Animals 2021, 11, 2345. [Google Scholar] [CrossRef] [PubMed]
  9. Buza, M.H.; Holden, L.A.; White, R.A.; Ishler, V.A. Evaluating the effect of ration composition on income over feed cost and milk yield. J. Dairy Sci. 2014, 97, 3073–3080. [Google Scholar] [CrossRef] [Green Version]
  10. Neethirajan, S. The role of sensors, big data and machine learning in modern animal farming. Sens. Bio-Sens. Res. 2020, 29, 100367. [Google Scholar] [CrossRef]
  11. Halachmi, I.; Ben Meir, Y.; Miron, J.; Maltz, E. Feeding behavior improves prediction of dairy cow voluntary feed intake but cannot serve as the sole indicator. Animal 2016, 10, 1501–1506. [Google Scholar] [CrossRef]
  12. Drewry, J.L.; Luck, B.D.; Willett, R.M.; Rocha, E.M.C.; Harmon, J.D. Predicting kernel processing score of harvested and processed corn silage via image processing techniques. Comput. Electron. Agric. 2019, 160, 144–152. [Google Scholar] [CrossRef]
  13. Shelley, A.N.; Lau, D.L.; Stone, A.E.; Bewley, J.M. Short communication: Measuring feed volume and weight by machine vision. J. Dairy Sci. 2016, 99, 386–391. [Google Scholar] [CrossRef] [Green Version]
  14. Saar, M.; Edan, Y.; Godo, A.; Lepar, J.; Parmet, Y.; Halachmi, I. A machine vision system to predict individual cow feed intake of different feeds in a cowshed. Animal 2022, 16, 100432. [Google Scholar] [CrossRef]
  15. Elmasry, G.; Kamruzzaman, M.; Sun, D.-W.; Allen, P. Principles and Applications of Hyperspectral Imaging in Quality Evaluation of Agro-Food Products: A Review. Crit. Rev. Food Sci. Nutr. 2012, 52, 999–1023. [Google Scholar] [CrossRef] [PubMed]
  16. Li, S.J.; Fu, L.L.; Sun, Y.; Mu, Y.; Chen, L.; Li, J.; Gong, H. Individual dairy cow identification based on lightweight convolutional neural network. PLoS ONE 2021, 16, e0260510. [Google Scholar] [CrossRef]
  17. Bezen, R.; Edan, Y.; Halachmi, I. Computer vision system for measuring individual cow feed intake using RGB-D camera and deep learning algorithms. Comput. Electron. Agric. 2020, 172, 105345. [Google Scholar] [CrossRef]
  18. Garbouge, H.; Rasti, P.; Rousseau, D. Enhancing the Tracking of Seedling Growth Using RGB-Depth Fusion and Deep Learning. Sensors 2021, 21, 8425. [Google Scholar] [CrossRef]
  19. Mikhail, E.M.; Bethel, J.S.; McGlone, J.C. Introduction to Modern Photogrammetry; John Wiley & Sons: New York, NY, USA, 2001; p. 19. [Google Scholar]
  20. Grishin, M.Y.; Lednev, V.N.; Sdvizhenskii, P.A.; Pavkin, D.Y.; Nikitin, E.A.; Bunkin, A.F.; Pershin, S.M. Lidar Monitoring of Moisture in Biological Objects. In Doklady Physics; Springer: Berlin/Heidelberg, Germany, 2021; Volume 66, pp. 273–276. [Google Scholar]
  21. Grishin, M.Y.; Lednev, V.N.; Pershin, S.M.; Kapralov, P.O. Ultracompact Fluorescence Lidar Based on a Diode Laser (405 nm, 150 mW) for Remote Sensing of Waterbodies and the Underlying Surface from Unmanned Aerial Vehicles. In Doklady Physics; Springer: Berlin/Heidelberg, Germany, 2021; Volume 66, pp. 153–155. [Google Scholar]
  22. Mogol, B.A.; Gökmen, V. Computer vision-based analysis of foods: A non-destructive colour measurement tool to monitor quality and safety. J. Sci. Food Agric. 2014, 94, 1259–1263. [Google Scholar] [CrossRef] [PubMed]
  23. Zhang, R.; Ying, Y.; Rao, X.; Li, J. Quality and safety assessment of food and agricultural products by hyperspectral fluorescence imaging. J. Sci. Food Agric. 2012, 92, 2397–2408. [Google Scholar] [CrossRef] [PubMed]
  24. Sharifi, A. Yield prediction with machine learning algorithms and satellite images. J. Sci. Food Agric. 2021, 101, 891–896. [Google Scholar] [CrossRef] [PubMed]
  25. Shurygin, B.; Chivkunova, O.; Solovchenko, O.; Solovchenko, A.; Dorokhov, A.; Smirnov, I.; Astashev, M.E.; Khort, D. Comparison of the Non-Invasive Monitoring of Fresh-Cut Lettuce Condition with Imaging Reflectance Hyperspectrometer and Imaging PAM-Fluorimeter. Photonics 2021, 8, 425. [Google Scholar] [CrossRef]
  26. Gualda, E.J. 3D Volume Rendering of Invertebrates Using Light-Sheet Fluorescence Microscopy. Photonics 2022, 9, 205. [Google Scholar] [CrossRef]
  27. Sahoo, G.R.; Singh, P.; Pandey, K.; Kala, C.; Pradhan, A. Improving Diagnosis of Cervical Pre-Cancer: Combination of PCA and SVM Applied on Fluorescence Lifetime Images. Photonics 2018, 5, 57. [Google Scholar] [CrossRef] [Green Version]
  28. Che Lah, C.N.H.; Morisawa, H.; Kobayashi, K.; Ono, A.; Inami, W.; Kawata, Y. Autofluorescence Imaging of Living Yeast Cells with Deep-Ultraviolet Surface Plasmon Resonance. Photonics 2022, 9, 424. [Google Scholar] [CrossRef]
  29. Ward, K.; Scarth, R.; McVetty, P.B.E.; Daun, J. Effects of genotype and environment on seed chlorophyll degradation during ripening in four cultivars of oilseed rape (Brassica napus). Can. J. Plant. Sci. 1992, 72, 643–649. [Google Scholar] [CrossRef] [Green Version]
  30. Ward, K.; Scarth, R.; Daun, J.K.; Thorsteinson, C.T. Characterization of chlorophyll pigments in ripening canola seed (Brassica napus). J. Am. Oil Chem. Soc. 1994, 71, 1327–1331. [Google Scholar] [CrossRef]
  31. Daughtry, C.S.T.; Walthall, C.L.; Kim, M.S.; de Colstoun, E.B.; McMurtrey, J.E. Estimating Corn Leaf Chlorophyll Concentration from Leaf and Canopy Reflectance. Remote Sens. Environ. 2000, 74, 229–239. [Google Scholar] [CrossRef]
  32. Brewer, K.; Clulow, A.; Sibanda, M.; Gokool, S.; Naiken, V.; Mabhaudhi, T. Predicting the Chlorophyll Content of Maize over Phenotyping as a Proxy for Crop Health in Smallholder Farming Systems. Remote Sens. 2022, 14, 518. [Google Scholar] [CrossRef]
  33. Abadi, M.; Agarwal, A.; Barham, P.; Brevdo, E.; Chen, Z.; Citro, C.; Greg, S.C.; Davis, A.; Dean, J.; Devin, M.; et al. TensorFlow: Large-Scale Machine Learning on Heterogeneous Systems. Available online: https://www.tensorflow.org/ (accessed on 10 October 2021).
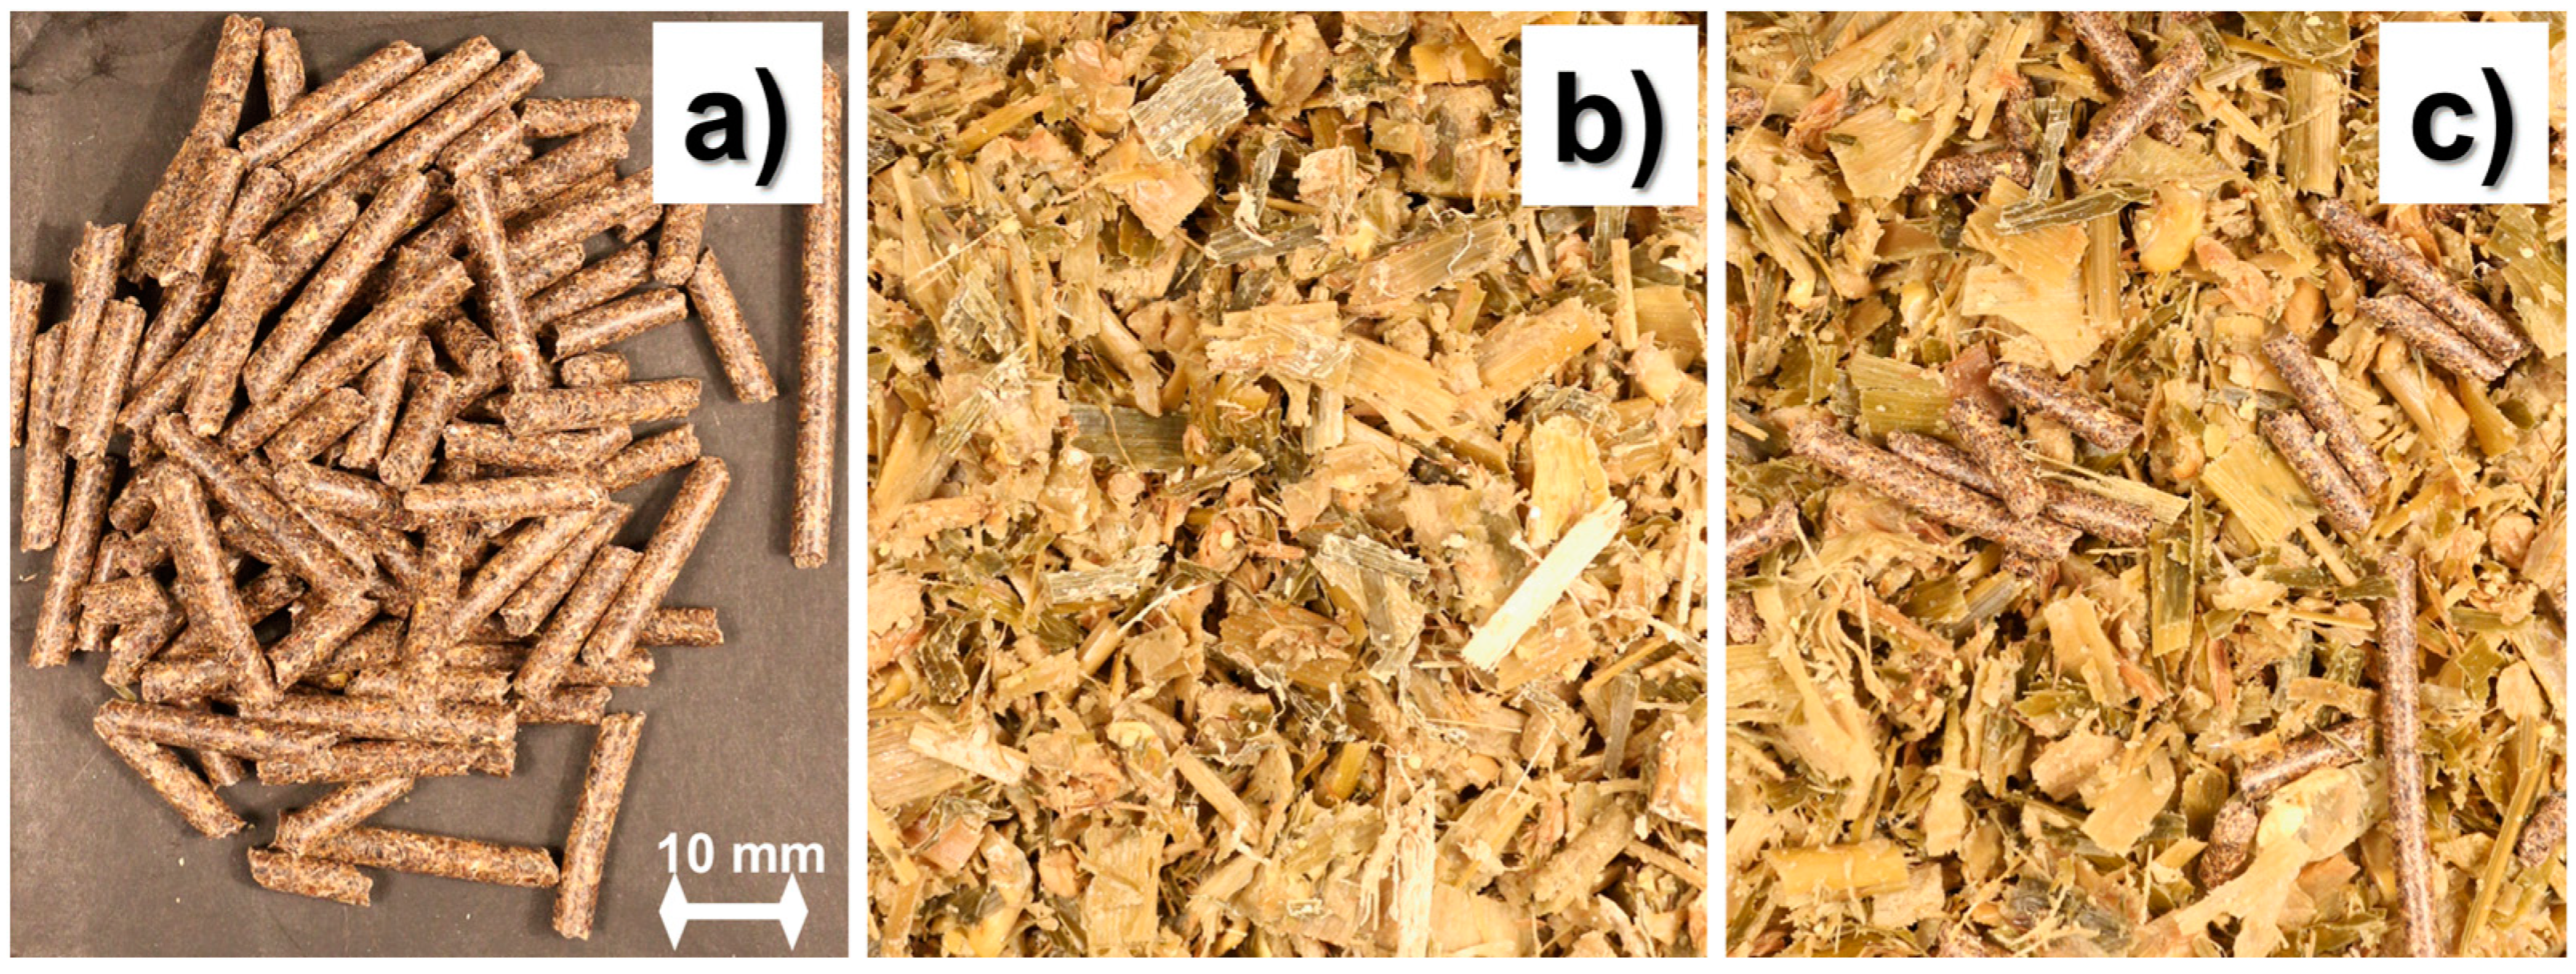
Figure 1. Color photographs of the cattle food mixture components: (a) rapeseed grist pellets; (b) maize silage; (c) mixture of the grist and the silage.
Photonics 09 00521 g001
Figure 2. Consumer camera based (DSLR or smartphone) setup for fluorescence imaging control of grist concentration in cattle food mixture: the LED grow light (450 and 630 nm wavelength) equipped with a blue glass optical filter (SZS-8); smartphone or a DSLR camera equipped with an orange glass filter (OS-13); miniature spectrometer with an optical fiber cable. LED lamp spectrum and colored glass filter transmission spectra are presented in Figure A1.
Photonics 09 00521 g002
Figure 3. Reflectance spectroscopy: (a) photographs of rapeseed grist and individual maize silage components (1—rapeseed grist pellets, 2—maize grain, 3—maize green leaves, 4—maize stalk pulp, 5—maize stalk leaves); (b) reflectance spectra of rapeseed grist pellets and maize silage components; (c) spectral sensitivity of red, green and blue channels of Canon 650D CMOS matrix according to the specification.
Photonics 09 00521 g003
Figure 4. Fluorescence spectroscopy: (a) fluorescence spectra of rapeseed grist pellets and maize silage components with the 450 nm excitation (1—rapeseed grist pellets, 2—maize grain, 3—maize green leaves, 4—maize stalk pulp, 5—maize stalk leaves; see photos in Figure 3a); (b) spectral sensitivity of red, green and blue channels of Canon 650D CMOS matrix according to the specification.
Photonics 09 00521 g004
Figure 5. Distinguishing rapeseed grist pellets and maize silage in fodder: (a) color photograph of the grist and maize silage mixture; (b) fluorescence image as acquired by the color camera (Canon 650D); (c) green-to-red channel ratio in fluorescence image; (d) fluorescence image processed by artificial neural network program to provide binary image with the discriminated rapeseed grist pellets. (The video clip with the color and fluorescence imaging as well as the processed images can be found in Figure A2).
Photonics 09 00521 g005
Figure 6. Calibration curve for quantitative determination of rapeseed grist in fodder with the maize silage matrix.
Photonics 09 00521 g006
Figure 7. Online monitoring of rapeseed grist in the fodder: (a) smartphone based (iPhone 7) setup for fluorescence imaging installed on the fodder mixer; (b) online measurement of grist during fodder preparation procedure (violet color indicates the LED grow light); (c) the captured fluorescence image during fodder preparation in the mixer (small green particles are the rapeseed grist pellets). A video clip captured during the fodder mixing is presented in Figure A3.
Photonics 09 00521 g007
Publisher’s Note: MDPI stays neutral with regard to jurisdictional claims in published maps and institutional affiliations.