1. Introduction
Speed attenuation [
1,
2] occurs in moving objects due to air resistance, and the attenuation coefficient constantly varies with instantaneous speed, which then affects the speed of motion of such objects. A mutual inhibitory relationship between the speed and attenuation coefficient has been previously demonstrated, so the speed attenuation directly affects photoelectric test systems. However, optimal test values can be found through model transformations.
The double-N six-light-screen system [
3,
4] is a passive photoelectric test device used for exploring the rules of object motion. In this system, which uses natural light as a light source, the luminous flux changes as an object passes through each screen, thereby generating a time pulse function. Plane parametric equations are then used to determine the trajectory and speed of an object’s motion, while the yaw angle and pitch angle can reflect the angle of the object’s motion in space. Conventional test systems do not consider the speed attenuation caused by air resistance and approximate a test range as uniform linear motion, so they have been used to establish a significant number of photoelectric test models [
5,
6,
7,
8,
9,
10]. In recent years, the improvements in test systems in terms of accuracy have reached a bottleneck, and no effective improvements appear achievable through hardware upgrades or algorithm optimizations. Therefore, the rules of speed attenuation, with respect to moving objects, have become one of the important factors for analyzing novel test systems.
In this paper, the attenuation coefficient was introduced into a double-N six-light-screen system, and through analysis of test results, we found that the origin selection for the coordinate axis of the pulse time in this test system directly affects the test accuracy. Mass data were then organized and sorted to find the optimal position of origin selection for the coordinate axis. In addition, our results were verified through theoretical simulations and field experiments. This study is of great practical significance for the optimization of photoelectric test systems for studying moving objects.
2. Materials and Methods
Our double-N six-light-screen system consisted of two three-light-screen groups [
11], as shown in
Figure 1. When the flying target passed this test system, six groups of pulse signals were generated through each light screen to calibrate the passing time. Plane parametric equations were then formulated based on the testing of several physical quantities, such as motion angle, speed, and distance.
Using conventional methods, since the test interval was short, and the trajectory of motion could be regarded as a straight line, the vertical displacement deviation caused by gravity was ignored. However, large errors occur for objects with a large windward area, since the motion process can be considered to be uniform. When an object with mass m and windward area S moves in air, air resistance causes this moving object to accelerate in the reverse direction, and the accelerated speed is affected by the resistance coefficient C [
12], given by
where
refers to the air density, and
refers to the instantaneous speed of the moving object, while
is the speed attenuation coefficient. We found in this study that the resistance coefficient was almost unchanged and could be regarded as a constant when the initial speed of the object motion (
) was less than the speed of sound. The time integral was calculated by both sides of the above equation as follows:
When the test distance was
, the attenuation coefficient could then be expressed as
where
refers to the final speed. The attenuation coefficient directly reflects the initial conditions of the flying test on objects and is a critical factor to find the real-time speed and time of target fall.
In the conventional processing of the data gathered using this double-N six-light-screen system, the origin was generally selected on the first screen to establish a pulse-time axis perpendicular to the first screen, as shown in
Figure 2a, so as to indicate the pulse time of passing through each light screen to find the plane parametric equations with position coordinates for calibration. In order to be unified with the measurement position of the initial velocity
, the origin of the coordinate could also be set at the S position in front of the first scene, as shown in
Figure 2b, and the common S could be taken as 2 m or 4 m. Through numerous theoretical studies and acquisition of test data, we found that the test results were more accurate when a pulse axis was established with the distance center of two light-screen groups as the origin, when speed attenuation was taken into account, as shown in
Figure 2c.
In the new model with the distance center of two light-screen groups as the origin, when the object was normal and incident to the first screen, with the change of the spacing between the two light-screen groups, the axial velocity test error of the moving object is as shown in
Figure 3.
It can be seen that the test error of the axial speed was smaller when closer to the origin of the pulse axis, and the minimum error was obtained at the origin. When the distance between the light-screen groups was set to 4 m, the effects of yaw angle and pitch angle on the test error in the axial speed of the moving object were as shown in
Figure 4 and
Figure 5.
It could, thus, be established that the angle of oblique incidence of a moving object had almost no effect on its axial speed, and the minimum error still appeared at the origin of the pulse axis. The establishment and selection of a pulse axis directly affected the establishment of plane parametric equations for this system, resulting in varying test results. Significant error rules of axial speed were discovered through the pulse axis established in the above form, which could also make the axial distance of light-screen groups more flexible. Some random-angle errors were easily produced in the yaw and pitch directions due to various uncertainties of the emitter. Establishing this axis effectively overcame such uncertainties, thereby making the test results more reliable.
3. Results
When the attenuation coefficient
, the initial speed
, and the distance between the two light-screen groups =
, the traditional selection of the pulse axis was retained, and the origin of the pulse axis was set to the distance center of the two light-screen groups. Other conditions remained unchanged, and the yaw-angle error of the two-dimensional test plane of the vertical axis was observed, as shown in
Figure 6.
The yaw-angle error of the traditional model was not affected by the pitch coordinate and increased with the increasing yaw coordinate. The yaw-angle error of the new model was
degree and fluctuated with the pitch coordinate Y, which revealed certain statistical empirical rules for this system. The yaw-angle error was affected equally by the yaw coordinate and the pitch coordinate. As the pitch-angle error was not affected by the yaw coordinates, the pitch-angle error of the traditional model and the new model were observed, as shown in
Figure 7.
The pitch error of the traditional model increased linearly with increasing the vertical coordinate of the test plane, and the angle error often reached several zero degrees. In contrast, the test accuracy of the new model was significantly improved, which followed a certain statistical-distribution law, which provided an effective compensation method for a small angle error for the emitter.
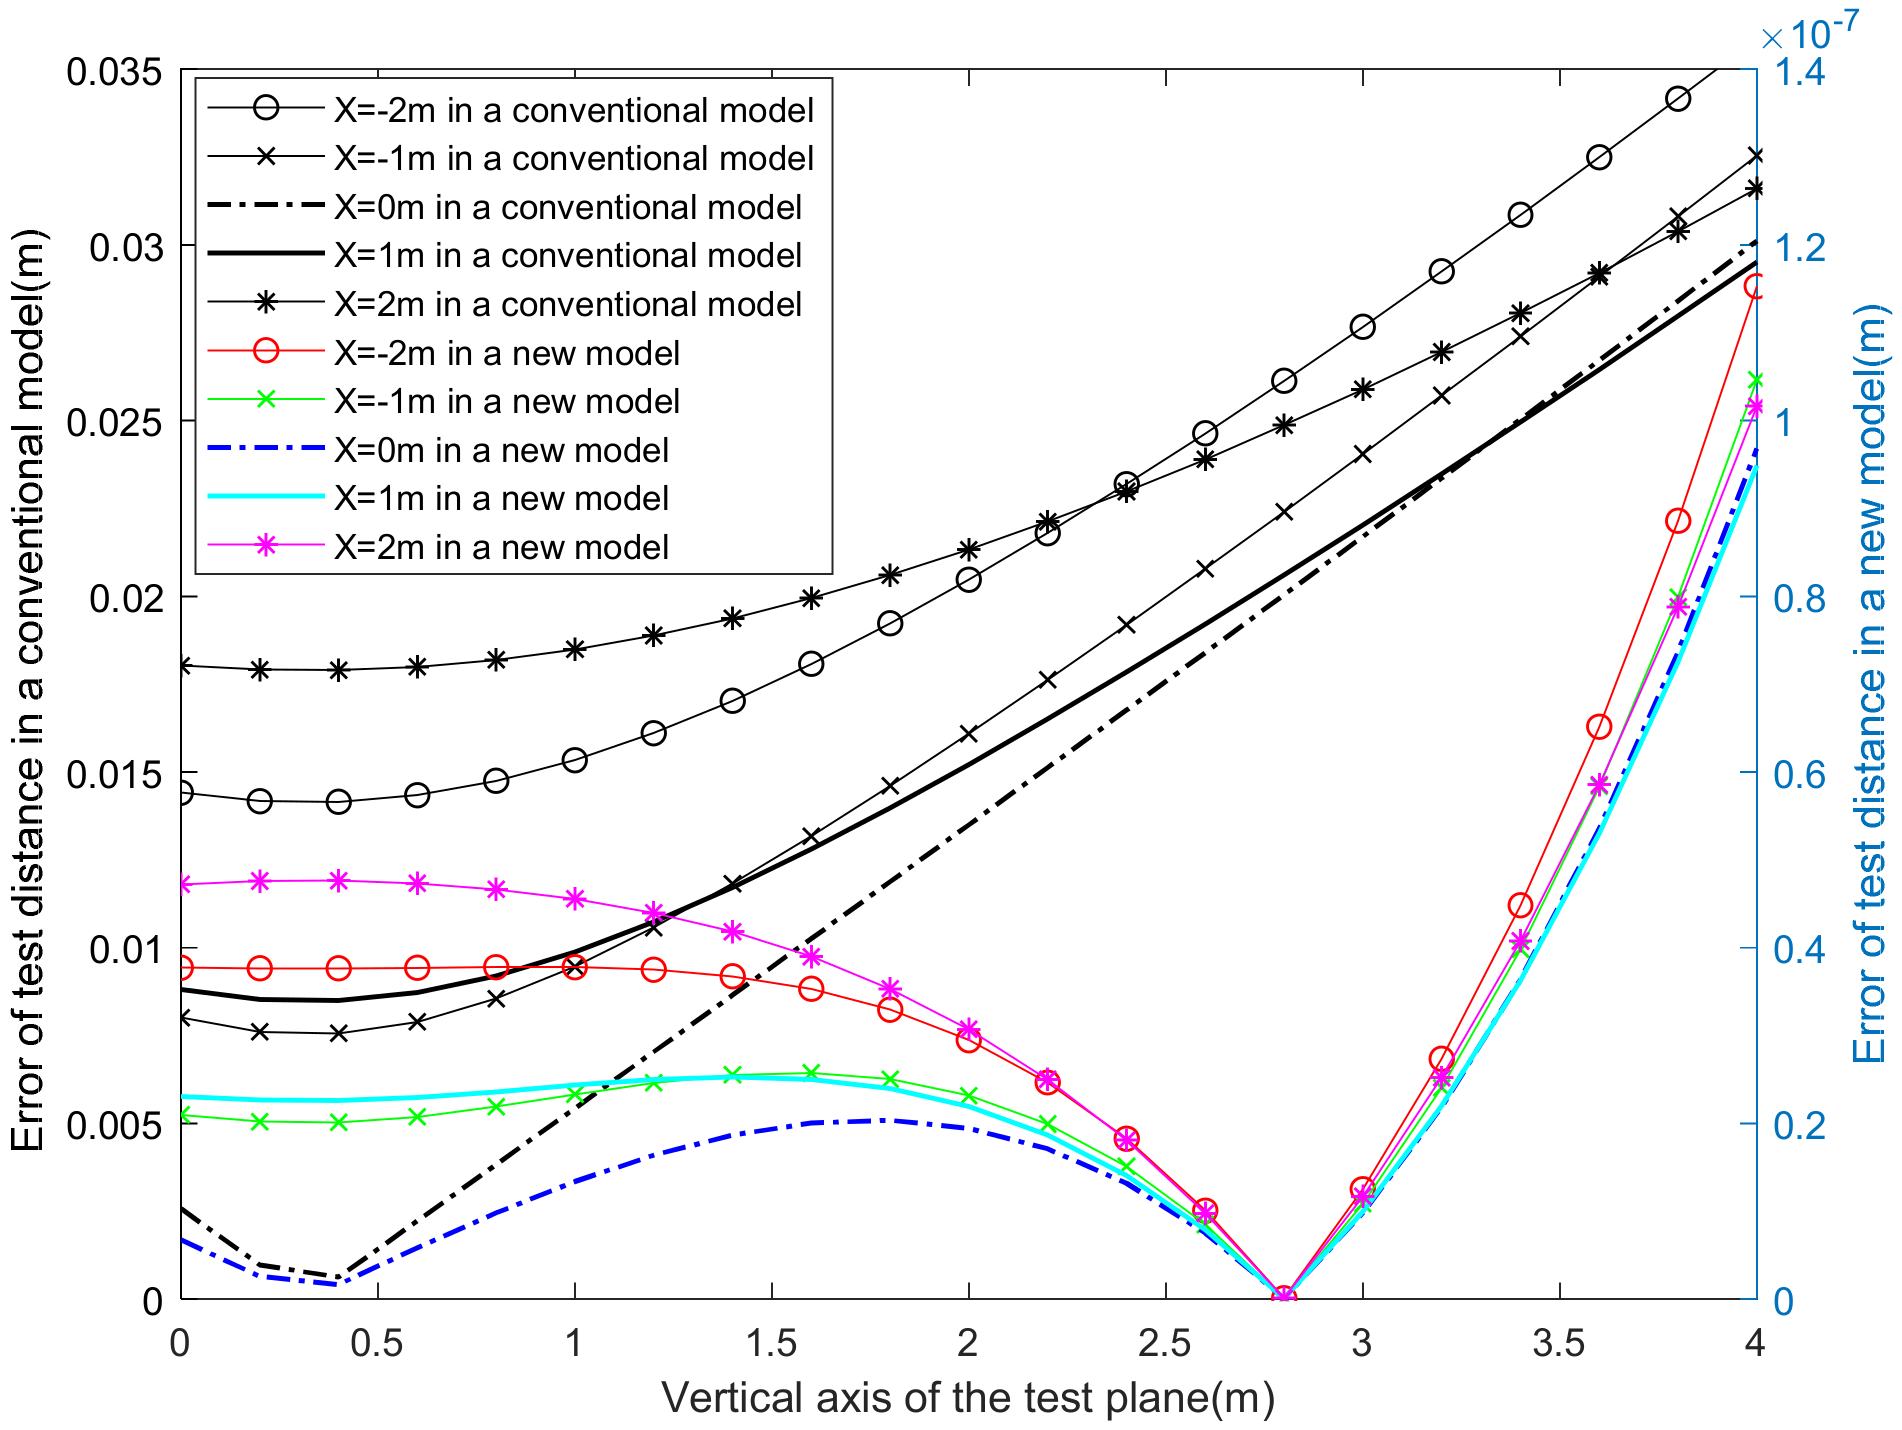
When speed attenuation during object motion was not considered, there was an error of the axial speed with a magnitude of
and an error of the test distance with a magnitude of several tenths of a meter for a conventional pulse axis. When an attenuation coefficient was introduced, and all the initial conditions were the same as above, the axial velocity errors of the two models were as shown in
Figure 8.
In the conventional model, the test error after considering velocity attenuation was slightly improved over that of nearly uniform operation. The axial-velocity error could be controlled in the range of
in a vertical coordinate range of ±4 m. The influence of pitch coordinate on the axial-velocity error was more obvious than that of yaw coordinate X. Under the same conditions, the distance error of the two models is as shown in
Figure 9.
In the traditional model, within a vertical coordinate range of ±4 m, the distance error was less than 0.04 m. The test-range error of the new model was significantly improved, and the range error was on the order of . Taking a test distance of 8 m as an example, the relative error of the traditional model was not higher than 0.005, while the relative error of the new model was not higher than , which was very favorable for the testing of small-volume moving objects.
To verify our simulation results, a large number of experiments were performed with mud pellets of different masses and windward areas in a sunny and windless field environment, and the test differences of the pulse axis in the plane parametric equations solved with different-origin coordinates were directly reflected by the coordinate and speed deviations. In the process of our experiments, the real-time attenuation coefficient was calculated using Formula (3), and the distance between light-screen groups for each experiment was unchanged. Only an initial condition is enumerated in this paper, with 3966 mm as the distance between light-screen groups and 78.5 mm
2 as the windward area of the mud pellets. When the origin of the pulse axis was selected on the first screen, the resulting average values of B and the pulse-time calibration are as shown in
Table 1. The corresponding test coordinates were compared with vertical plane coordinates, which were regarded as standard values, to determine the horizontal and vertical position deviations, and the test speed of mud pellets was compared with the speed derived theoretically, which was regarded as the standard value, to determine the relative speed deviation, as shown in
Table 2.
Therein, δx and δy refer to the horizontal positional deviation and the vertical positional deviation, respectively, obtained by subtracting the statistical average from the difference between the test value and the standard value. Δv refers to the difference between the test speed and the standard speed. Under the same conditions, when the origin of the pulse axis was selected at the center of two light-screen groups, the average values of B and the pulse-time calibration are as shown in
Table 3. Similarly, the test coordinates and speed were compared with their standard values to determine their relative deviations, as shown in
Table 4.
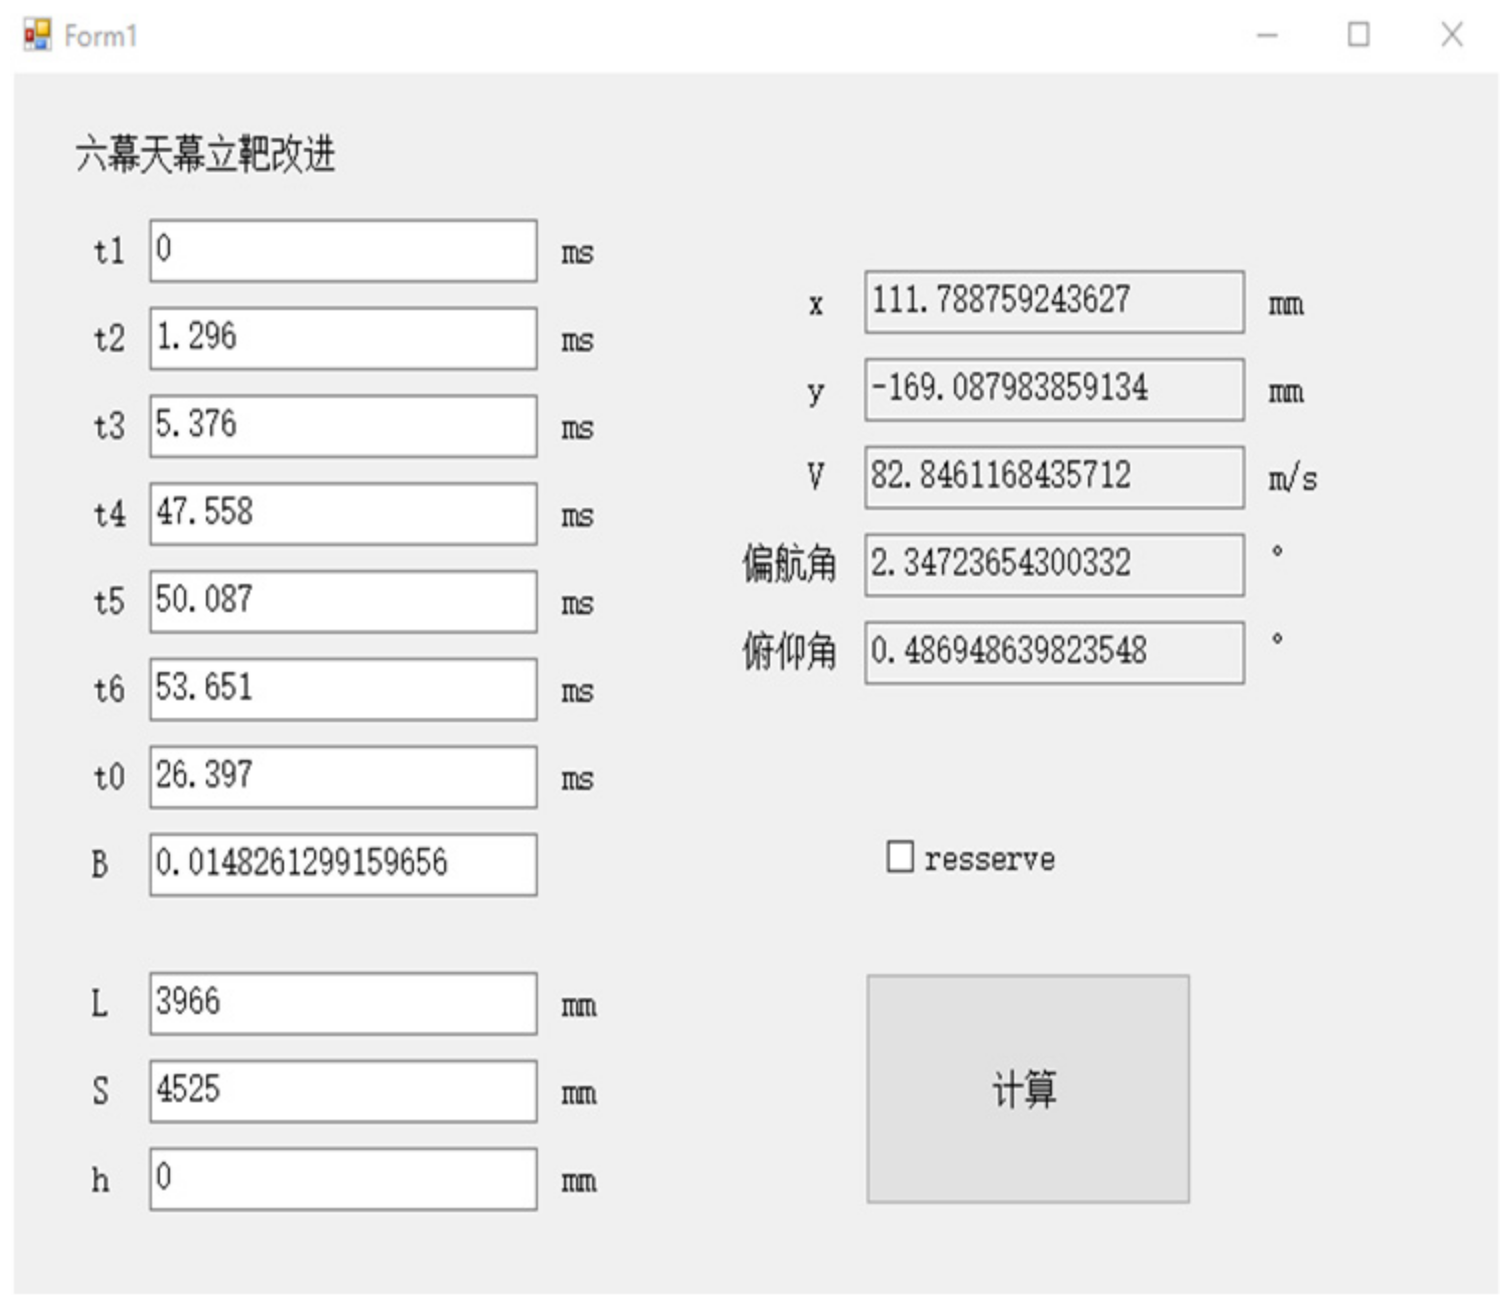
It can be seen from the above data that the results of the plane parametric equations solved with the origin of the pulse axis selected at the center of the two light-screen groups were more accurate than those solved using a conventional method. The test speed could be increased by an order of magnitude as it was affected by many complicated factors, including atmospheric turbulence during the field experiments. The coordinate accuracy could be improved by one to two orders of magnitude in a test interval of nearly 4 m, which significantly improved the error in the calculated distance. To more accurately verify the test accuracy of the yaw and pitch angles, these angles were visualized using a photovoltaic-conversion data-acquisition and analysis system. The test interface is shown in
Figure 10. Apparent statistical rules of fluctuations were reflected in data obtained through our new calibration model.
The experimental data were highly consistent with our theoretical-simulation results and fully reflected the advantages of calibrating the origin of the pulse axis at the center of the light-screen groups. To ensure the optimization of data, on the pulse axis, the time origin was selected randomly several times. The results obtained were less accurate and even the accuracy differed greatly compared with the results obtained through the calibration method proposed in this paper.
5. Conclusions
In our conventional double-N six-light-screen test system, for moving objects, the test accuracy of the parameters to be tested was improved to a certain degree if speed attenuation was taken into account. From our tests, we found that the impacts on our test results were more evident with different positions for the origin of the pulse-time axis. When the coordinate origin was selected at the center of two light-screen groups, the test accuracy of all parameters was further improved. A group of initial conditions was randomly selected from a large number of experiments in this paper, and a comparison was made through theoretical simulation, leading to the conclusion that the errors of the yaw angle and pitch angle were improved by five to six orders of magnitude using certain statistical-fluctuation rules. Moreover, the error of the axial speed was improved by an order of magnitude and was no longer affected by yaw coordinates. The distance error was improved by five orders of magnitude using our model. Through field experiments with mud pellets, the discovered rules were consistent with the results of our theoretical analysis. This not only reflected the impacts of the theoretical errors on this photoelectric test system for moving objects but also showed the importance of establishing plane parametric models.
Similar to conventional calibration methods, normal incidence was in the typical emergence direction of the emitter, and the magnitude of error for small-angle oblique incidence was almost identical to that of normal incidence. However, there were significant differences in the large-angle oblique incidence, requiring further independent study. In the case of smaller measured distances and larger initial speeds, the vertical-displacement deviation caused by gravity can often be neglected and was shown to have little effect on this test system.


