Article

Combined Non-Invasive Optical Oximeter and Flowmeter with Basic Metrological Equipment

1
Moscow Regional Research and Clinical Institute (MONIKI) named after M.F. Vladimirskiy, 129110 Moscow, Russia
2
Optical Medical Diagnostic Systems LLC, 142290 Pushchino, Russia
*
Author to whom correspondence should be addressed.
Photonics 2022, 9(6), 392; https://doi.org/10.3390/photonics9060392
Submission received: 10 May 2022 / Revised: 28 May 2022 / Accepted: 30 May 2022 / Published: 2 June 2022
(This article belongs to the Special Issue Advances in Modern Photonics)

Abstract

:
Optical non-invasive diagnostic methods and equipment are used today in many medical disciplines. However, there is still no generally accepted and unifying engineering theory of such systems. Today, they are developed most empirically and do not always have the desired effectiveness in clinics. Among reasons for their insufficient clinical efficiency, we can claim the limited set of measured parameters, the poorly substantiated technical design parameters, and the lack of metrological certification, which all together lead to large uncertainties and inaccuracies in diagnostic data. The purpose of this study is to develop a new instrument for non-invasive optical oximetry by means of substantiating and creating amore informative tissue oximeter with an enhanced number of measured parameters and equipped with the basic metrological tools—imitational measures. The combination of two related optical diagnostic techniques—a tissue oximetry, including a cerebral one, and a fluctuation flowmetry on a single hardware platform—was used. Theoretical modeling of light transport in tissues was applied to substantiate the main technical design parameters of the device. For each measuring channel, relevant imitation measures for metrological verification and adjustment have been proposed. Some common principles for the operation of such equipment are described in the article, as well.

1. Introduction

Different optical non-invasive diagnostic methods and equipment are used today in many medical disciplines. The most well known among them are pulse oximetry [1], photoplethysmography [2], optical cerebral oximetry [3], laser Doppler flowmetry (LDF) [4], optical coherence tomography [5], diffuse correlation spectroscopy (DCS) [6], etc. However, not all of them have the desired efficacy in clinics yet. This especially concerns photometric quantitative methods and instruments, which measure numerical values of certain biomedical parameters, and, therefore, should be considered measuring systems equipped with the corresponding metrological tools [7]. Among the known technologies, today only pulse oximetry has the necessary metrological substantiation and maintenance; therefore, it can be considered a measuring technique with understandable metrological characteristics [8]. Other technologies and devices are still poorly developed even in theoretical terms.
It is a consequence of the situation that at present, optical non-invasive diagnostics is only developing, so there is still no generally accepted and harmonized engineering theory of such systems [9]. Today, such systems are developed most empirically based on general physics and physiological principles, whereas the theory of diagnostic instrumentation and metrology largely exists aside. Nevertheless, we cannot claim that the theory of such systems is not developed at all. There are examples and attempts to generalize approaches to the creation of optical flowmetry systems [10,11], to develop basic standards for cerebral oximetry [12], and to substantiate medical and technical requirements for noninvasive spectrophotometric diagnostic devices [13]. Much attention is paid to the development and study of imitation measures (tissue phantoms) for tuning up and testing diagnostic flowmetry and oximetry instruments [14,15,16]. However, in our opinion, for now these are all still separated pieces.
Approximately 20 years ago, an attempt was made to develop such a basic theory on the example of multifunctional laser diagnostic systems [17,18]. It was shown that many noninvasive spectrophotometric techniques, including tissue oximetry and flowmetry, can be simultaneously used on a single hardware and software platform. It simplifies the hardware design and reduces its cost, increases a number of measured parameters, and, therefore, increases the clinical efficiency of diagnostics. In addition, a set of solid-state imitation measures (gauges) with tissue-like optical properties was developed for this combined diagnostic technique [19]. Due to the usage of standard solid-state industrial materials, all measures were easily reproducible and optically chronostable, i.e., their optical properties were stable over a long period of time.
The most basic principles of that approach are applicable to noninvasive tissue oximetry, as well. In this way, according to [7,12], one of the main problems is the metrology. In spite of the metrology being a necessary part of any measuring technique, especially in medicine in order to make medical diagnostics as accurate as possible [20], existing optical tissue oximetry does not have appropriate and certified metrological equipment and maintenance yet. As a result, different oximeters from different manufacturers, especially those for cerebral tissues, often provide a large discrepancy in readings [21,22].
The purpose of this study is to develop a new instrument for non-invasive optical oximetry by means of substantiating and creating a more informative multifunctional oximeter with an enhanced number of measured parameters and with basic metrological equipment. In the study, we propose a new tool that combines two related optical diagnostic techniques: tissue oximetry, including cerebral oximetry, and fluctuation flowmetry. However, our goal is not only to create a new device, but also to lay the foundation for its subsequent metrological certification. In this context, working prototypes of imitation measures for each of the measured physiological parameters were created in order to provide metrological verification and adjustment of diagnostic channels. The combination of two techniques in one device required a solution of a number of other related problems—in particular, the substantiation of the working cyclograms for light sources, the substantiation of a new design of the cerebral sensor, etc. Thus, the integrated approach developed for the creation of more informative and metrologically verifiable optical noninvasive diagnostic measuring systems for medicine is across-cutting idea and one of the main results of this work.
In the context of the present study objectives, the following presentation seems convenient. First, it is necessary to justify the need to develop such a complex device as well as to indicate which parameters it should measure. This will be done in Section 2. Section 3 is devoted to the design of the device and, particularly, Section 3.1 describes its general idea. Since the principles of measurement and the design of the peripheral and cerebral optical probes of the device are different, it is convenient to describe these channels separately in Section 3.2 and Section 3.3. The main results of the metrological tools of the oximeter are given in Section 4, separately for peripheral (Section 4.1) and cerebral (Section 4.2) channels. Finally, in Section 5 we discuss the results and present a number of conclusions of the work.

2. Substantiation of Advantages to Develop a Multifunctional Oximeter

As mentioned above, among reasons for insufficient clinical efficiency of existing noninvasive (in vivo) photometric diagnostic methods and instruments in medicine, we can claim the limited set of measured parameters, the poorly substantiated technical design parameters, and the lack of metrological validation and certification, which all results in large uncertainties and inaccuracies in real diagnostic data. Based on ideas [17,18,19], in this study we attempted to improve the design of optical non-invasive oximeters and increase their clinical potential by means of:
  • The extension of a set of measured parameters;
  • The substantiation of a number of the most important technical design parameters;
  • The development of the initial tool for metrological tuning of measuring channels.
From the medical point of view, a number of parameters characterize a peripheral hemocirculation, including blood microcirculation. Among them, we should mention the following three main parameters:
(1) StO2, the so-called tissue oxyhemoglobin saturation, which means a part of the total hemoglobin that is oxygenated (contains oxygen) in the mixed blood (arterial + venous) in a diagnostic volume of cellular tissues being investigated beneath the optical probe.
(2) Vb, the relative blood volume, i.e., the fraction of blood in a diagnostic volume beneath the optical probe.
(3) BF, the blood flow (in perfusion units) through the diagnostic volume.
Thus, all of them should be measured and analyzed simultaneously for both body sides (left and right) to make the most efficient and sound diagnostic conclusion. Indeed, there are known attempts to simultaneously measure StO2 and BF—for example, using a combination of diffuse speckle contrast analysis (DSCA) and near-infrared spectroscopy (NIRS) [23]. However, frequently, only one parameter is measured. Particularly, in the conventional cerebral oximetry, StO2 for cerebral tissues is the only measured quantity. A number of cerebral tissue oximeters—INVOSTM 5100C Cerebral/Somatic Oximeter (Medtronic plc, Minneapolis, MN, USA), for example—also provide a registration of StO2 in other peripheral zones, which is often called “somatic StO2”. In addition, there are combined devices on the market that provide a simultaneous registration of StO2, Vb, and BF in superficial tissues, but with the use of a number of hardware units. As an example, we can note the Moor Instruments Ltd (Axminster, Devon, UK) products: the moorVMS-OXY Superficial Tissue Oxygenation Monitor and the moorVMS-LDF Laser Doppler Monitor [24]. However, solutions for combining a cerebral oximeter, a peripheral tissue oximeter, and a flowmeter in one device—the most effective combination for practical medicine, including critical care medicine—are not known. This is partly due to the high cost of single-mode lasers, optical fiber probes, etc., which are usually needed for laser-based flowmetry techniques (LDF, DCS, DSCA, etc.). Recently, we showed that noninvasive flowmetry can be realized using a simple optical probe with light-emitting diodes (LEDs) [25]. This provides a number of advantages compared to laser-based techniques, such as the low cost, first of all. This technique is called “incoherent optical fluctuation flowmetry” (IOFF), and it opened the way to combining oximetry and flowmetry techniques in one simple LED-based optical probe.
From the technical point of view, the design of such medical devices is quite unified. All of the devices have light sources, photodetectors, microcontrollers, etc., i.e., quite standard optical and electrical units and blocks. The differences between devices are mainly in signal processing methods that today are easily performed by software. Therefore, it is logical to use a single hardware platform and advanced software instead of several pieces of equipment to combine several diagnostic techniques.
The theoretical physical basis of the tissue oximetry is well known [1,8,12]. Fractions of oxy-and deoxy-hemoglobin in blood have significant differences in their optical molar extinction coefficients for several visible and near-infrared (IR) wavebands. It allows StO2 to be evaluated by irradiating tissues with optical radiation of different wavelengths and by registering the backscattered part of the illuminating flux. Some wavelengths fall on the isobestic points of hemoglobin, which are convenient for the calculation of Vb. These wavelengths can be useful for the IOFF technique to register BF, as well. Therefore, the same LEDs in one optical probe allow both oximetry and flowmetry techniques to be performed. Two types of optical probes are needed to combine peripheral tissue oximetry and flowmetry together with cerebral oximetry. Thus, to simultaneously execute all measurements on both sides of the body, our new multifunctional oximetry should have one main electrical unit to control light sources, to collect and process all registered signals, and to conduct right and left peripheral remote optical probes, as well as right and left remote cerebral optical probes. Unlike analogues, it will be the most complete multifunctional oximeter to date. However, to have the technically substantiated instrument design we need to equip it with theoretical justification and basic metrological tools.

3. The Multifunctional Oximeter Design

3.1. The System as a Whole

Following the above idea, we considered a four-channel combined oximeter and flowmeter. As in analogues, we used two symmetrical optical probes—left and right probes—for each diagnostic technology. Two optical probes (left and right) implement peripheral tissue oximetry and flowmetry, and two more optical probes implement cerebral oximetry (a type of tissue oximetry). The central electronic unit of the device provides the digitization of signals, distribution of control signals by channels, and collection of diagnostic signals from them. It also provides a communication with the control computer, as well as a power supply for the entire system.
Typically, cerebral oximetry channels are built according to the principle of multi- distance measurements: Two photodetectors are placed in a line at different distances from light sources in order to separate the contributions of cerebral and extracerebral tissues to the registered signal [26,27]. Thus, each channel of the most popular commercial cerebral oximeters in optical probes, such as the well-known INVOS 5100C regional oximeter (Covidien, Medtronic, Minneapolis, MN, USA), contains two or more LEDs for different wavelengths and two photodiodes for which two signal amplifiers are necessary.
Each channel in the case of peripheral tissue oximetry also contains at least two light sources for different wavelengths (LEDs) and two drivers of these sources, but one photodiode and one signal amplifier, since multi-distance measurements are not required in this case.
However, it is also known that each photodetector with an electronic amplifier is itself a source of noise, which affects the accuracy of measurements. In this sense, the peripheral tissue channel is more noise-resistant with a better signal-to-noise ratio (SNR) since the source–detector distance is shorter and, hence, the corresponding signal is larger in amplitude than signals in a cerebral oximetry optical probe, especially for the most distant photodiode due to the larger source–detector separation. Thus, when designing a cerebral optical probe, the SNR should be a subject of close attention. This is not so crucial for a peripheral tissue probe, but, taking into account weaker signals and two amplifiers, the noise characteristics become decisive and require detailed study in the case of a cerebral optical probe.
Even from such a cursory analysis, a simple constructive solution to improve the noise characteristics of a cerebral optical probe arises. It consists of replacing the idea of two photodiodes and two amplifiers with the idea of one photodiode, one amplifier, and two pairs of light sources located at different distances from the photodiode [28,29]. When an IR light source, i.e., a powerful LED, warms up and reaches its normal operating mode, it creates fewer noise components than a high-gain precision photodiode signal amplifier. It is difficult to match two amplifiers with the same noise, so the elimination of one of them is already a step towards increasing the noise immunity of the cerebral channels. Moreover, two IR LEDs are usually less expensive than one photodiode together with the high-quality amplifier.
Another advantage of this design is the timing cycle of signals in the system. It becomes more flexible with this cerebral channel design. In optical tissue oximeters as well as in pulse oximeters implementing several emission wavelengths, the most well-known technical solution to avoid the simultaneous appearance of radiation at several wavelengths, as well as for eliminating the effect of ambient light, is the pulse-periodic separation of signals from LEDs in time [30,31]. This excludes the cross-illumination of the photodiode with different wavelengths and allows the level of ambient light during the period when all emitters are turned off to be measured.
Considering an LED timing diagram for our multifunctional four-channel oximeter with different variants of cerebral optical probe design, the following can be noted. In the case of the conventional version of cerebral optical probes with two photodiodes in both probes, a new multifunctional oximeter will have six photodiodes (one in each peripheral tissue probe and two in each cerebral probe) and four types of LEDs (two wavelengths for peripheral tissue probes and two for cerebral ones). Assume that LEDs of one of the two wavelengths can be turned on simultaneously in all probes and let time τ be required to digitize and to record a signal from each photodiode. Then, two modes of an LED timing diagram are possible (Figure 1). The two modes differ by a sequence of background signal registration, which is performed in the time intervals when LEDs are turned off. In both cases, the total cycle duration is 18τ. In this sense, both modes are equivalent.
At the same time, considering a new cerebral optical probe with one photodiode and four LEDs, two variants of cyclograms will differ (see Figure 2). In the first case (Figure 2, left), the total cycle time for cerebral sensors increased to 24τ due to a larger number of LEDs, whereas in the case of peripheral tissue probes, two cycles can be organized during this time, i.e., the duration of one cycle for these channels decreased to 12τ. This allows data to be recorded with a higher sampling rate, and therefore, a wider frequency range of signal fluctuations according to the Nyquist criterion can be analyzed. For the second mode (Figure 2, right), the total cycle time for both probes was reduced to 16τ. What is important, switching between two modes can be realized by software without any changes in the oximeter’s hardware. This gives an additional advantage to the variant with one photodiode.
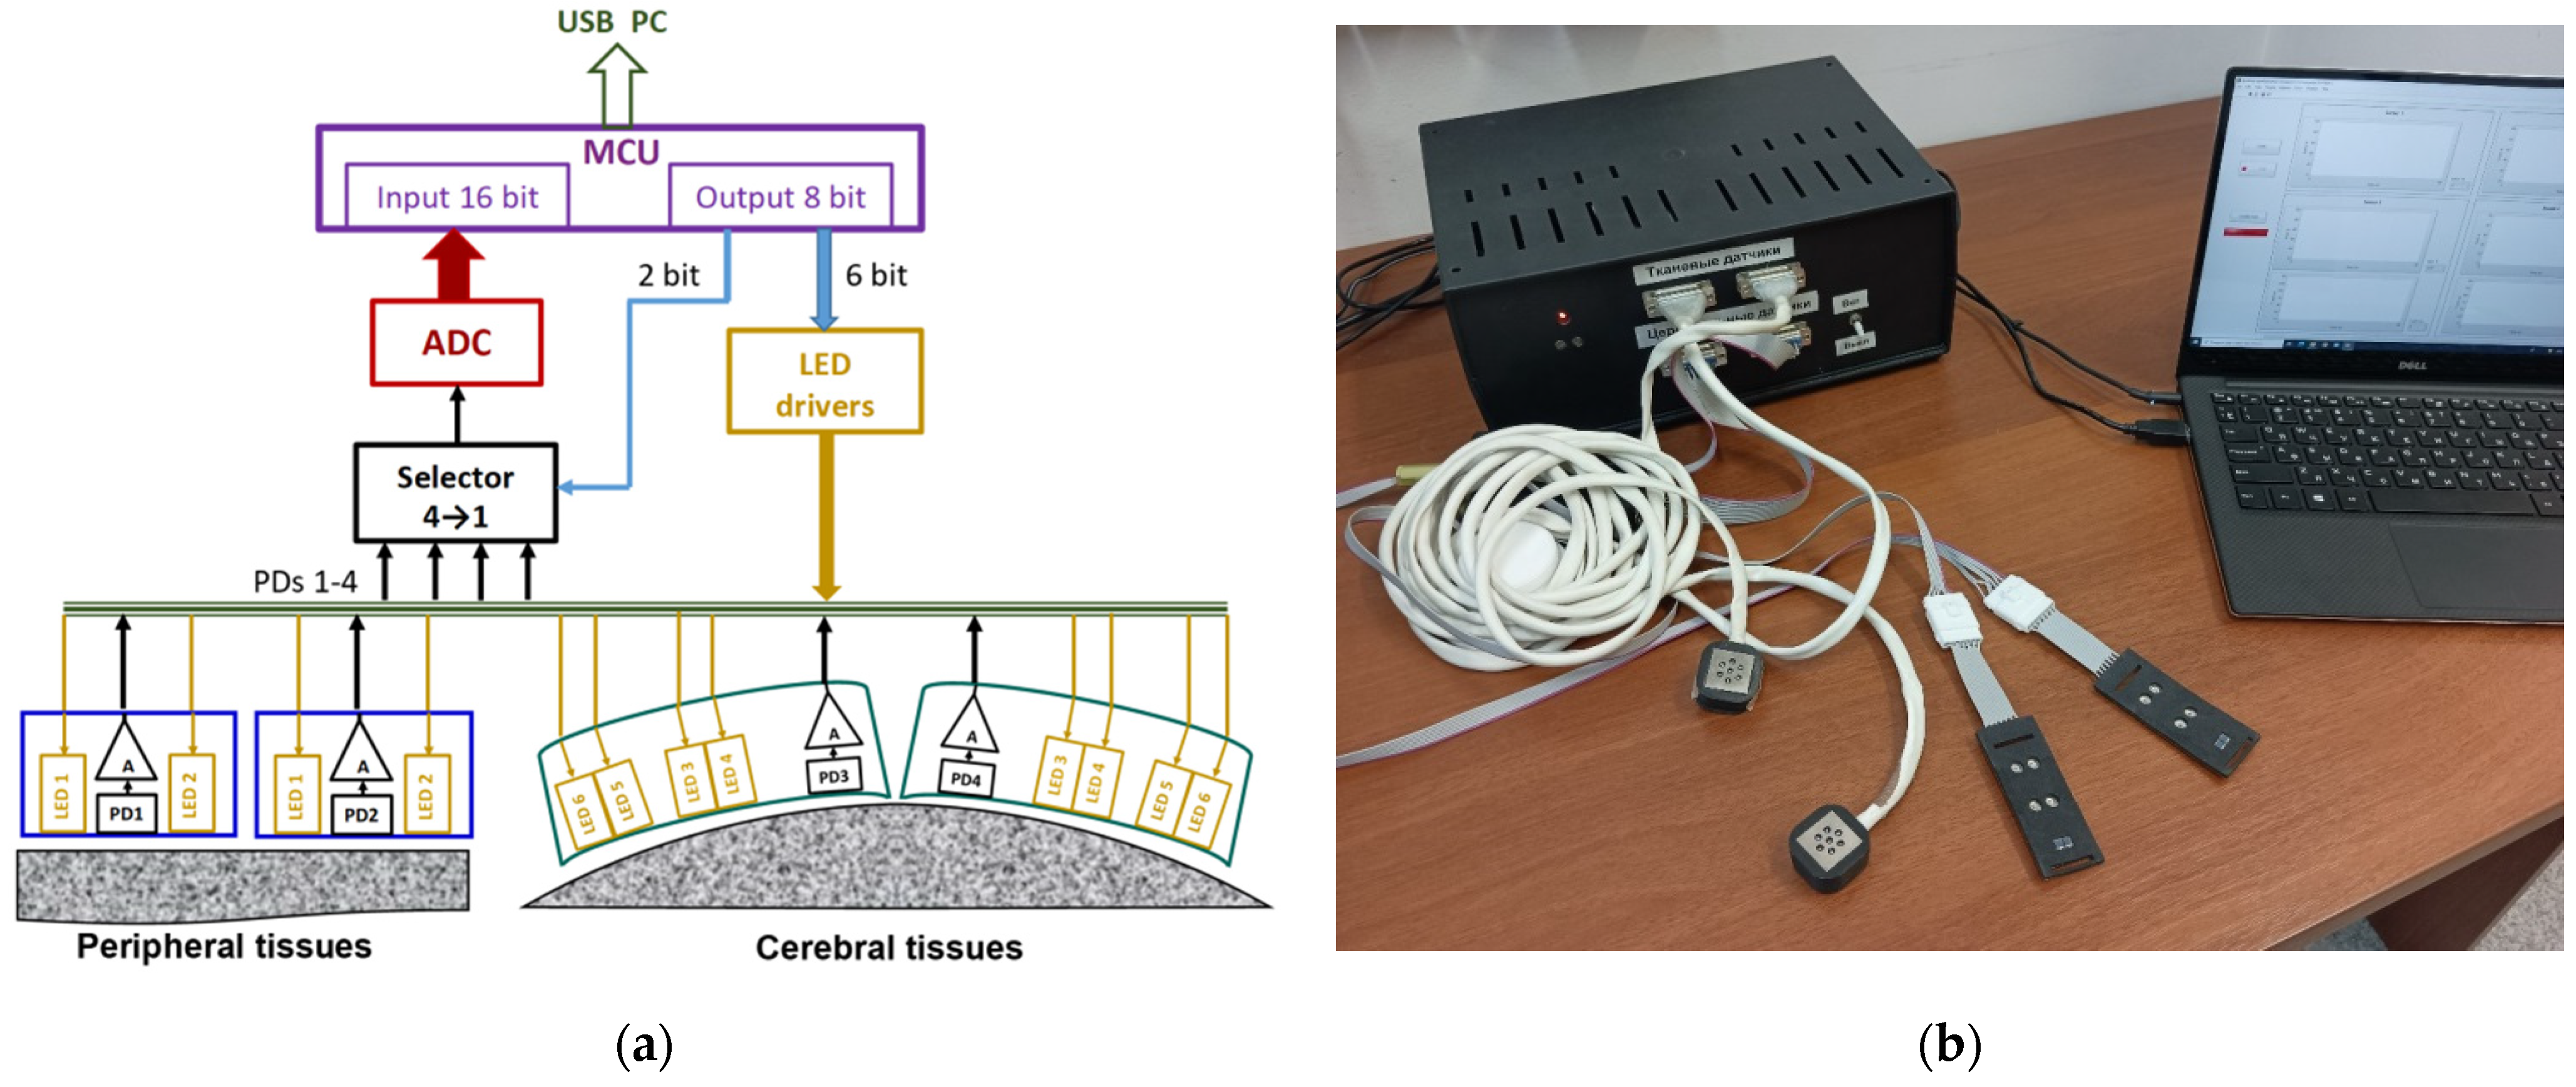
The details described above determine the necessary hardware configuration (Figure 3a). A new multifunctional oximeter should contain electronic units for controlling LEDs in optical probes—LED drivers, a unit for data acquisition from the probes, and a microcontroller unit (MCU). The data acquisition unit consists of a selector of signals from photodiodes and the analog-to-digital converter (ADC). The MCU controls the LED drivers and the data acquisition unit and transmits data to the computer via USB. Following this concept, the prototype of the multifunctional oximeter shown in Figure 3b was developed.
The following sections of the article are devoted to the substantiation of technical characteristics of the oximeter channels and to the development of the base metrological equipment for it. Since most of the channels and probes perform similar functions, and the length of the article is limited, we will not consider in detail all the characteristics and full metrological equipment for each channel, but rather will focus on the most specific functions and parameters for each of the channels, so that the general approach and idea of the development are clear.

3.2. Peripheral Tissue Probe Design

In the recently proposed incoherent optical fluctuation flowmetry (IOFF) technique [25], the blood flow (BF) is proportional to blood volume changes in a tissue per unit time. Unlike all known laser-based flowmetry techniques, IOFF does not require the use of optical fibers and lasers and makes it possible to obtain a signal from a larger volume of tissue (tens of mm3). BF is calculated as the first moment of an alternating photocurrent amplitude spectrum normalized to the direct photocurrent component:
B F = 1 B k = 1 n f k · i a c , k i d c ,
where B is a coefficient depending on optical properties of the tissue examined, n is the total number of all low-frequency fluctuations of the registered photocurrent, i a c , k is the alternating photocurrent amplitude of the k-th fluctuation, f k is the frequency of the k-th fluctuation, and i d c is the amplitude of the direct component of the photocurrent.
When developing a peripheral tissue optical probe with combined oximetry and IOFF technology, it is necessary to select and substantiate the basic design parameters of the probe, i.e., wavelengths, the number of LEDs and photodetectors, the distance between them, etc. To implement the IOFF technique, one of the isobestic points must be used as the wavelength, at which the absorption of light by oxy-hemoglobin (HbO2) and de-oxyhemoglobin (Hb) is practically the same [25]. This is necessary to eliminate the difference in measurement results associated with unequal light absorption by arterial and venous blood. Herewith, the green waveband is most sensitive to blood pulsations due to strong light absorption, which makes it possible to obtain the initial signal for IOFF with the maximum SNR [32]. Thus, we selected the isobestic points at 525, 568, and 805 nm for further investigation. To implement the tissue oximetry, it is necessary to use at least two wavelengths, one of which is isobestic (reference), and for the second, the absorption of light by HbO2 and Hb should differ as much as possible. At such wavelengths, 660 nm and 940 nm are generally used [1]. We also added the 470 nm spectral point for investigation.
The information on the penetration depth is also important in StO2 measurement data analysis, since it allows one to know the volume of the tissue being investigated, to which the measured StO2 value is applicable [33]. Since light of different wavelengths penetrates biological tissues at different depths, we needed to choose two wavelengths of LEDs for oximetry optical probes in order to have a penetration depth for them that was as near as possible to ensure the minimum difference in the diagnostic volume for both wavelengths.
For such an analysis, we calculated the mean penetration depth of light into idealized biological homogeneous skin for different selected wavelengths and different tissue illumination geometries. For this purpose, we used the expression obtained for the diffusion approximation in the random walk model [34,35]. This expression is a function of distance between a light source and a photodetector and of optical properties of the medium:
Z d , λ = 0.476 d 1 / 2 μ a λ μ s λ 1 / 4 ,
where Z d , λ is the light penetration depth, d is the source–detector distance, μ a λ is the absorption coefficient, and μ s λ is the reduced scattering coefficient of the medium. It should be noted that expression (2) is only suitable for the homogeneous semi-infinite medium.
Since skin consists of many components, it has a complex architecture and a large number of chromophores determining its optical properties. The exact calculation of the light penetration depth for such an organ is difficult. Therefore, simplified models are often used, for example, considering a single homogeneous layer of biological tissue. We used these models, in which the main light absorbers are a connective tissue, blood, and water, and the averaged skin absorption coefficient was written as follows [36,37]:
μ a , s k i n λ = V b μ a , b λ + V w μ a , w λ + 1 V b + V w μ a , o t h e r λ ,
where V b and V w are the volume fractions of blood and water in skin;   μ a , b λ and μ a , w λ are the absorption coefficients of blood and water, respectively; and μ a , o t h e r λ is the absorption coefficient of connective tissues in the absence of blood and water.
In Equation (3), μ a , o t h e r λ depends on a wavelength and can be expressed by the following equation [38,39]:
μ a , o t h e r λ = 7.84 · 10 8 · λ 3.255   [ cm 1 ] ,
whereas μ a , b λ is expressed as
μ a , b λ = S t O 2 μ a , HbO 2 λ + 1 S t O 2 μ a , Hb λ ,
where μ a , HbO 2 λ and μ a , Hb λ are the absorption coefficients of HbO2 and Hb, respectively, which together with μ a , w λ were adapted from [40,41]. It is known that the content of blood and water in different layers of skin varies. Thus, to calculate the absorption coefficient of skin according to Equation (3), we have to use the depth-averaged values of V b and V w . In particular, we used V b = 0.1 and V w = 0.5 according to [42]. An averaged value obtained as a combination of Mie and Rayleigh theories was used as the reduced scattering coefficient [43]. All the optical properties of skin, water and blood that were used are summarized in Table 1.
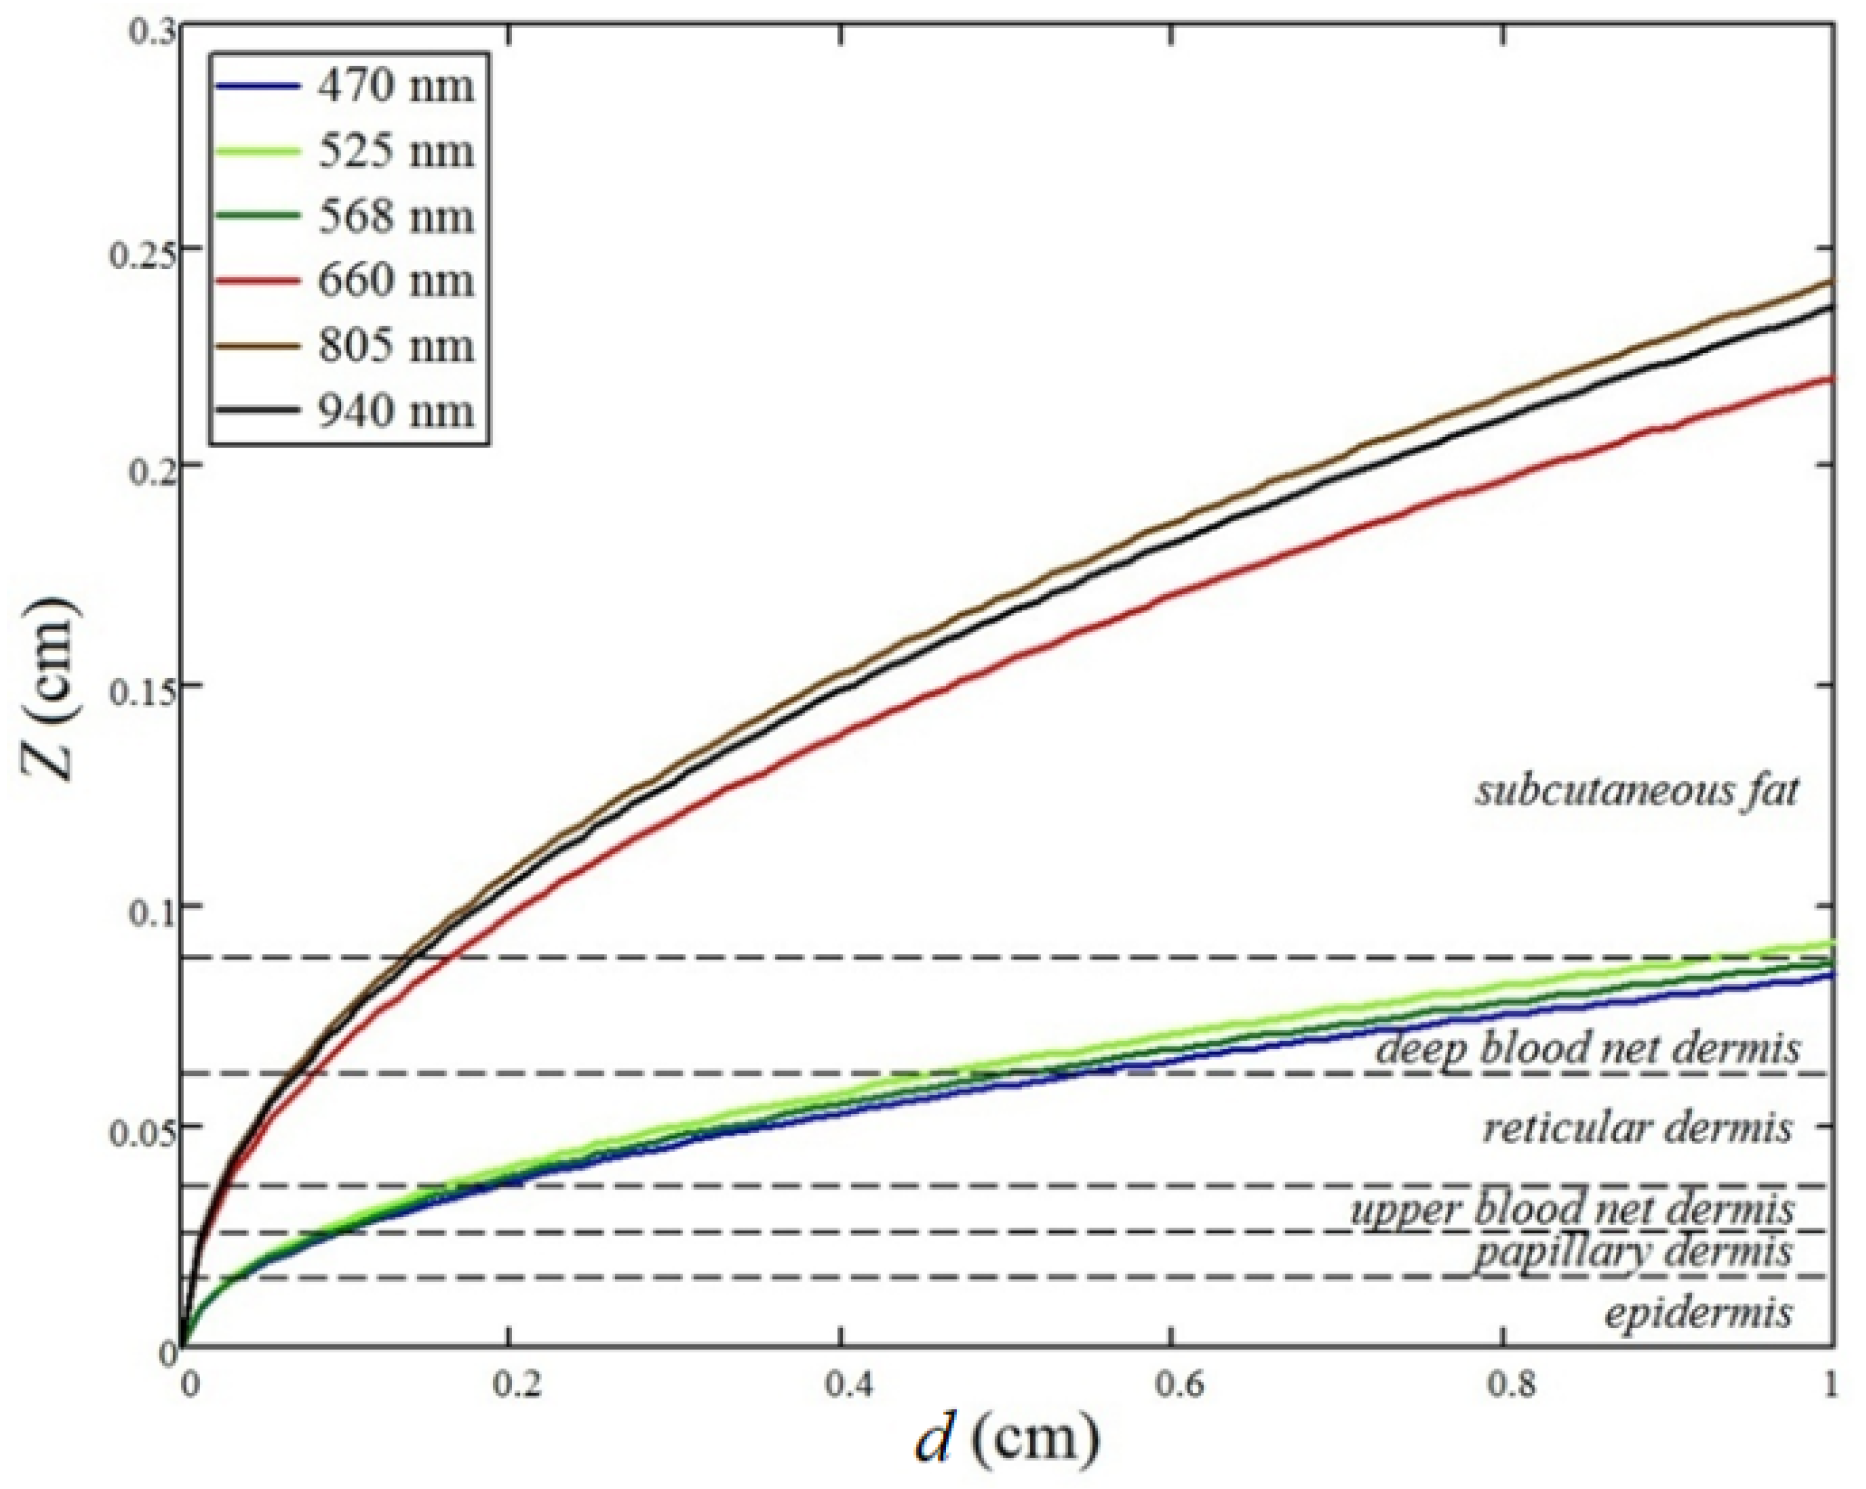
Dependences of Z d , λ on d computed by Equation (2) for all six wavelengths are shown in Figure 4.
As can be seen from the plotted dependences, the mean penetration depth Z d , λ was the smallest for wavelengths of 470, 525, and 568 nm and was about in two to three times greater for 660, 805, and 940 nm. At the same time, Z d , λ was approximately the same for 470, 525, and 568 nm and for 660, 805, and 940 nm. Thus, in order to implement both IOFF and oximetry techniques in one optical probe, the following pairs of wavelengths should be used for oximetry: 525 or 568 nm together with 470 nm for superficial measurements, as well as 805 nm together with 660 or 940 nm for deeper ones. For example, the blue and green wavebands can be used to measure the dermal BF and StO2.
Since the strongest Vb pulsations are observed in the deep blood net dermis [44], it is necessary that light reach this depth. To that end, we needed to make the distance d > 5 mm for wavelengths of 470, 525, and 568 nm. However, it is impossible to separate the source and the photodetector far from each other, since the green light is strongly absorbed by blood, so that at a large d the recorded signal becomes indistinguishable in noise [13]. Wavelengths of 660, 805, and 940 nm cover a larger diagnostic volume and, therefore, in addition to the dermal blood flow, include a blood flow in subcutaneous fat, as well.
In accordance with the above, when designing the peripheral tissue optical probes, the following components were used. The probe includes three L-934SRC-C LEDs (Kingbright, Shenzhen, China) with a peak emission wavelength of 660 nm, three IR-810-350C1 LEDs (Power Light Systems, Berlin, Germany) with a peak emission wavelength of 810 nm, and a TEFD4300 PIN photodiode (Vishay, Malvern, PA, USA).

3.3. Cerebral Optical Probe Design

The technology of cerebral oximetry requires not superficial but deep penetration of optical radiation into tissues. For this, the near-IR range of the spectrum corresponding to the transparency window is most applicable. If one of the isobestic points is used for oximetry, and if only one homogeneous layer of blood is considered, then, taking into account the coefficient of light absorption by blood in a simplified form of
μ a λ i = ε Hb λ i C Hb + ε HbO 2 λ i C HbO 2 ,
where ε Hb λ i and ε HbO 2 λ i are the molar extinction coefficients at the i-th wavelength, the functional saturation of oxyhemoglobin in blood can be determined by the expression:
S O 2 = M ε Hb λ 1 ε Hb λ 2 M ε Hb λ 1 ε HbO 2 λ 1 + ε HbO 2 λ 2 ε Hb λ 2 · 100 % ,
where M = μ a λ 2 / μ a λ 1 .
A convenient isobestic point in the near-IR waveband, for which an approximate equality ε i s λ 1 = ε Hb λ 1 = ε HbO 2 λ 1 is fulfilled, is a point with a wavelength of λ 1 = 800–810 nm. In this case, (7) is simplified:
S O 2 = r 1 M r 2 · 100 % ,
where r 1 = ε i s λ 1 / ε HbO 2 λ 2 ε Hb λ 2 , r 2 = ε Hb λ 2 / ε HbO 2 λ 2 ε Hb λ 2 .
Thus, to estimate S O 2 on the basis of (8), it suffices to determine experimentally the value of M, and the values of the molar extinction coefficients can be found in the literature (i.e., [45]).
In order to separately account for the absorption in brain tissues and evaluate the cerebral saturation of SctO2, in modern commercial cerebral oximeters operating in the continuous wave (cw) mode, as noted above, the multi-distance technique is often used [26,27]. Within its framework, several photodetectors at different distances from light sources (LEDs) are usually used. These distances should be chosen so that in the computational algorithm it will be possible to maximize the contribution of brain tissues to the detected signal.
To determine optimal source–detector separations (distances), we used an analytical model based on the modified Beer–Lambert law (MBL) and numerical modeling of light propagation in the head tissues using the Monte Carlo (MC) method. MBL is an extension of the classical Beer–Lambert law to scattering media. Using MBL in a framework of a backscattering problem, it is possible to describe the attenuation of the backscattered flux depending on the source–detector distance (SDD) in the exponential form:
I = I 0 e A λ , C i ,
where I 0 is the intensity of the light with a wavelength λ incident on the medium, I is the intensity of the light registered by a photodetector, and A λ , C i is the light attenuation (medium’s optical density, OD), depending on the light wavelength and concentrations of chromophores. According to MBL, A λ , C i can be represented as
A λ , C i = A a λ , C i + G ,
where G is the so-called geometric factor that is scattering dependent, and the attenuation A a represents total light absorption by all chromophores in the medium. The value of A a can be written as the sum of attenuations A a i in each of the chromophores or in each of tissues if a medium with different types of tissues is considered:
A a = i A a i = i μ a i P P L i ,
where μ a i and P P L i are the absorption coefficient of tissue of type i and the partial mean optical path length traversed by light in this particular tissue, which was registered by the photodetector. With regard to cerebral oximetry, we considered the following types of head tissues that make the main contribution to the formation of the cerebral oximeter’s signal: soft tissues (i = skin), skull bones (i= skull), cerebrospinal fluid (CSF) (i = CSF), and brain tissues, which in turn can be divided into gray matter (i= GM) and white matter (i = WM).
Let us denote the light fluxes incident on the medium from the near and far LEDs within the framework of the multi-distance scheme as I n , 0 and I f , 0 , respectively. The backscattered light incident on a photodetector while the corresponding LED is turned on can then be denoted as I n and I f . Then, based on Equations (9)–(11), the calculation of the quantity
Δ A = ln   I n I f , 0 I f I n , 0
with properly selected SDD allows one to isolate the contribution of brain tissues to the signal recorded and to get rid of the contribution of extracerebral tissues as much as possible.
Consider the quantity
Δ A a = i A a i f A a i n = i A a i f i A a i n ,
which describes the total over all tissue difference in the attenuation of light emitted from far and near LEDs and registered by the photodetector. The situation, when the contribution to the signal from the brain tissues is maximal with the minimal contribution of extracerebral tissues, corresponds to the minimum of Equation (13) with i = skin, skull, CSF, together with the minimum of Equation (13) with i = GM, WM. Denoting the attenuation in extracerebral and brain tissues as A a X and A a B , respectively, we can write this condition in the following form:
Δ A a X = A a X f A a X n m i n ; Δ A a B = A a B f A a B n m a x . ,
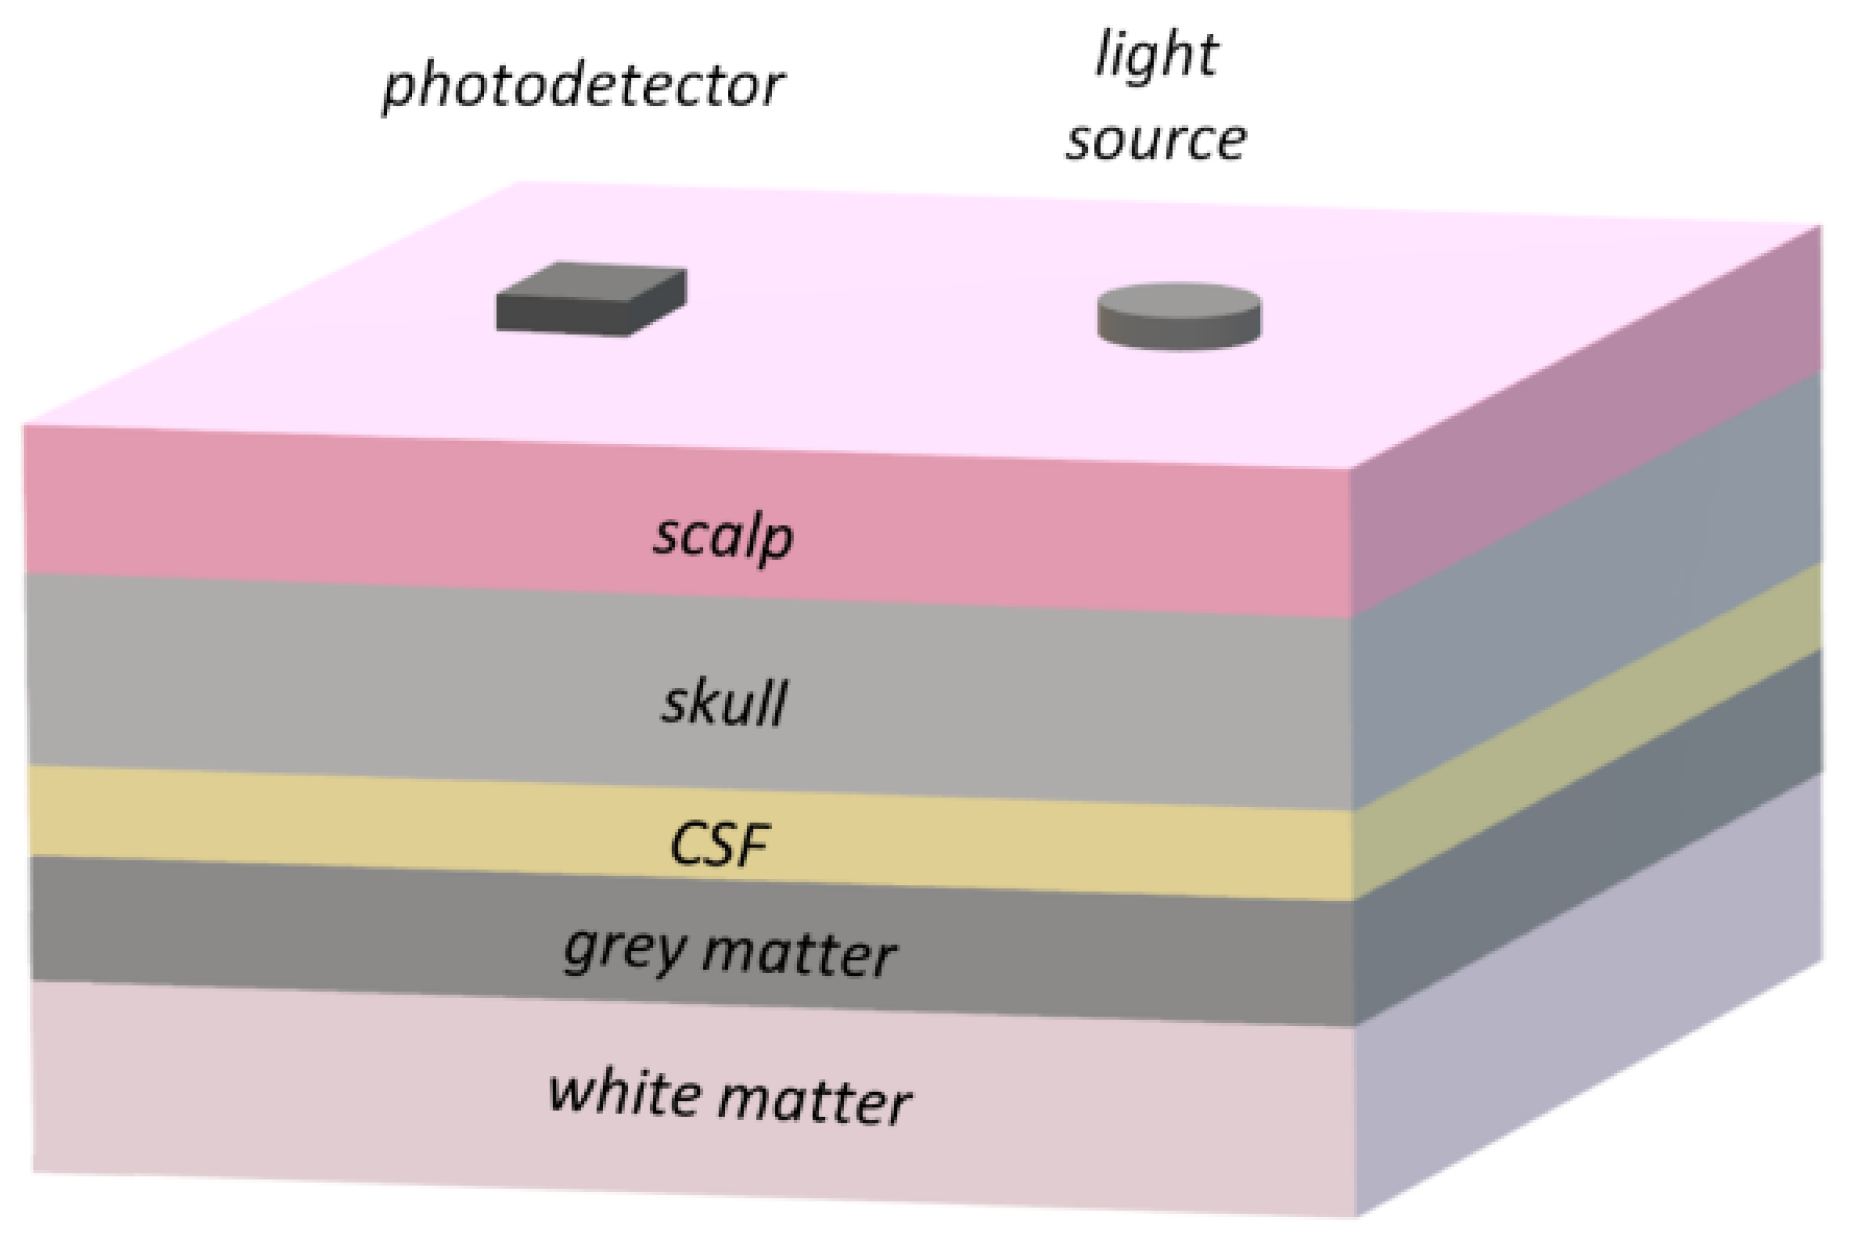
The values of Δ A a X and Δ A a B for various SDDswere estimated using MC simulation. For simplicity, a planar head model consisting of five layers corresponding to the above tissues was considered (Figure 5). Optical properties of tissues were taken from [46,47,48,49,50,51,52] and are collected in Table 2 for wavelengths of 800 nm and 940 nm (separated by commas). Optical parameters of the CSF layer were assumed to be the same for both wavelengths due to the lack of data in the literature. However, this assumption will not greatly affect the results because of the weak interaction of CSF with light compared with other tissues and, hence, the relatively small μ a and μ s . The mean cosines g and refractive indices n were also taken to be the same for both wavelengths since they do not differ much. The last column of Table 2 lists the layer thicknesses used in the simulation. The thicknesses of the first two layers, determined using the method of multislice computed tomography on a sample of 100 patients [53], correspond to areas located at the intersection points of two lines 3 cm long drawn normally to the upper edge of an eye-socket and the medium line, which are convenient for visual identification when installing cerebral sensors. Among other things, these areas are characterized by minimal thickness and the dispersion of soft tissues and bone. The thickness of the CSF layer in the corresponding area of the head was taken from [54]. The thickness of the gray matter layer was taken as 4 mm, as in [48]. However, as the numerical results show, the choice of this value is not as important, since light does not penetrate deep into this layer [55]. The white matter layer was assumed to be semi-infinite.
In modeling, the diameter of a round, flat light source was taken to be 5 mm, whereas the side of a square photodetector was taken to be 4 mm. The source (LED) radiates light uniformly over its surface flatwise. The photodetector registers photons coming from different directions with equal sensitivity.
The numerical model is based on the well-known principles of MC simulation of photon transport in biological tissues [56]. To speed up the computation and to improve its accuracy, disk geometry [57] was used. It is applicable to the medium that is azimuthally symmetric with respect to the light source. It allows one to significantly reduce the computation time. Backscattered fluxes were simulated for two wavelengths (800 nm and 940 nm) at different SDDs in the range of 0.5–5 cm with a step of 0.5 cm. For backscattered photons, the weighted partial mean optical paths P P L i for each i-th layer and the corresponding contribution to light attenuation A a i = μ a i P P L i were calculated. The number of launched photons was 8 × 10⁶.
Figure 6 shows on a logarithmic scale the relative backscattered fluxes (the ratio of total photon weights of registered and incident fluxes) as a function of the SDD for two wavelengths. It can be seen that the flux decay rate decreased with the SDD from a distance of approximately 1.5–2 cm. This result corresponds to one obtained earlier for the similar model [58]. It was mainly due to the presence in the model of a weakly absorbing and weakly scattering CSF layer, which began to be noticeable for photons penetrating deep enough. Despite the fact that the dependencies in Figure 6 cannot be described by a single exponent, such a description is possible for SDD greater than 2 cm. Therefore, models (9)–(14) can be applied.
To analyze Δ A a X and Δ A a B , it is convenient to build dependences of light attenuation in extracerebral tissues A a X and brain tissues A a B on the SDD. These dependencies, modeled for two wavelengths, are shown in Figure 7.
In general, the results for both wavelengths are similar. Meanwhile, with a change in SDD, different behavior of attenuations A a X and A a B were observed. The value of A a X began to grow rather sharply even at small SDDs. Then, from the SDD of approximately 2 cm, its growth rate slowed down, but from the SDD of 4–4.5 cm, it again began to show a tendency fora faster growth. At the same time, light attenuation in brain tissues was insignificant at small SDDs and demonstrated almost linear growth starting from SDDs of 1.5–2 cm. Such behavior of A a X and A a B correlates with the behavior of the backscattered flux (Figure 6). Photons registered at a distance of more than 2 cm from a light source penetrated deep enough and passed into the CSF layer and then into the brain. At the same time, the increment in absorption in extracerebral tissues slowed down, which reduced the fall of the backscattered flux with increasing SDD. As was shown in [58], the use of more realistic head models that take into account the geometry of the brain substances did not lead to substantially different results compared to the simple planar four-layer model.
It can be seen from Figure 7 that the use of the small SDD equal to 2 cm in the design of the cerebral optical probe made it possible, with the applicability of models (9)–(14), to practically not lose the useful signal from the brain. In this case, the value of Δ A a B will be larger, the larger the second SDD. In general, inside the distance interval of 2–4.5 cm, the A a X changes more slowly than A a B , which means that this range is suitable for use in the design of cerebral optical probes within the framework of models (9)–(14). For longer distances, absorption in extracerebral tissues grows faster than in brain tissues. As a result, the use of distances greater than 4.5 cm for a far source-detector pair is undesirable. Therefore, in our cerebral optical probes, we used SDDs of 2 and 4 cm.
It is known that at the SDDs used in our model, the optical path of photons in the white matter of the brain is much smaller than the path in the gray matter [48,58], which was also confirmed in our simulations. As a consequence, the light attenuation in the gray matter A a G M turned out to be much greater than A a W M , so we will neglect the latter for a simplicity. Putting for further simplification Δ A a X = 0 for the selected SDDs, and assuming that the difference in G for such distances is also equal to zero (within the framework of models (9)–(14)), we can assume μ a G M λ i ~ ln   I n λ i I f , 0 λ i I f λ i I n , 0 λ i . It leads to
M ~ ln I n λ 2 I f λ 2 I f , 0 λ 2 I n , 0 λ 2 ln I n λ 1 I f λ 1 I f , 0 λ 1 I n , 0 λ 1 ,
where λ 1 = 800 nm and λ 2 = 940 nm.
Of course, in practice, due to the idealization of the model, it may be useful to introduce additional calibration coefficients in Equations (8) and (15) in the form of multipliers.
In each cerebral optical probe, we used four powerful 1 W IR LEDs to reduce optical and electrical noise and to enhance optical signals on photodetectors. Namely, we used two BLD-HP001IR800-E42 and two BLD-HP001IR940-E42 (BEELED, Jiangmen, China) with peak emission wavelengths of 800 and 940 nm, respectively. The PIN BPW34 photodiodes (Vishay, Malvern, PA, USA) were used as photodetectors.

4. Base Metrological Equipment

4.1. Imitation Measure for the IOFF Technique

One of the most important and base pieces of metrological equipment for tuning measuring diagnostic channels are the so-called imitational measures (gauges) that imitate optical signals of real biological tissues [7]. The general approach to designing such measures for optical tissue oximetry is known [7,14,19,59]. There is no need to describe it in this article once more. We used this known approach for our peripheral tissue optical probes. The more difficult question is a measure for estimating BF, especially for the new IOFF technique. In particular, to ensure a uniform scale for BF measured according to Equation (1), it is necessary to adjust the coefficient B. Since the distribution of blood vessels in a cellular tissue and their optical properties are heterogeneous, there is still no phantom that exactly simulates BF in the microvascular bed of the tissue. For example, in LDF the most commonly used calibration tool today is the aqueous solution of polystyrene microspheres, also called the “motility standard” [60]. It allows the movement of erythrocytes and, therefore, a perfusion to be simulated due to the Brownian movement of particles in the solution. However, such measures are not stable over time due to the particles slowly settling, the solution gradually drying up, and the movement of particles stopping. For a long time, there has been a search for options for solid measures without liquid fillers [15].
To calibrate the proposed IOFF channels, a new simple and cheap measure compatible with the abovementioned measures for tissue oximetry was developed (Figure 8a). To simulate arterial blood flow unit, this measure, like the measures in [7,19], has a fluoroplastic F-4 base. F-4 is a fluorocarbon-based solid polymer polytetrafluoroethylene that is a chemically resistant and stable solid material with strong light-volume scattering and poor light-absorption properties. Its optical properties were measured by Russian State Research Institute of Optical and Physical measurements (the main metrological optical institute in the country) using the double beam grating-filter UV/VIS SPECORD M40 spectrophotometer (Carl Zeiss, Oberkochen, Germany) with integrating spheres and with the use of the standard integrating sphere techniques. Based on the measurement results, optical properties were reconstructed on the basis of the diffusion approximation, since volume scattering in fluoroplast F-4 in the entire spectral waveband of our interest is obviously greater than absorption. The obtained optical properties for the F-4 material 15 mm thick, which most closely fit the results of measurements, are presented in Table 3, where Rd is the diffuse reflectance factor.
The design of the developed measure and appearance of the measure prototype are presented in Figure 8.
Measure 1 consists of the F-4 base 2, the optical absorption filter film 3 that is placed on the base, and the polymer-dispersed liquid crystal (PDLC) film 4 located on the optical filter film. The transparency of the PDLC film is controlled by an ac voltage from the signal generator 5 to simulate the ac component of the registered signal. The frequency and amplitude of the control signal from the generator is selected corresponding to the frequency and amplitude of the simulated low-frequency oscillations of microhemodynamics in skin. The signal generator can be both analog and digital, i.e., implemented in the form of a digital-to-analog converter. The optical filter film 3 has a constant absorption coefficient that differs for different wavelengths imitating light absorption by arterial blood with a certain SaO2. By changing the transparency of the PDLC film in the frequency range of 0–10 Hz, the amplitude of the optical backscattered signal recorded from the surface of the measure is changed, as well, which imitates all spectral components that are necessary to calculate BF according to Equation (1). In addition, by choosing a different absorption filter film 3, one can also simulate different SaO2 and Vb.
The calibration procedure is as follows. A peripheral tissue optical probe consisting of LEDs 7 and a photodiode 8 is located on the measure. When the oximeter is turned on, light from LEDs passes through films 4 and 3 to the base 2, while backscattered light passes back through films 4 and 3 to the photodiode. The electrical periodic ac signal from the generator 5 is fed to the PDLC film. Using different frequency and different peak-to-peak amplitudes of the generator’s signal, it is possible to produce different BF levels according to Equation (1). By choosing B, these levels can be set uniformly for different optical probes and different examples of oximeters.
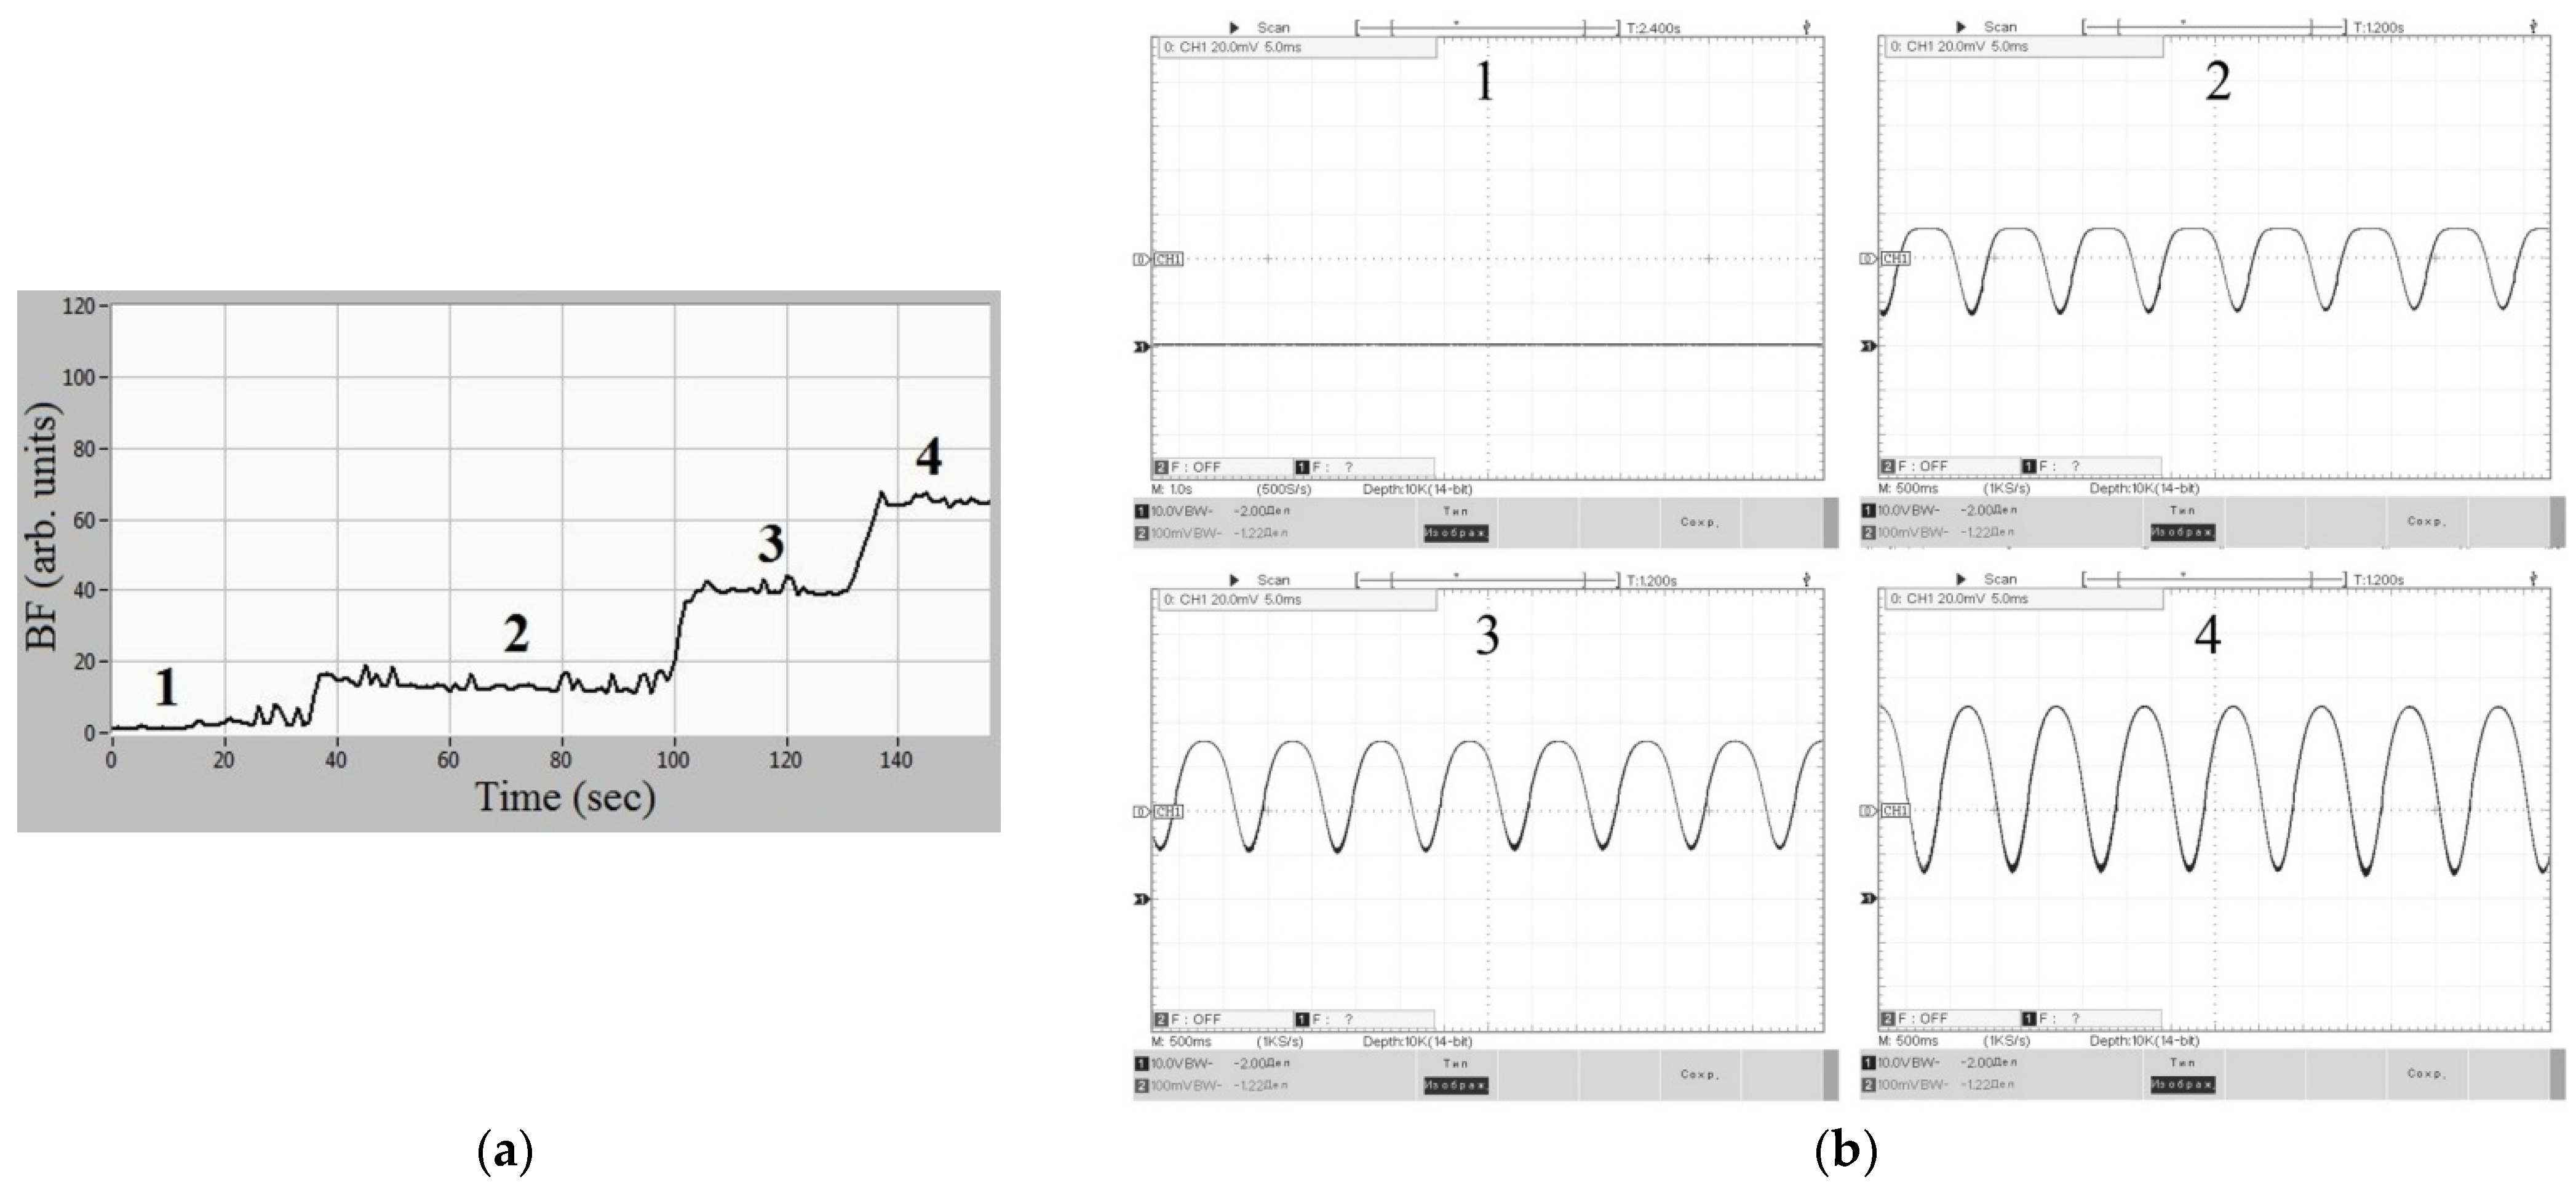
Examples of sinusoidal signals from the generator and corresponding BF levels are shown in Figure 9. The signal frequency was 1 Hz. Peak-to-peak amplitudes varied from 0 to 40 V to simulate different levels of BF. The red absorptive optical filter film with μa = 23.2 cm−1 at the wavelength of 810 nm used for BF estimation was applied. In Figure 9, sinusoidal signals are presented just as an example. To supply signals of a more complex shape, close to a pulse waveform, it was necessary to generate a complex modulated signal consisting of at least two harmonics. Figure 9a shows a record of BF over time, in which time segments 1…4 correspond to signals from the generator 1…4 in Figure 9b. As can be seen, BF increased proportionally with the increasing amplitude of the ac signal applied to the PDLC film. Thus, the PDLC film transparency control allowed us to simulate low-frequency oscillations in the blood microcirculation system and, consequently, the levels of BF according to Equation (1).
The reproducibility of the output of any medical diagnostic system is a crucial issue. To check for reproducibility to measure BF by our prototype, we determined the relative standard deviation (RSD) of BF values obtained repeatedly with the use of the measure mentioned above. The following procedure was performed to obtain a single BF value: (i) The optical probe was installed on the measure, (ii) the measurement of BF was carried out, (iii) the optical probe was uninstalled from the measure, and (iv) the device was turned off and then turned on. This sequence was repeated 10 times. The measurements were carried out at constant levels of BF, i.e., for the constant optical properties of the measure. RSD was determined to be approximately 5–6%. For example, for mean BF = 42 perf. units, the standard deviation was 2 perf. units. Such an error is caused by methodic and random instrumental errors [59]. In the experiment described, the methodic error was only the arbitrary positioning of a probe on the measure. The instrumental errors were mainly related to time instabilities of such parameters as a spectral sensitivity of the photodiode, a power density of LEDs, an ac voltage of the signal generator, and an optical density response of the PDLC film. The obtained error for BF exceeded the values of 2–3% observed in [59]. This was probably due to the use of a more complex—in fact, active—measure for the IOFF technique unlike the time-stationary fluorescence measures in [59].
In addition, a crucial issue is the sensitivity threshold. SNR in the optical probes determines the smallest BF value that can be detected by the probe. The proposed measure allowed us to evaluate it. When the ac electrical signal applied to the PDLC film is equal to zero (time interval 1 in Figure 9b) the flowmetry channel should indicate BF = 0. However, the real registered BF value usually differs from zero due to noise. We estimated this value on the level of BF = 0.6 arb.un. Thus, it should be considered the sensitivity threshold for this channel. It has to be noted that in publications on optical flowmetry, on LDF, for example, such a threshold is usually not indicated. The dynamic range for LDF meters usually is indicated as 0–100 arb.un., which is not correct. As we can see, the proposed measure opens the way to examine the threshold.

4.2. Imitation Measure for the Cerebral Optical Probe

The tuning of cerebral optical probes and their pre-diagnostic calibration can be carried out by means of the LEDs’ current control. To do this and to verify a computational algorithm for the estimation of StO2 for cerebral tissues (SctO2), the second imitational measure was created (Figure 10a). Its main part is also the fluoroplast base, which can be covered by absorption optical filters. In order to simulate different optical properties of a biological object (of a human head, for example) and/or its certain physiological processes accompanied by variation in the optical densities of tissues, a number of optical filters with different optical densities in different wavebands can be used.
To simulate changes in SctO2, one can vary one (or several) of four optical signals— I n λ 1 , I f λ 1 , I n λ 2 , and I f λ 2 —for example, by partially blocking the light flux from one of the LEDs by optical filters. In particular, one of the scenarios may correspond to a situation when the blood volume level remains unchanged both in extracerebral and brain tissues, whereas in the brain tissues, the ratio of oxy- and deoxyhemoglobin changes, which leads to a change in SctO2. Such a process will respond to constant signals I n λ 1 , I f λ 1 , and I n λ 2 while changing I f λ 2 . Fixing three variables allows the variation range of the fourth variable with a known variation range of M (or SctO2) to be found. Figure 10a shows a setup of this simple experiment. The cerebral optical probe and the optical power sensor (a head of a conventional radiation power meter) were placed on a surface of the measure to test the probe. The optical power sensor was used to determine the ratio I f , 0 λ i I n , 0 λ i for each wavelength. Figure 10b shows the results of a real-time measurement of SctO2 by one of the cerebral optical probes by changing the degree of overlap of the far LED with λ 2 = 940 nm. The whole dynamic range of SctO2 from the sensitivity threshold up to 100% was covered.
For the case of cerebral channels, a reproducibility test was also performed according to the procedure described in Section 4.1. The RSD for SctO2 obtained using a corresponding imitation measure was up to 2–3%. This result is in accordance with the results obtained in [59] and indicates good reproducibility of theSctO2 measurements. For example, for the mean SctO2 = 64%, the standard deviation was 1.5%.
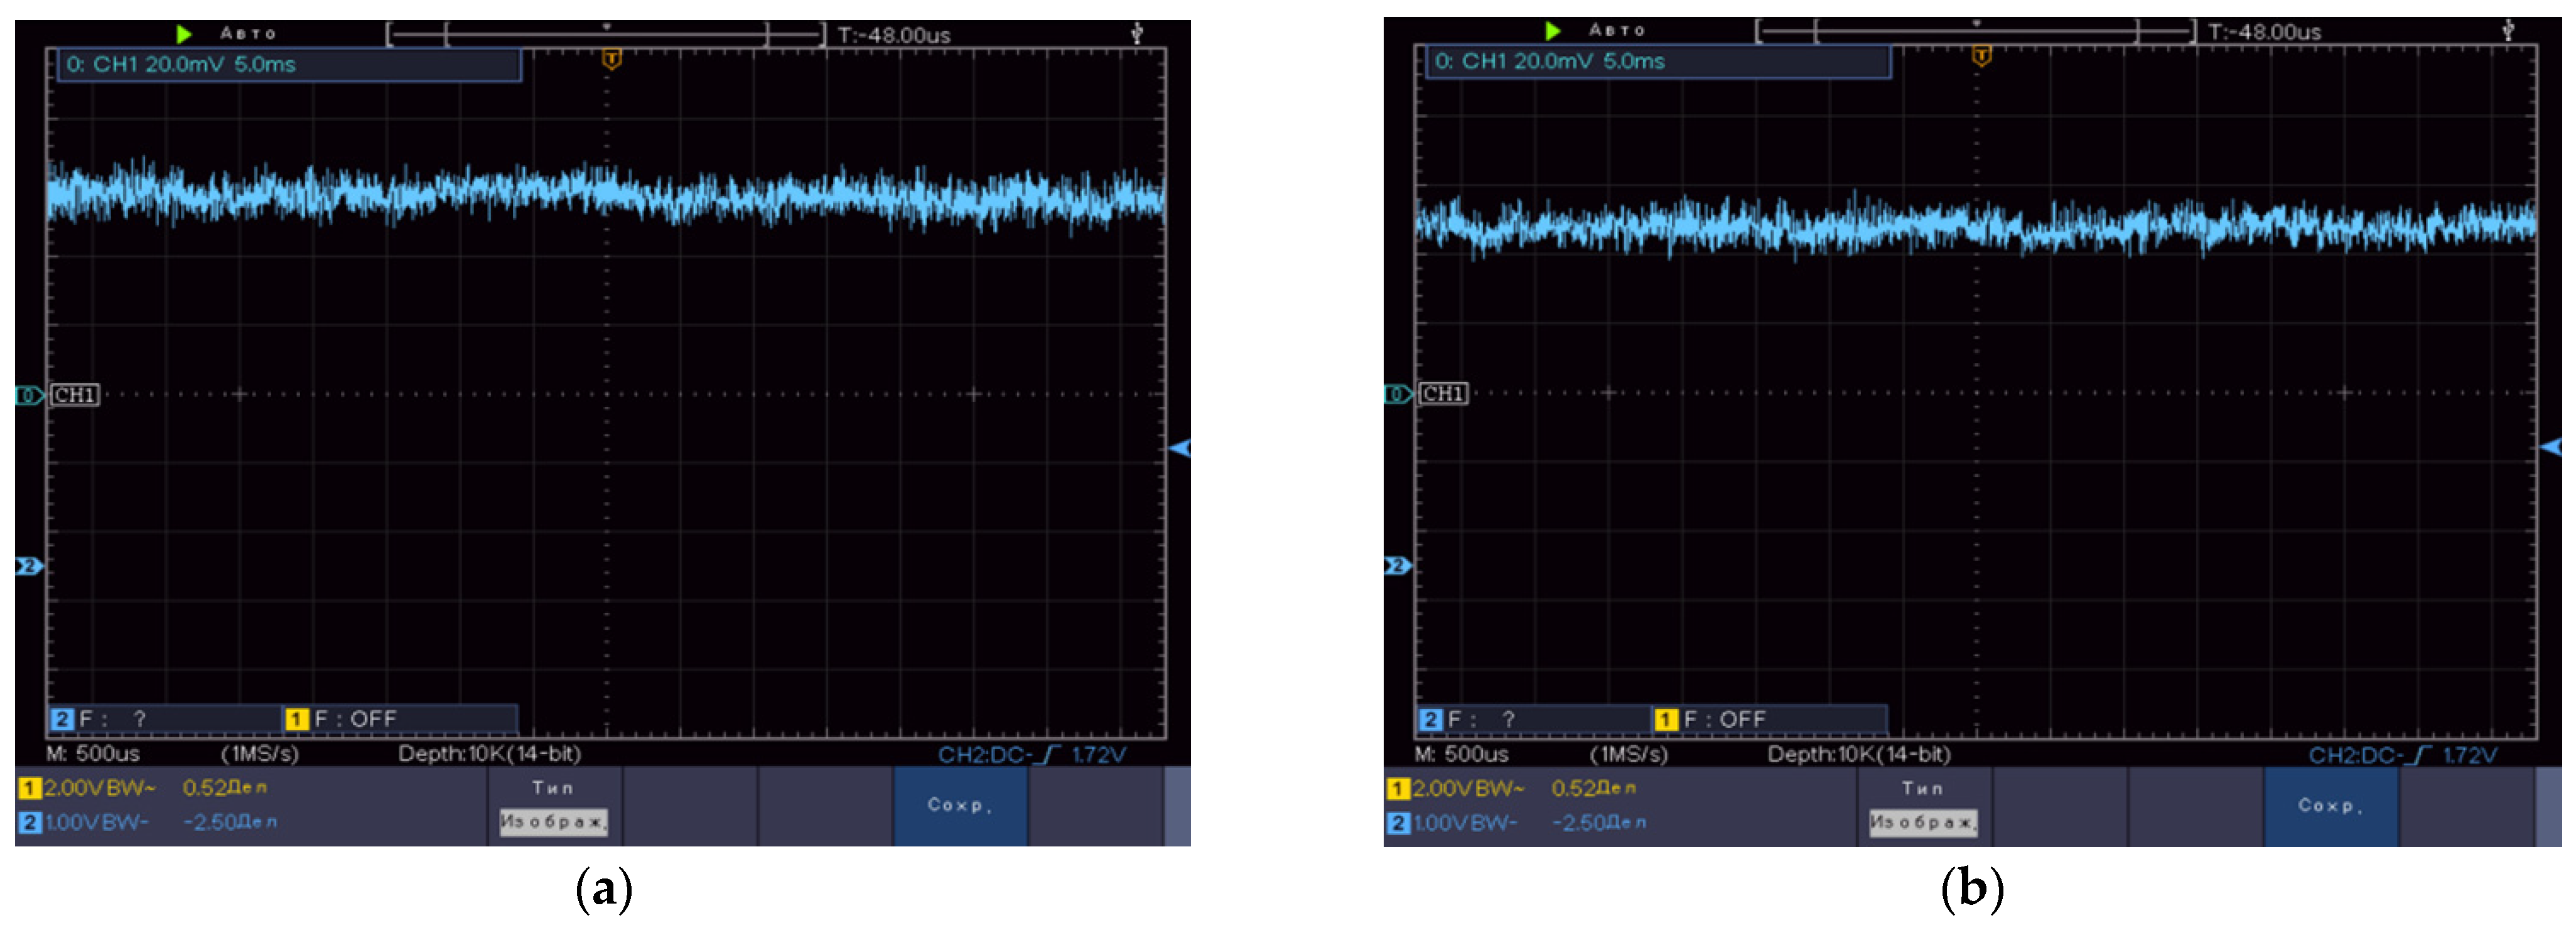
The SNR was roughly estimated with the use of a conventional oscilloscope. Figure 11 gives examples of signals when the near 940 nm LED (Figure 11a) and the far 940 nm LED (Figure 11b) are turned on. Due to the powerful LEDs used, the ~0.4 V electrical noise was detected on the level of the signal of ~5.5 V for the nearest LED, and of ~5 V for the far LED. Thus, in the presented case, SNR was about 14 for the first LED and 12 for the second one. Similar values were obtained in the case of 800 nm LEDs. SNR can also vary for different SctO2. Using SNR, the sensitivity threshold of the SctO2 measurements can be assessed. In general, with the use of Equation (15), we estimated that the lowest traceable change in SctO2 is 3–4% for our optical probe.

5. Discussion and Conclusions

In this study, a complex engineering approach for the development of a new instrument for non-invasive optical oximetry with an enhanced number of measured parameters and together with the basic metrological equipment is proposed. It is shown how the main technical design parameters of the instrument can be determined and substantiated using theoretical modeling of light transport in tissues. By combining two related optical diagnostic techniques—a tissue oximetry and a fluctuation flowmetry—on a single hardware and software platform, a more informative instrument prototype is developed. The advantages of both of these optical diagnostic techniques, apart from their noninvasive character and clinical diagnostic efficiency, lies also in the fact that it is possible to develop the base metrological maintenance for them. We tried to use this advantage and developed imitation measures for different diagnostic channels and techniques used in our multifunctional oximeter. Of course, somebody can criticize our measures, for instance, because they do not fully correspond to real layers of real skin or tissues of a head. Nevertheless, firstly, they are simple, and secondly, they fully fulfill their metrological mission. Unlike commonly used phantoms for bioimaging systems, which must exactly match the anatomy and morphology of the observed tissues, metrological material measures store and reproduce the units of measured values. Therefore, the exact correspondence to the tissues is not as important for them as the exact reproduction of magnitudes of measured optical signals. In addition, indeed, in the article we only demonstrate the principle. It is always possible to refine and to improve our approach and ideas in the future.
The use of numerical simulation at stages of development and the design of optical probes is another advantage of our study, in our opinion. It allowed us to trace the influence of different types of tissues on optical signals registered, and, therefore, to develop the geometry of optical probes registering the maximum useful signal from tissues under investigation, such as brain tissue, for example. However, during the literature data search, it was not possible to find research or cycles of research in which comprehensive studies of optical properties of all necessary head tissues were carried out. Instead, many papers explored these tissues separately, and what is more, different papers explored different optical properties of the same tissues. At the same time, different authors used different research methods and different equipment. In addition, various experiments were carried out under different conditions. All this undoubtedly is reflected in the results on the optical properties of tissues, which may vary significantly from study to study. When collecting data for our simulations, we compared similar data from different sources and tried to choose them so that a consistent set of optical properties for all tissue layers was obtained. Nevertheless, research devoted to extensive studies under the same conditions of the largest number of optical properties of a large set of head tissues would be very useful for developers of medical devices using optical principles for the diagnostic assessment of head organs. Of course, it is clear that such studies are very time consuming, complex, and expensive, but still, they are necessary.
The engineering study carried out and described in the article was a theoretical study. It allowed us to substantiate optical probe parameters and the instrument design, and to manufacture the prototype and measures. Further experimental research should include testing the idea in clinical trials. We deliberately do not present results of such tests in this article, because it should be a separate study with its own goals, design, and results. The results of such tests are planned to be given in another, separate article. In addition, future experimental phases should involve a set of identical prototypes of the oximeter to make sure that its design is reproducible, that they can all be tuned in the same way using developed measures, and also to evaluate the spread of results on these measures, inaccuracies, and errors of all prototypes in the set. For measuring diagnostic systems, especially medical ones, metrological characteristics are the most important. Existing commercial oximeters of a similar class do not have the proper metrological maintenance yet. The proposed approach opens the way to start the development of it.
In summary, the main result of the study is the demonstrated possibility of the integrated approach to the development of methods and instruments for oximetry. We tried to create a more informative and reasonable device through a combination of technologies and development of the equipment for its subsequent metrological certification. Along this path, solutions were proposed for a number of emerging problems, in particular, the combination of oximetry and flowmetry in one optical probe, the justification of the probe design and LED operation cyclograms, the creation of solid-state measures available for both techniques, etc. In our opinion, such a complex approach can be applied and effective in the development of other equipment for optical noninvasive medical diagnostics.

Author Contributions

For this article, the following individual contributions were made. Conceptualization of the article and of the research and development as a whole was done mainly by D.R. He also wrote the main parts of introduction and conclusions. Development of the peripheral tissue optical probes and the IOFF method, as well as writing the relevant sections of the article, was done by D.L. The main body of the device, cerebral optical probes, and necessary theoretical investigations were carried out by A.T. He also wrote the relevant sections of the article. All authors have read and agreed to the published version of the manuscript.

Funding

This research received no external funding.

Institutional Review Board Statement

Not applicable.

Informed Consent Statement

Not applicable.

Data Availability Statement

Not applicable.

Acknowledgments

The development and production of the main body of the oximeter (hardware) and its software was carried out by Optical Medical Diagnostic Systems LLC and was supported by the Start program of the Foundation for Assistance to Small Innovative Enterprises (FASIE), application C1-56654, agreement with fund No. 3202C1/48653 dated 2 September 2019.

Conflicts of Interest

The authors declare no conflict of interest.

References

  1. Nitzan, M.; Romem, A.; Koppel, R. Pulse oximetry: Fundamentals and technology update. Med. Devices 2014, 7, 231–239. [Google Scholar] [CrossRef]
  2. Allen, J. Photoplethysmography and its application in clinical physiological measurement. Physiol. Meas. 2007, 28, R1–R39. [Google Scholar] [CrossRef] [PubMed] [Green Version]
  3. Lange, F.; Tachtsidis, I. Clinical brain monitoring with time domain NIRS: A review and future perspectives. Appl. Sci. 2019, 9, 1612. [Google Scholar] [CrossRef] [Green Version]
  4. Fredriksson, I.; Fors, C.; Johansson, J. Laser Doppler Flowmetry—A Theoretical Framework. Department of Biomedical Engineering, Linköping University. 2007. Available online: https://www.researchgate.net/publication/238678169 (accessed on 18 March 2022).
  5. Drexler, W.; Liu, M.; Kumar, A.; Kamali, T.; Unterhuber, A.; Leitgeb, R.A. Optical coherence tomography today: Speed, contrast, and multimodality. J. Biomed. Opt. 2014, 19, 071412. [Google Scholar] [CrossRef] [PubMed]
  6. Yu, G. Diffuse correlation spectroscopy (DCS): A diagnostic tool for assessing tissue blood flow in vascular-related diseases and therapies. Curr. Med. Imaging 2012, 8, 194–210. [Google Scholar] [CrossRef]
  7. Rogatkin, D.A.; Dunaev, A.V.; Lapaeva, L.G. Metrological providing for methods and devices of non-invasive medical spectrophotometry. Biomed. Eng. 2010, 44, 66–77. [Google Scholar] [CrossRef]
  8. ISO 80601-2-61:2017. Medical Electrical Equipment—Part 2-61: Particular Requirements for the Basic Safety and Essential Performance of Pulse Oximeter Equipment. 2017. Available online: https://www.iso.org/standard/67963.html (accessed on 18 March 2022).
  9. Rogatkin, D. Biophotonic devices and technologies in problems of medical diagnostics. Quantum Electron. 2021, 51, 365. [Google Scholar] [CrossRef]
  10. Binzoni, T.; Martelli, F. Study on the mathematical relationship existing between single-photon laser-Doppler flowmetry and diffuse correlation spectroscopy with static background. J. Opt. Soc. Am. A 2017, 34, 2096–2101. [Google Scholar] [CrossRef]
  11. Fredriksson, I.; Larsson, M. On the equivalence and differences between laser Doppler flowmetry and laser speckle contrast analysis. J. Biomed. Opt. 2016, 21, 126018. [Google Scholar] [CrossRef]
  12. ISO 80601-2-85:2021. Medical Electrical Equipment—Part 2-85: Particular Requirements for the Basic Safety and Essential Performance of Cerebral Tissue Oximeter Equipment. 2021. Available online: https://www.iso.org/standard/72442.html (accessed on 18 March 2022).
  13. Dunaev, A.V.; Zherebtsov, E.A.; Rogatkin, D.A.; Stewart, N.A.; Sokolovski, E.U. Substantiation of medical and technical requirements for noninvasive spectrophotometric diagnostic devices. J. Biomed. Opt. 2013, 18, 107009. [Google Scholar] [CrossRef]
  14. Afshari, A.; Ghassemi, P.; Lin, J.; Halprin, M.; Wang, J.; Mendoza, G.; Weininger, S.; Pfefer, T.J. Cerebral oximetry performance testing with a 3D-printed vascular array phantom. Biomed. Opt. Exp. 2019, 10, 3731–3746. [Google Scholar] [CrossRef]
  15. Dunaev, A.V.; Stewart, N.A.; Sokolovski, S.G.; Rafailov, E.U.; Zherebtsov, E.A.; Rogatkin, D.A. Novel measure for the calibration of laser Doppler flowmetry devices. Proc. SPIE 2014, 8936, 89360D. [Google Scholar] [CrossRef] [Green Version]
  16. Hyttel-Sorensen, S.; Kleiser, S.; Wolf, M.; Greisen, G. Calibration of a prototype NIRS oximeter against two commercial devices on a blood-lipid phantom. Biomed. Opt. Exp. 2013, 4, 1662–1672. [Google Scholar] [CrossRef] [PubMed] [Green Version]
  17. Rogatkin, D.A.; Lapaeva, L.G. Prospects for development of noninvasive spectrophotometric medical diagnosis. Biomed. Eng. 2003, 37, 217–222. [Google Scholar] [CrossRef]
  18. Rogatkin, D.A.; Sokolovski, S.G.; Fedorova, K.A.; Stewart, N.A.; Sidorov, V.V.; Rafailov, E.U. Basic principles of design and functioning of multifunctional laser diagnostic system for non-invasive medical spectrophotometry. Proc. SPIE 2011, 7890, 78901H. [Google Scholar] [CrossRef] [Green Version]
  19. Rogatkin, D.A.; Lapaeva, L.G.; Petritskaya, E.N.; Sidorov, V.V.; Shumskiy, V.I. Multifunctional laser noninvasive spectroscopic system for medical diagnostics and some metrological provisions for that. Proc. SPIE 2009, 7368, 73681Y. [Google Scholar] [CrossRef]
  20. Ferreira, M. The role of metrology in the field of medical devices. Int. J. Metrol. Qual. Eng. 2011, 2, 135–140. [Google Scholar] [CrossRef] [Green Version]
  21. Hyttel-Sorensen, S.; Hessel, T.W.; Cour, A.; Greisen, G. A comparison between two NIRS oximeters (INVOS, OxyPrem) using measurement on the arm of adults and head of infants after caesarean section. Biomed. Opt. Exp. 2014, 5, 3671–3683. [Google Scholar] [CrossRef] [Green Version]
  22. Kleiser, S.; Ostojic, D.; Andresen, B.; Nasseri, N.; Isler, H.; Scholkmann, F.; Karen, T.; Greisen, G.; Wolf, M. Comparison of tissue oximeters on a liquid phantom with adjustable optical properties: An extension. Biomed. Opt. Exp. 2018, 9, 86–101. [Google Scholar] [CrossRef] [Green Version]
  23. Seong, M.; Phillips, Z.; Mai, P.M.; Yeo, C.; Song, C.; Lee, K.; Kim, J.G. Simultaneous blood flow and blood oxygenation measurements using a combination of diffuse speckle contrast analysis and near-infrared spectroscopy. J. Biomed. Opt. 2016, 21, 027001. [Google Scholar] [CrossRef]
  24. Moor Instruments. Innovation in Microvascular Assessment. Available online: https://www.moor.co.uk/products (accessed on 28 February 2022).
  25. Lapitan, D.; Rogatkin, D. Optical incoherent technique for noninvasive assessment of blood flow in tissues: Theoretical model and experimental study. J. Biophotonics 2021, 14, e202000459. [Google Scholar] [CrossRef]
  26. Davie, S.N.; Grocott, H.P. Impact of extracranial contamination on regional cerebral oxygen saturation: A comparison of three cerebral oximetry technologies. Anesthesiology 2012, 116, 834–840. [Google Scholar] [CrossRef] [Green Version]
  27. Steppan, J.; Hogue, C.W., Jr. Cerebral and tissue oximetry. Best Pract. Res. Clin. Anaesthesiol. 2014, 28, 429–439. [Google Scholar] [CrossRef] [Green Version]
  28. Lapitan, D.G.; Tarasov, A.P.; Parnovskaya, A.D. Theoretical justification of sensor parameters for cerebral oximeter based on CT data and Monte Carlo modeling of light transport. In Proceedings of the 2021 Radiation and Scattering of Electromagnetic Waves (RSEMW) International Conference, Divnomorskoe, Russia, 28 June–2 July 2021; pp. 357–360. [Google Scholar] [CrossRef]
  29. Tarasov, A.P.; Lapitan, D.G.; Parnovskaya, A.D. Sensor for Optical Cerebral Oximeter. R.F. Patent RU 2770266 C2, 16 July 2020. [Google Scholar]
  30. Budidha, K.; Rybynok, V.; Kyriacou, P.A. Design and development of a modular multichannel photoplethysmography system. IEEE Trans. Instrum. Meas. 2018, 67, 1954–1965. [Google Scholar] [CrossRef] [Green Version]
  31. Lapitan, D.G.; Raznitsyn, O.A. A method and a device prototype for noninvasive measurements of blood perfusion in a tissue. Instrum. Exp. Tech. 2018, 61, 745–750. [Google Scholar] [CrossRef]
  32. Lapitan, D.G.; Tarasov, A.P. Analytical assessment of the modulation depth of photoplethysmographic signal based on the modified Beer-Lambert law. In Proceedings of the 2019 IEEE 8th International Conference on Advanced Optoelectronics and Lasers (CAOL), Sozopol, Bulgaria, 6–8 September 2019; pp. 103–106. [Google Scholar] [CrossRef]
  33. Del Bianco, S.; Martelli, F.; Zaccanti, G. Penetration depth of light re-emitted by a diffusive medium: Theoretical and experimental investigation. Phys. Med. Biol. 2002, 47, 4131–4144. [Google Scholar] [CrossRef]
  34. Weiss, G.H.; Nossal, R.; Bonner, R.F. Statistics of penetration depth of photons re-emitted from irradiated tissue. J. Mod. Opt. 1989, 36, 349–359. [Google Scholar] [CrossRef]
  35. Akl, T.J.; Wilson, M.A.; Ericson, M.N.; Coté, G.L. Intestinal perfusion monitoring using photoplethysmography. J. Biomed. Opt. 2013, 18, 087005. [Google Scholar] [CrossRef] [Green Version]
  36. Meglinski, I.V.; Matcher, S.J. Computer simulation of the skin reflectance spectra. Comput. Methods Programs Biomed. 2003, 70, 179–186. [Google Scholar] [CrossRef] [Green Version]
  37. Chatterjee, S.; Budidha, K.; Kyriacou, P.A. Investigating the origin of photoplethysmography using a multiwavelength Monte Carlo model. Physiol. Meas. 2020, 41, 084001. [Google Scholar] [CrossRef]
  38. Saidi, I.S. Transcutaneous Optical Measurement of Hyperbilirubinemia in Neonates. Ph.D. Thesis, Rice University, Houston, TX, USA, 1992. [Google Scholar]
  39. Jacques, S.L. Origins of tissue optical properties in the UVA, visible, and NIR regions. OSA TOPS Adv. Opt. Imaging Phot. Migr. 1996, 2, 364–369. [Google Scholar]
  40. Bosschaart, N.; Edelman, G.J.; Aalders, M.C.; van Leeuwen, T.G.; Faber, D.J. A literature review and novel theoretical approach on the optical properties of whole blood. Lasers Med. Sci. 2014, 29, 453–479. [Google Scholar] [CrossRef] [PubMed] [Green Version]
  41. Hale, G.M.; Querry, M.R. Optical constants of water in the 200-nm to 200-m wavelength region. Appl. Opt. 1973, 2, 555. [Google Scholar] [CrossRef]
  42. Meglinski, I.V.; Matcher, S.J. Quantitative assessment of skin layers absorption and skin reflectance spectra simulation in the visible and near-infrared spectral regions. Physiol. Meas. 2002, 23, 741–753. [Google Scholar] [CrossRef]
  43. Jacques, S.L. Optical properties of biological tissues: A review. Phys. Med. Biol. 2013, 58, R37–R61. [Google Scholar] [CrossRef]
  44. Reuss, J.L.; Siker, D. The pulse in reflectance pulse oximetry: Modeling and experimental studies. J. Clin. Monit. Comput. 2004, 18, 289–299. [Google Scholar] [CrossRef]
  45. Prahl, S. Optical Absorption of Hemoglobin. 1999. Available online: https://omlc.org/spectra/hemoglobin (accessed on 18 March 2022).
  46. Biswas, T.K.; Luu, T.M. In vivo MR measurement of refractive index, relative water content and T2 relaxation time of various brain lesions with clinical application to discriminate brain lesions. Internet J. Radiol. 2011, 13, 1–9. [Google Scholar]
  47. Yaroslavsky, A.N.; Schulze, P.C.; Yaroslavsky, I.V.; Schober, R.; Ulrich, F.; Schwarzmaier, H.J. Optical properties of selected native and coagulated human brain tissues in vitro in the visible and near infrared spectral range. Phys. Med. Biol. 2002, 47, 2059. [Google Scholar] [CrossRef]
  48. Okada, E.; Delpy, D.T. Near-infrared light propagation in an adult head model. II. Effect of superficial tissue thickness on the sensitivity of the near-infrared spectroscopy signal. Appl. Opt. 2003, 42, 2915–2921. [Google Scholar] [CrossRef] [Green Version]
  49. Ding, H.; Lu, J.Q.; Wooden, W.A.; Kragel, P.J.; Hu, X.H. Refractive indices of human skin tissues at eight wavelengths and estimated dispersion relations between 300 and 1600 nm. Phys. Med. Biol. 2006, 51, 1479. [Google Scholar] [CrossRef] [Green Version]
  50. Bashkatov, A.N.; Genina, E.A.; Tuchin, V.V. Optical properties of skin, subcutaneous, and muscle tissues: A review. J. Innov. Opt. Health Sci. 2011, 4, 9–38. [Google Scholar] [CrossRef]
  51. Stritzel, J.; Rahlves, M.; Roth, B. Refractive-index measurement and inverse correction using optical coherence tomography. Opt. Lett. 2015, 40, 5558–5561. [Google Scholar] [CrossRef]
  52. Genina, E.A.; Bashkatov, A.N.; Tuchin, V.V. Optical clearing of cranial bone. Adv. Opt. Technol. 2008, 2008, 267867. [Google Scholar] [CrossRef] [Green Version]
  53. Tarasov, A.P.; Vishnyakova, M.V., Jr.; Ivlieva, A.L.; Davydov, D.V.; Podrez, D.V.; Rogatkin, D.A.; Vishnyakova, M.V. A technique of multidetector computed tomography for optical cerebral oximetry. Alm. Clin. Med. 2015, 43, 52–57. (In Russian) [Google Scholar]
  54. Haeussinger, F.B.; Heinzel, S.; Hahn, T.; Schecklmann, M.; Ehlis, A.C.; Fallgatter, A.J. Simulation of near-infrared light absorption considering individual head and prefrontal cortex anatomy: Implications for optical neuroimaging. PLoS ONE 2011, 6, e26377. [Google Scholar] [CrossRef]
  55. Li, T.; Gong, H.; Luo, Q. Visualization of light propagation in visible Chinese human head for functional near-infrared spectroscopy. J. Biomed. Opt. 2011, 16, 045001. [Google Scholar] [CrossRef]
  56. Wang, L.; Jacques, S.L.; Zheng, L. MCML—Monte Carlo modeling of light transport in multi-layered tissues. Comput. Meth. Programs Biomed. 1995, 47, 131. [Google Scholar] [CrossRef]
  57. Tarasov, A.P. Acceleration of Monte Carlo simulation of light transport in tissues using disk-detector geometry in the backscattering problem. In Proceedings of the 2020 International Conference Laser Optics (ICLO), Saint Petersburg, Russia, 2–6 November 2020; p. 1. [Google Scholar] [CrossRef]
  58. Okada, E.; Firbank, M.; Schweiger, M.; Arridge, S.R.; Cope, M.; Delpy, D.T. Theoretical and experimental investigation of near-infrared light propagation in a model of the adult head. Appl. Opt. 1997, 36, 21–31. [Google Scholar] [CrossRef]
  59. Rogatkin, D.A.; Lapaeva, L.G.; Bychenkov, O.A.; Tereshchenko, S.G.; Shumskii, V.I. Principal sources of errors in noninvasive medical spectrophotometry. Part 1. Physicotechnical sources and factors of errors. Meas. Tech. 2013, 56, 201–210. [Google Scholar] [CrossRef]
  60. Fredriksson, I.; Larsson, M.; Salomonsson, F.; Stromberg, T. Improved calibration procedure for laser Doppler perfusion monitors. Proc. SPIE 2011, 7906, 790602. [Google Scholar] [CrossRef] [Green Version]
Figure 1. Two possible modes of an LED timing diagram for a device with conventional cerebral optical probes with two photodiodes: L1,L2—peripheral tissue probe LEDs are switched ON; L3,L4—cerebral tissues probe LEDs are switched ON; 1–6—collection of signals from photodiodes: 1,2—peripheral tissue probes, 3–6—cerebral tissue probes.
Photonics 09 00392 g001
Figure 2. Two possible modes of an LED timing diagram for a device with new cerebral optical probes with one photodiode: L1,L2—peripheral tissue probe LEDs are switched ON; L3–L6—cerebral tissues probe LEDs are switched ON. 1–6—collection of signals from photodiodes: 1,2—peripheral tissue probes, 3,4—cerebral tissue probes.
Photonics 09 00392 g002
Figure 3. (a) Top-level architecture of the multifunctional oximeter; (b) the photograph of the multifunctional oximeter prototype.
Photonics 09 00392 g003
Figure 4. Dependence of the mean penetration depth Z on the source–detector distance d for different wavelengths. Z was calculated for the single-layer medium model. The dotted lines show the depth of real skin layers for better visualization and understanding.
Photonics 09 00392 g004
Figure 5. Planar model of a human head used in MC simulations with a schematically placed photodetector and a light source.
Photonics 09 00392 g005
Figure 6. Relative backscattered flux vs. SDD calculated by MC simulation in the planar layer model for the wavelengths of 800 nm (red) and 940 nm (black).
Photonics 09 00392 g006
Figure 7. Optical attenuation A a i vs. SDD computed by MC simulation in the planar layer model for the extracerebral tissue layers (circles) and brain tissue layers (squares) and for wavelengths of 800 nm (red) and 940 nm (black).
Photonics 09 00392 g007
Figure 8. (a) The design of the developed measure of arterial blood flow with a peripheral tissue optical probe placed on it: 1—measure, 2—F-4 base, 3—optical absorption filter film, 4—PDLC film, 5—ac electrical signal generator, 6—peripheral tissue optical probe, 7—LEDs, 8—photodiode; (b) photographs of the measure prototype with (left) and without (right) peripheral tissue optical probe placed on it.
Photonics 09 00392 g008
Figure 9. (a) An example of BF recorded by an optical probe; (b) time intervals 1–4 correspond to periodic electrical signals of different amplitudes supplied from the generator.
Photonics 09 00392 g009
Figure 10. (a) The measure for cerebral optical probes as well as a setup of the experiment. (b) Results of real-time measurement of SctO2 performed when shifting an optical filter.
Photonics 09 00392 g010
Figure 11. Levels of the signals registered by optical probes on the measure when the (a) near 940 nm LED or the (b) far 940 nm LED are turned on.
Photonics 09 00392 g011
Table 1. The optical properties of skin, water, and blood used at theoretical modeling.
ChromophoreOptical ParameterWavelength, nm
470525568660805940
Blood μ a , b , cm−1
(StO2 = 75%, Hct = 45%)
148.6162.1229.45.234.085.95
Water μ a , w , cm−10.0002470.000320.000790.00320.2670.36
Skin μ a , cm−1
( V b = 0.1 ,   V w = 0.5)
15.4916.6523.280.730.650.84
μ s , cm−154.843.637.729.823.219.8
Table 2. Optical properties of the tissues of a human head at 800 nm and 940 nm (separated by comma) and thicknesses of tissue layers in the planar model of a human head (last column) [46,47,48,49,50,51,52,53,54].
Tissue Type μ a ( cm 1 ) μ s   ( cm 1 ) g n Thickness (cm)
Scalp0.43, 0.3196, 1780.91.380.44
Skull0.15, 0.22160, 1500.91.520.63
CSF0.04240.91.330.3
Grey matter0.25, 0.3580, 650.91.400.4
White matter0.9, 1350, 3300.91.41
Table 3. Optical properties of the fluoroplastic F-4 measure base.
Optical ParameterWavelength, nm
660810940
μ a , cm−10.0400.0220.015
μ s , cm−128012070
g0.810.910.94
Rd,%928883
Publisher’s Note: MDPI stays neutral with regard to jurisdictional claims in published maps and institutional affiliations.