Article

Theoretical Study on the Ultrafast Selective Excitation of Surface-Enhanced Coherent Anti-Stokes Raman Scattering Based on Fano Resonance of Disk-Ring Nanostructures by Shaped Femtosecond Laser Pulses

1
State Key Laboratory of Precision Spectroscopy, School of Physics and Electronic Science, East China Normal University, Shanghai 200062, China
2
School of Information Science and Engineering, University of Jinan, Jinan 250022, China
3
Collaborative Innovation Center of Extreme Optics, Shanxi University, Taiyuan 030006, China
*
Author to whom correspondence should be addressed.
Photonics 2022, 9(5), 338; https://doi.org/10.3390/photonics9050338
Submission received: 28 March 2022 / Revised: 1 May 2022 / Accepted: 10 May 2022 / Published: 12 May 2022
(This article belongs to the Special Issue Ultrafast Spectroscopy: Fundamentals and Applications)

Abstract

:
The enhancement and selective excitation of coherent anti-Stokes Raman scattering (CARS) and the suppression of background noise are very important problems for real-time detection at the single-molecule level. Optimizing the plasmonic substrate to ensure that all the hot spots of the pump, probe, Stokes, and anti-Stokes light are at the same position is the key to increasing the CARS signal to reach the level of single-molecule detection. The selective excitation of the target CARS peak and the suppression of the other peaks are the key to improving the signal-to-noise ratio. In this paper, we present a theoretical study to control the selective excitation and enhancement of any one of the three CARS peaks using the Fano resonance of a disk-ring structure. By optimizing the modulation of the pump, Stokes, and probe pulse, one CARS peak is maximized, while the other two are suppressed to zero. Fano resonance is applied to simultaneously enhance the four surface plasmon modes of the pump, probe, Stokes, and anti-Stokes light and to ensure that all the hot spots are located at the same position by adjusting the size of the disk-ring structure. The hot spots of the four pulses are concentrated in the disk-ring gap with a deviation distance of less than 2 nm, and the intensity of the CARS is enhanced by 1.43 × 10¹² times, which is much higher than the requirement of single-molecule detection. The time, frequency, and phase distribution of the input and the response of the four pulses are studied in detail. It was found that the selective excitation and the spectra of CARS are both well preserved.

1. Introduction

Nanoscale imaging addresses the challenge of detecting weak resonant signals from a few target molecules in the presence of background noise from many undesired molecules [1]. In addition, imaging must be performed rapidly to capture the dynamic processes. Various approaches have been developed to increase the selectivity and sensitivity of molecular detection. The coherent anti-Stokes Raman scattering (CARS) and surface-enhanced Raman scattering spectroscopies enhance Raman signals by several orders of magnitude [1,2].
CARS is a nonlinear four-wave mixing process [1,2,3]. It can reflect the composition and structural characteristics of target molecules and has the advantages of a strong signal, high sensitivity, high spectral resolution, and small fluorescence interference [4,5,6,7]. Therefore, it has been widely used in many fields, such as coherent controlled chemical reactions, micro- and nano-imaging, and spectral thermometry [8,9,10].
Femtosecond pulse shaping for CARS (FPS-CARS) was developed to suppress the non-resonant background noise and optimize the efficiency of the coherent optical signals [11,12,13,14,15,16,17,18,19,20]. It has been widely used in controlling the molecular vibration state, rotation state, ionization state, isomerization, and other molecular dynamics. By tailoring the phase of the femtosecond probe pulse, Dan Oron et al. showed a narrow-band CARS resonance signal with a width of less than 15 cm−1, despite the broad femtosecond pulse spectrum [18]. Compared to shaping only the probe pulse, the selectivity of femtosecond CARS could be greatly improved by shaping both the pump and the probe pulses with a π-phase step [19].
Background suppression can be achieved by femtosecond pulse shaping. However, this often decreases the overall signal intensity [1,16,19]. Furthermore, surface-enhanced FPS-CARS was developed to enhance the signal-to-noise ratio, which is determined by the signal enhancement and the background noise suppression [1,21,22]. Surface-enhanced FPS-CARS has been demonstrated to be useful for the precision sensing of minor molecular species within a scattering environment and the detection and identification of anthrax-type bacterial endospores in real time [1,23,24,25].
Nanostructured substrates have been optimized to improve the surface-enhanced CARS (SECARS) efficiency, which can improve the near-field enhancement in the hot spots of the plasmonic nanostructures, as well as the spatial overlap of the hot spot distributions of the pump, Stokes, and probe light fields [1,2,26,27,28,29]. Fano resonances were used to improve the SECARS signals on plasmonic quadrumers [1,2,26]. The spatial near-field distributions of the pump, Stokes, and probe laser showed hot spots in the same location in the trimer. By studying the Raman enhancement of self-organized monolayers of p-MA molecules attached to the supporting Fano resonance structure, it was found that the Raman signal could be greatly enhanced when the excitation wavelength, the Stokes mode wavelength of interest, and the Fano resonance peak of the structure recombined [28]. However, several Raman peaks were usually excited and enhanced simultaneously, which increased the background noise and decreased the sensitivity and accuracy.
There is little research on pulse shaping and Fano resonance enhancement simultaneously. In this paper, we first present a scheme for controlling the selective excitation and the enhancement of any one of the three CARS peaks based on the Fano resonance of a disk-ring structure by shaping femtosecond laser pulses. A four-level system with three Raman shifts of 580, 700, and 780 cm−1 was chosen as the target molecule. By optimizing the phase modulation and frequency cutting of the pump, Stokes, and probe pulse, any one of the CARS peaks can be maximized, while the other two peaks are suppressed to zero.
We designed a disk-ring nanostructure with Fano resonance. The pump and the probe light are both located in the Fano dip (dark state) to enhance the local field intensity and optical absorption, and the Stokes and anti-Stokes lights are located at the two side peaks (bright state) to increase the local field intensity and optical emission. The electric field distribution of the disk-ring nanostructure was calculated. Although the wavelengths of the pump, probe, Stokes, and anti-Stokes pulses are different, the hot spots are all perfectly coincident and concentrated in the disk-ring gap. Therefore, the disk-ring structure is a perfect substrate for SECARS.
Using the finite-difference time-domain (FDTD) method, the ultrafast evolution and enhancement of the shaped pump, probe, Stokes, and anti-Stokes pulses at the probe point on the center of the disk-ring gap are studied numerically. The hot spots of the four pulses are concentrated in the disk-ring gap, and the SECARS intensity is enhanced by a factor of 1.43 × 10¹². It also shows that the disk-ring structure is a simple and tunable dimer without additional requirements. The time, frequency, and phase distribution of the input and the response of the four pulses are studied in detail. It was found that all of these parameters keep well, and the selective excitation of SECARS and even the spectra are all well maintained.

2. Ultrafast Coherent Control and Selective Excitation of CARS

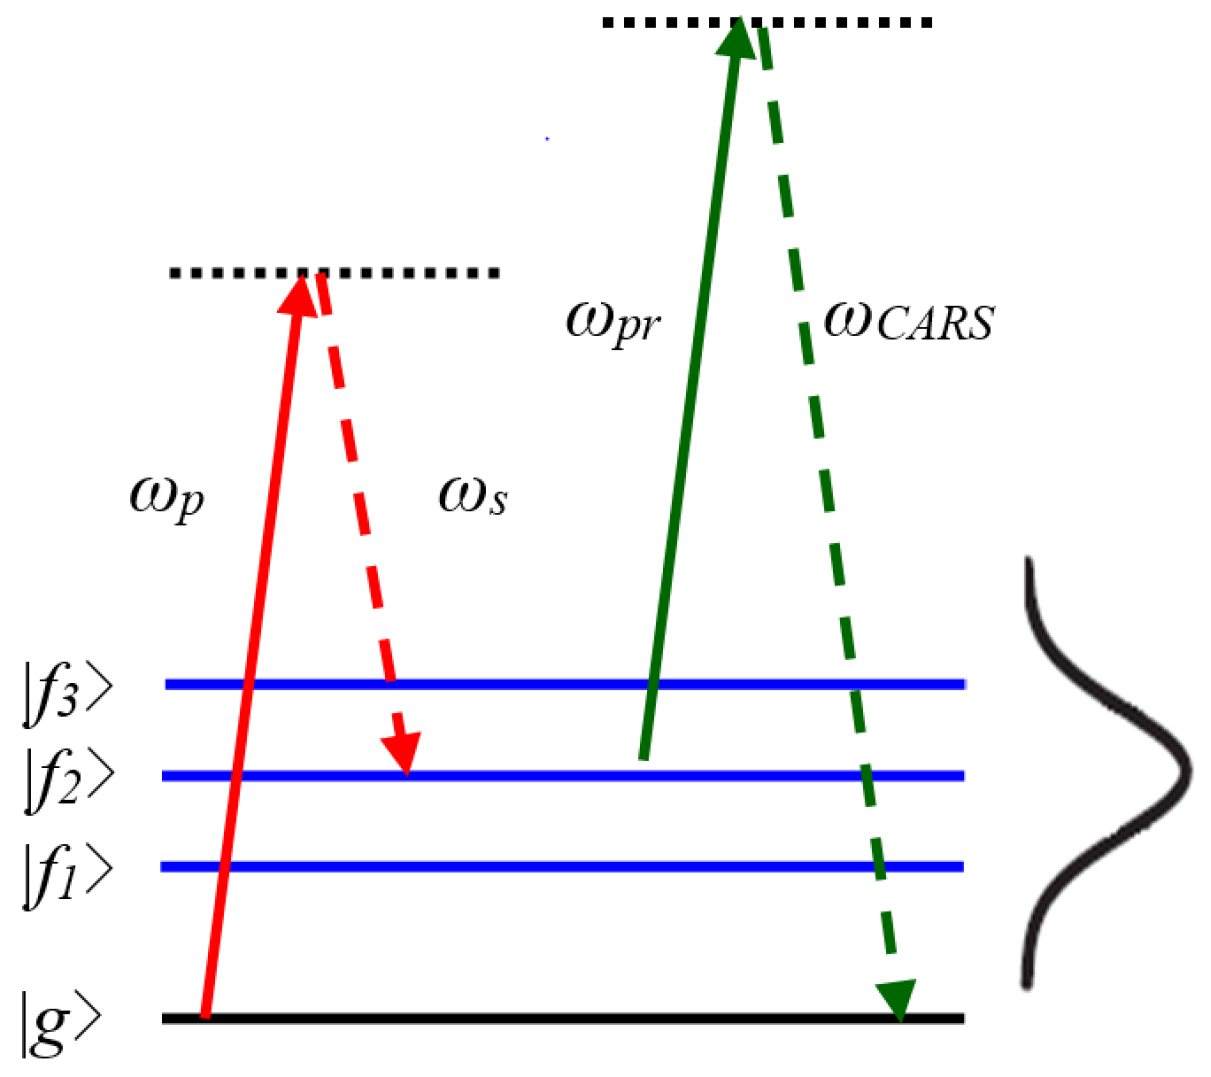
2.1. Theory of the Coherent Control of CARS

CARS is induced by the interaction of the pump laser field Ep(t), the Stokes laser field Es(t), and the probe laser field Epr(t) on the target molecules. It can be approximated by third-order time-dependent perturbation theory [1,2,3,11,12,15,16,18,19,22,24,25,27]. The four-level quantum system includes the intermediate states |fi> (i = 1, 2, 3) and the ground state |g>, as shown in Figure 1. CARS consists of two processes. The first process is the resonant-stimulated Raman transition. The electron in the ground state |g> is first excited to a virtual state by absorbing a photon of the pump light ωp. Then, the electron transitions to its final state |fi> by emitting a photon stimulated by the Stokes light ωs. These transitions are depicted by the red solid and dotted lines in Figure 1 [30,31]. The second process is the generation of the CARS signal. As shown by the green solid and dotted lines in Figure 1, the electron in the final state |fi> gets excited to a virtual state by absorbing a photon of the probe light ωpr. Then, it returns to the ground state |g> by emitting an anti-Stokes ωas photon, where ωas = ωp + ωprωs [30,31]. When ωpωs is exactly equal to the molecular vibration level, a strong CARS signal will be generated, which can provide information on the molecular vibration mode [11,32,33].
The transition probability of the CARS signal is described in Equation (1). This is the result of the coherent superposition of the resonant and non-resonant contributions [4,11,24,25,32,33].
P ( 3 ) ( ω a s ) 2 = P r ( 3 ) ( ω a s ) + P n r ( 3 ) ( ω a s ) 2
The non-resonant contribution Pnr(3) is attributed to the instantaneous electronic responses, and the resonant contribution Pr(3) reflects the energy level information of the quantum system. They can be written as [11,12,18,19,32,33],
P r 3 ω a s 0 + E p r ω a s Ω Ω R Ω + i Γ d Ω 0 + E p ω p E s * ω p Ω d ω p P n r 3 ω a s 0 + E p r ω a s Ω d Ω 0 + E p ω p E s * ω p Ω d ω p
where E(ω) is the Fourier transform of E(t), ΩR is the Raman resonant frequency, and Γ is the bandwidth of the Raman level. The spectral bandwidths of the pump field Ep, the Stokes field Es, and the probe field Epr are all wide enough to cover the three final states simultaneously.
Several CARS peaks are usually excited simultaneously by a femtosecond laser. The neighboring CARS peaks are strong noise and greatly disturb the target peak [34,35,36]. To realize the selective excitation of CARS peaks for the energy levels with narrow differences, when considering a practical and general case, the three energy levels are set to 580, 700, and 780 cm−1, with a width of 10 cm−1 [34,35,36].
The central frequencies of the probe and pump lasers are both at 12,987 cm−1 and that of the Stokes light is at 12,287 cm−1. The full width at half maximum (FWHM) of the three laser pulses is set as 1040 cm−1 to cover the three final states simultaneously, which are much larger than the maximum difference of 200 cm−1 among the three energy levels. The frequency difference between the pump and the Stokes light is nearly equal to the average value of the three energy levels. The three CARS modes are all efficiently excited [37,38].

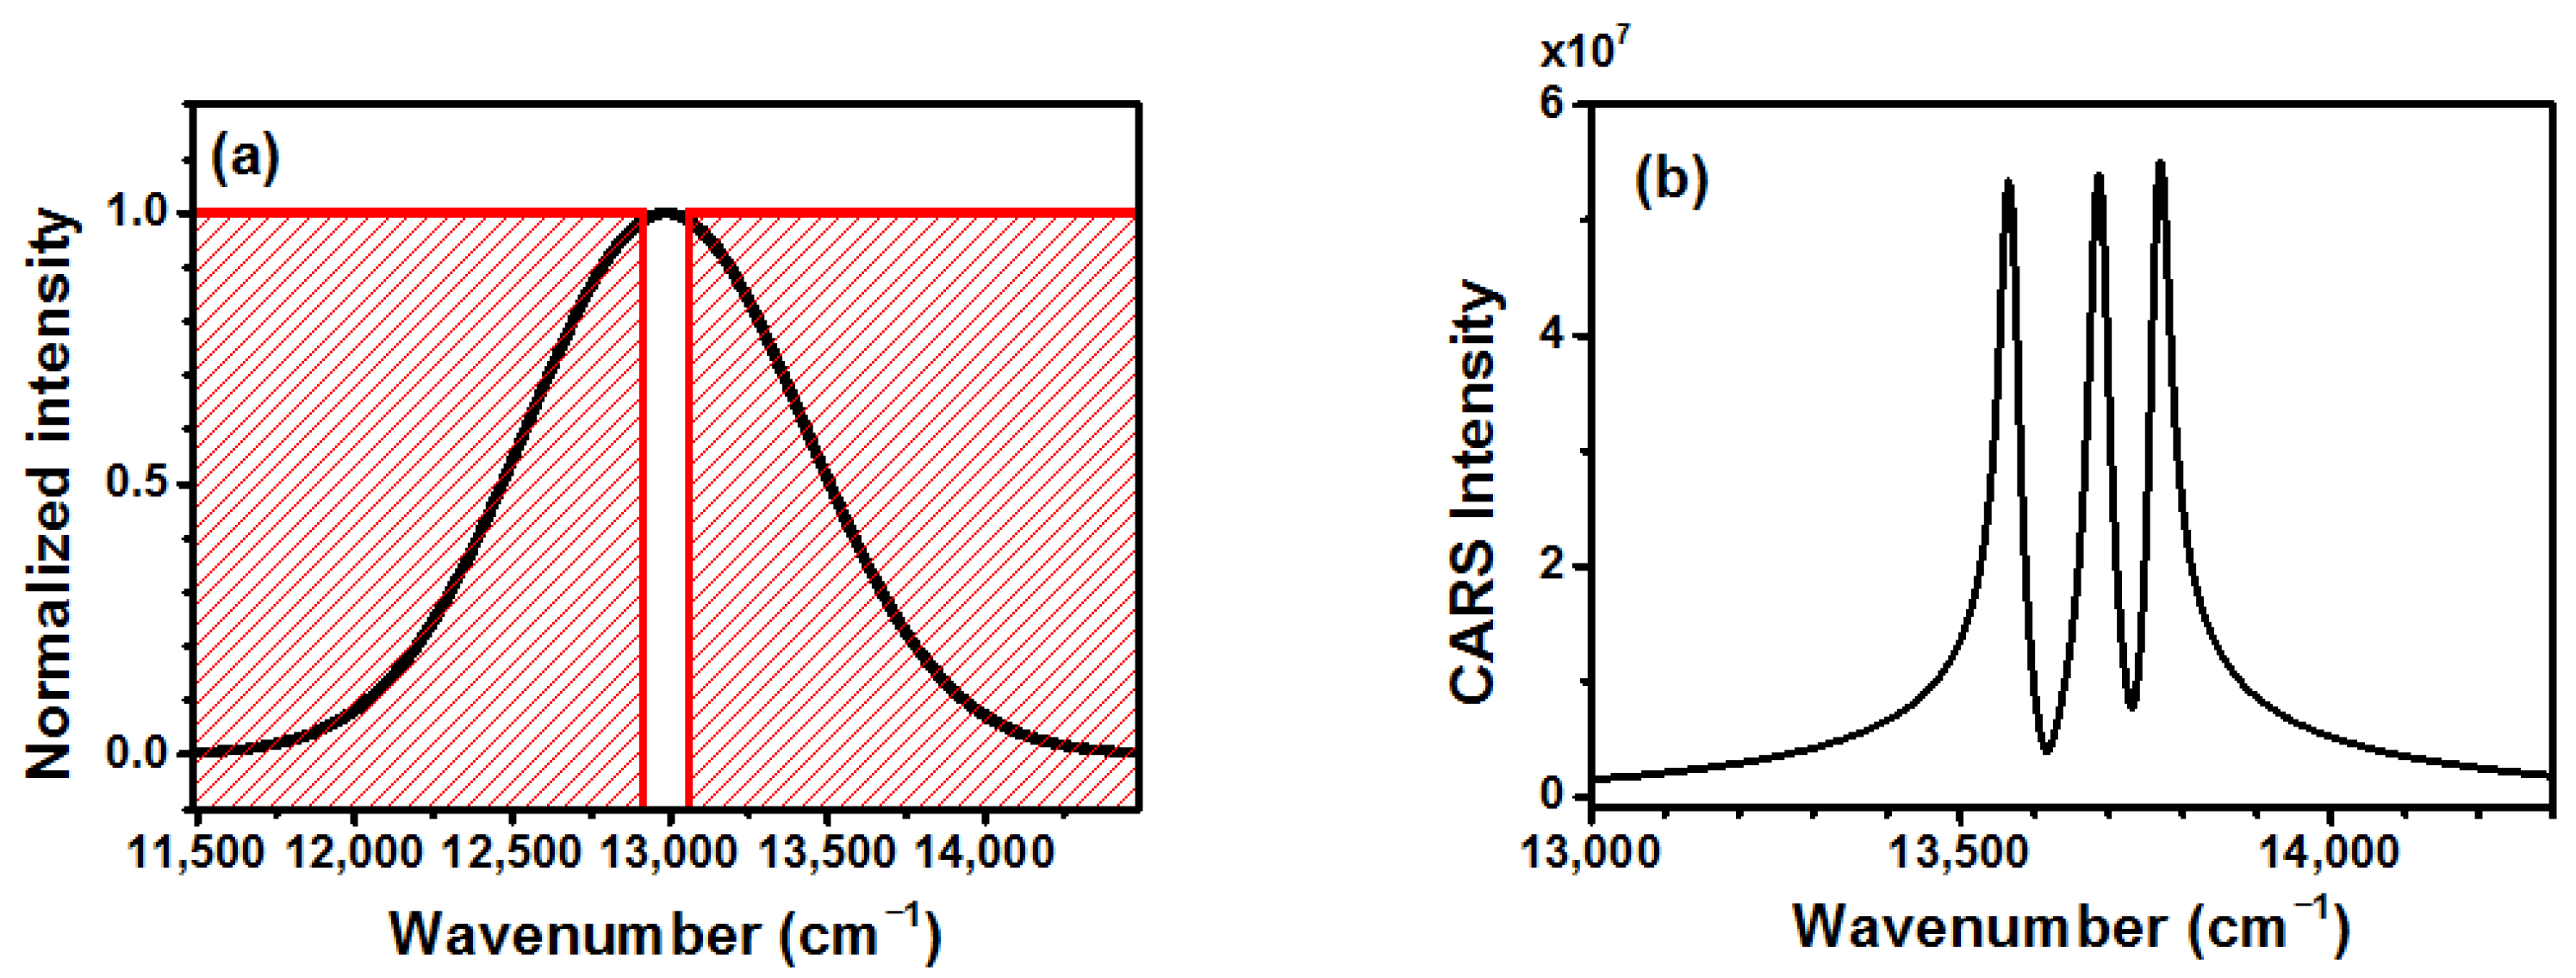
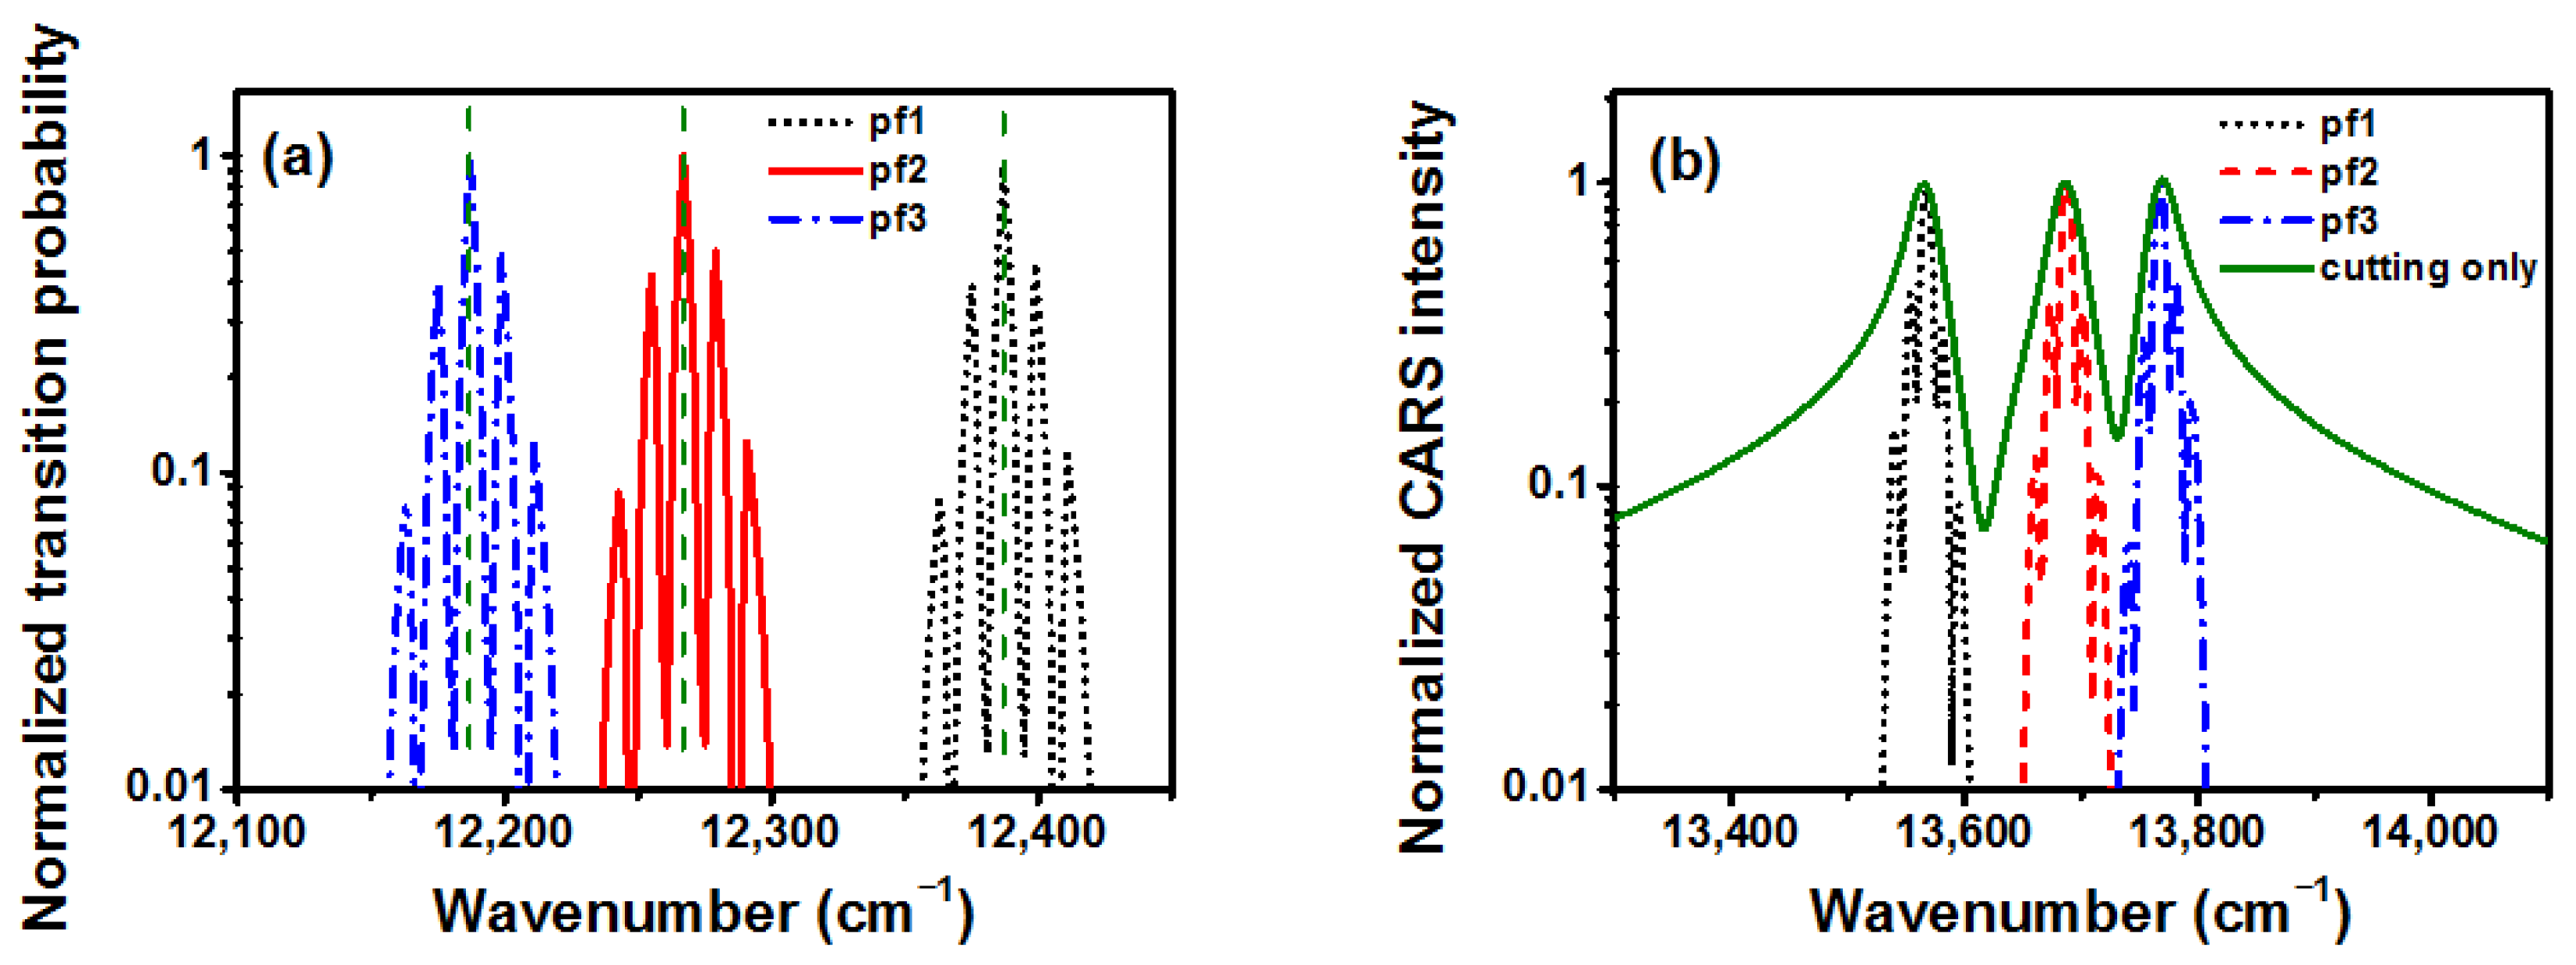
2.2. Selective Excitation of CARS Peaks

Owing to the wide spectra of the pump, Stokes, and probe pulses, three CARS peaks can be excited simultaneously, forming a wide CARS signal, which can be detected (as shown by the black solid curve) [11]. Equation (2) clearly shows that the width of the probe spectrum is the key factor in determining the width of the CARS peak. Narrow and discrete CARS peaks can be achieved by cutting off the probe spectrum [11,39,40]. The modulation of the probe laser is shown in Figure 2a. By adjusting the window width, the frequency components with a width of 16 cm−1, centered at 12,987 cm−1, are preserved and the other frequency components (covered with red slashes) are cut off. The word ‘window’ means the region between the two red meshed areas in Figure 2. Only the probe pulse is tailored, while the pump and Stokes pulses retain the transform limited (TL) pulse. The calculated results demonstrate three distinct and discrete CARS peaks at 13,567, 13,687, and 13,767 cm−1 [as shown in Figure 2b].
By modulating the amplitude and the phase of the pump and the Stokes light, selective excitation of the stimulated Raman spectrum can be realized [37,38,41]. The modulating schemes for the pump and Stokes laser are shown in Figure 3a,b, respectively. The minimal interval in the frequency domain is 2 cm−1. Figure 3a shows the modulation of the pump laser spectrum. The frequency components in the window with a fixed width centered at 12,987 cm−1 are preserved, and the frequency components outside this window are cut off. A rectangular π-phase modulation with one-third the width of the window is applied to the central part, as shown by the blue solid line in Figure 3a [37,38]. For the Stokes laser, the frequency components outside the window with a width equal to that of the pump laser are cut off. A rectangular π-phase modulation with one-third the width of the window is applied in the middle of the window, while the others remain in the 0-phase, as shown in Figure 3b. The center of the modulation window of the pump light is fixed at 12,987 cm−1, while that of the Stokes light scans from low to high frequency. In addition to the rectangular π-phase modulation, it also scans from low to high frequency, as shown by the green arrow in Figure 3b. Figure 3b shows the modulation when the window moves to a certain position. The window sizes of the pump and the Stokes light can be adjusted to obtain the best Raman selective excitation. The selected Raman peak has a higher intensity and a larger contrast with the suppressed Raman peaks.
The Raman transition probabilities are calculated theoretically from the aforementioned modulation schemes, as shown in Figure 4a. The window sizes of the pump and Stokes light are both 36 cm−1, and those of the π-phase modulation are 12 cm−1. The step position of the Stokes light, which means the center of the moving window, scans from low to high frequencies. When the step position is less than 12,155 cm−1, the frequency difference between the pump and Stokes light in the window does not satisfy the Raman transition due to spectral shearing, and hence, the three Raman transition probabilities are all zero [11,19,38]. A similar situation occurs when the step position is greater than 12,421 cm−1. When the step position exceeds 12,155 cm−1, the Raman transition pf3 begins to get excited. With the increase in the step position, pf3 oscillates continuously, which is caused by the constructive/destructive interference of the different path integrals of the shaped Stokes and pump laser in the stimulated Raman transition. When the step position increases to 12,187 cm−1, the Raman transition pf3 is excited well and reaches a maximum of 278.9, while pf1 and pf2 are still zero [11,19,38]. When the step position exceeds 12,221 cm−1, pf3 gradually decreases to 0. The calculation results show that pf3 is divided into five sub-peaks, and the width of each sub-peak is approximately 13 cm−1. This is mainly due to the width of the pump and the Stokes light window. The results show that the width of each sub-peak of pf3 increases with an increase in the pump window width in the case of the same shaping method. The cases of the Raman transitions pf1 and pf2 are similar to that of pf3, and hence, they are not explained here. If the three peaks become closer by 10 cm−1, there will be overlapping sub-peaks. Therefore, the minimum peak interval between pf2 and pf3 is 70 cm−1.
When the step position is in the range of 12,221–12,235 cm−1, pf1, pf2, and pf3 are all zero. This is similar to the case when the step position is in the range of 12,301–12,355 cm−1. As can be seen from Figure 4a, the ranges of the three Raman transitions pf1, pf2, and pf3 are completely separated; that is, when the intensity of one Raman peak is not 0, those of the other two are 0 [11]. The contrast between the peaks is more than 100:1. The maximum values of pf1, pf2, and pf3 are at the positions of 12,387, 12,267, and 12,187 cm−1, respectively.
The results of the selective excitation of CARS are shown in Figure 4b. The red, black, and blue dotted lines represent the result when one of the three CARS peaks is excited and the other two are suppressed, and the green solid line represents the three CARS peaks when only the probe laser is cut off (as shown in Figure 2a). In the three dotted lines, when one peak is fully excited, the other two peaks are suppressed to 0. Their peaks are completely separated without overlapping [11]. The three dotted lines are normalized according to the peak value of pf2, and the three CARS peaks are at 13,567, 13,687, and 13,767 cm−1, respectively, which coincides with the three peaks of the green curve. The green solid line is normalized according to the peak value of pf2. Each CARS peak is also divided into five sub-peaks, corresponding to the sub-peaks of the Raman peaks, and the sub-peak width is close to that of the Raman sub-peak. In addition, the spectrum after selective excitation is narrower without overlap. The resolution increases, and the background noise is greatly reduced [11,38]. The four small sub-peaks are smaller than half of the middle sub-peak, which is also due to destructive interference. The small peak width is related to that of the modulation window, and thus, the spectral width becomes narrow.
When the bandwidth of the pump and Stokes lasers are both limited to 36 cm−1, pf1, pf2, and pf3 can be excited selectively even in the absence of the phase modulation. However, after adding the phase modulation, one Raman peak is split into five sub-peaks because of the destructive interference. There are two main advantages for the phase modulations added on the pump and the Stokes laser pulse. The peak intensity of the pump laser is depressed by 50%, while the Raman transition probability is nearly the same. Therefore, the intensity of the pump and Stokes laser can be further enhanced by 50%, and the CARS intensity is enhanced by more than 100%, under the condition that the sample is not damaged by the intense laser. Each Raman peak is divided into five sub-peaks, and the four small sub-peaks are all smaller than a half of the middle sub-peak due to the destructive interference. The FWHM is decreased from 22 cm−1 to 5 cm−1, which is interesting when enhancing the CARS spectral resolution.
Pulse shaping is an effective method for suppressing those noises and improving the signal-to-noise ratio. The CARS peak can be selected arbitrarily and coherently controlled conveniently. As shown in Figure 3 and Figure 4, three peaks can be excited, respectively, while the other two can be effectively suppressed, which can greatly improve the signal-to-noise ratio. In order to greatly enhance the signal intensity and improve the signal-to-noise ratio, the Fano resonance of the disk-ring nanostructure is used to achieve this goal well.
To attain the best signal-to-noise ratio, the CARS signal should be stronger, and the adjacent CARS peaks should be smaller. The influences of the window width of the probe, pump and Stokes light on the CARS intensity and on the hybridization rate are studied, respectively. In order to accomplish the optimization of the selective excitation of CARS, the window width d of the probe light is maintained at 16 cm−1, and the window widths w of the pump and Stokes light are both set as 36 cm−1. The details are shown in the Appendix A.
There is some research on one or two CARS peaks selectively excited among the three ones [11,19,42,43,44]. However, how to simultaneously excite multiple CARS peaks through optimal phase modulation is a big problem that requires further study.

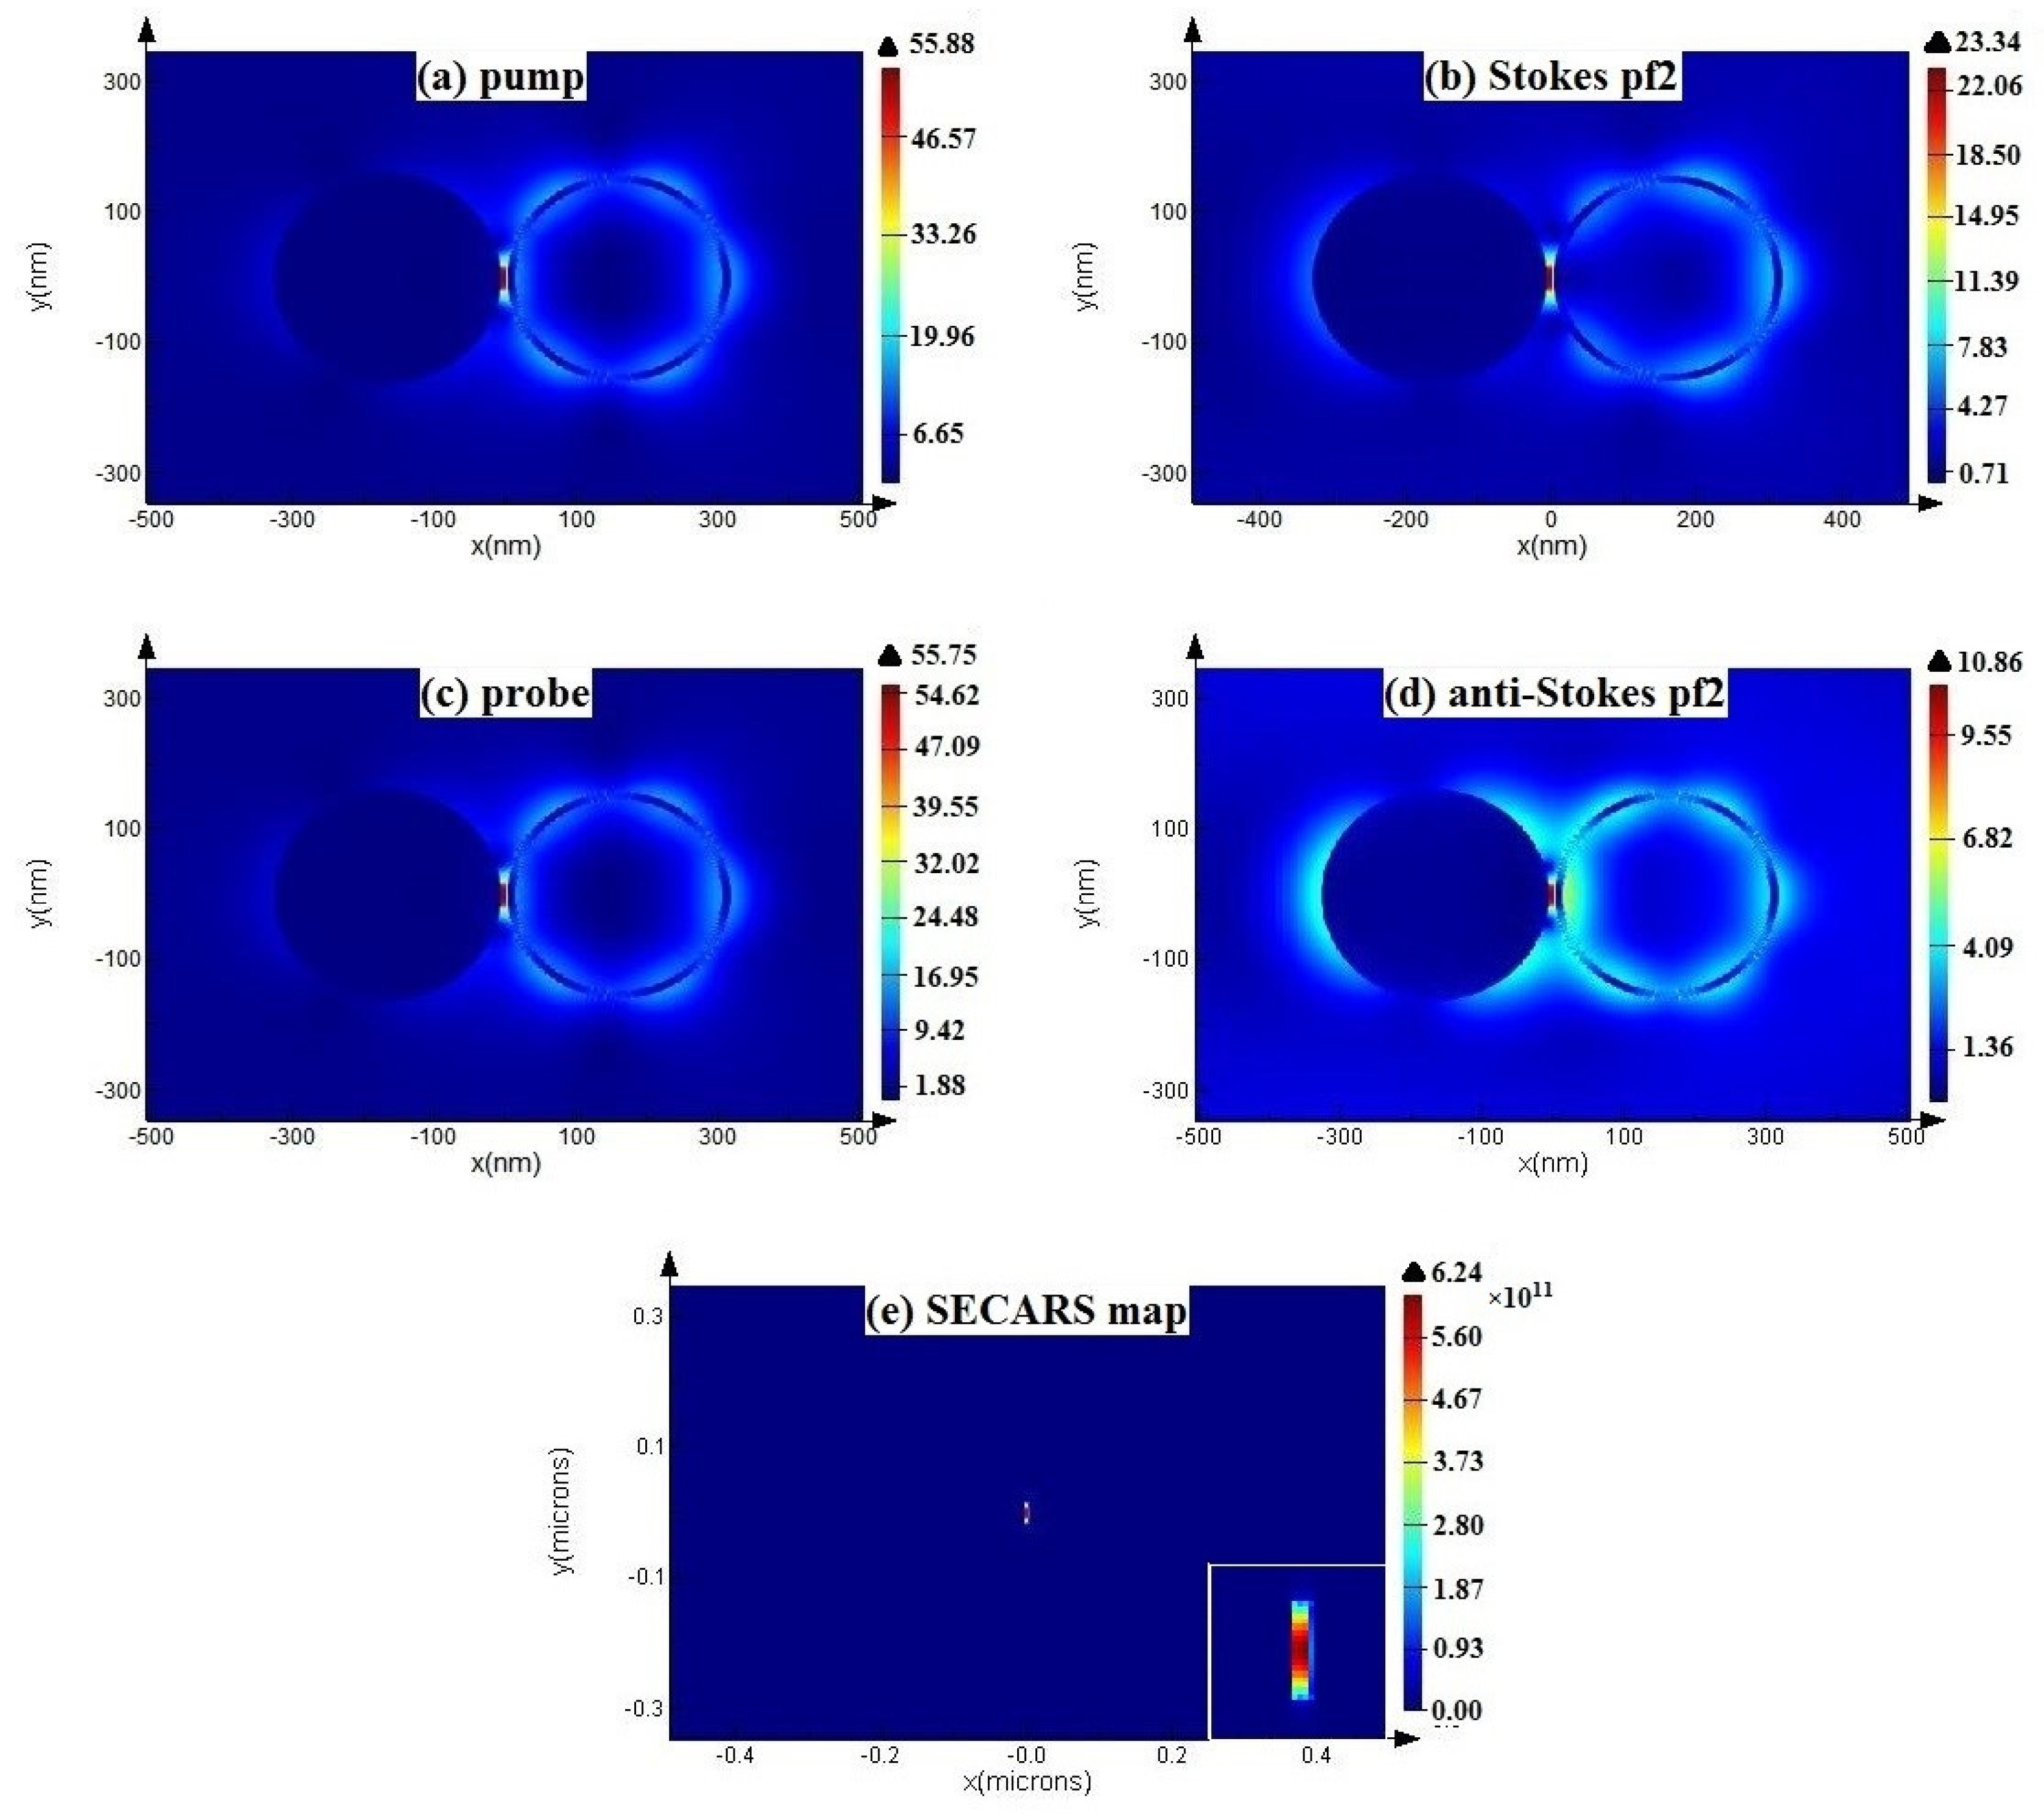
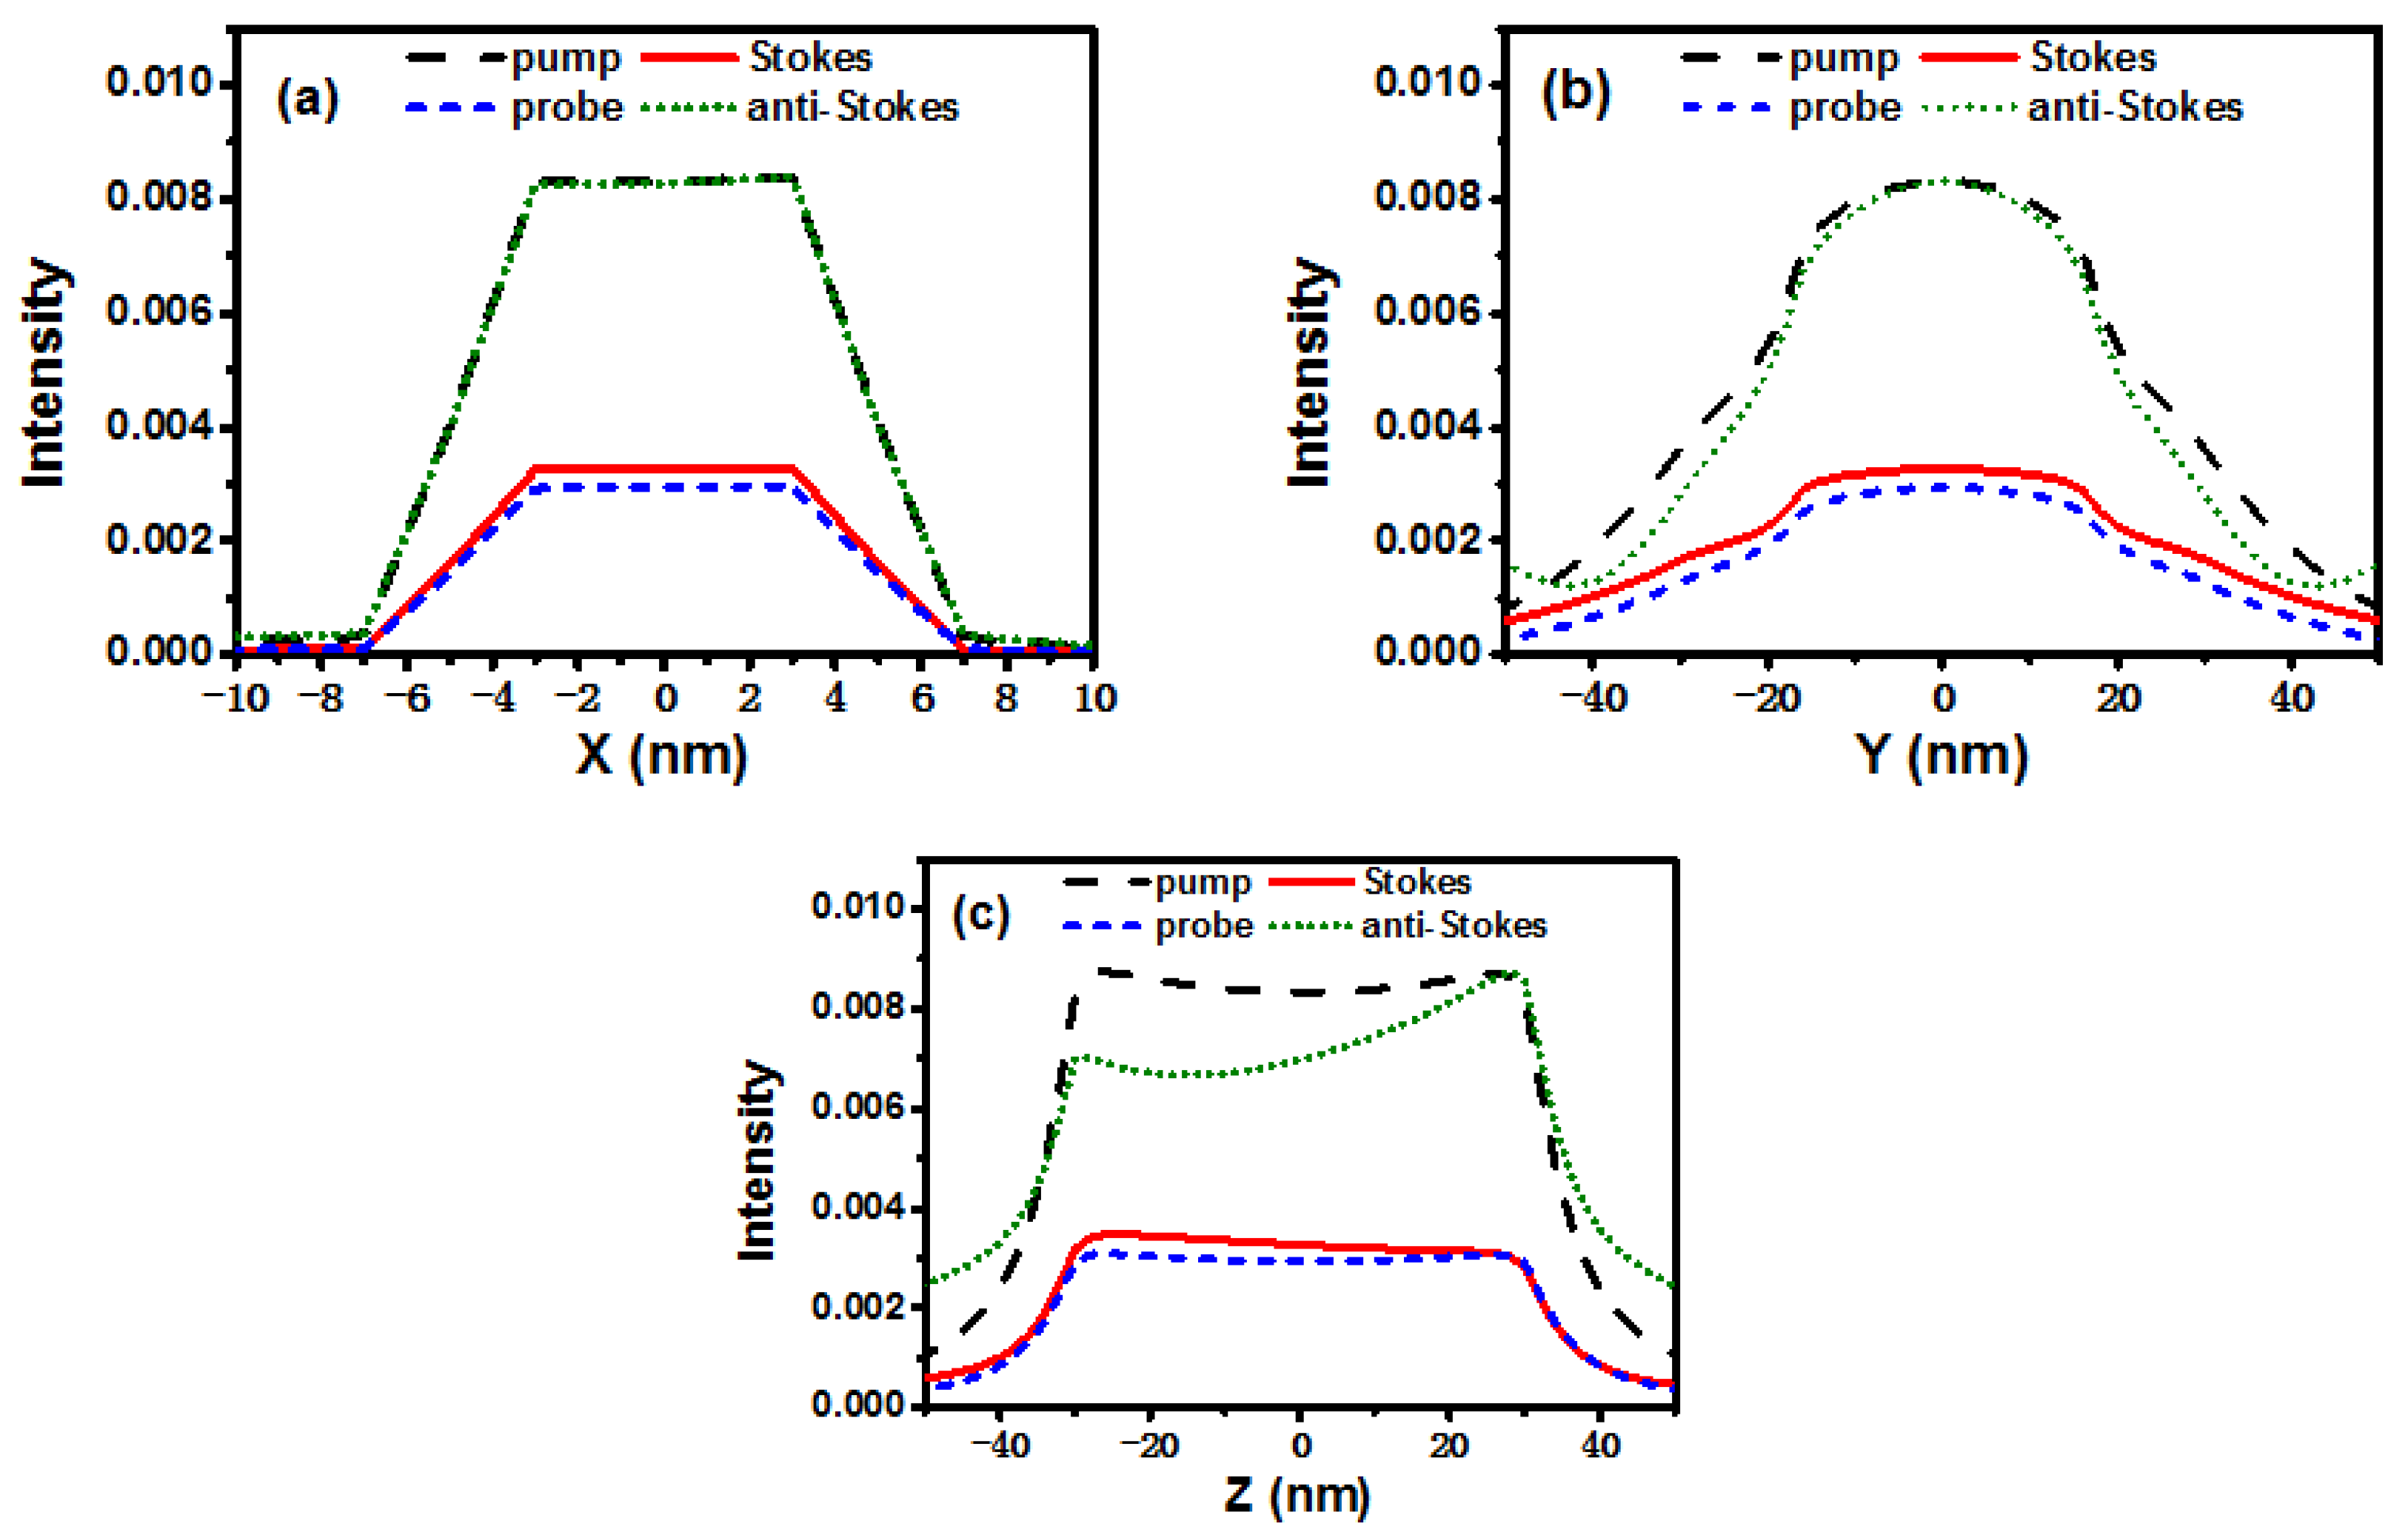
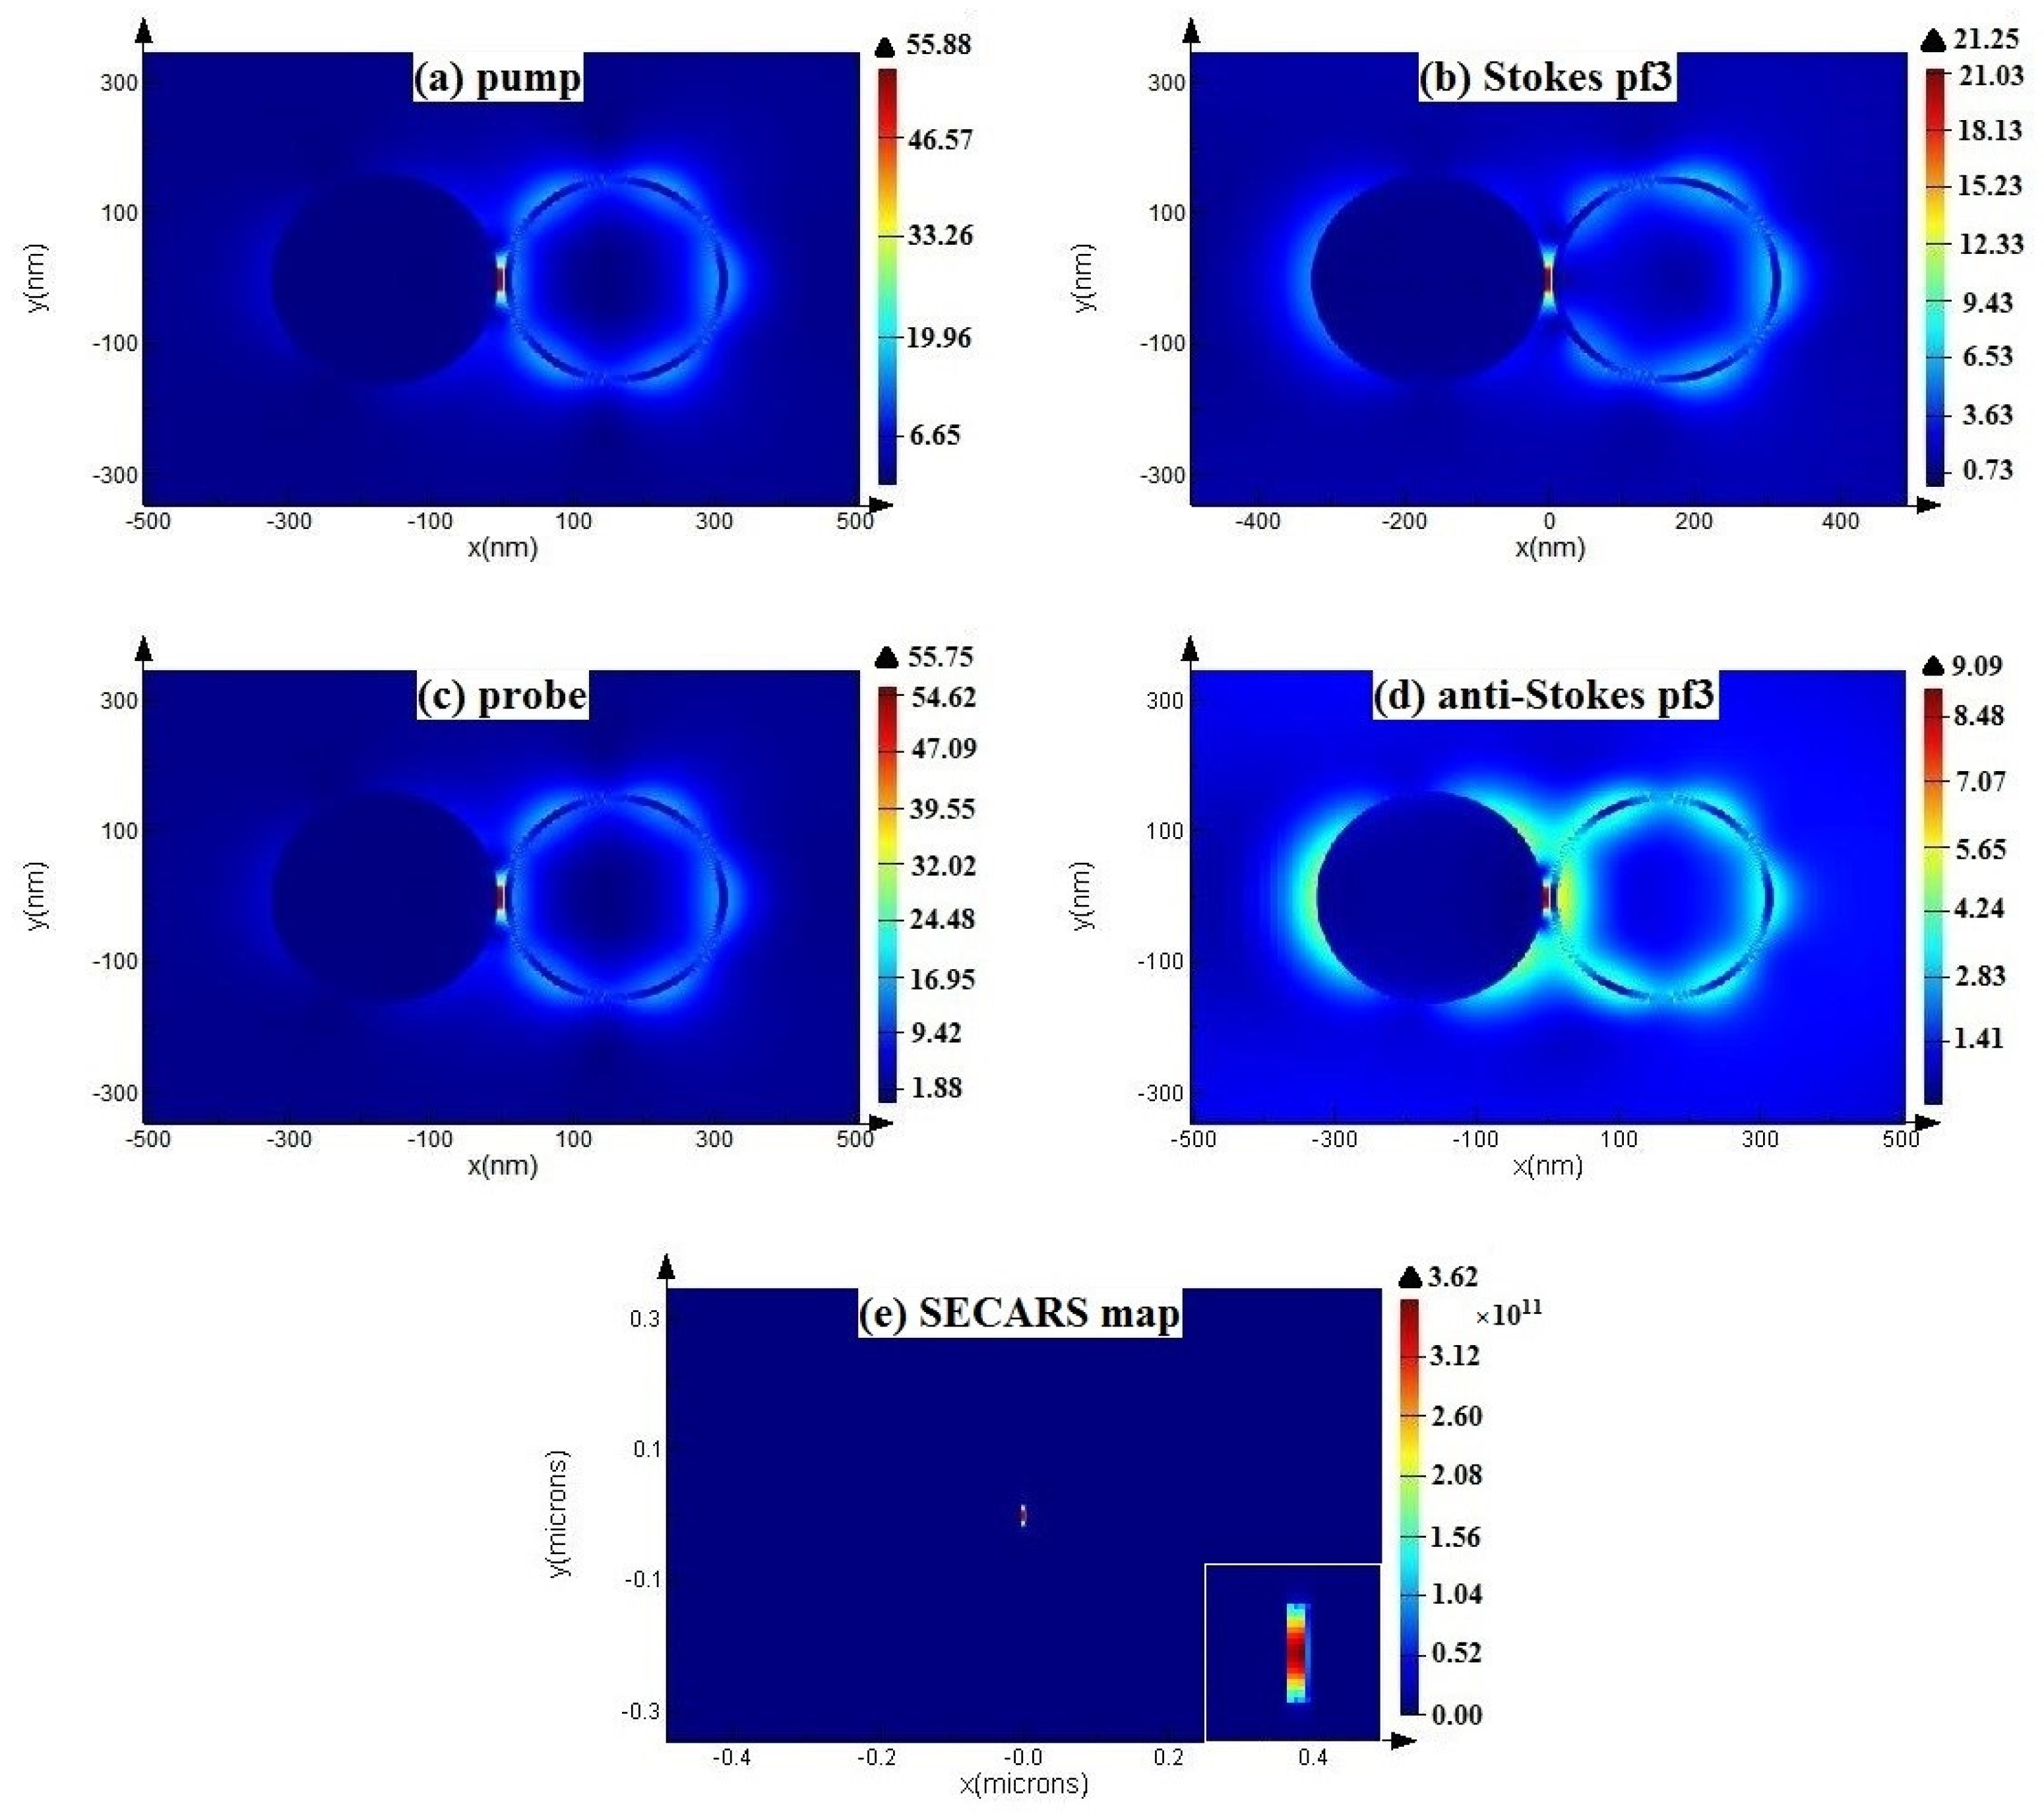
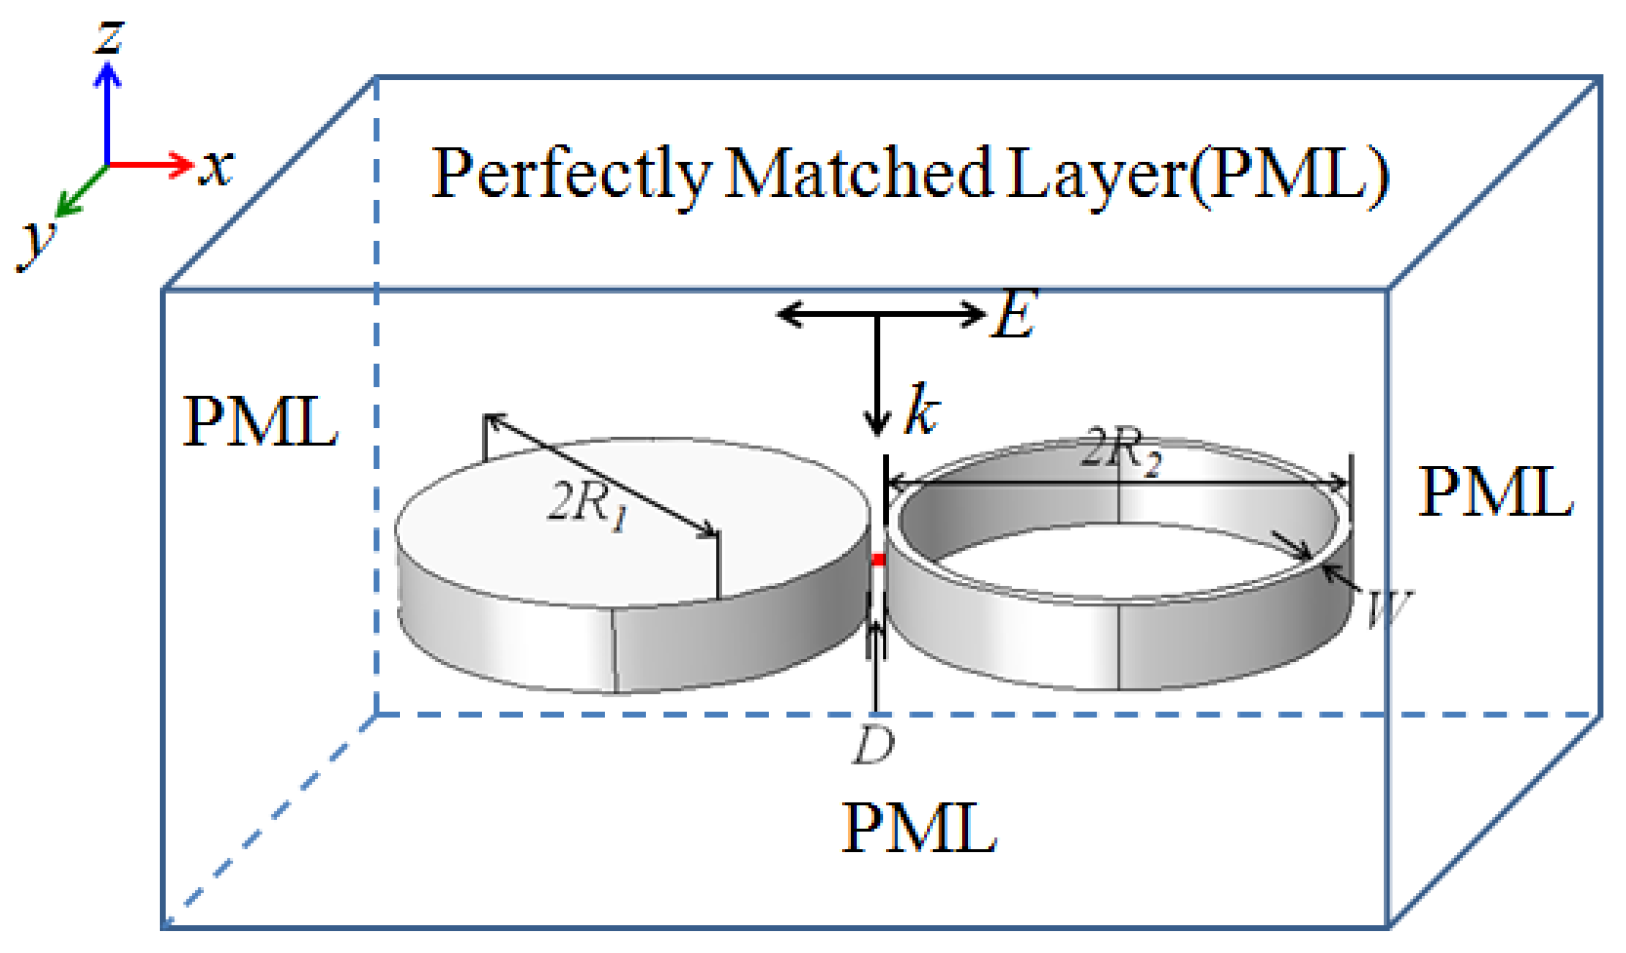
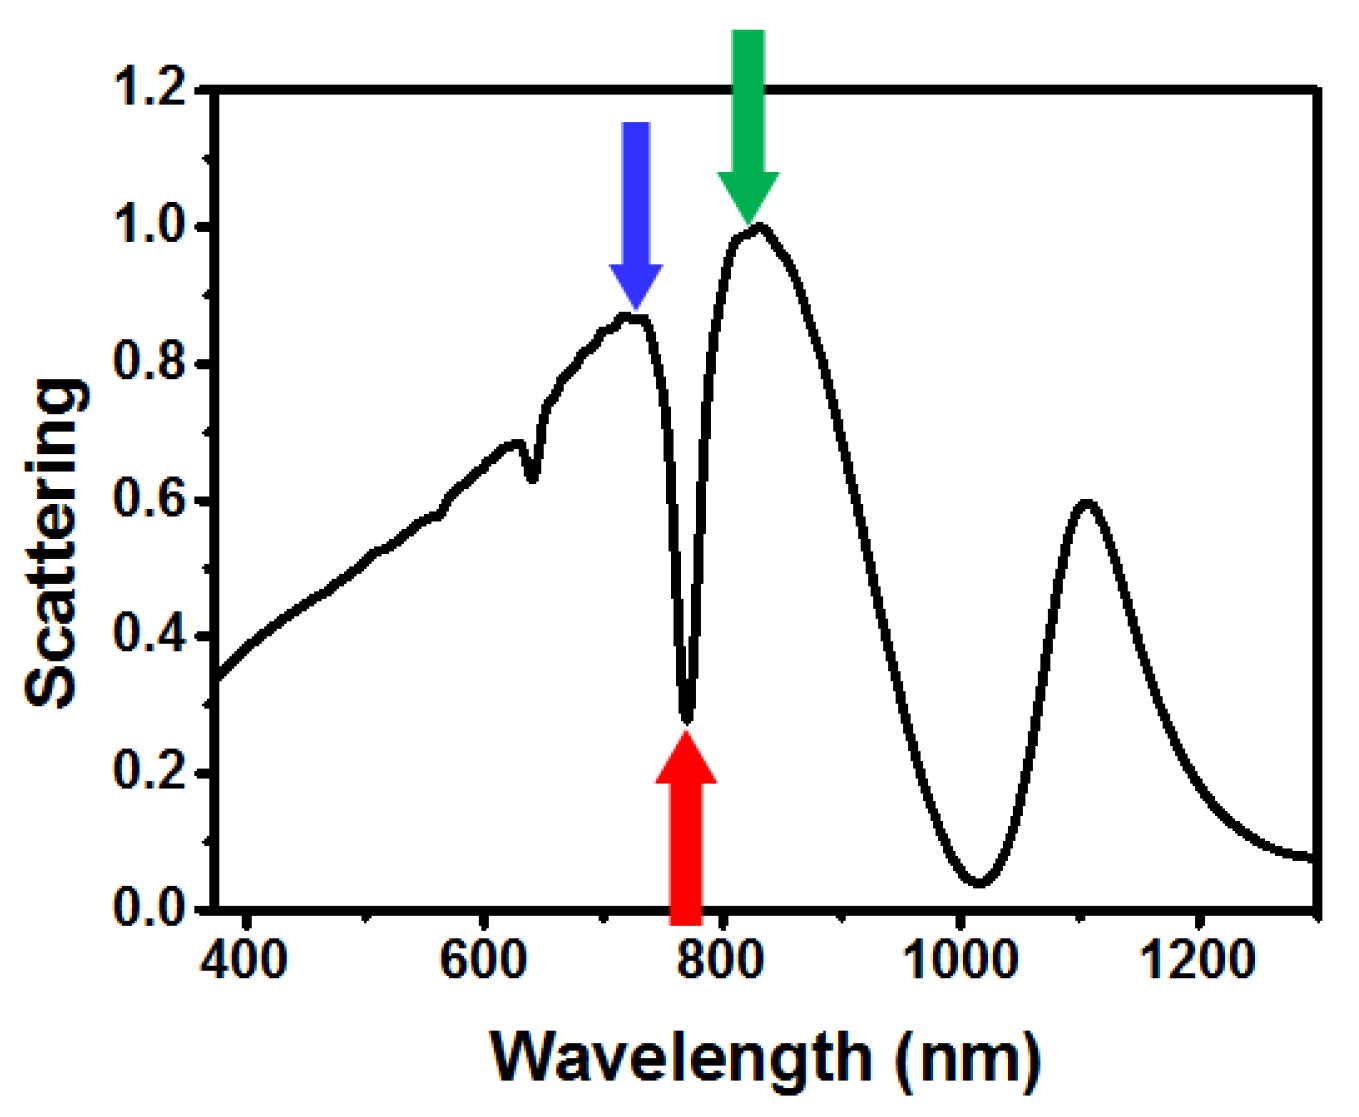
3. SECARS Based on Fano Resonance in a Disk-Ring Nanostructure

According to the theoretical analysis, the enhancement factor (EF) of SECARS is expressed as [26,45]
E F S E C A R S 2 = g p 2 g p r 2 g s 2 g as 2 ,
where gp, gpr, gs, and gas represent the EF of the pump (Ep), probe (Epr), Stokes (Es), and anti-Stokes (Eas) fields induced by the surface plasmons generated on the plasmonic substrates, respectively.
According to Equation (3), an optimum plasmonic SECARS substrate generally requires two conditions: high simultaneous electric field enhancement for the pump, probe, Stokes, and anti-Stokes laser at the corresponding frequencies and complete spatial overlap of all the hot spots at the four different frequencies [1,26]. However, the four lights of ωp, ωpr, ωs, and ωas are resonantly enhanced at different frequencies. To simultaneously enhance the four surface plasmon modes in the SECARS process and to ensure that the hot spots are located at the same position, the design of the plasmonic SECARS substrate must have very stringent requirements [26].
Fano resonance can lead to strong electric field enhancement [46,47,48]. It is produced by the interaction of broad-band bright mode and narrow-band dark mode by two excited pathways [47,49]. The pump and probe lights can be used to enhance absorption in the dark mode, and the Stokes and anti-Stokes signals can enhance radiation in the bright mode [47,49,50,51]. Therefore, Fano resonances have been applied to enhance the electric field of the CARS signal [52,53,54,55,56]. In these cases, though the four frequencies were all in resonance simultaneously, the “hot spots” were not in the same spatial locations. Therefore, the design or engineering of plasmonic Fano structures with “hot spots” of the bright and dark modes occurring in the same spatial location is critical and challenging for SECARS applications.
A plasmonic nanostructure consisting of a nanodisk outside of a nanoring demonstrated Fano resonances at the quadrupolar, hexapolar, and octupolar resonance modes, with both a high contrast ratio and a high figure of merit [49,57,58,59,60,61]. The resonance frequency, depth, and line width of the Fano dips can be tuned by changing the geometrical parameters of the nanodisk and the nanoring [49]. The hot spots of all the Fano resonance modes, even the bright modes, are in the gap between the nanodisk and nanoring. This is very important for enhancing the CARS signal.
A schematic of the proposed disk-ring nanostructure is shown in Figure 5. The radius of the disk is R1, the outer radius and wall width of the ring are R2 and W, respectively, and the gap between the disk and the ring is D. Both the disk and the ring are made of Ag. The complex permittivity of Ag was taken from Ref. [62], and the permeability is μ = 1. There are many kinds of substrates, which mainly cause different red shifts of the scattering spectrum [63,64,65]. Therefore, in the numerical simulation, the substrate is not included. The probe point is located at the origin of the Cartesian coordinates, which is the center of the disk-ring gap. A beam of plane light radiates perpendicularly to the origin, and the electric field is in the X direction. All the simulations were performed in a volume of 1500 × 1200 × 900 nm3 with the FDTD Solutions software produced by the Lumerical Solutions company [66,67]. Perfectly matched layers are set at all the boundaries of the total simulation cube, which can absorb all the outgoing radiation and eliminate the reflections. Similar to many references, all of the boundaries are set to more than half a wavelength away from the metal nanostructures [66,67,68]. The structures were discretized using mesh steps of 2 nm in the X, Y, and Z directions to obtain reliable results within a reasonable simulation time.
Fano resonance can be optimized by changing the size of the disk-ring structure. The dipole mode of the nanodisk can be excited by the incident light, and the Fano resonance is obviously red-shifted with the increase in R1 [49,57,58,59,60,61]. The quadrupole, hexapole, and octopole resonance modes of the ring excited by the dipole mode of the disk also shift red with the increase in R2. In contrast, the Fano resonance shifts blue with the increase in W. In addition, these parameters have great influences on the contrast and quality factor. Details can be found in Ref. [49].
To enhance the electric field of the Fano resonance, the gap D is set as 10 nm, the radius R1 of the disk is set as 160 nm, and the inner and outer radii of the ring are set as 147 and 157 nm, respectively. The height of the structure was set as 60 nm. The parameter settings are shown in Table 1. The scattering spectrum calculated using the FDTD simulation is shown in Figure 6, where the curve is normalized according to the peak value. The scattering spectrum shows that there are two very deep Fano resonance dips, one at 770 nm and the other at 1020 nm. Fano resonance is generally considered to be the interference between the bright superradiance and the dark nonradiative modes. In the disk-ring structure, the bright mode of the nanodisk can be excited by two pathways: |L>→|B> and |L>→|B>→|D>→|B>, where |L>, |B>, and |D> are the incident light, the bright mode of the disk, and the multipole dark mode of the ring, respectively [47,50]. The destructive interference of the two pathways results in Fano resonances and forms dips in the scattering spectrum [49]. The dips near 770 and 1020 nm are formed by the coupling of the dipole resonance of the disk and the hexapole and quadrupole resonance of the ring, respectively [49]. The dip position indicated by the red arrow is at 770 nm, and the contrast is 72.3%. It is worth noting that the FWHM is very narrow and less than 21 nm. Many studies have reported that the FWHM of the Fano resonance is of the order of tens of nanometers, which mainly depends on the dark mode, radiation loss, or coupling effect [51,69,70,71,72].
Deeper and narrower Fano dips result in higher surface enhancement of the local intensity at the hot spot [29,51,53]. A wavelength of 770 nm was chosen as the wavelength of the pump and probe light (their central wavenumbers are 12,987 cm−1). The wavelength of the Stokes light was chosen as 814 nm (the central wavenumber is 12,287 cm−1), which was close to the position of the scattering peak (green arrow). The central wavenumbers of the three anti-Stokes lights were calculated to be 13,567 (737 nm), 13,687 (730.6 nm), and 13,767 cm−1 (726.4 nm), respectively. The electric field enhancement is the largest at the dip of the Fano resonance, and the dark state is beneficial to the absorption of light. Adjusting the pump and probe light to the Fano dip can improve the absorption of light and the intensity of the CARS signal. The scattering peaks indicated by the blue and green arrows are the bright state, which can enhance the electric field and radiation and further enhance the CARS signal.

4. Ultrafast Selective Excitation of SECARS

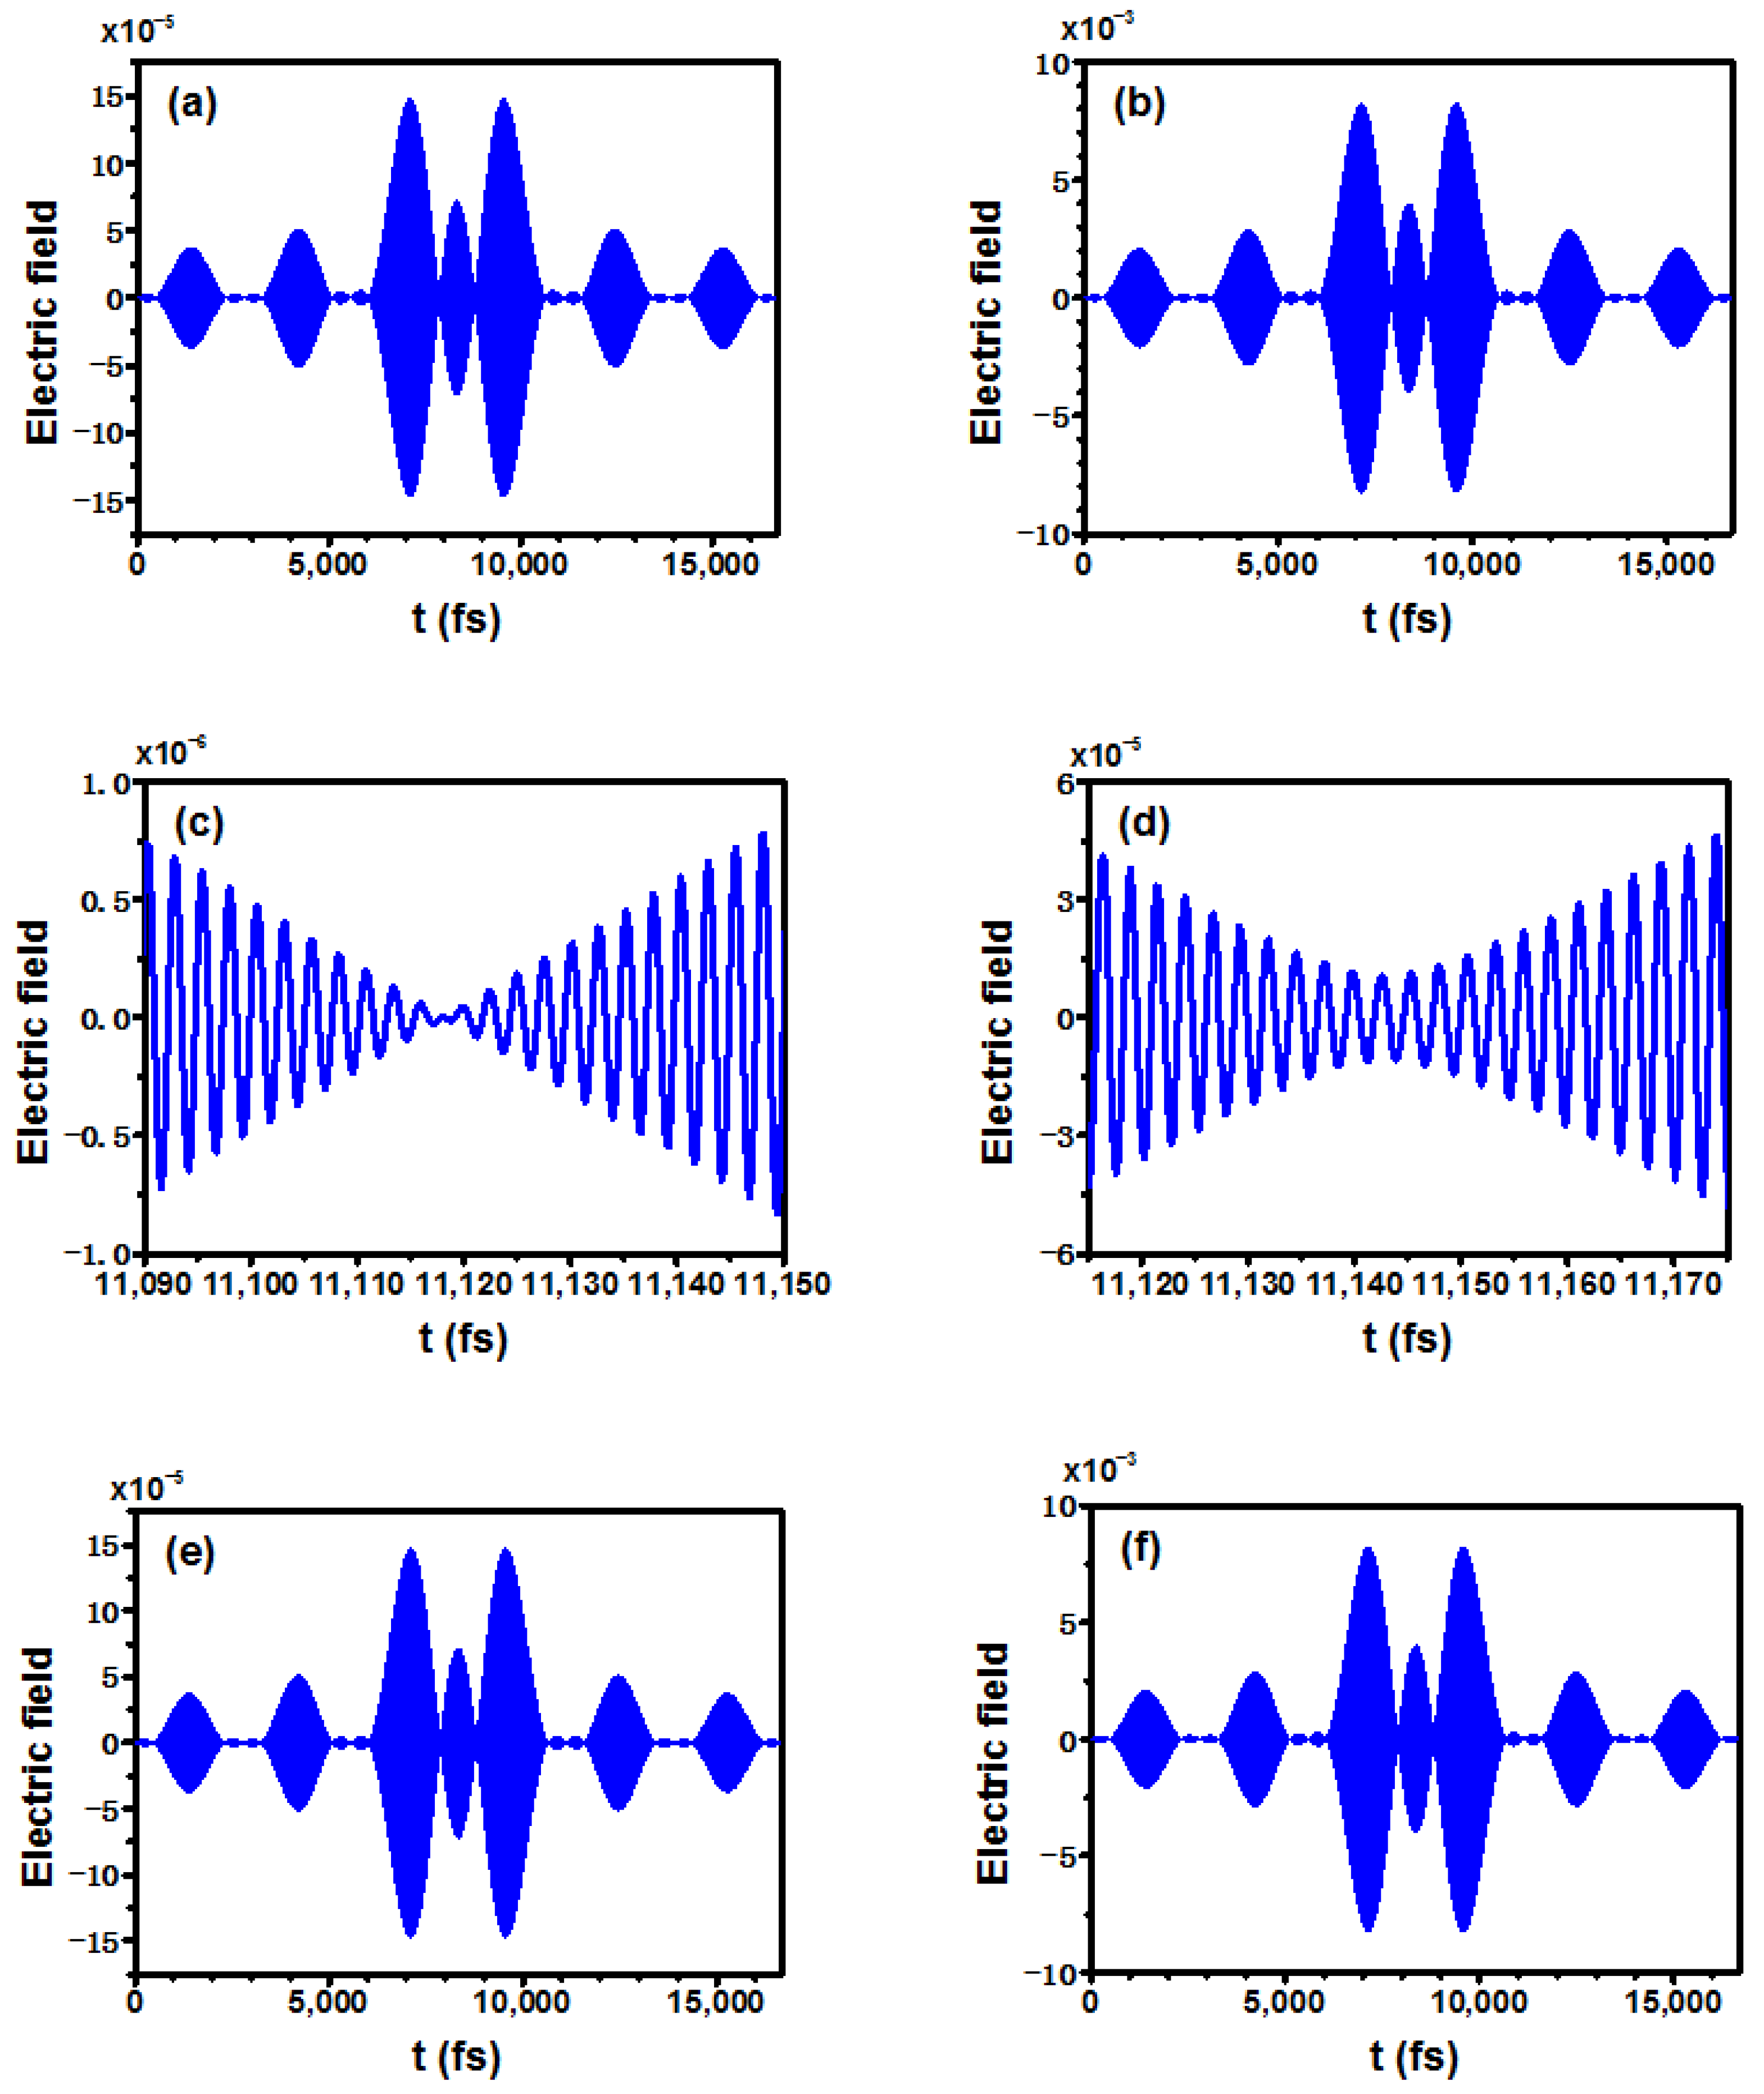
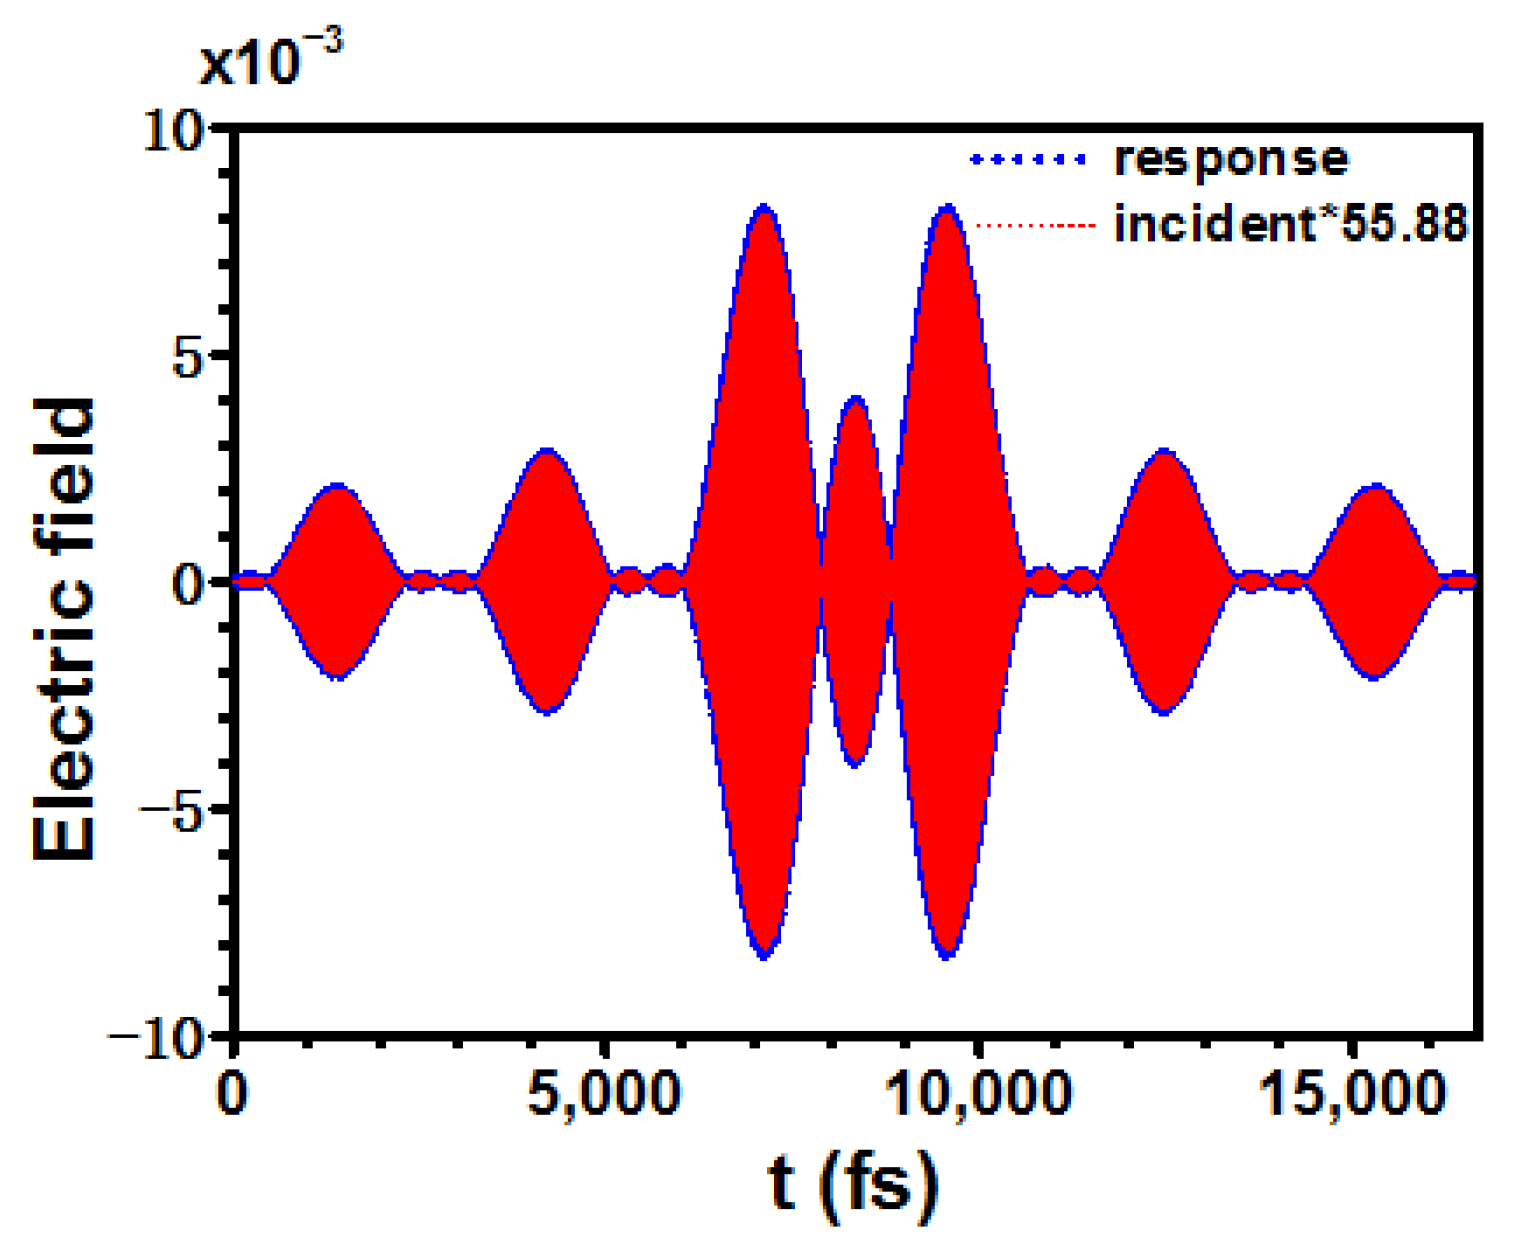
4.1. Ultrafast Dynamics of the Shaping Laser Pulses on the Disk-Ring Structure

The frequency distribution after pulse shaping is converted into the time domain by the inverse Fourier transform [37,38].
E ( t ) = 1 2 π + E ( ω ) e i ω t + φ ( ω ) d ω
After the optimized pulse shaping (as shown in Appendix A), the pump, Stokes, and probe light are incident on the gap between the disk and ring along the Z direction, which excites the surface plasmon and Fano resonance. The impulse response of the time-domain, frequency-domain, and phase can be obtained by evolution calculations [37,38,68]. The parameters of the dynamic calculations are the same as those of the scattering spectrum. The time region is set as [0, 16,677] fs with an interval of 0.2 fs. It should be noted that the electric field in this manuscript refers to the instantaneous value of the electric field. The maximum value of the TL pulse before the pulse shaping is set to 1, and the later modulated and calculated electric fields are relative to the maximum value.
When the step position of the Stokes laser reaches 12,387 cm−1, the Raman transition pf1 is excited, while pf2 and pf3 are zero (Figure 4a). Figure 7 shows the input and response of the pump pulse in the time domain, which are normalized by the real part of the electric field of the TL pulse. Figure 7a,b shows the time distributions of the real part of the electric field of the input and response pulses, respectively. After the optimized shaping, the TL pulse becomes a complex envelope shape of multiple subpulses, as shown in Figure 7a. The peak value of the electric field is reduced to 1.47 × 10⁻⁴ owing to the cutting off of the frequency components and the rectangular π-phase modulation.
The real part of the response pulse is increased by 55.88 times because of the Fano resonance. The Fano dip of the designed disk-ring nanostructure is very deep and narrow, and the electric field enhancement factor is higher than those of the disk-ring structures reported in the literature [49,57,58,59,60]. Compared with the common TERS structure, the proposed disk-ring structure has a larger gap and a higher enhancement ratio [38,73,74,75]. If the gap is further reduced, the electric field will be further enhanced.
In Figure 7c is an enlarged view of (a) in the range of 11,090–11,150 fs, and (d) is the response of the part in (c), that is, the pulse in the 11,115–11,175 fs range in (b). It can be seen that the overall shape of the response pulse is very similar to that of the input pulse, but some of the details are different. The response pulse is approximately 26 fs later than the input pulse. The incident light plane is 430 nm away from the probe point, and it takes approximately 1.43 fs for the light to propagate to the probe point. When each subpulse of the shaped pump pulse irradiates the disk-ring structure, a response will be excited, including the establishment and disappearance of the surface plasmon oscillation. It takes approximately 24.6 fs, longer than that of the TERS and double rods [38,67]. Except for the different structure and the size, the Fano resonance occurrence is usually due to the interference between two pathways: |L>→|B> and |L>→|B>→|D>→|B> (L: the incident light; B: the bright mode of the disk; D: the multipole dark mode of the ring) [47,50]. Hence, it needs more time to establish the resonance mode. From the comparison with Figure 7c,d, it can be seen that the response pulse not only appears delayed, but also broadened. The pulse near 11,142 fs does not decrease to zero, as shown in Figure 7c, but decreases to a certain amplitude and then increases gradually, which is mainly due to the lifetime of the surface plasmons excited by the incident light [37,38,76,77,78].
The imaginary parts of the electric field of the pump input and the response pulse in Figure 7e,f are similar to the real parts and do not repeat again. The time distribution of the real part of the electric field of the Stokes, probe, and anti-Stokes pulse is calculated, and the results are shown in Appendix B.

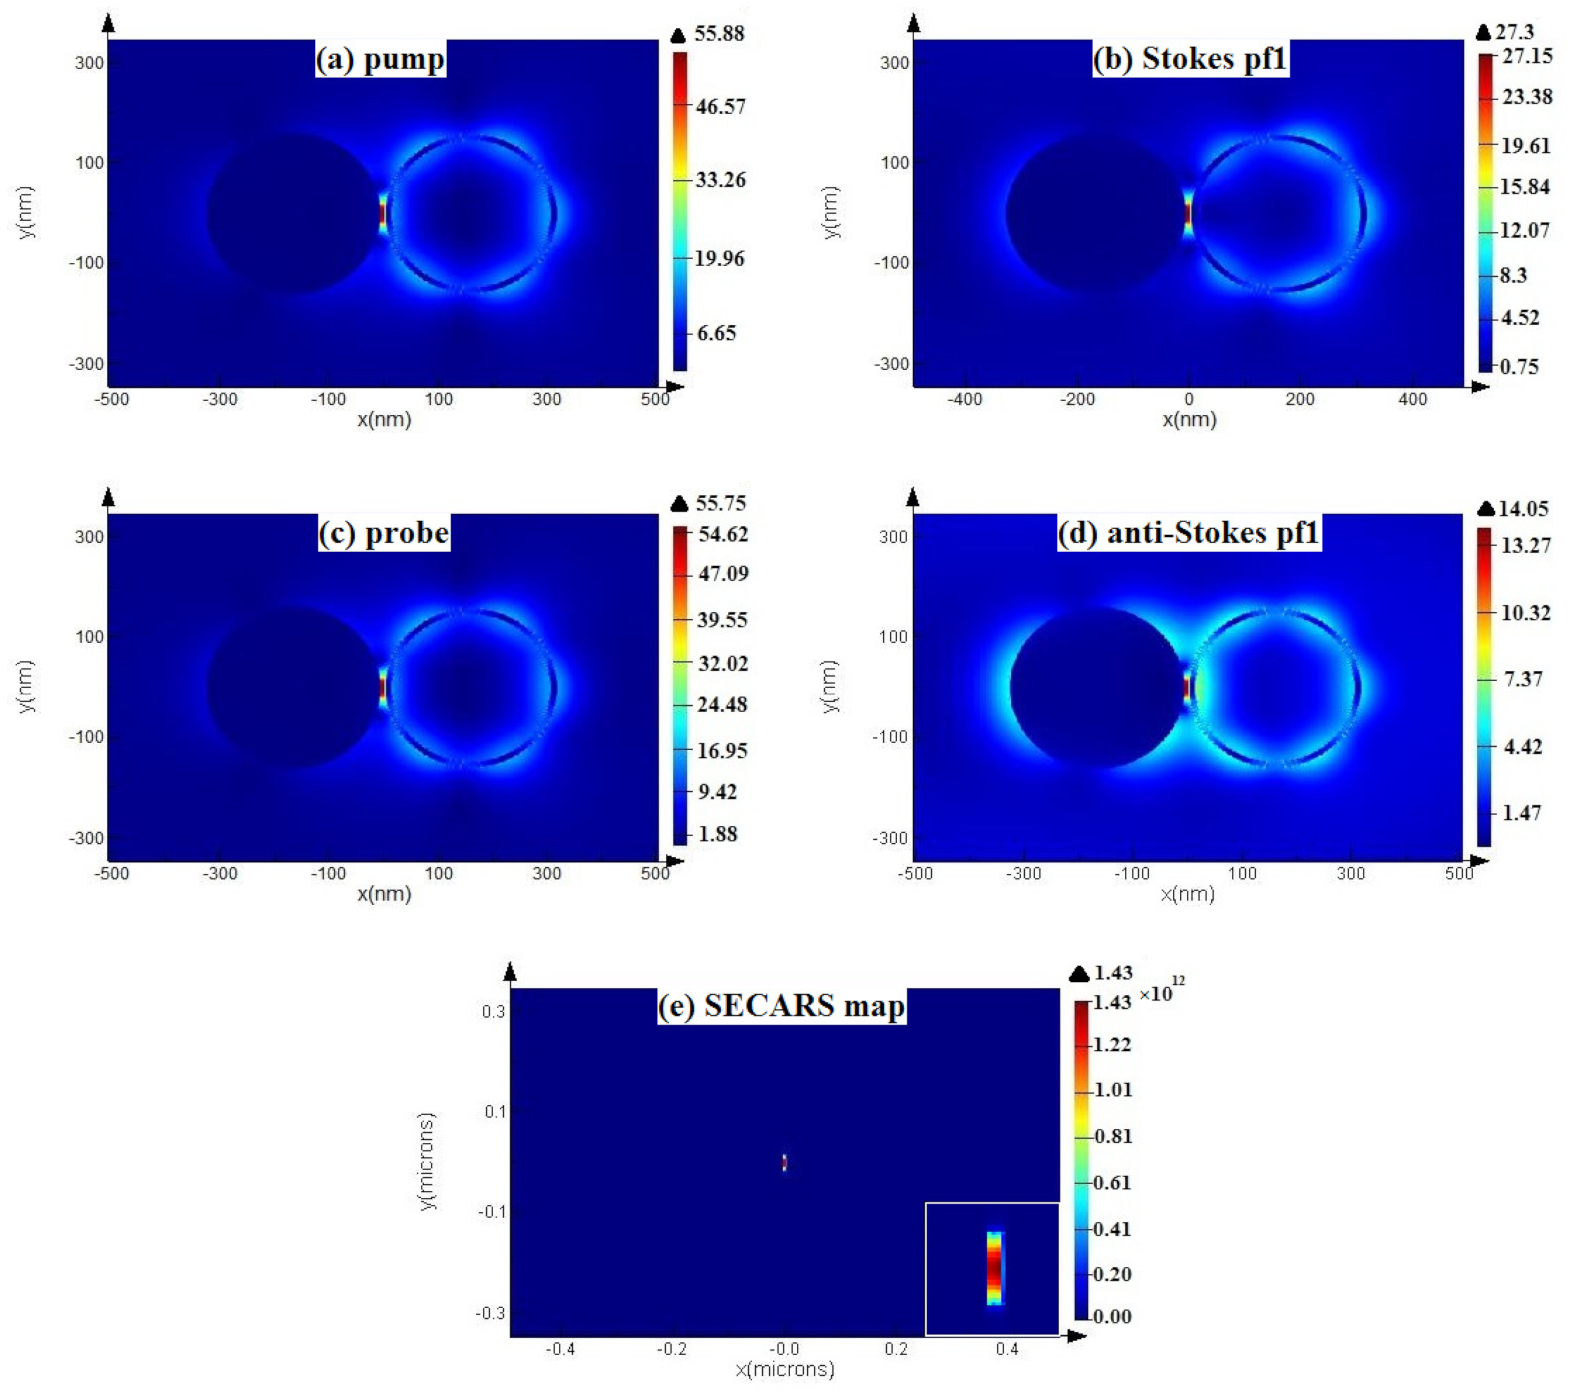
4.2. SECARS Based on Fano Resonance in the Disk-Ring Structure

When the step position of the Stokes laser reaches 12,387 cm−1, the Raman transition pf1 is excited, while pf2 and pf3 are suppressed to zero (Figure 4a). The time distributions of the input and response pulse of the pump, Stokes, and probe light are shown in Figure 7 and Figure A4 (Appendix B).
Figure 8 shows the distribution of the transient electric field intensity at the first maximum peak of 7128.3 fs of the pump light in Figure 7b, and those of the Stokes, probe, and anti-Stokes light at the same time, where the vertical axis is shown as the enhancement factor. The results indicate that the hot spots of the pump, Stokes, and probe field are mainly distributed in the disk-ring gap. According to Equation (2), the hot spot of the anti-Stokes light is also distributed in the gap, which coincides with those of the three lights. The SECARS diagram at this time is calculated according to the formula G = gp2gs2 gpr2gas2, and shown in Figure 8e [26,45]. The inset is an enlarged view of the region of 60 nm × 60 nm size in the center of the gap.
In order to study the spatial overlap of the four hot spots of the pump, Stokes, probe, and anti-Stokes light, the intensity distributions of the electric field along the X, Y, and Z axes are shown in Figure 9, where the center of the disk-ring gap is set as the origin of the coordinate system (see Figure 5). The maximum value of the anti-Stokes light in the figure is set to be the same as that of the pump light. In the three directions, the strongest electric fields are all near the zero point. It should be noted that the values in Figure 8 represent the enhancement of the electric field, and those in Figure 9 represent the electric field intensity according to the maximum value “1” of the TL pulse before the pulse shaping.
For the pump light, Figure 9a shows that the transient intensity increases to 0.004 at x = −5 nm and x = 5 nm and to 0.0083 at the zero point. For the Stokes light, the transient intensity increases to 0.0017 at x = −5 nm and x = 5 nm and to 0.0036 at the zero point. The electric field intensities of the four lights in the X direction coincide completely, and the FWHM is approximately 10 nm. The electric field intensities of the four lights in the Y and Z directions coincide completely, and the FWHM is approximately 54 and 70 nm, respectively, which is similar to that in the X direction. These results clearly demonstrate that the zero point is the hot spot with a deviation of less than 2 nm.
The distributions of the electric field intensity show that the hot spots of the pump, probe, Stokes, and anti-Stokes light are all distributed in the disk-ring gap, and their spatial distributions are coincident, with a deviation distance of less than 2 nm. In other words, the center of the disk-ring gap is the hot spot of the four lights. The total enhancement of SECARS can be calculated by the enhancement factor of each light.
The input of the pump light in Figure 7a is amplified by 55.88 times, and the response light in (b) is shifted forward by 31 fs, as shown in Figure 10. The two pulses are completely coincident, indicating that the pump light is enhanced by 55.88 times on average. Moreover, we performed simulations and found that the hot spot is always at the center of the gap during the oscillation of the surface plasmons. The enhancement factors of the probe, Stokes, and anti-Stokes lights are similarly calculated; they are 55.75, 27.3, and 14.05, respectively. Because the hot spots of the pump, probe, Stokes, and anti-Stokes light coincide completely in the spatial distribution, the total enhancement of SECARS can be calculated by the enhancement factor of each light. According to the formula G = gp2gs2 gpr2gas2, SECARS in the disk-ring structure is enhanced by about 1.43 × 1012 times [26,45].
As a comparison, the electric field enhancement of the double nanodisks with the radius of 80 nm and gap of 10 nm is calculated, and the scattering peak is kept around 800 nm. The enhancement factor of the light in the gap of the double nanodisks is 18.22. According to the formula G = gp2gs2 gpr2gas2, the SECARS enhancement can be roughly calculated as 18.228 = 1.21 × 10¹⁰, which is nearly equal to the results in Ref. [2]. The result of the disk-ring structure is two orders higher than that of double nanodisks. The double rings structure is also calculated. The inner and outer radii are 157 and 147 nm, respectively, with a gap of 10 nm. The scattering peak is kept around 800 nm. The enhancement factor of the light in the gap of the double rings is 17.28; so, the SECARS enhancement can be calculated to be 17.288 = 7.95 × 10⁹. It can be seen that the enhancements of the double disks and the double rings are much smaller than that of the disk-ring structure. Therefore, Fano resonance has essential importance for the enhancement in CARS.
The SECARS with the Raman transition of 12,267 cm−1 and 12,187 cm−1 were also studied in detail and are shown in Appendix C.
In a word, Fano resonance is easy to realize on the disk-ring nanostructure. The hot spots will not only create large enhancements but the Fano resonances will also enhance the resonant vibrational features of the specific vibrational modes and discriminate against the background set by the non-resonant electronic states of the disk-ring nanostructure and molecule of interest. It can be used to study CARS signals of different Raman energy levels (from thousands of cm−1 to dozens of cm−1).
There are many references that demonstrate CARS with single-molecule sensitivity [2,79,80]. The substrate in Ref. [2] was a quadrumer, namely four coupled nanodisks. The maximum enhancement factor of SECARS was calculated to be 1.5 × 10¹⁰. The CARS signal was enhanced by 1011 orders of magnitude relative to the spontaneous Raman scattering, enabling the detection of a single molecule, which was experimentally demonstrated by using a statistically rigorous bi-analyte method. A mixed solution of equal concentrations (100 nM) of p-MA and adenine was drop-casted onto multiple quadrumers for SECARS. This concentration was chosen to ensure that 1.5 molecules fell into each probe region (250 nm2) on the substrate. Three representative single-molecule SECARS of a pure p-MA event, a pure adenine event, and a mixed event were detected clearly. These experimental results implied that having extraordinarily large enhancement factors could lead to single molecule CARS.
Our results achieved an enhancement factor of 1012, which is two orders of magnitude higher than that of Ref. [2] and can also be used to realize single-molecule detection. Figure 8 and Figure 9 show that each probe region is 400 nm2 and 1.6 × 10⁴ nm3 in volume. A solution with a concentration of 120 nM can ensure that 1 molecule falls into each probe region on the substrate of the disk-ring plasmonics.

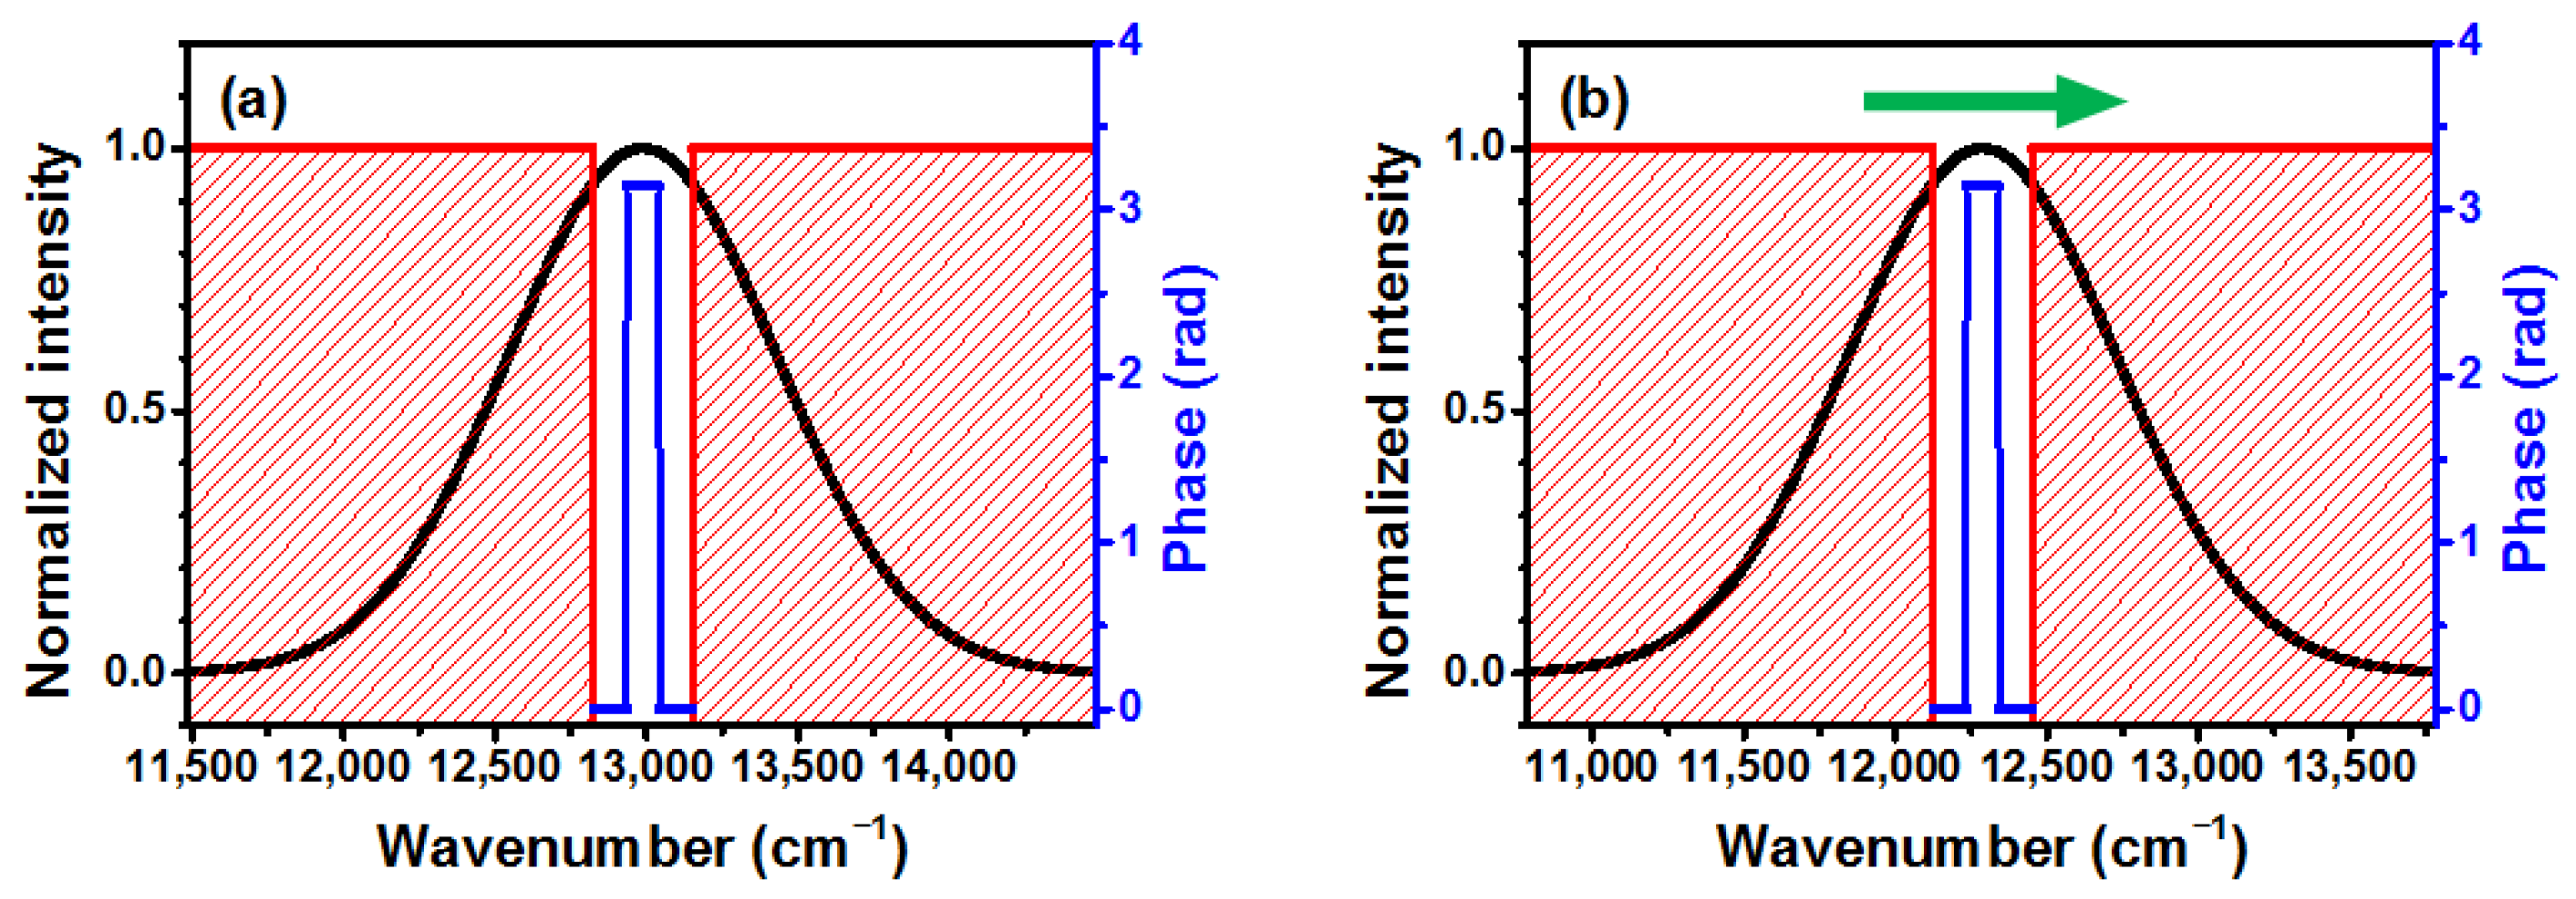
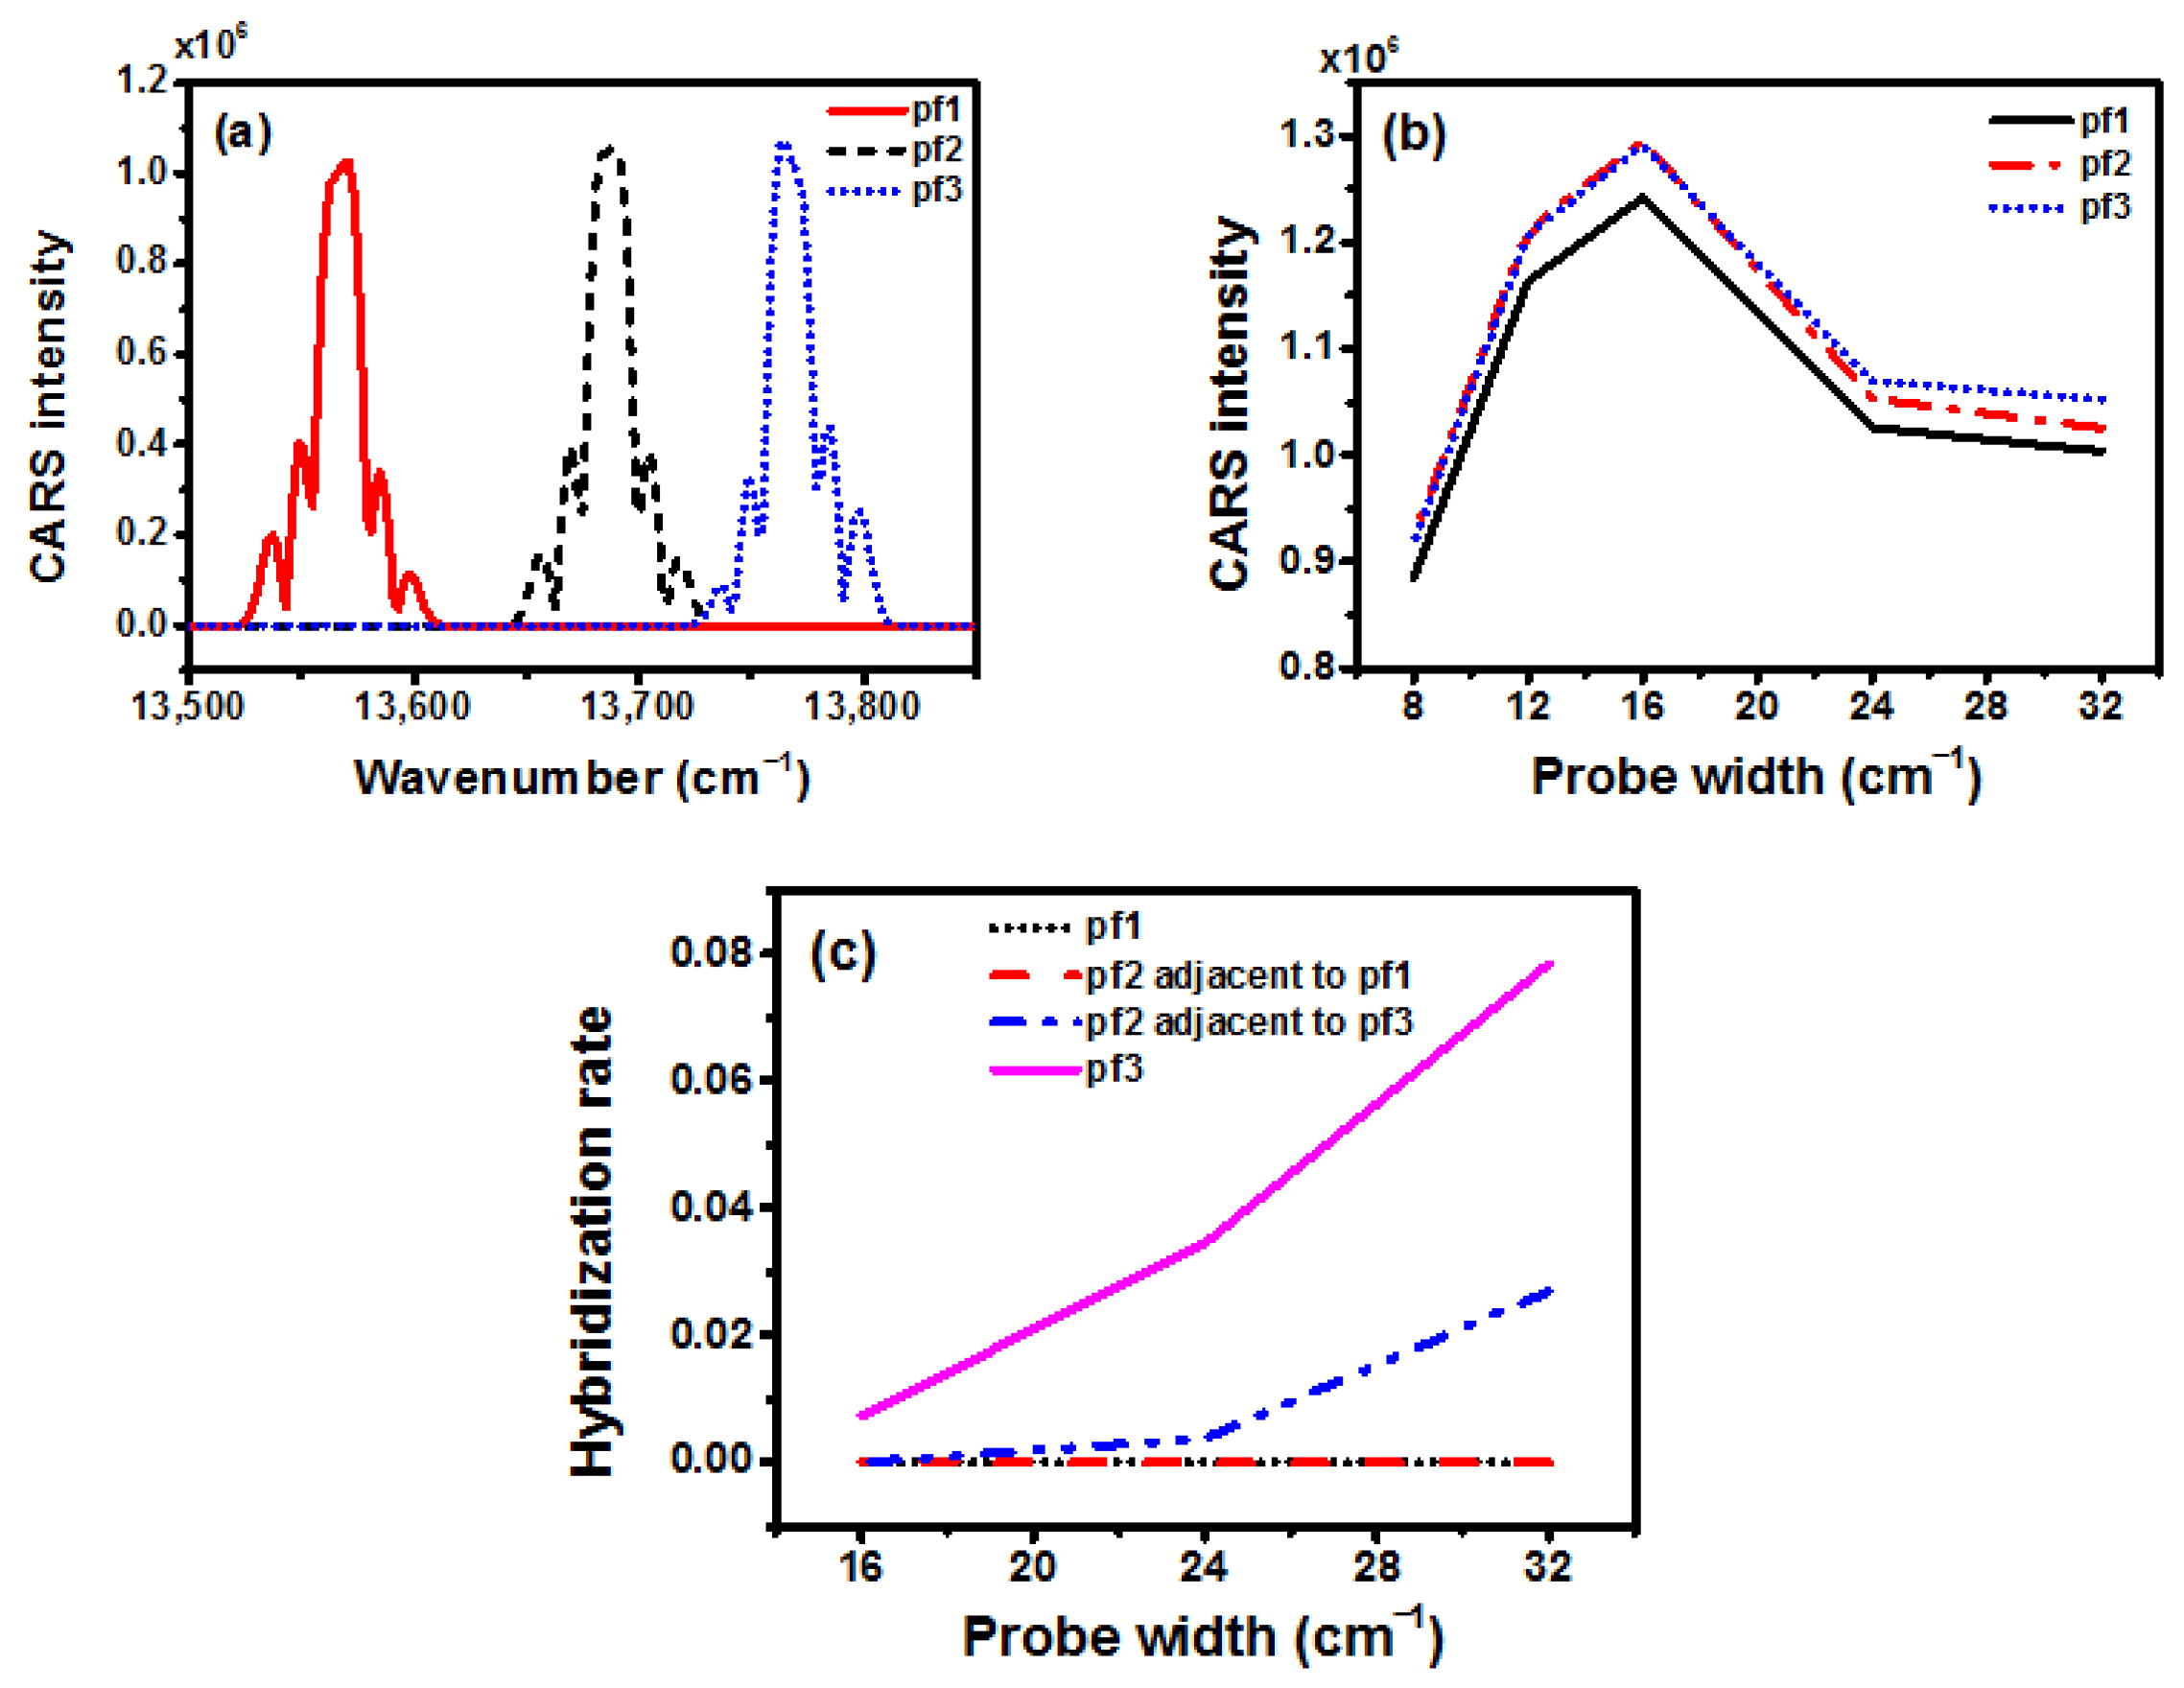
4.3. Selective Excitation of SECARS

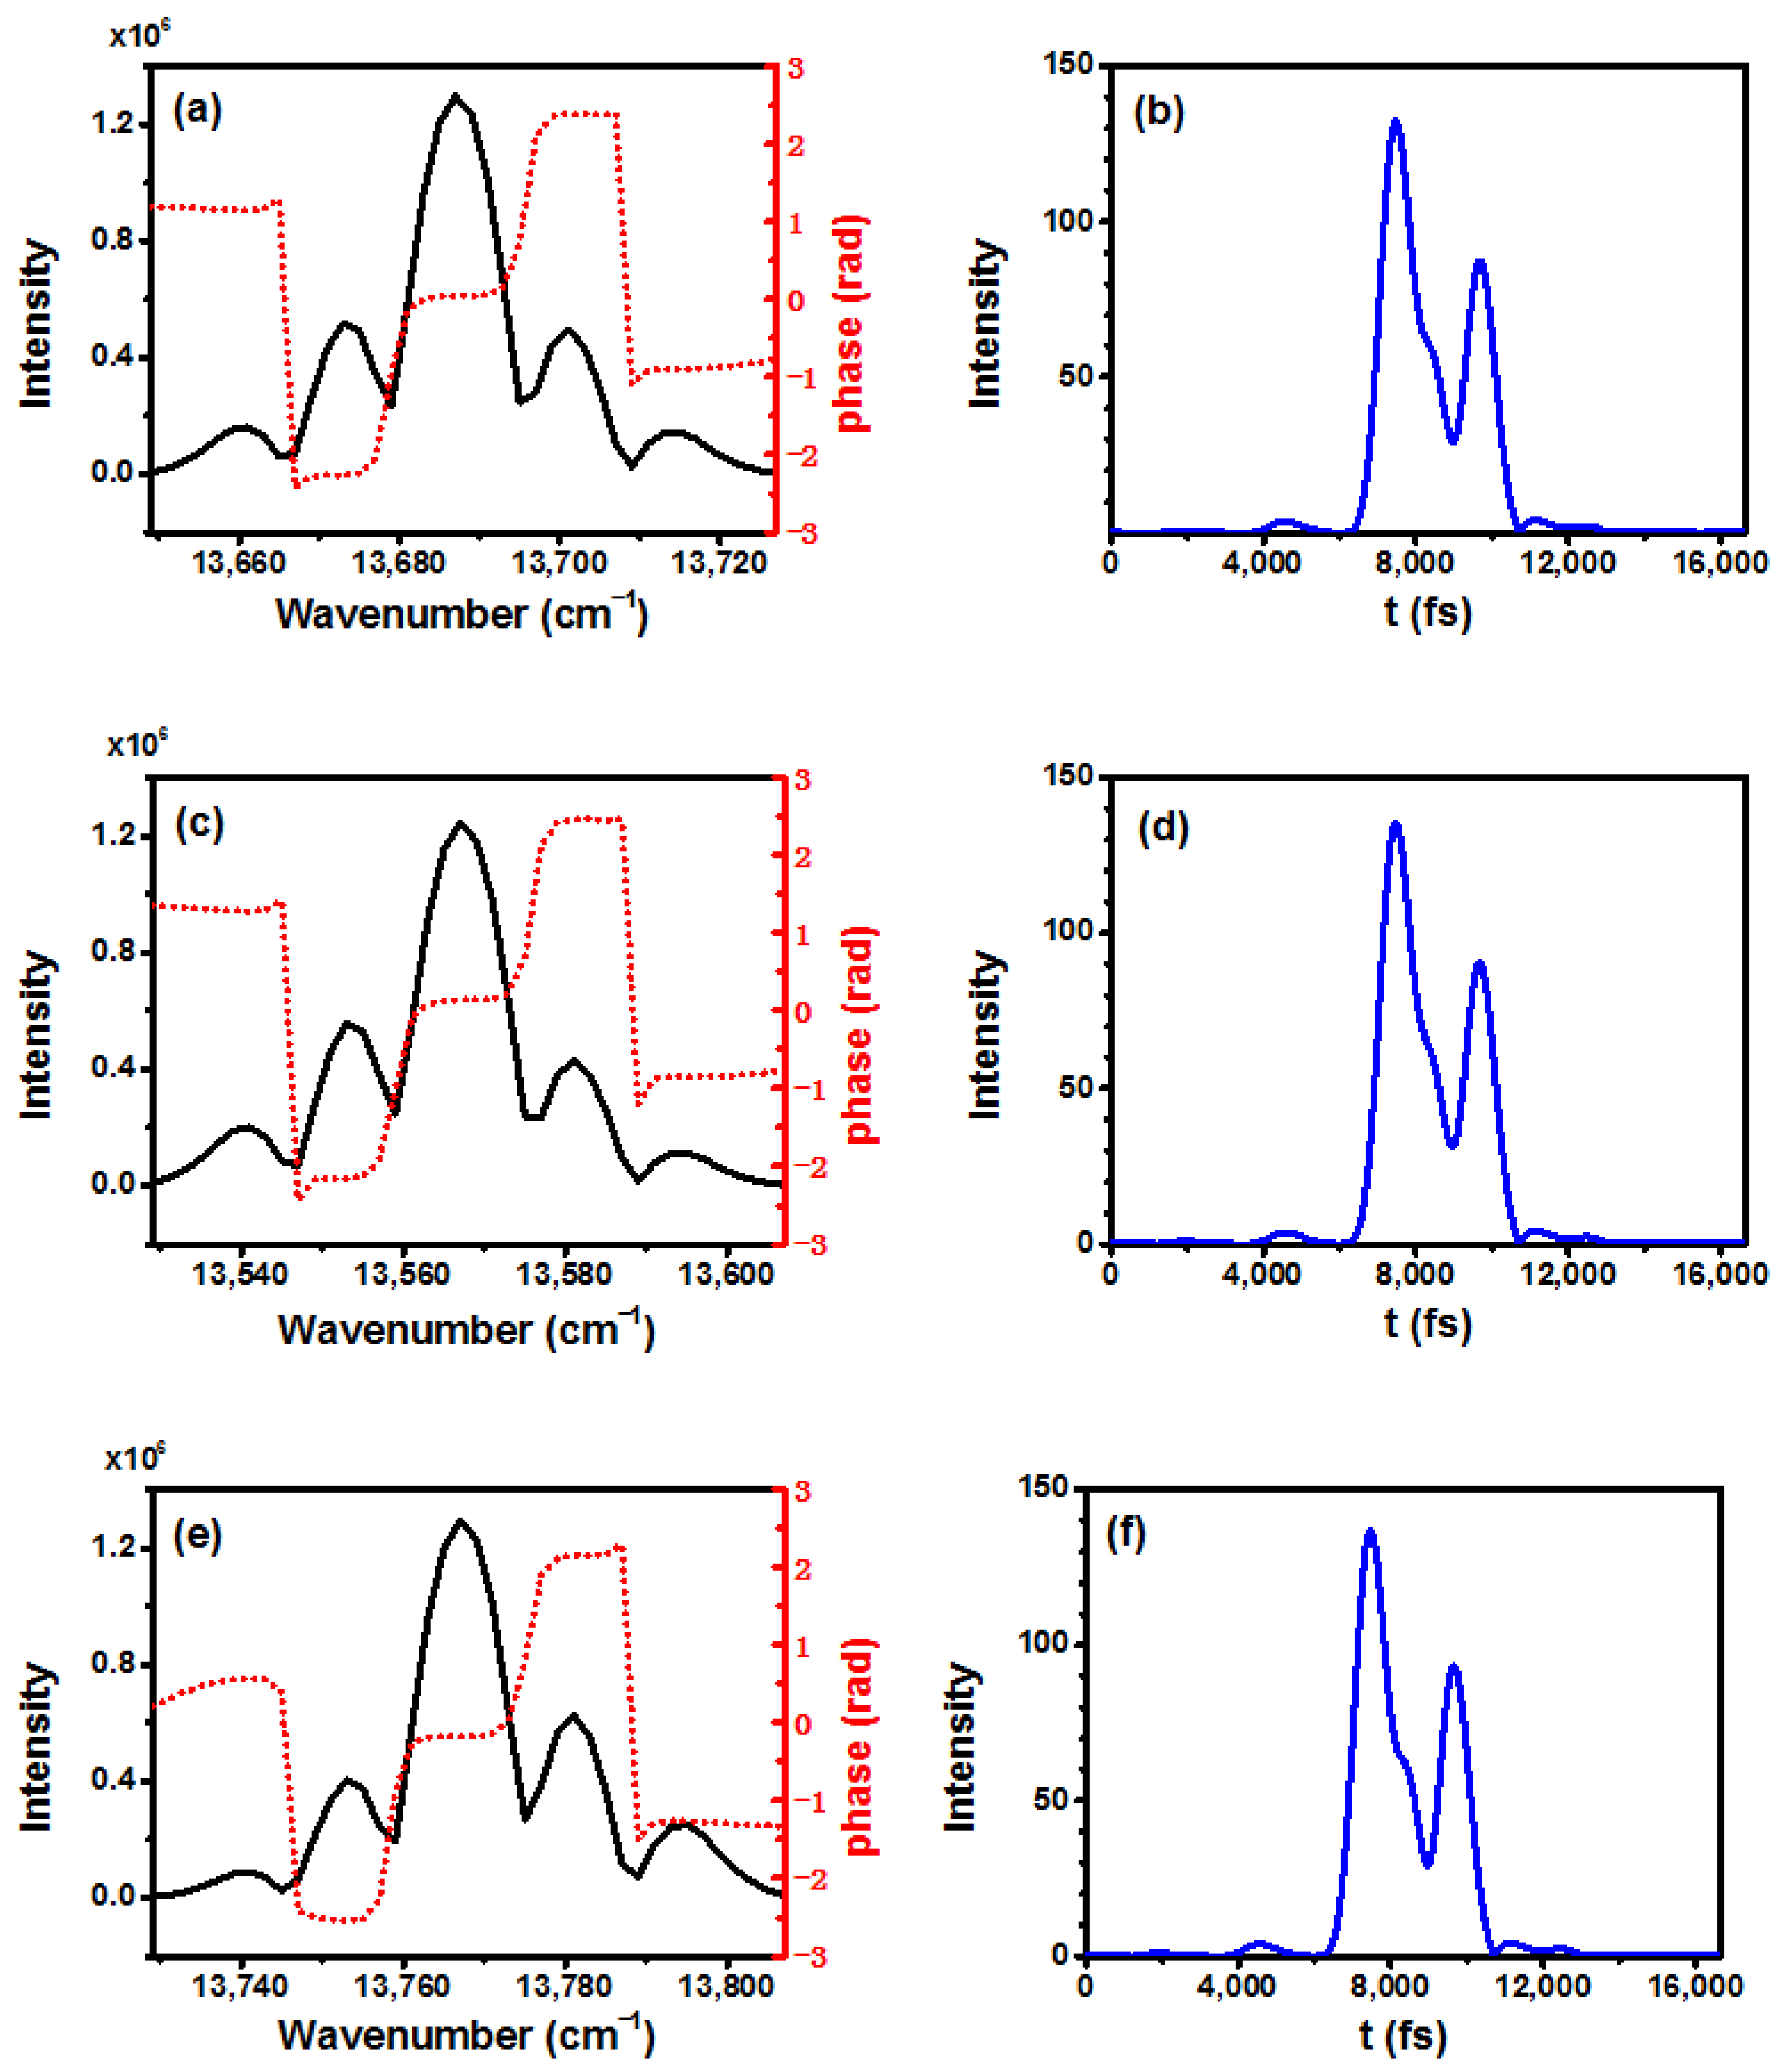
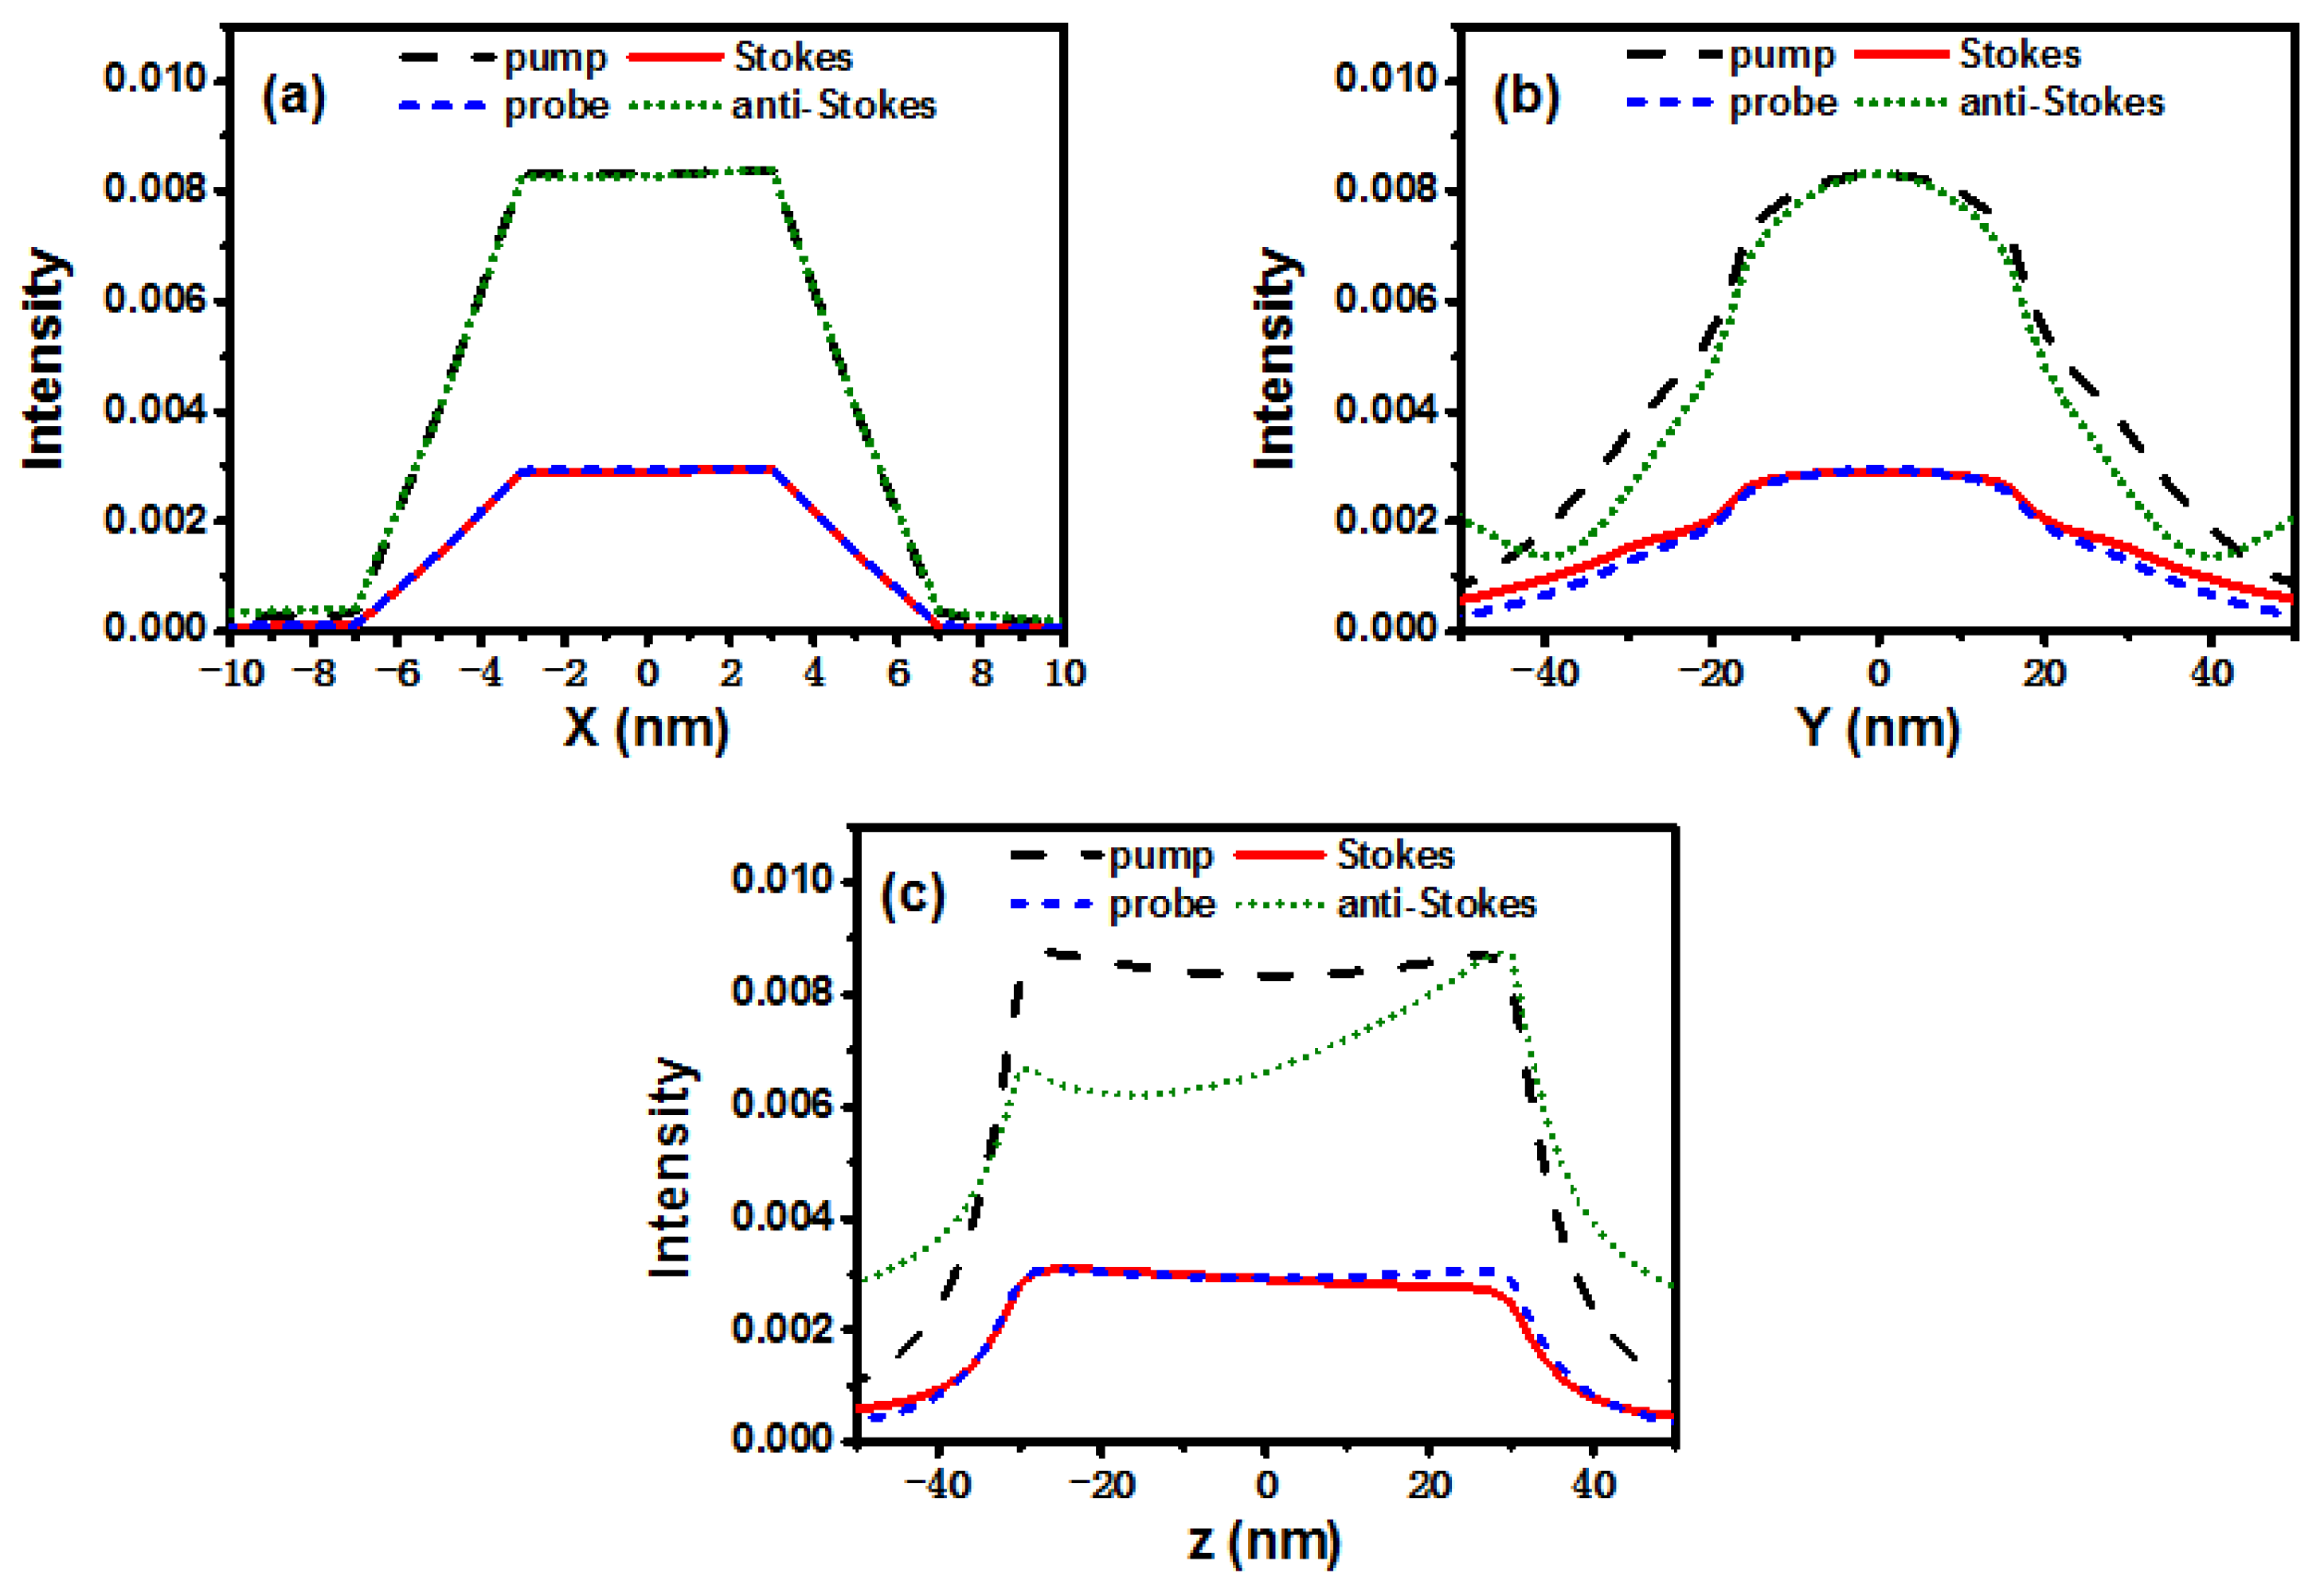
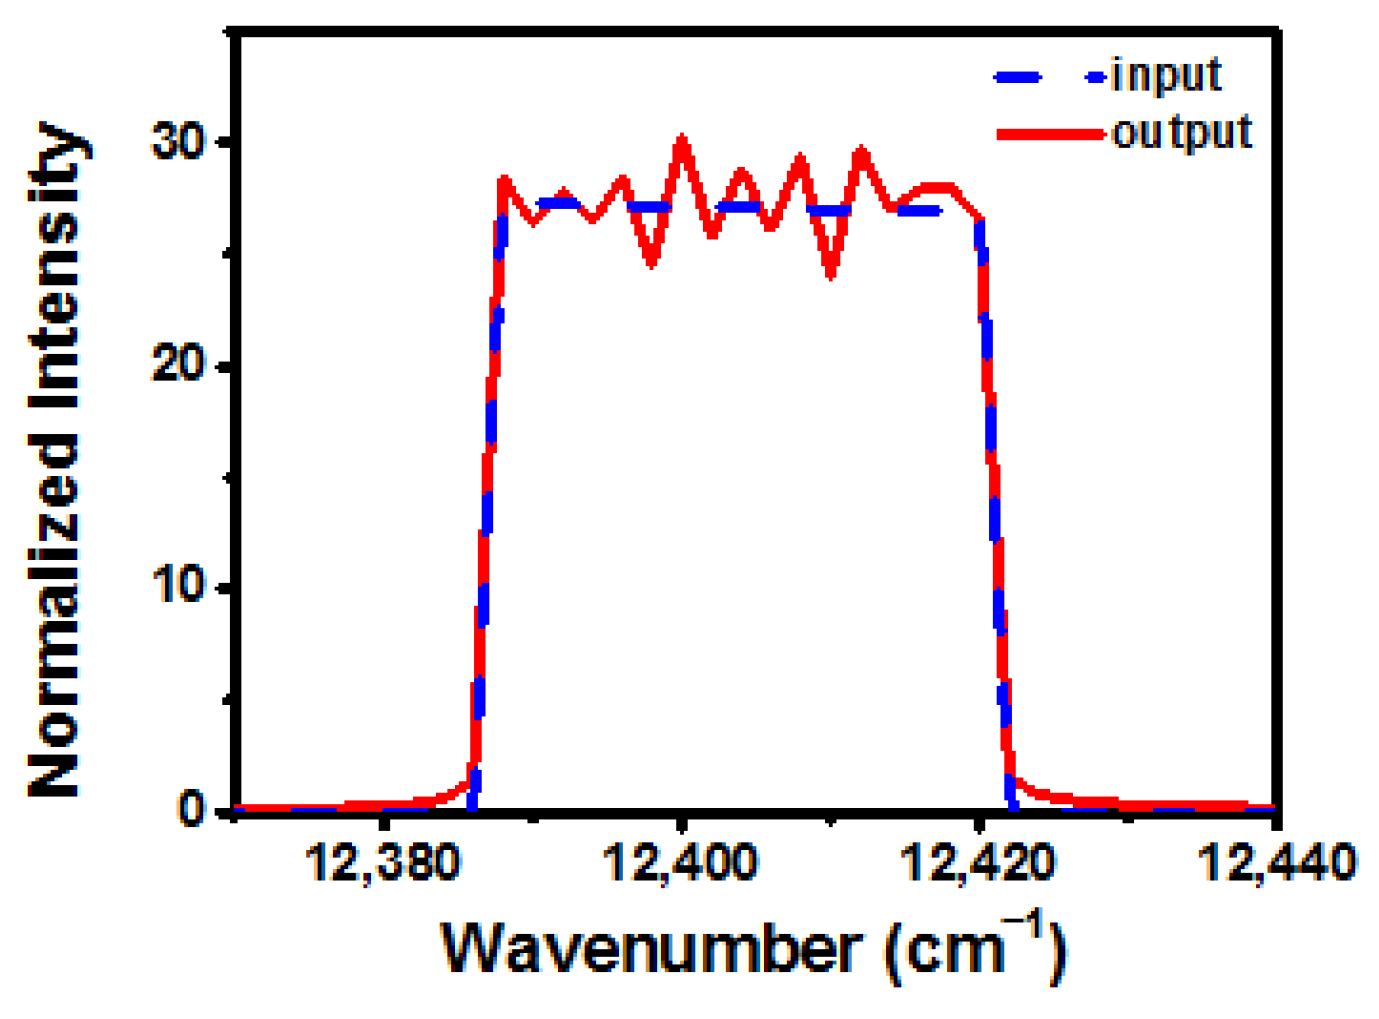
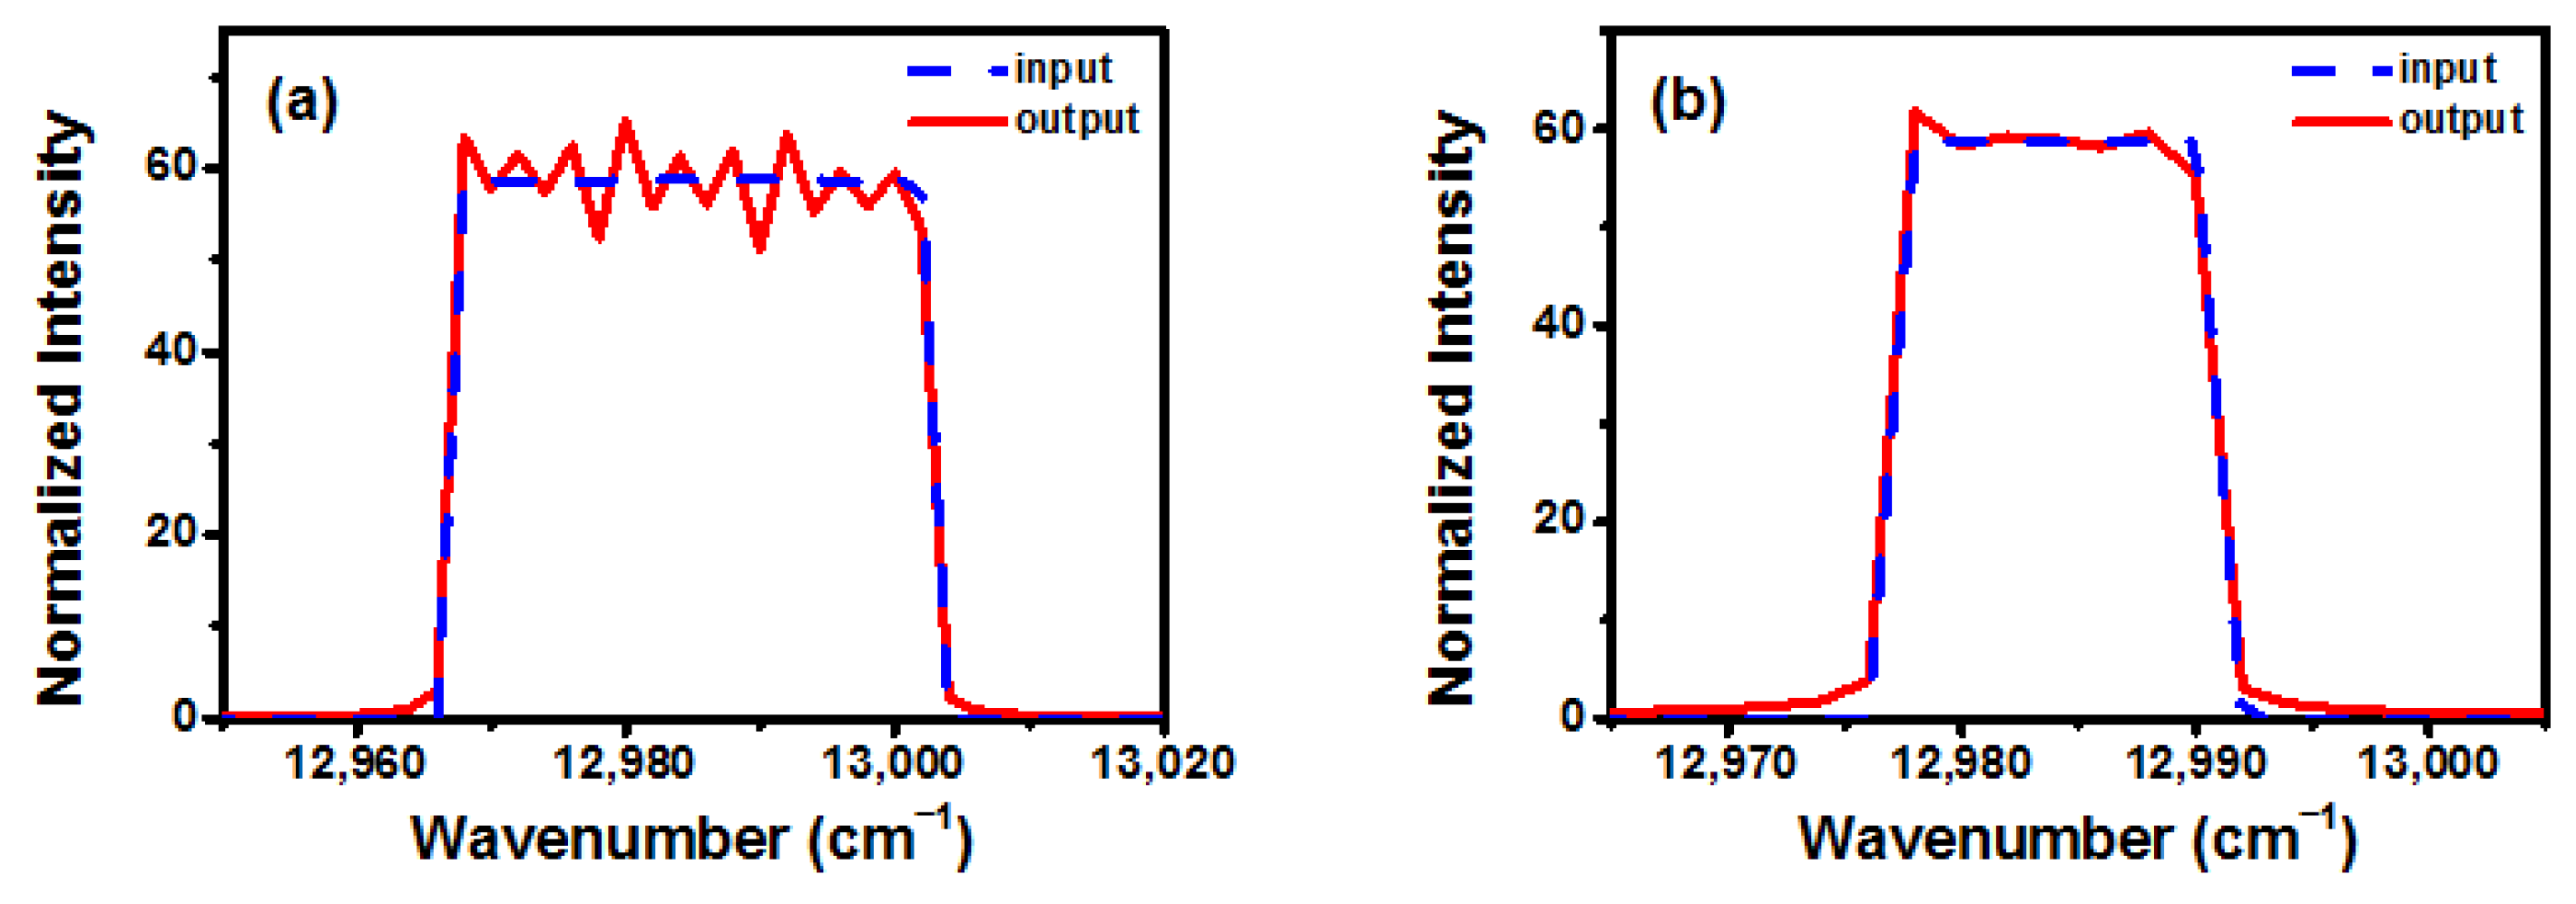
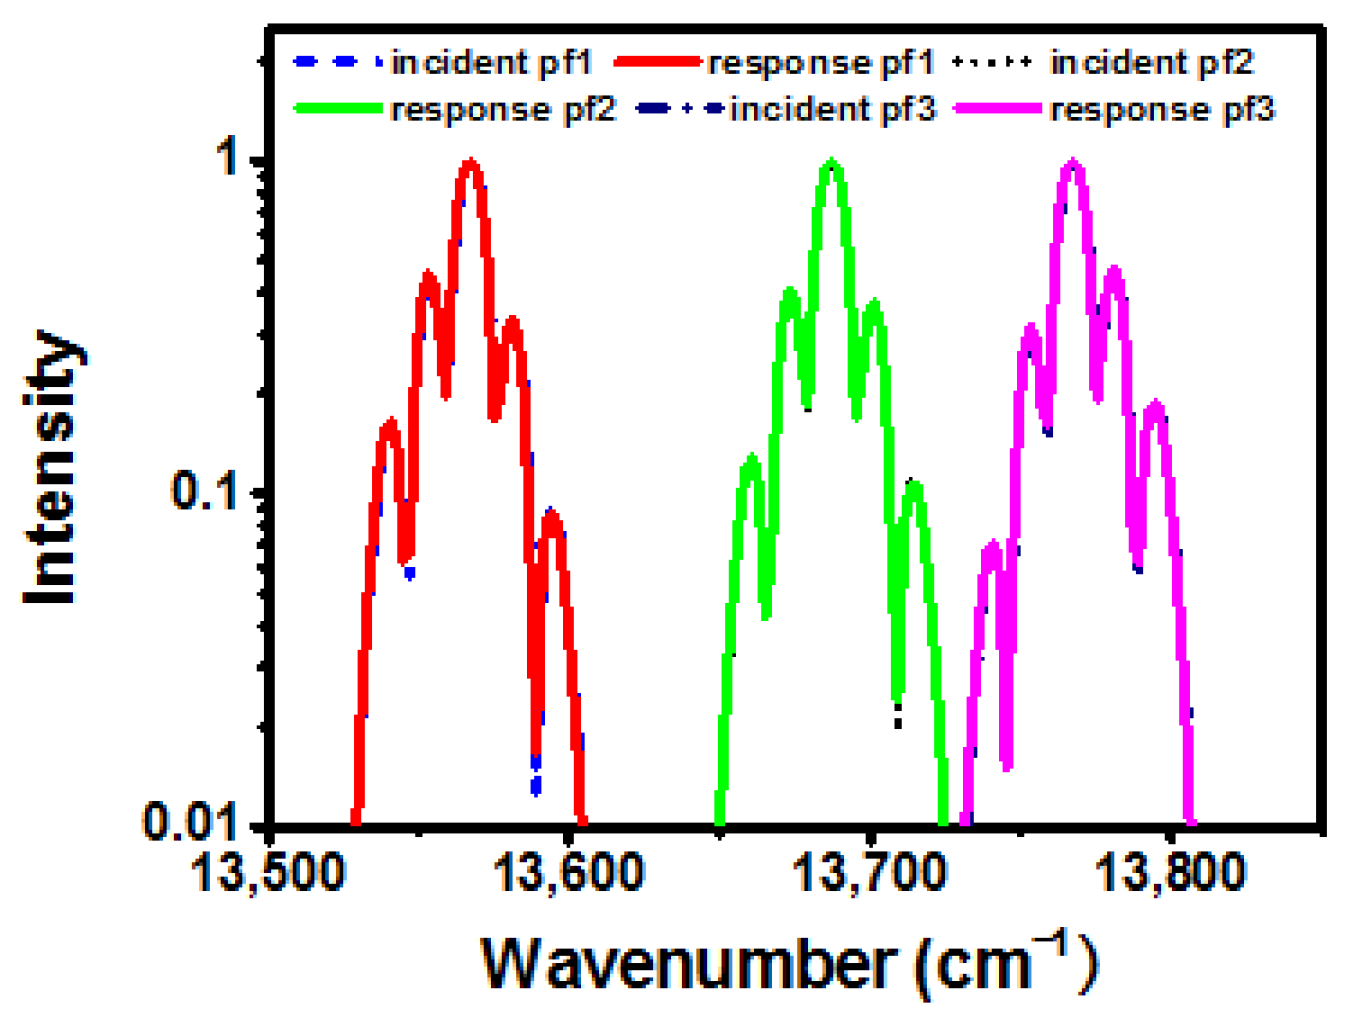
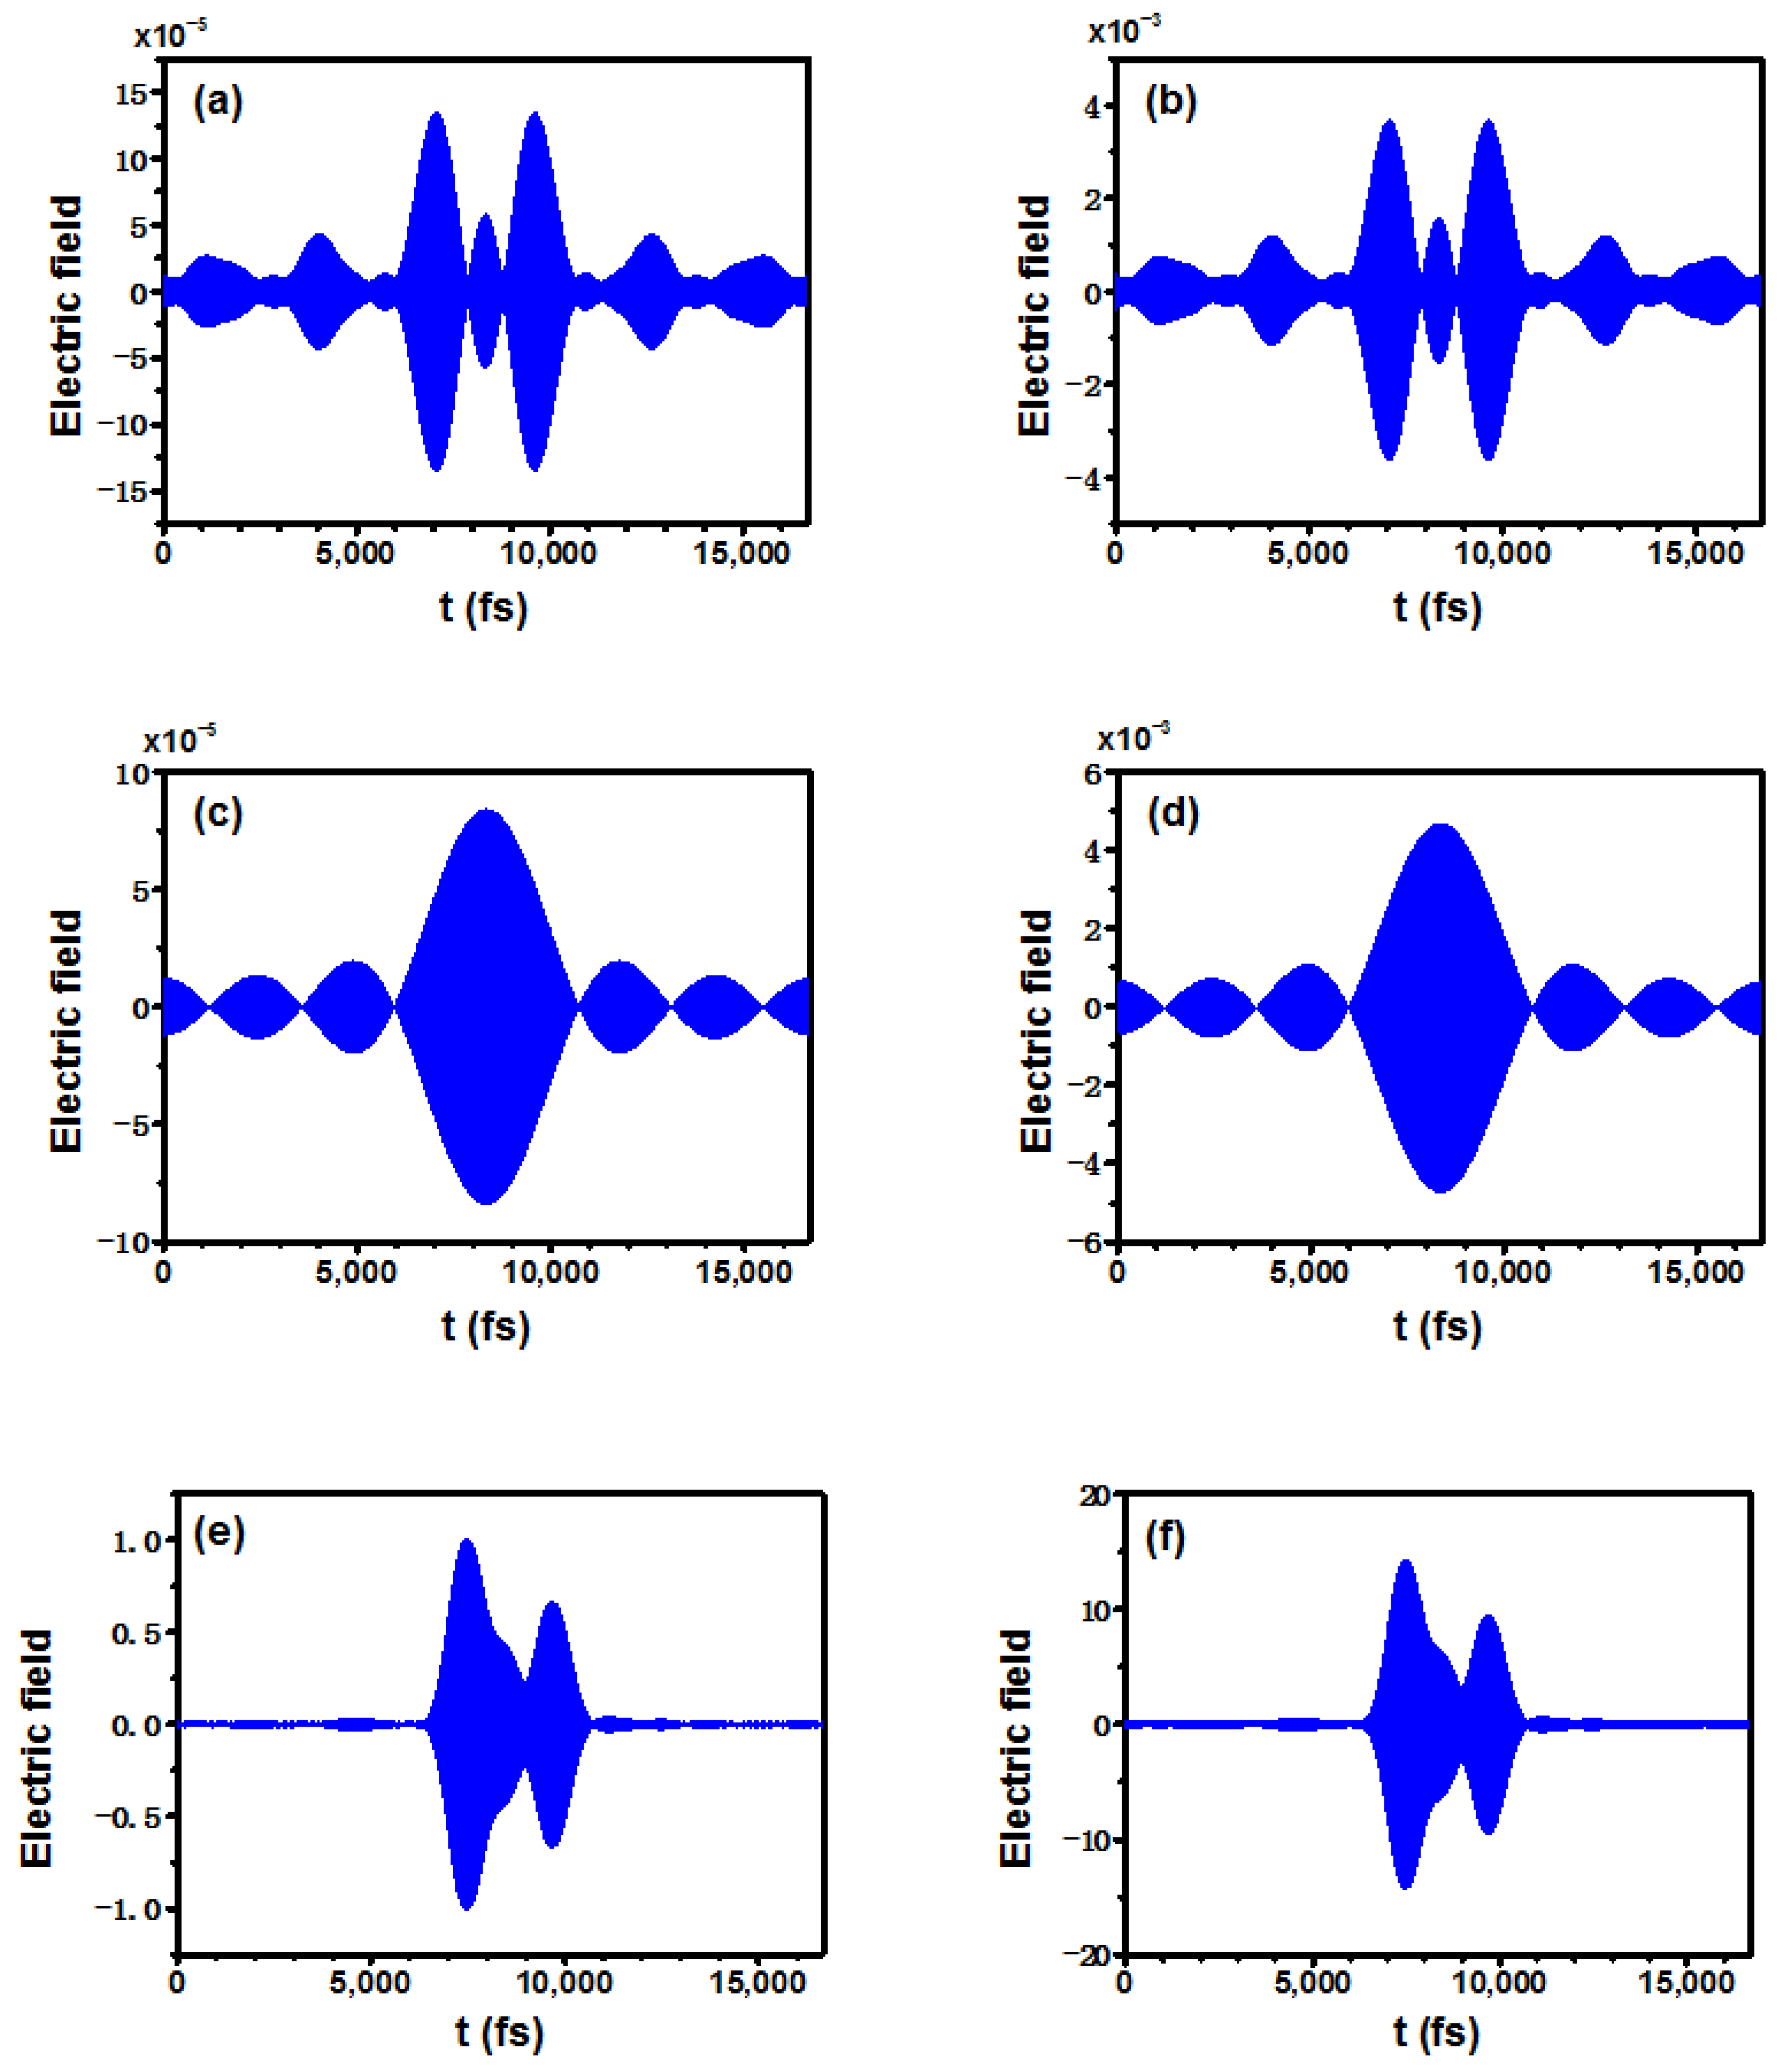
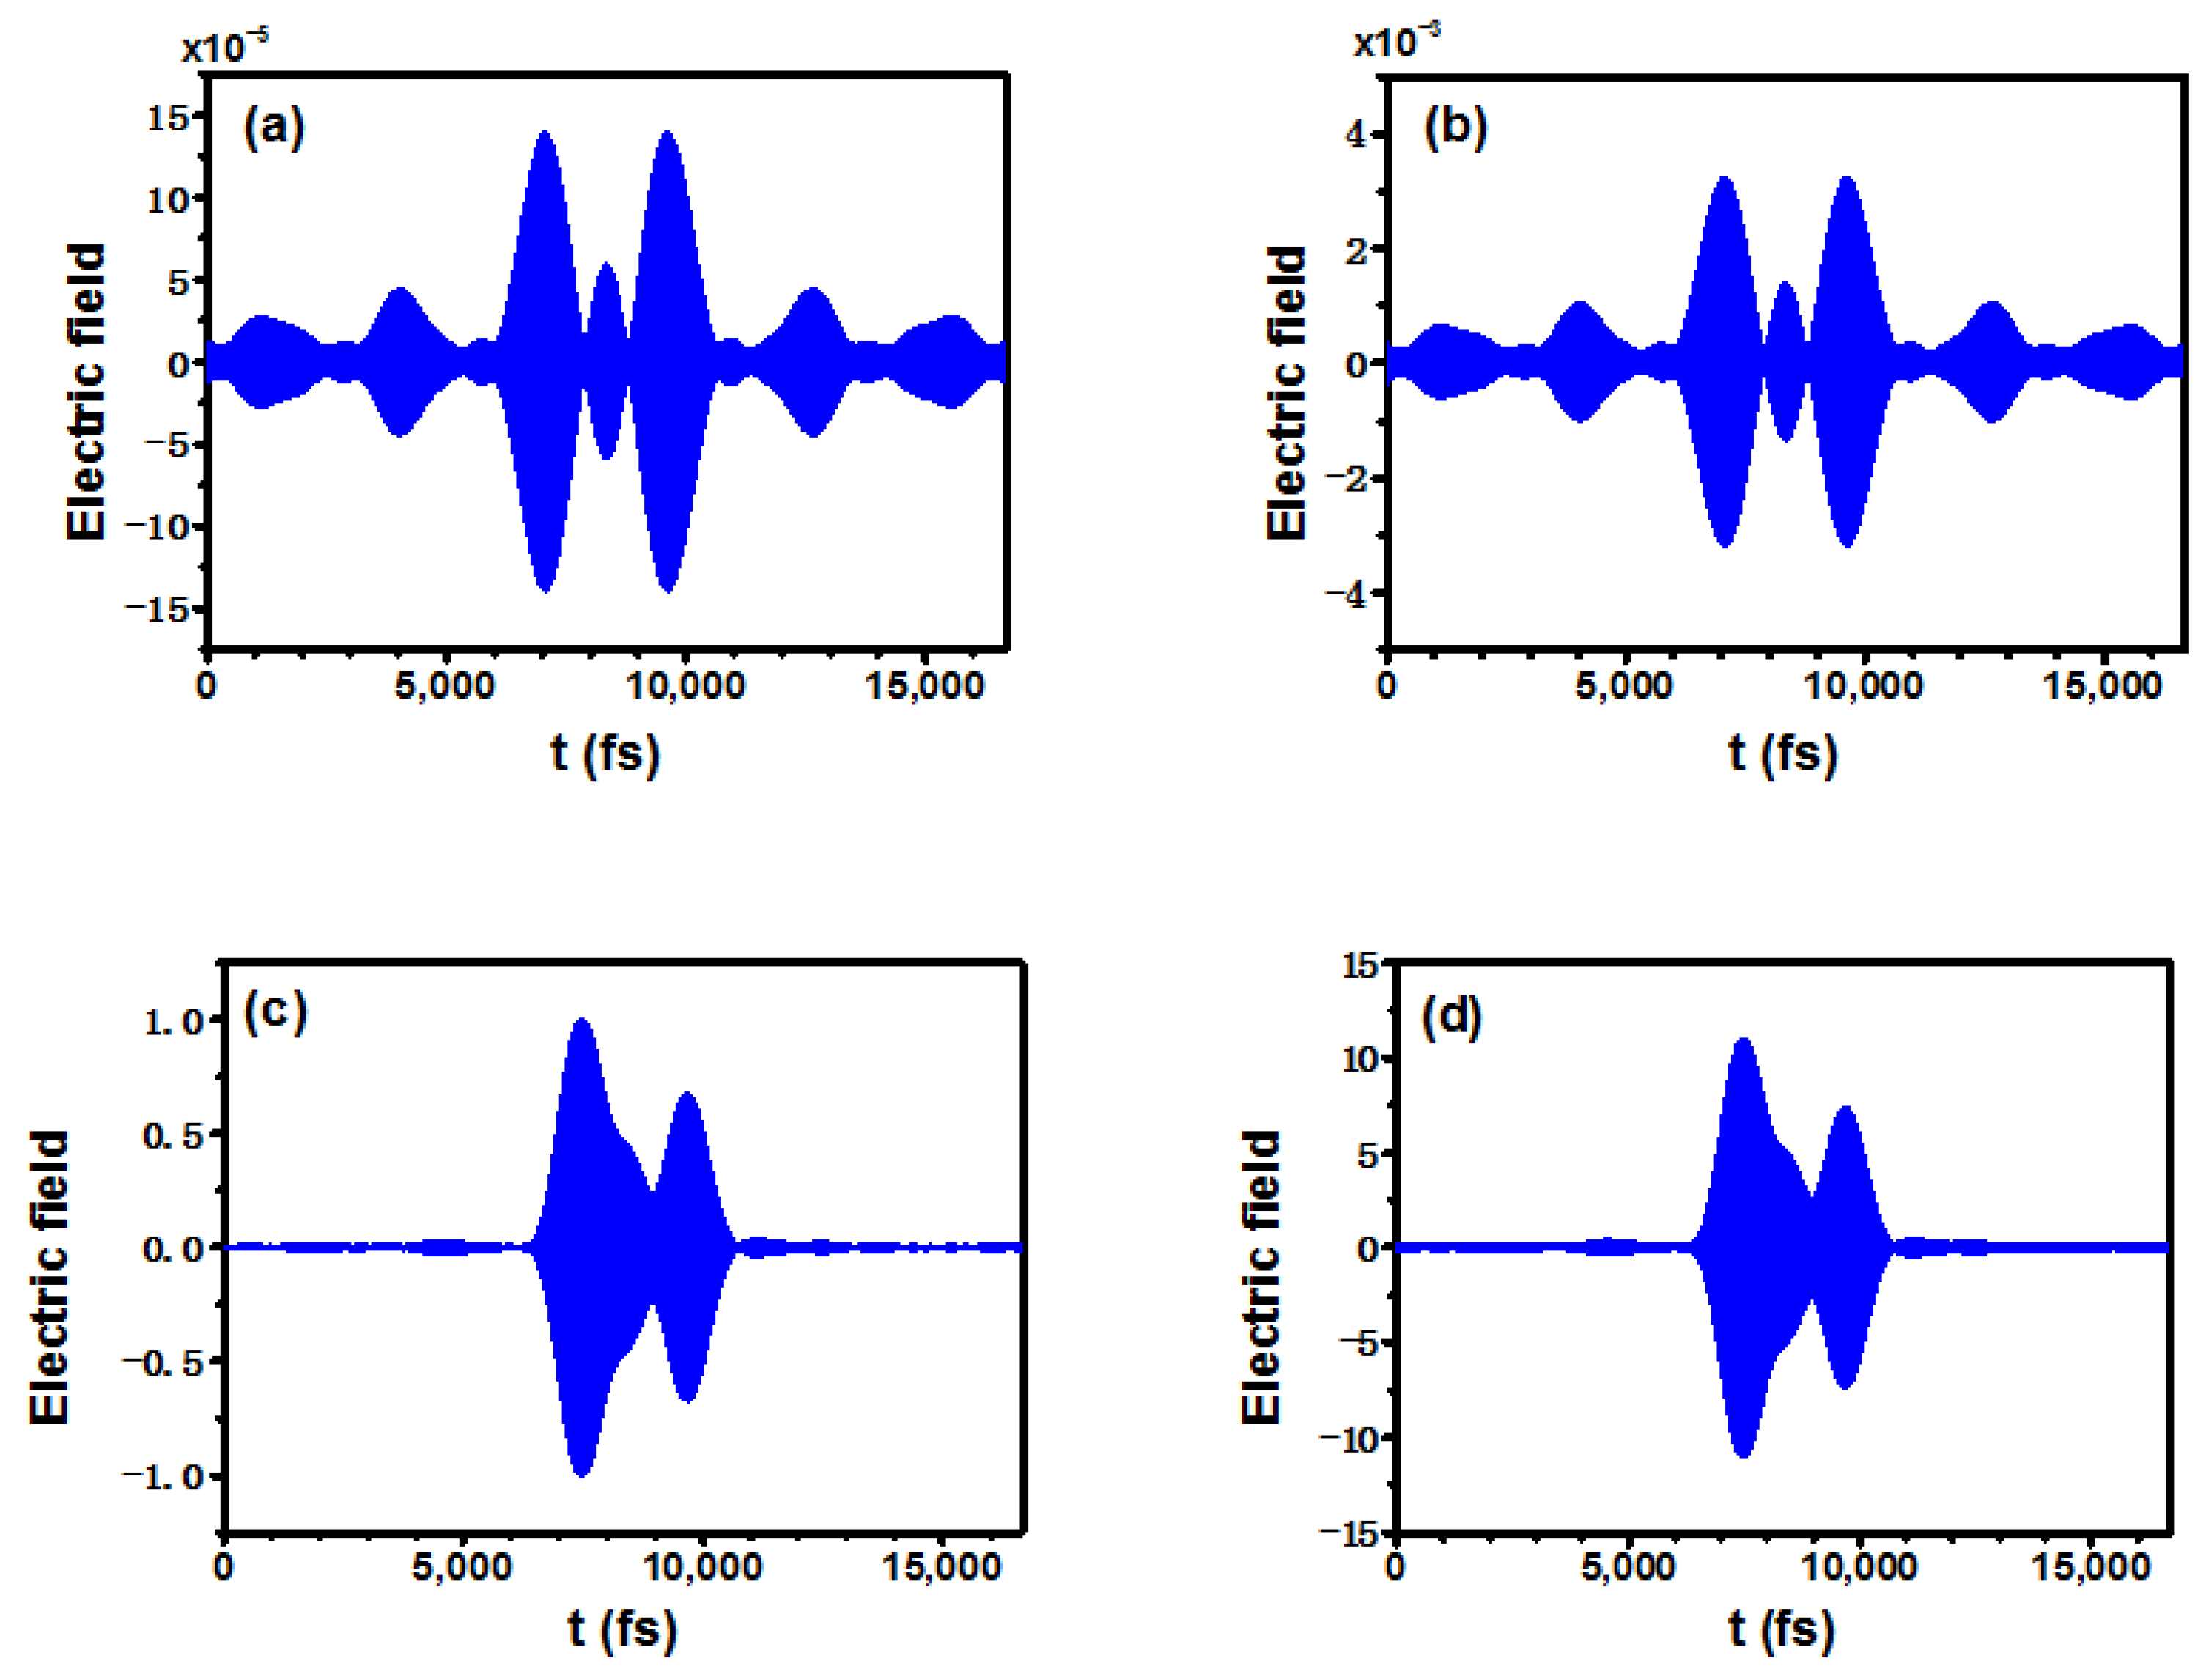
4.3.1. Spectra of the Response Pulses

The spectrum of the response of the pump pulse Eresponse(ω) can be obtained by the Fourier transform [37,38]:
E r e s p o n s e ( ω ) = + f r e s p o n s e ( t ) + i g r e s p o n s e ( t ) e i ω t d t
where fresponse(t) and gresponse(t) are the real and imaginary parts of the response pulse, respectively (as shown in Figure 7). Figure 11 shows that the response spectrum of the pump pulse is similar to the input spectrum, while the intensity is increased by more than 58.7 times. Moreover, there are some oscillations in the response spectrum [16,38]. At the positions of phase inversion of the rectangular π-phase modulation in the range of 12,980–12,990 cm−1, the amplitude of the oscillations is larger than that of the other frequencies. At the two edges where the frequency components were cut off, the spectral intensities also oscillated and widened by nearly 10 cm−1. These results indicate that these oscillations and widenings were caused by sharp changes in the phase and intensity [38]. The response spectrum of the probe pulse is calculated similarly, and the result is shown in Figure 11b. There is no π-phase modulation in the probe pulse, and hence, the spectral intensities change much more smoothly than those of the pump pulse.
The time distribution of the response pulse when the step position of the Stokes light scans to 12,387 cm−1 is shown in Figure A4 of Appendix B. In a similar way to the pump spectrum, the response spectrum of the Stokes pulse was calculated, as shown in Figure 12. The response spectrum of the Stokes pulse is similar to the input spectrum, while the intensity is increased by 28.1 times. In addition, the oscillations and the widening of the response Stokes pulse are similar to those of the response pump pulse [38]. The cases when the step position of the Stokes light scans to 12,267 cm−1 and 12,187 cm−1 are the same, and do not repeat.

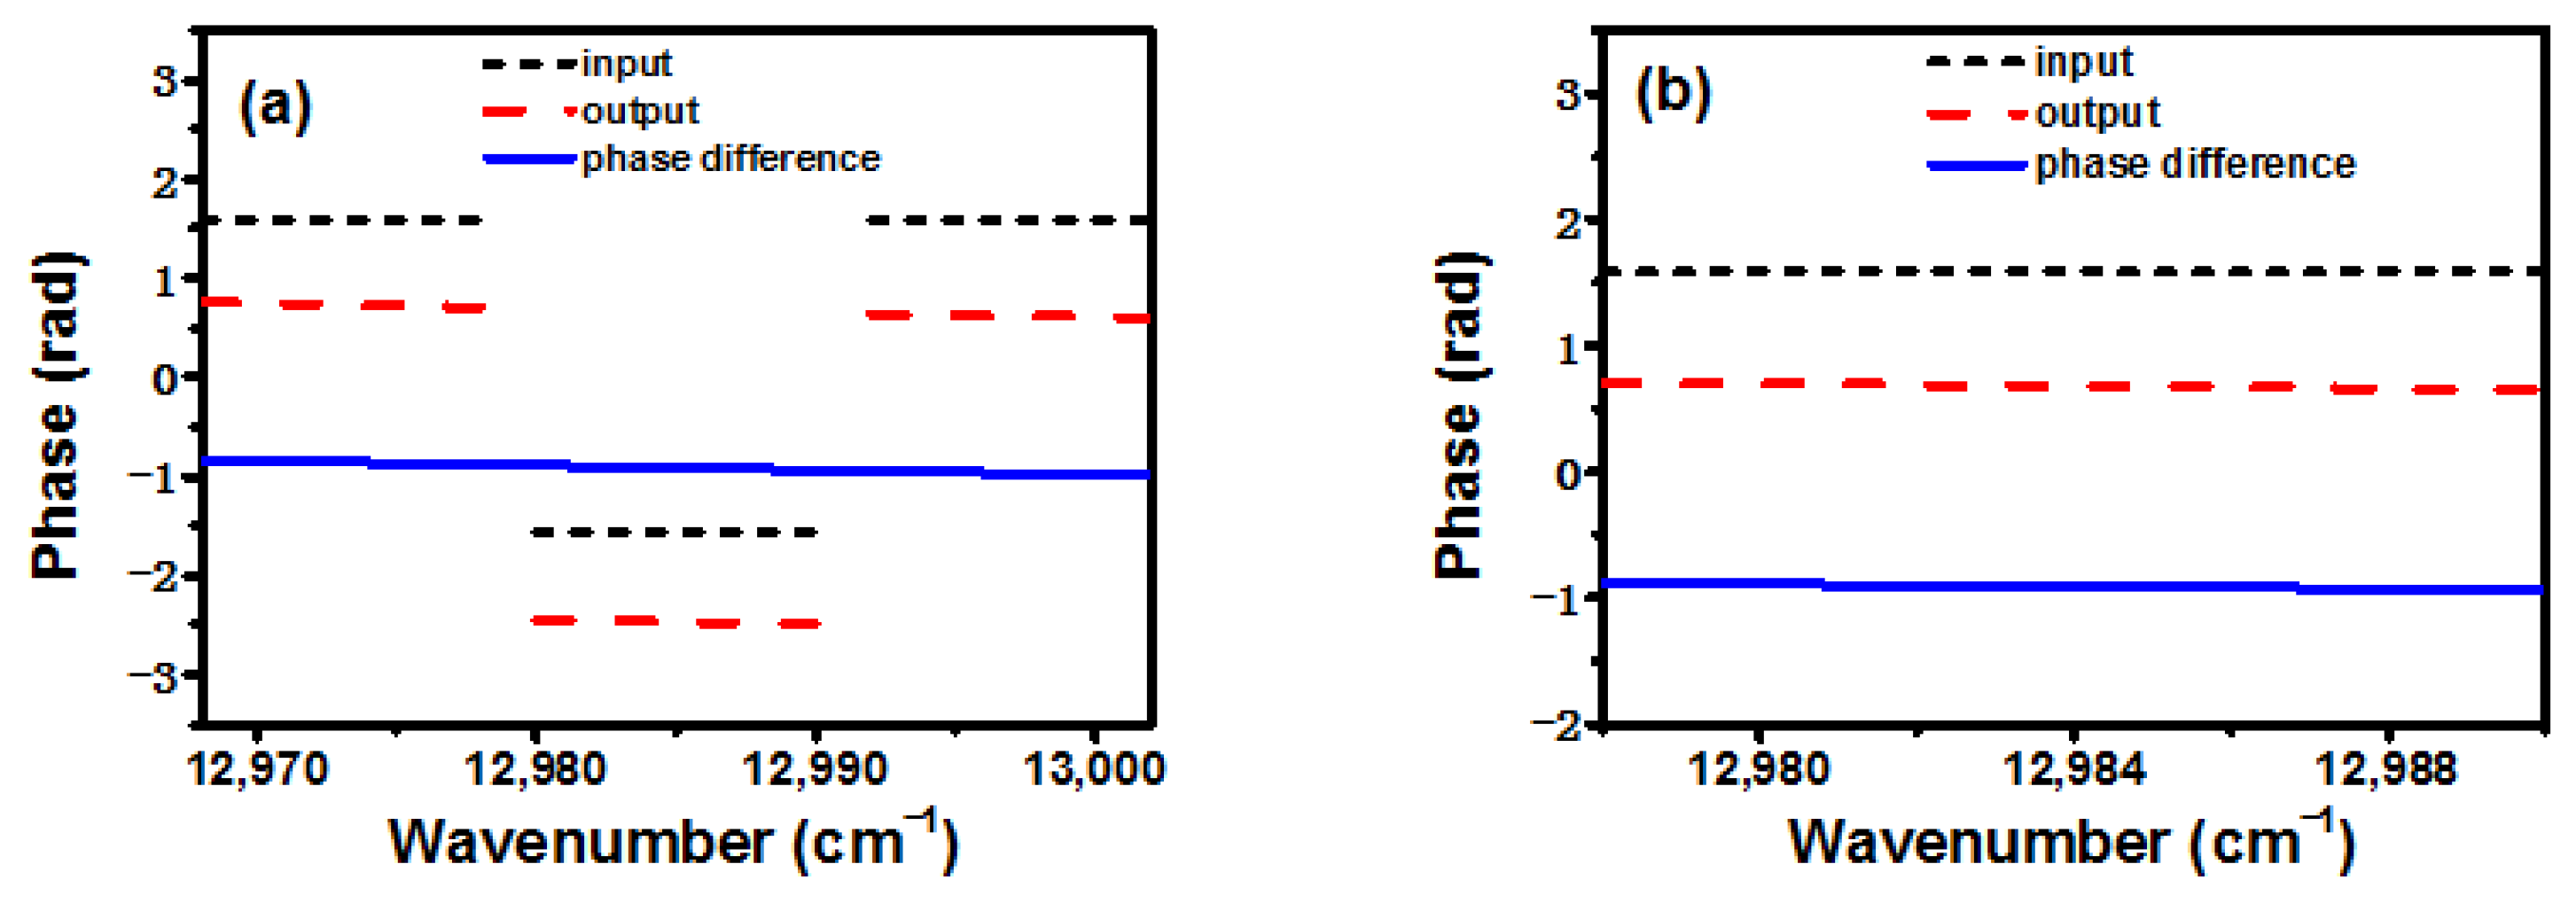
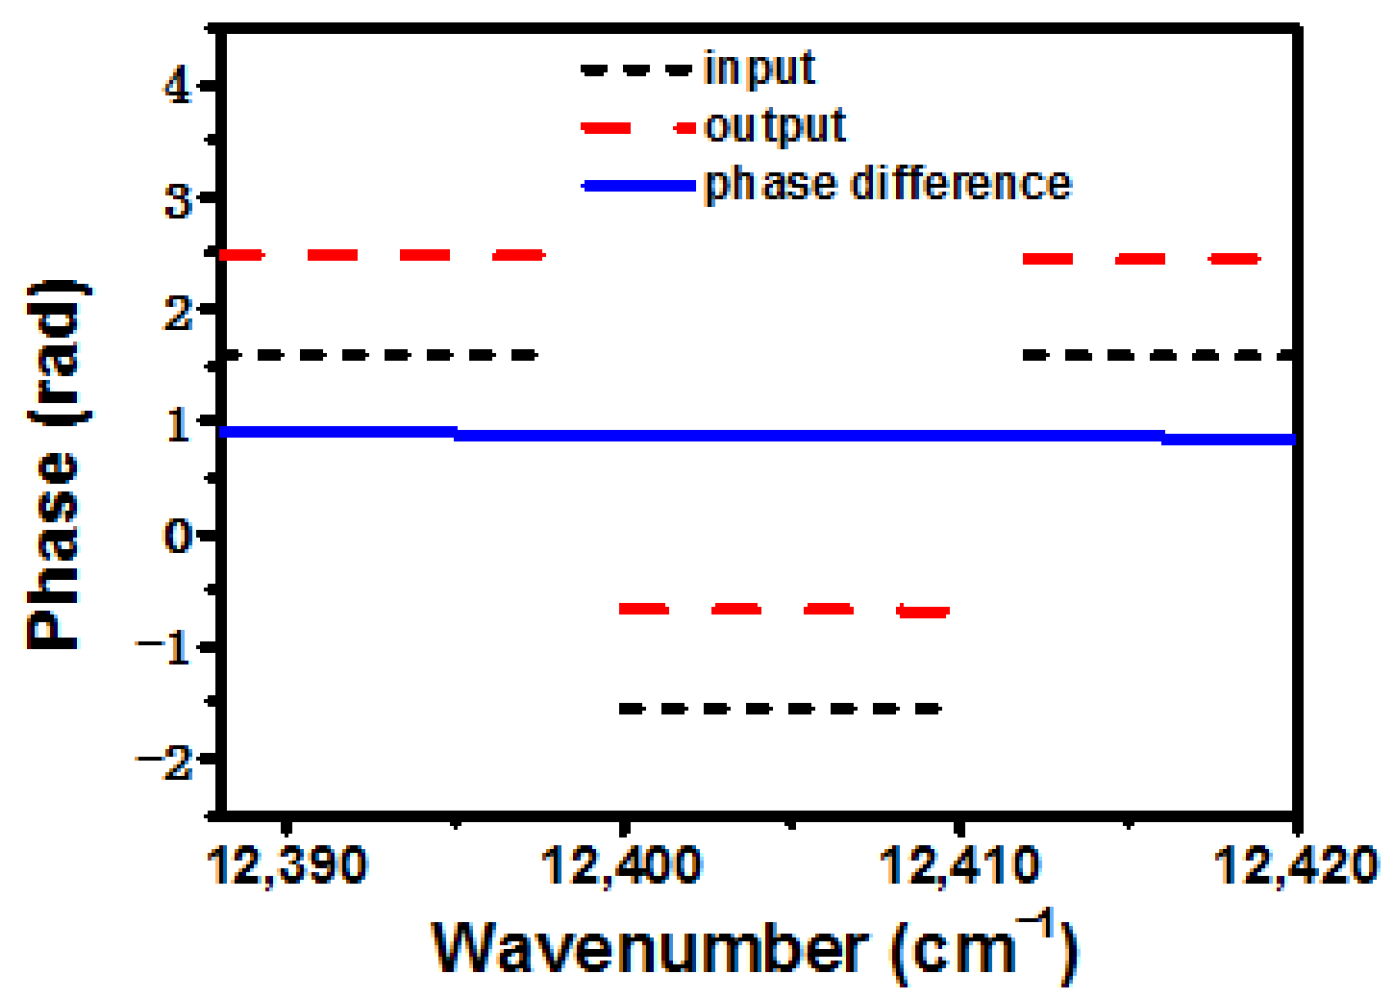
4.3.2. Phase of the Response Pulses

The phase difference ϕimpulse(ω) between the input and the response can be calculated according to the following equation [68,81].
φ i m p u l s e ( ω ) = arg [ E r e s p o n s e ( ω ) E i n p u t ( ω ) ] = φ r e s p o n s e ( ω ) φ i n p u t ( ω )
where ϕresponse(ω) is the phase of the response pulse of the disk-ring structure, and ϕinput(ω) is the phase of the input pulse after pulse shaping.
The phase and phase difference of the input and the response of the pump pulse were calculated and are shown in Figure 13. The phase difference is −0.83 rad at 12,968 cm−1 and −0.99 rad at 13,002 cm−1. In addition to the steady phase shift, the phase of the response pulse is highly similar to that of the input pulse, and the phase shift fluctuates slightly with the wavenumber. Furthermore, the phases of the input and the response pulses are reversed because of the π-phase modulation in the range of 12,980–12,990 cm−1 [37,38]. The phases of the input and the response of the probe pulse are similarly calculated, as shown in Figure 13b. As expected, the phase of the response pulse is very similar to that of the input pulse, except for the steady phase shift of −0.91 rad.
Figure 14 shows the phases of the input and the response of the Stokes pulse when the step position of the Stokes light scans to 12,387 cm−1. Similar to the case of the pump pulse, the phase of the Stokes response pulse is highly similar to that of the input Stokes pulse, except for the steady phase shift of 0.9 rad. In addition, the phases of the input and response pulses are also reversed because of the phase modulation in the range of 12,400–12,410 cm−1. The cases when the step position of the Stokes light scans to 12,267 cm−1 and 12,187 cm−1 are the same.
The above results indicate that although the amplitudes of the pump, Stokes, and probe pulses increase greatly, they do not affect the relative phase of each frequency component. It does not change significantly [37,38].

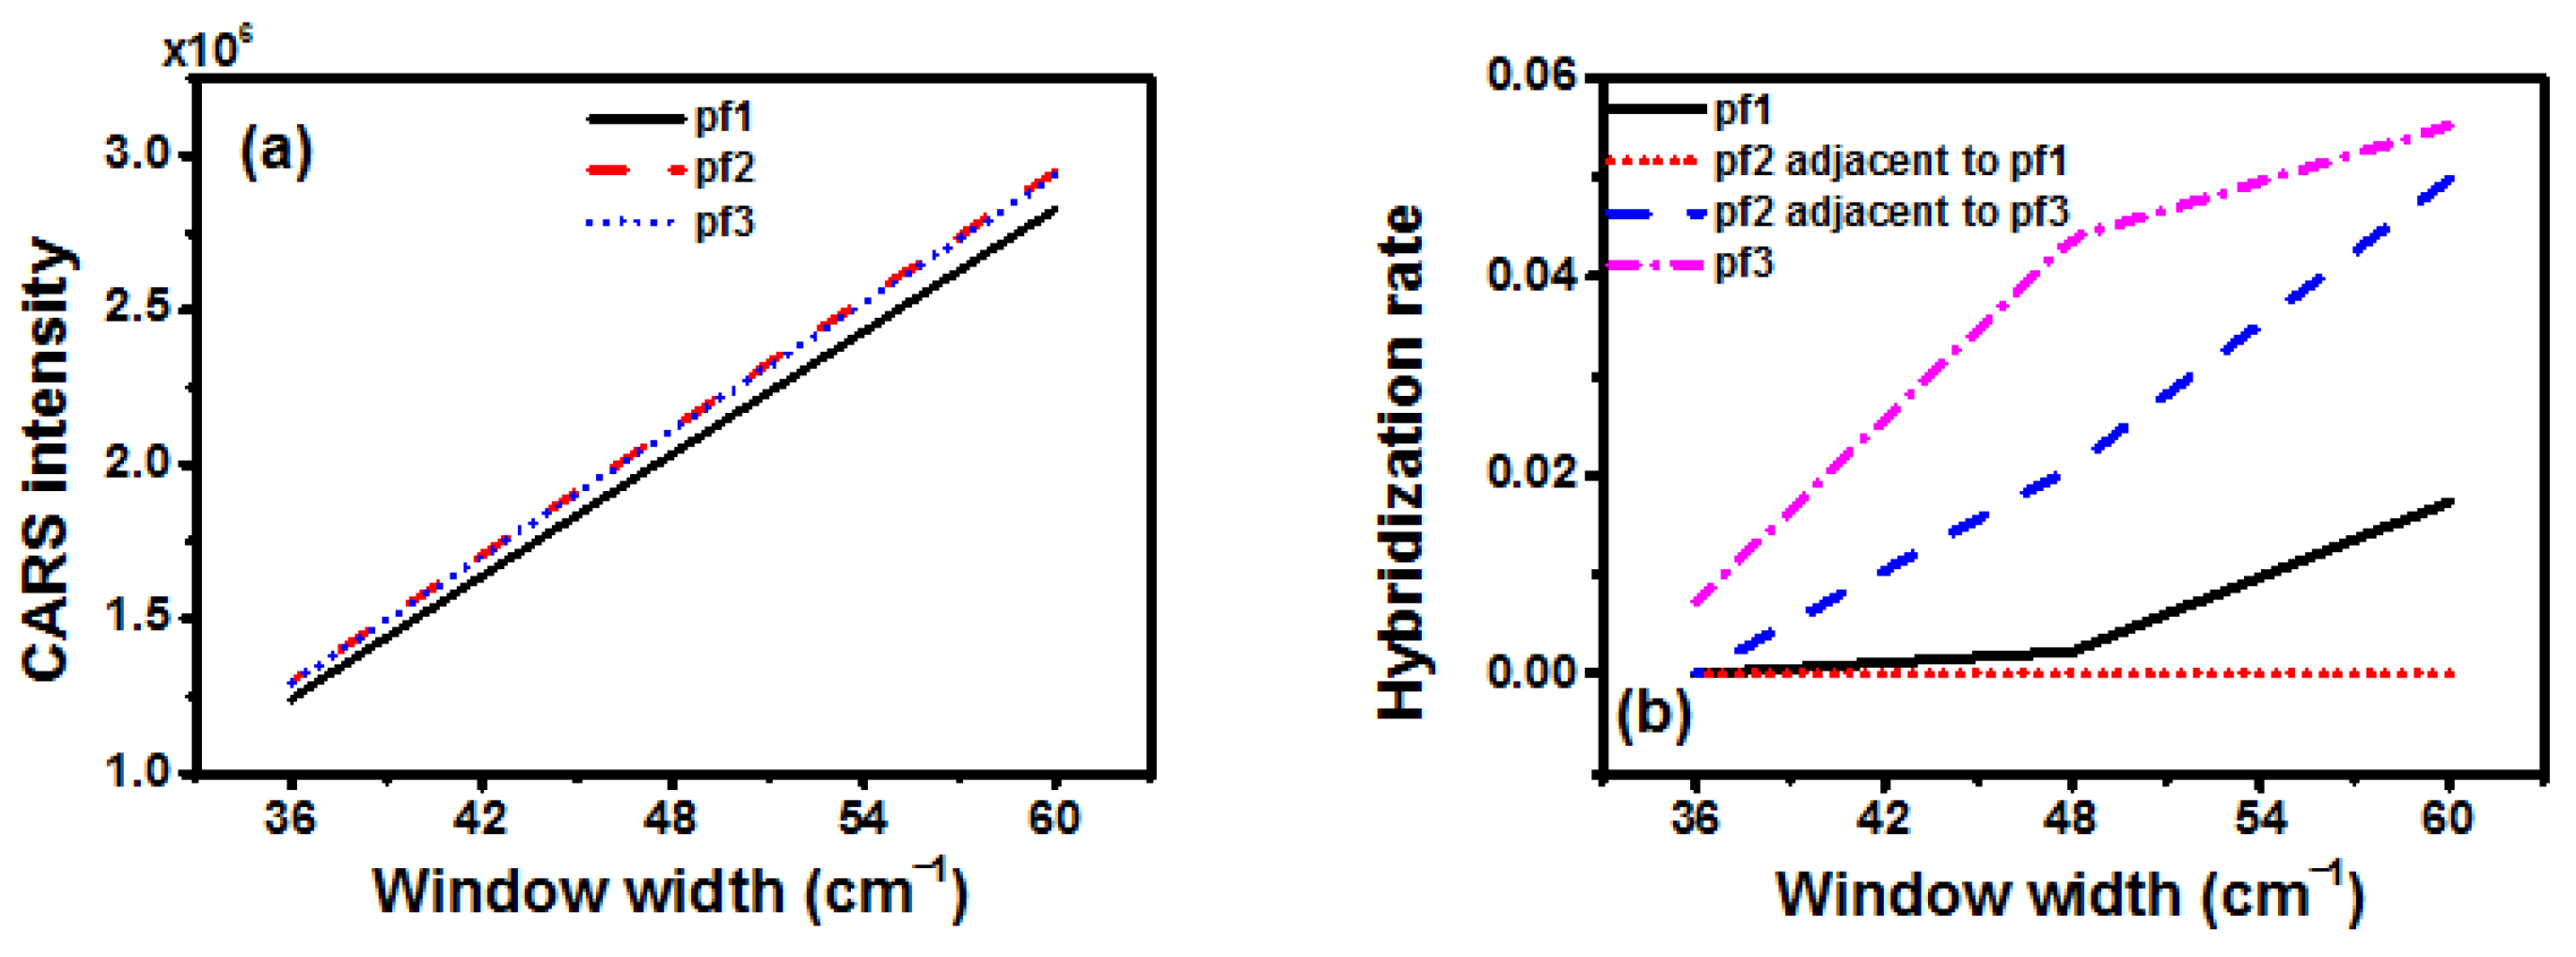
4.3.3. Selectivity of SECARS and the Fidelity of Spectra

When the step position of the Stokes pulse scans to 12,387 cm−1, as shown in Figure 4a, the Raman transition pf1 is excited, while the transition probabilities of pf2 and pf3 are both zero. The SECARS spectrum of pf1 is shown by the red solid line in Figure 15. The intensity reaches a maximum at 13,567 cm−1, and those in the range of 13,605–13,850 cm−1 are less than 1% of the peak value, and the hybridization rate is 0. The result indicates that the enhancement and the selection of one CARS peak among the three peaks are realized simultaneously. Moreover, the spectrum of the SECARS peak is nearly identical to that of the CARS peak. Although the response spectra of the pump, Stokes, and probe pulses oscillate and widen, the selective excitation of one SECARS peak among the three remains, which is induced by the unchanged relative phase response among the frequency components and the integral effect of the product of the corresponding spectral components of the three pulses in Equation (2) [38].
When the step position scans to 12,267 cm−1, the Raman transition pf2 is excited and the other two peaks are suppressed to zero. Accordingly, the SECARS intensity reaches a maximum at 13,687 cm−1, while the intensity is less than 1% of the maximum in the range of 13,500–13,649 cm−1 and 13,725–13,850 cm−1, and the hybridization rate is 0. When the step position scans to 12,187 cm−1, the Raman transition pf3 is fully excited, and the other two peaks are suppressed to zero. The SECARS intensity is maximal at 13,767 cm−1, while the intensity is less than 1% of the maximum in the range of 13,500–13,731 cm−1, and the hybridization rate is 0.
In brief, the ultrafast coherent control and the selective excitation of CARS peaks and the spectra in air are both perfectly maintained in the SECARS enhanced by the Fano resonance of the disk-ring nanostructure, and the detection accuracy and controllability are greatly improved.
Suppressing the non-resonant background noise is one challenge of enhancing the sensitivity of CARS signals. As shown in Figure 4, if there is only spectral cutting of the probe light, the noise caused by the adjacent CARS peaks between pf1 and pf2 is about 7%, and that between pf2 and pf3 is about 15%. With coherent modulation of the pump and Stokes lights, the noise caused by the adjacent CARS peaks between pf1 and pf2 is less than 1%, and that between pf2 and pf3 is less than 2%. Figure 15 shows that the noise is basically the same after Fano resonance enhancement.

5. Conclusions

In summary, the advantages of pulse shaping and Fano resonance enhancement are combined, and a scheme for controlling the selective excitation and enhancement of any one of the three CARS peaks based on the Fano resonance of a disk-ring structure is presented by shaping the femtosecond laser pulses. A four-level system with three Raman shifts of 580, 700, and 780 cm−1 with a width of 10 cm−1 was chosen as the target molecule. The central frequencies of the pump, probe, and Stokes laser were at 12,987, 12,987, and 12,287 cm−1, respectively.
To enhance the selected CARS peak intensity and to decrease the other two peaks to zero, the pulse-shaping method was optimized. The frequency components of the probe spectrum inside a window centered at 12,987 cm−1 with a width of 16 cm−1 were preserved, while the other frequency components were cut off. For the pump laser, a rectangular π-phase modulation was applied to the central part of the frequency components with a window of 36 cm-1. For the Stokes light, the pulse shaping is similar to that of the pump light, except the window position scans from low to high frequency. The optimized three CARS pulses were all composed of five sub-peaks, with a spectral FWHM of 12 cm−1 and a duration of 4 ps. By controlling the detection time window of high-speed photodetectors, the background noise can be greatly reduced, and the signal-to-noise ratio can be improved.
To simultaneously enhance the four surface plasmon modes of the pump, probe, Stokes, and anti-Stokes light and to ensure that the hot spots are all located at the same position, the Fano resonance is optimized by changing the size of the disk-ring structure, which is used as the SECARS substrate. A deep and narrow Fano dip was adjusted to 12,987 cm−1 (the pump and probe light); the dark state is beneficial to the absorption of light. The Stokes and anti-Stokes lights were at the scattering peaks of 12,287 and 13,687 cm−1, which can enhance the electric field and radiation processes.
The shaped pump, Stokes, and probe pulses were all transformed into the time domain and then made to vertically irradiate the disk-ring structure. FDTD simulation was used to compute the pulse response in the time and frequency domains. The shaped pump and probe pulses were both enhanced by 55.88 times on average, and the Stokes and anti-Stokes pulses by 27.3 and 14.05 times, respectively. The hot spots of the four lights were all concentrated in the center of the gap between the disk and ring, with a deviation distance of less than 2 nm. The SECARS intensity was enhanced by more than 1012 times, which was much higher than the 1011 times enhancement required for single-molecule detection.
The distributions of the time, frequency, and phase of the input and response of the pump, probe, and Stokes pulses were studied in detail. The selective excitations of the SECARS peaks were all well maintained and so were the spectra. This has important an application for improving the signal-to-noise ratio of the CARS spectrum and providing a new path for selective excitation and enhancement of CARS peaks at a single-molecule level.

Author Contributions

Conceptualization, T.J.; data curation, Y.X.; formal analysis, Y.X., S.Z. and T.J.; funding acquisition, Z.S.; investigation, Y.X. and H.Z.; methodology, Y.X., K.C., D.F., J.L. and T.J.; project administration, T.J.; resources, T.J.; software, Y.X.; supervision, T.J.; validation, Y.X.; visualization, Y.X.; writing—original draft, Y.X.; writing—review and editing, T.J. All authors have read and agreed to the published version of the manuscript.

Funding

This research was funded by the National Natural Science Foundation of China (12074123, 11804227, 91950112), and the Foundation of ‘Manufacturing beyond limits’ of Shanghai.

Data Availability Statement

Data sharing is not applicable.

Conflicts of Interest

The authors declare no conflict of interest.

Appendix A

Appendix A.1. Optimization of the Selective Excitation of CARS

As shown in Figure A1, the hybridization rate is defined as the ratio of the maximum value of the overlap between the selected CARS and its adjacent signal to the maximum value of the CARS signal itself. The influences of the window size d of the probe light and w of the pump and Stokes light on the selective excitation of CARS are studied in detail.
Figure A1. CARS spectra and the hybridization rate: (a) CARS spectra for d = 24 cm−1; (b) influences of window width d of the probe light on CARS intensity and (c) on hybridization rate.
Photonics 09 00338 g0a1
In the CARS spectra shown in Figure A1, w is fixed as 36 cm−1 and the window width d of the probe light is set to the following values: 32, 24, 16, 12, and 8 cm−1. As d decreases from 32 to 16 cm−1, pf1, pf2, and pf3 increase by 24%, 26%, and 22.9%, respectively, as shown in Figure A1b. This is mainly because the width of the probe light is much larger than the window sizes of the π-phase modulation of the pump and Stokes light (12 cm−1). The frequency components of the probe light are partly cut off with a decrease in the window width, which suppresses part of the destructive interference [as shown in Equation (2)]. Therefore, the intensity of the CARS signal increases relatively. When the window width d is reduced to 12 and 8 cm−1, the intensity of the CARS signal decreases. This is because the probe light spectrum becomes too narrow, and the optical path integral is inevitably reduced.
When d decreases from 32 to 16 cm−1, the hybridization rate of pf1 is always 0 and so is that of pf2 adjacent to pf1, as shown in Figure A1c. The hybridization rate of pf2 adjacent to pf3 decreases from 2.7% to 0.7%, while that of pf3 decreases from 7.9% to 0.7%. It is worth mentioning that the distance between the corresponding energy levels of pf2 and pf3 is 80 cm−1, which is 40 cm−1 less than that between pf2 and pf1. Therefore, pf2 and pf3 are more difficult to separate, and our method greatly reduces the hybridization rate. When d is reduced to 16 cm−1, the hybridization ratios of pf1, pf2, and pf3 are all less than 1%, and the three CARS peaks are completely separated.
With the window width d of the probe light set as 16 cm−1, the window width w of the pump and the Stokes light is varied as 60, 48, and 36 cm−1, as shown in Figure A2. When w decreases from 60 to 36 cm−1, pf1, pf2, and pf3 decrease by 55.7%, 55.9%, and 55.5%, respectively. This is because the intensities of the pump and Stokes laser decrease linearly with the window width.
Figure A2. (a) Influences of window width w on CARS intensity, and (b) on hybridization rate.
Photonics 09 00338 g0a2
When w decreases from 60 to 36 cm−1, the hybridization rate of pf1 decreases from 1.7% to 0, while that of pf2 adjacent to pf1 is always 0 and that of pf2 adjacent to pf3 decreases from 4.99% to 0. The hybridization ratio of pf3 decreases from 5.5% to 0.7%. Although the distance between the corresponding energy levels of pf2 and pf3 is smaller, they can also be well separated. Therefore, this modulation method is effective for the selective excitation of CARS.
In the following discussion, the window width d of the probe light is maintained at 16 cm−1, and the window widths w of the pump and Stokes light are both set as 36 cm−1.

Appendix A.2. Spectra, Phase, and Time Distributions of the Three Optimized Anti-Stokes Pulses

Many studies have reported the spectra of anti-Stokes light selectively excited by shaped ultrafast laser pulses, but few studies have been conducted on the phase and the time-domain distribution [11,13,16,17,18,19]. By calculating the spectrum and the phase distribution of the anti-Stokes pulse, the time-domain distribution is studied using the inverse Fourier transform. According to the optimized results, the best selective excitation is obtained when the pump, Stokes, and probe light are modulated as follows. The frequency components of the probe light outside the window centered at 12,987 cm−1 with a width of 16 cm−1 are cut off. Similarly, the frequency components of the pump light outside of the window centered at 12,987 cm−1 with a width of 36 cm−1 are cut off, and a rectangular π-phase modulation is applied in the window with a width of 12 cm−1. The frequency components of the Stokes light outside a window with a width of 36 cm−1 are cut off, and a rectangle π-phase modulation with a width of 12 cm−1 is applied in the window. The modulation window moves from low to high frequency. The CARS peaks of pf1, pf2, and pf3 are selectively excited when the step position scans to 12,387, 12,267, and 12,187 cm−1, respectively.
The frequency, phase, and time-domain distributions of the three anti-Stokes pulses obtained by this optimized modulation are shown in Figure A3. Each spectrum of the anti-Stokes pulse contains five small peaks. The phase of each small peak is basically the same with very small fluctuations. The time-domain distribution shows that each anti-Stokes pulse is split into two peaks with a FWHM of approximately 3 ps. On both sides, there are gradually weakened small peaks, with intensities less than one-tenth of the main peak.
Figure A3. Frequency, phase, and time distribution of the three anti-Stokes pulses: (a,b) pf1, (c,d) pf2, and (e,f) pf3.
Photonics 09 00338 g0a3
The time and frequency distribution in Figure A3 show that these anti-Stokes pulses are ultrafast pulses with a width of several picoseconds. At present, the bandwidth of an ultrafast photodetector can reach 25–30 GHz. By controlling the detection time window of the ultrafast photodetector, the background noise can be greatly reduced, and the signal-to-noise ratio can be improved [1].

Appendix B

The Time Distribution of the Real Part of the Electric Field of the Stokes, Probe, and Anti-Stokes Pulse

Figure A4 shows the time distribution of the real part of the electric field of the Stokes, probe, and anti-Stokes pulse. The peak intensity of the electric field of the Stokes pulse with a step position of 12,387 cm−1 (pf1 is selectively excited) decreases to 1.35 × 10⁻⁴ and those at 12,267 cm−1 and 12,187 cm−1 decrease to 1.40 × 10⁻⁴ and 1.37 × 10⁻⁴, respectively. Figure A4c shows the time distribution of the real part of the electric field after the probe light is shaped. The FWHM of the electric field amplitude increased to 1448 fs, and the peak value decreased to 8.39 × 10⁻⁵. Figure A4e shows the time-domain distribution of the real part of the anti-Stokes pf1 pulse in air. The anti-Stokes pulses of pf2 and pf3 are similar to pf1 and are not presented.
Figure A4. Real part of the electric field of (a,b) the Stokes, (c,d) probe, and (e,f) anti-Stokes pf1 pulse, where (a,c) are the input pulses, and (b,d) are the output pulses at the probe point of the disk-ring structure. The anti-Stokes pulse (e) in air and (f) at the probe point in the disk-ring structure.
Photonics 09 00338 g0a4
The responses of the Stokes, probe, and anti-Stokes pulses are also shown in Figure A4b,d,f, respectively. The results of the Stokes and probe pulses are normalized by the real part of the electric field of the TL pulse, and the anti-Stokes pulse is normalized according to the maximum value of the input anti-Stokes pulse. The electric field amplitude of the probe pulse increases by 55.75 times due to Fano resonance, and the Stokes and anti-Stokes pulses increase by more than 27.3 and 14.05 times, respectively.
From the electric field enhancement of the four pulses, it can be seen that the electric field amplitudes of the pump and probe pulses in the Fano dark state are more than twice that of the Stokes and anti-Stokes pulses in the bright state, and the light intensities are more than four times. The imaginary parts of the electric field of the Stokes, probe, and anti-Stokes pulses are similar to the real parts.

Appendix C

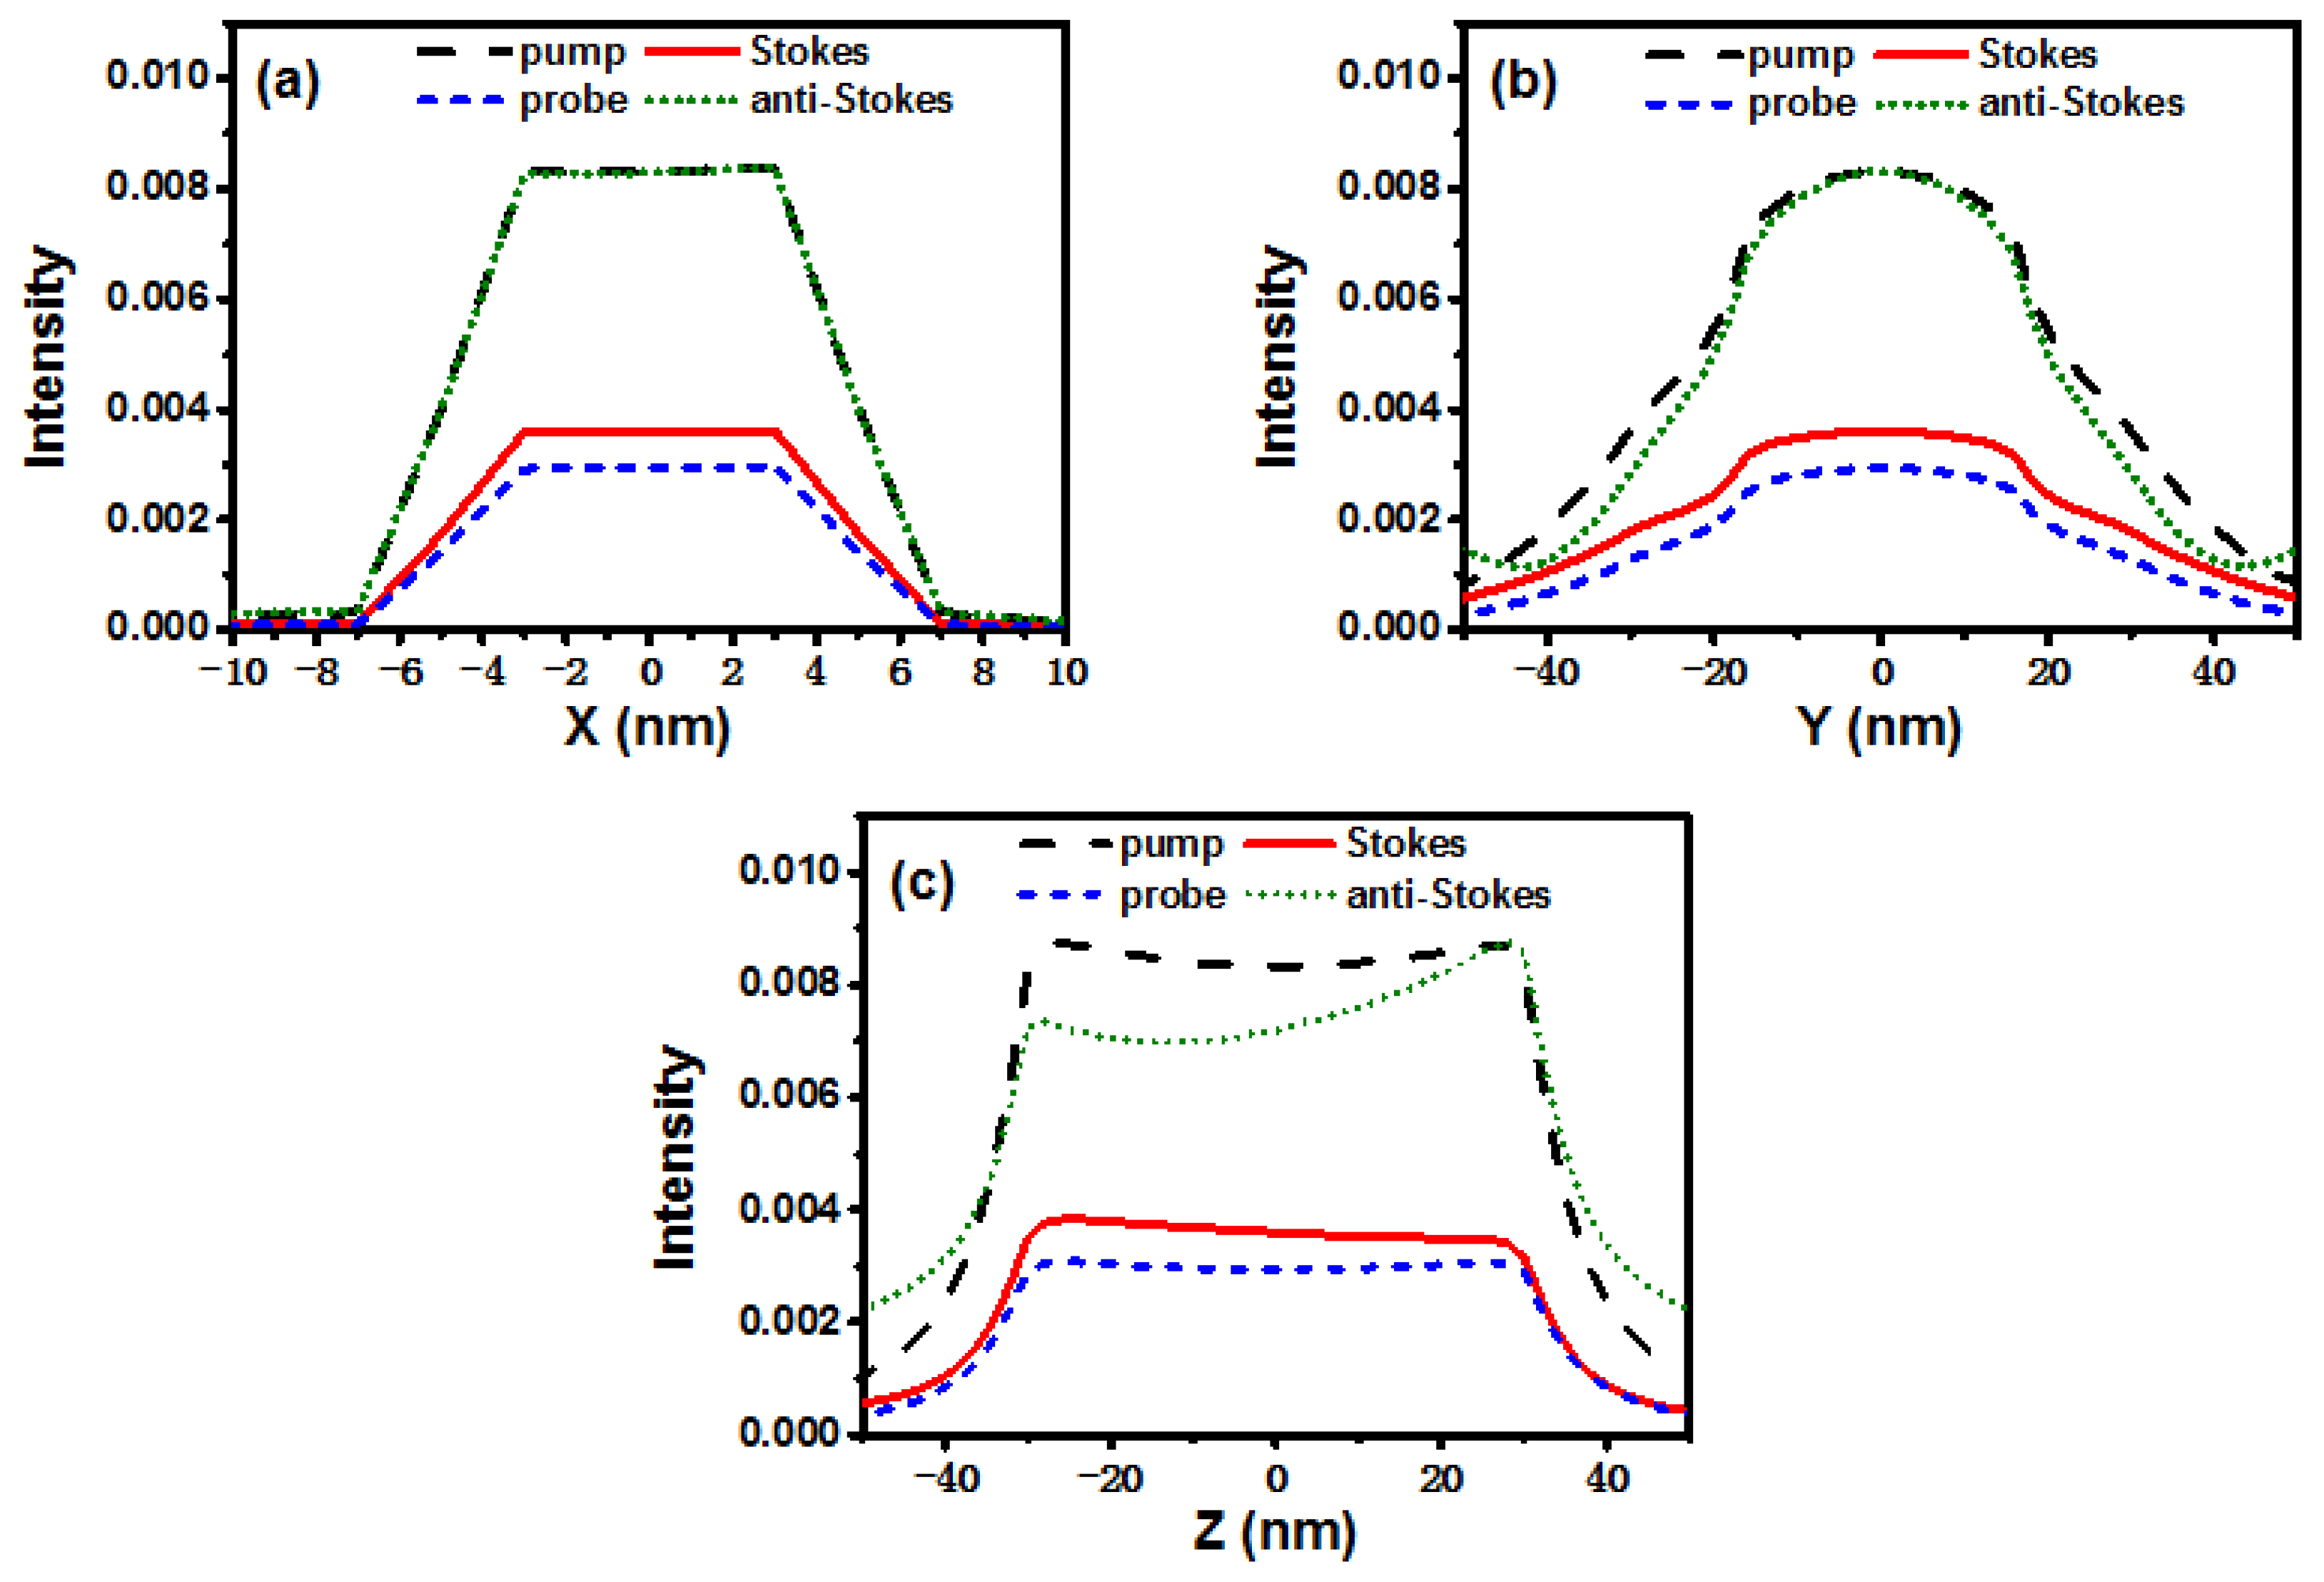
SECARS for the Step Position of the Stokes Light at 12,267 cm−1 and 12,187 cm−1

When the step position of the Stokes light reaches 12,267 cm−1, the Raman transition pf2 is well excited, while pf1 and pf3 are both zero (Figure 4a of the manuscript). In this case, the time distributions of the input and response pulses of the pump and probe light are shown in Figure 7 (the manuscript) and Figure A4 (Appendix B), and those of the Stokes and anti-Stokes pulses are shown in Figure A5. The response is similar to that of the Raman transition pf1 at 12,387 cm−1. Figure A6 and Figure A7 show the transient intensity distributions of the electric field of the pump, Stokes, probe, and anti-Stokes pulse at 7128.3 fs, and the distributions of the electric field along the X, Y, and Z axes, respectively.
Figure A5. Real part of the electric field of (a,b) the Stokes and (c,d) anti-Stokes pulse when the step position of the Stokes light scans to 12,267 cm−1. (a) The input and (b) output of the Stokes pulse at the probe point of the disk-ring structure. The anti-Stokes pulse (c) in air and (d) at the probe point in the disk-ring structure.
Photonics 09 00338 g0a5
Figure A6. Transient distributions of the electric field of (a) pump, (b) Stokes, (c) probe, (d) anti-Stokes light, and (e) corresponding SECARS map at 7128.3 fs. The white box in (e) is an enlarged view of the area with 60 nm × 60 nm in the center of the disk-ring structure.
Photonics 09 00338 g0a6
Figure A7. Distribution of the electric field intensity in (a) X, (b) Y, and (c) Z axes for the pump, Stokes, probe, and anti-Stokes light at 7128.3 fs.
Photonics 09 00338 g0a7
When the step position of the Stokes light scans to 12,187 cm−1, the Raman transition pf3 is excited, while pf1 and pf2 are both zero (Figure 4a of the manuscript). In this case, the time distributions of the input and response pulses of the pump and probe light are shown in Figure 7 (the manuscript) and Figure A4 (Appendix B), and those of the Stokes and anti-Stokes pulses are shown in Figure A8. This situation is similar to that of the Raman transition pf1 at 12,387 cm−1. Figure A9 and Figure A10 show the transient intensity distributions of the electric field of the pump, Stokes, probe, and anti-Stokes pulse at 7128.3 fs and the distributions of the electric field along the X, Y, and Z axes, respectively.
Figure A8. Real part of the electric field of (a,b) the Stokes, and (c,d) anti-Stokes pulse when the step position of the Stokes light scans to 12,187 cm−1. (a) The input and (b) output of the Stokes pulse at the probe point of the disk-ring structure. The anti-Stokes pulse (c) in air and (d) at the probe point in the disk-ring structure.
Photonics 09 00338 g0a8
Figure A9. Transient distributions of the electric field of (a) pump, (b) Stokes, (c) probe, (d) anti-Stokes light, and (e) corresponding SECARS map at 7128.3 fs. The white box in (e) is an enlarged view of the area with 60 nm × 60 nm in the center of the disk-ring structure.
Photonics 09 00338 g0a9
Figure A10. Distributions of the electric field intensity in (a) X, (b) Y, and (c) Z axes for the pump, Stokes, probe, and anti-Stokes light at 7128.3 fs.
Photonics 09 00338 g0a10

References

  1. Voronine, D.V.; Zhang, Z.; Sokolov, A.V.; Scully, M.O. Surface-enhanced FAST CARS: En route to quantum nano-biophotonics. Nanophotonics 2018, 7, 523–548. [Google Scholar] [CrossRef]
  2. Zhang, Y.; Zhen, Y.R.; Neumann, O.; Day, J.K.; Nordlander, P.; Halas, N.J. Coherent anti-Stokes Raman scattering with single-molecule sensitivity using a plasmonic Fano resonance. Nat. Commun. 2014, 5, 4424. [Google Scholar] [CrossRef] [PubMed]
  3. Zumbusch, A.; Holtom, G.R.; Xie, X.S. Three-dimensional vibrational imaging by coherent anti-Stokes Raman scattering. Phys. Rev. Lett. 1999, 82, 4142–4145. [Google Scholar] [CrossRef] [Green Version]
  4. Karuna, A.; Masia, F.; Wiltshire, M.; Errington, R.; Borri, P.; Langbein, W. Label-free volumetric quantitative imaging of the human somatic cell division by hyperspectral coherent anti-Stokes Raman scattering. Anal. Chem. 2019, 91, 2813–2821. [Google Scholar] [CrossRef] [Green Version]
  5. Rahman, K.A.; Braun, E.L.; Slipchenko, M.N.; Roy, S.; Meyer, T.R. Flexible chirp-free probe pulse amplification for kHz fs/ps rotational CARS. Opt. Lett. 2020, 45, 503–506. [Google Scholar] [CrossRef]
  6. Ren, L.; Hurwitz, I.; Raanan, D.; Oulevey, P.; Oron, D.; Silberberg, Y. Terahertz coherent anti-Stokes Raman scattering microscopy. Optica 2019, 6, 52–55. [Google Scholar] [CrossRef]
  7. Wu, T.; Chen, K.; Wei, H.; Li, Y. Repetition frequency modulated fiber laser for coherent anti-Stokes Raman scattering. Opt. Lett. 2020, 45, 407–410. [Google Scholar] [CrossRef]
  8. Assion, A.; Baumert, T.; Bergt, M.; Brixner, T.; Kiefer, B.; Seyfried, V.; Strehle, M.; Gerber, G. Control of chemical reactions by feedback-optimized phase-shaped femtosecond laser pulses. Science 1998, 282, 919–922. [Google Scholar] [CrossRef]
  9. Aljakouch, K.; Hilal, Z.; Daho, I.; Schuler, M.; Krauß, S.D.; Yosef, H.K.; Dierks, J.; Mosig, A.; Gerwert, K.; El-Mashtoly, S.F. Fast and noninvasive diagnosis of cervical cancer by coherent anti-Stokes Raman scattering. Anal. Chem. 2019, 91, 13900–13906. [Google Scholar] [CrossRef]
  10. Ran, Y.; Junghanns, M.; Boden, A.; Nolte, S.; Tünnermann, A.; Ackermann, R. Temperature and gas concentration measurements with vibrational ultra-broadband two-beam femtosecond/picosecond coherent anti-Stokes Raman scattering and spontaneous Raman scattering. J. Raman Spectrosc. 2019, 50, 1268–1275. [Google Scholar] [CrossRef]
  11. Zhang, S.; Zhang, H.; Wang, Z.; Sun, Z. Selective excitation and suppression of coherent anti-Stokes Raman scattering by shaping femtosecond pulses. Chin. Phys. B 2010, 19, 043201. [Google Scholar]
  12. Oron, D.; Dudovich, N.; Yelin, D.; Silberberg, Y. Quantum control of coherent anti-Stokes Raman processes. Phys. Rev. A 2002, 65, 043408. [Google Scholar] [CrossRef]
  13. Wipfler, A.; Buckup, T.; Motzkus, M. Fast single-beam-CARS imaging scheme based on in silico optimization of excitation phases. J. Raman Spectrosc. 2015, 46, 679–682. [Google Scholar] [CrossRef]
  14. Knutsen, K.P.; Johnson, J.C.; Miller, A.E.; Petersen, P.B.; Saykally, R.J. High spectral resolution multiplex CARS spectroscopy using chirped pulses. Chem. Phys. Lett. 2004, 387, 436–441. [Google Scholar] [CrossRef]
  15. Yan, Z.; Liu, Z.; Xia, M.; Efimova, A.; Xie, Y. Broadband surface-enhanced coherent anti-Stokes Raman spectroscopy with high spectral resolution. J. Raman Spectrosc. 2017, 48, 935–942. [Google Scholar] [CrossRef]
  16. Zhang, S.; Zhang, L.; Zhang, X.; Ding, L.; Chen, G.; Sun, Z.; Wang, Z. Selective excitation of CARS by adaptive pulse shaping based on genetic algorithm. Chem. Phys. Lett. 2007, 433, 416–421. [Google Scholar] [CrossRef]
  17. Konradi, J.; Singh, A.K.; Scaria, A.V.; Materny, A. Selective spectral filtering of molecular modes of β-carotene in solution using optimal control in four-wave-mixing spectroscopy. J. Raman Spectrosc. 2006, 37, 697–704. [Google Scholar] [CrossRef]
  18. Oron, D.; Dudovich, N.; Yelin, D.; Silberberg, Y. Narrow-band coherent anti-Stokes Raman signals from broad-band pulses. Phys. Rev. Lett. 2002, 88, 063004. [Google Scholar] [CrossRef]
  19. Zhang, S.; Zhang, H.; Jia, T.; Wang, Z.; Sun, Z. Selective excitation of femtosecond coherent anti-Stokes Raman scattering in the mixture by phase-modulated pump and probe pulses. J. Chem. Phys. 2010, 132, 044505. [Google Scholar] [CrossRef] [Green Version]
  20. Kolesnichenko, P.V.; Tollerud, J.O.; Davis, J.A. Background-free time-resolved coherent Raman spectroscopy (CSRS and CARS): Heterodyne detection of low-energy vibrations and identification of excited-state contributions. APL Photonics 2019, 4, 056102. [Google Scholar] [CrossRef] [Green Version]
  21. Tomita, K.; Kojima, Y.; Kannari, F. Selective coherent anti-Stokes Raman scattering microscopy employing dual-wavelength nanofocused ultrafast plasmon pulses. Nano Lett. 2018, 18, 1366–1372. [Google Scholar] [CrossRef]
  22. Shutov, A.D.; Yi, Z.; Wang, J.; Sinyukov, A.M.; He, Z.; Tang, C.; Chen, J.; Ocola, E.J.; Laane, J.; Sokolov, A.V.; et al. Giant chemical surface enhancement of coherent Raman scattering on MoS2. ACS Photonics 2018, 5, 4960–4968. [Google Scholar] [CrossRef]
  23. Scully, M.O.; Kattawar, G.W.; Lucht, R.P.; Opatrný, T.; Pilloff, H.; Rebane, A.; Sokolov, A.V.; Zubairy, M.S. FAST CARS: Engineering a laser spectroscopic technique for rapid identification of bacterial spores. Proc. Natl. Acad. Sci. USA 2002, 99, 10994. [Google Scholar] [CrossRef] [Green Version]
  24. Pestov, D.; Murawski, R.K.; Ariunbold, G.O.; Wang, X.; Zhi, M.; Sokolov, A.V.; Sautenkov, V.A.; Rostovtsev, Y.V.; Dogariu, A.; Huang, Y.; et al. Optimizing the laser-pulse configuration for coherent Raman spectroscopy. Science 2007, 316, 265–268. [Google Scholar] [CrossRef]
  25. Pestov, D.; Wang, X.; Ariunbold, G.O.; Murawski, R.K.; Sautenkov, V.A.; Dogariu, A.; Sokolov, A.V.; Scully, M.O. Single-shot detection of bacterial endospores via coherent Raman spectroscopy. Proc. Natl. Acad. Sci. USA 2008, 105, 422–427. [Google Scholar] [CrossRef] [Green Version]
  26. He, J.; Fan, C.; Ding, P.; Zhu, S.; Liang, E. Near-field engineering of Fano resonances in a plasmonic assembly for maximizing CARS enhancements. Sci. Rep. 2016, 6, 20777. [Google Scholar] [CrossRef]
  27. Steuwe, C.; Kaminski, C.F.; Baumberg, J.J. Surface enhanced coherent anti-Stokes Raman scattering on nanostructured gold surfaces. Nano Lett. 2011, 11, 5339–5343. [Google Scholar] [CrossRef]
  28. Ye, J.; Wen, F.; Sobhani, H.; Lassiter, J.B.; Dorpe, P.V.; Nordlander, P.; Halas, N.J. Plasmonic nanoclusters: Near field properties of the Fano resonance interrogated with SERS. Nano Lett. 2012, 12, 1660–1667. [Google Scholar] [CrossRef]
  29. Dutta, A.; Alam, K.; Nuutinen, T.; Hulkko, E.; Karvinen, P.; Kuittinen, M.; Toppari, J.J.; Vartiainen, E.M. Influence of Fano resonance on SERS enhancement in Fano-plasmonic oligomers. Opt. Express. 2019, 27, 30031–30043. [Google Scholar] [CrossRef] [Green Version]
  30. Liu, R.; Liu, J.; Zhou, X.; Jiang, G. Applications of Raman-based techniques to on-site and in-vivo analysis. Trend. Anal Chem. 2011, 30, 1462–1476. [Google Scholar] [CrossRef]
  31. Zhang, D.; Wang, P.; Slipchenko, M.N.; Cheng, J. Fast vibrational imaging of single cells and tissues by stimulated Raman scattering microscopy. Acc. Chem. Res. 2014, 47, 2282–2290. [Google Scholar] [CrossRef] [PubMed]
  32. Ren, L.; Raanan, D.; Hurwitz, I.; Oron, D. High-speed low-frequency chirped coherent anti-Stokes Raman scattering microscopy using an ultra-steep long-pass filter. Opt. Express. 2019, 27, 35993–36001. [Google Scholar] [CrossRef] [PubMed]
  33. Ren, L.; Asher, M.; Yaffe, O.; Silberberg, Y.; Oron, D. Simplified approach to low-frequency coherent anti-Stokes Raman spectroscopy using a sharp spectral edge filter. Opt. Lett. 2019, 44, 3637–3640. [Google Scholar] [CrossRef] [PubMed]
  34. Zhang, R.; Zhang, Y.; Dong, Z.C.; Jiang, S.; Zhang, C.; Chen, L.G.; Zhang, L.; Liao, Y.; Aizpurua, J.; Luo, Y.; et al. Chemical mapping of a single molecule by plasmon-enhanced Raman scattering. Nature 2013, 498, 82–86. [Google Scholar] [CrossRef] [PubMed]
  35. Park, K.; Muller, E.A.; Kravtsov, V.; Sass, P.M.; Dreyer, J.; Atkin, J.M.; Raschke, M.B. Variable-temperature tip-enhanced Raman spectroscopy of single-molecule fluctuations and dynamics. Nano Lett. 2016, 16, 479–487. [Google Scholar] [CrossRef] [PubMed] [Green Version]
  36. Kang, G.; Yang, M.; Mattei, M.S.; Schatz, G.C.; Duyne, R.P.V. In situ nanoscale redox mapping using tip-enhanced Raman spectroscopy. Nano Lett. 2019, 19, 2106–2113. [Google Scholar] [CrossRef] [PubMed]
  37. Xia, Y.; Zhao, H.; Zheng, C.; Zhang, S.; Feng, D.; Sun, Z.; Jia, T. Selective excitation on tip-enhanced Raman spectroscopy by pulse shaping femtosecond laser. Plasmonics 2019, 14, 523–531. [Google Scholar] [CrossRef] [Green Version]
  38. Xia, Y.; Zhao, H.; Zhang, S.; Feng, D.; Sun, Z.; Li, J.; Jia, T. Selective excitation of one among the three peaks of tip-enhanced Raman spectroscopy by a shaped ultrafast laser pulse. J. Raman Spectrosc. 2020, 51, 461–475. [Google Scholar] [CrossRef]
  39. Ben, T.G.; Rajaofara, Z.; Couderc, V.; Sol, V.; Kano, H.; Leproux, P.; Petit, J. Multiplex coherent anti-Stokes Raman scattering highlights state of chromatin condensation in CH region. Sci. Rep. 2019, 9, 13862. [Google Scholar]
  40. Kinegawa, R.; Hiramatsu, K.; Hashimoto, K.; Badarla, V.R.; Ideguchi, T.; Goda, K. High-speed broadband Fourier-transform coherent anti-stokes Raman scattering spectral microscopy. J. Raman Spectrosc. 2019, 50, 1141–1146. [Google Scholar] [CrossRef]
  41. Zhang, S.; Shi, J.; Zhang, H.; Jia, T.; Wang, Z.; Sun, Z. Precise control of state-selective excitation in stimulated Raman scattering. Phys. Rev. A 2010, 82, 043841. [Google Scholar] [CrossRef]
  42. Konradi, J.; Gaa’l, A.; Scaria, A.; Namboodiri, V.; Materny, A. Influence of electronic resonances on mode selective excitation with tailored laser pulses. J. Phys. Chem. A 2008, 112, 1380–1391. [Google Scholar] [CrossRef]
  43. Wrzesinski, P.J.; Roy, S.; Gord, J.R. Interference-free coherence dynamics of gas-phase molecules using spectral focusing. Opt. Express. 2012, 20, 23390. [Google Scholar] [CrossRef]
  44. Liu, X.; Zhang, W.; Song, Y.; Yu, G.; Zheng, Z.; Zeng, Y.; Lv, Z.; Song, H.; Yang, Y. Tracking intramolecular vibrational redistribution in polyatomic small-molecule liquids by ultrafast time−frequency-resolved CARS. J. Phys. Chem. A 2017, 121, 4948–4952. [Google Scholar] [CrossRef]
  45. Chew, H.; Wang, D.S.; Kerker, M. Surface enhancement of coherent anti-Stokes Raman scattering by colloidal spheres. J. Opt. Soc. Am. B 1984, 1, 56–66. [Google Scholar] [CrossRef]
  46. Stockman, M.I. Dark-hot resonances. Nature 2010, 467, 514–542. [Google Scholar] [CrossRef]
  47. Zhang, S.; Genov, D.A.; Wang, Y.; Liu, M.; Zhang, X. Plasmon-induced transparency in metamaterials. Phys. Rev. Lett. 2008, 101, 047401. [Google Scholar] [CrossRef] [Green Version]
  48. Chen, S.; Jin, S.; Gordon, R. Subdiffraction focusing enabled by a Fano resonance. Phys. Rev. X 2014, 4, 031021. [Google Scholar] [CrossRef] [Green Version]
  49. Zhang, Y.; Jia, T.Q.; Zhang, H.M.; Xu, Z.Z. Fano resonances in disk-ring plasmonic nanostructure: Strong interaction between bright dipolar and dark multipolar mode. Opt. Lett. 2012, 37, 4919–4921. [Google Scholar] [CrossRef]
  50. Fan, J.A.; Bao, K.; Wu, C.; Bao, J.; Bardhan, R.; Halas, N.J.; Manoharan, V.N.; Shvets, G.; Nordlander, P.; Capasso, F. Fano-like interference in self-assembled plasmonic quadrumer clusters. Nano Lett. 2010, 10, 4680–4685. [Google Scholar] [CrossRef]
  51. Zhan, Y.; Lei, D.Y.; Li, X.; Maier, S.A. Plasmonic Fano resonances in nanohole quadrumers for ultra-sensitive refractive index sensing. Nanoscale 2014, 6, 4705–4715. [Google Scholar] [CrossRef]
  52. Zhang, J.; Chen, S.; Wang, J.; Mu, K.; Fan, C.; Liang, E.; Ding, P. An engineered CARS substrate with giant field enhancement in crisscross dimer nanostructure. Sci. Rep. 2018, 8, 740. [Google Scholar] [CrossRef] [Green Version]
  53. Wang, J.; Zhang, J.; Tian, Y.; Fan, C.; Mu, K.; Chen, S.; Ding, P.; Liang, E. Theoretical investigation of a multi-resonance plasmonic substrate for enhanced coherent anti-Stokes Raman scattering. Opt. Express 2017, 25, 497–507. [Google Scholar] [CrossRef]
  54. Saxena, S.K.; Yogi, P.; Mishra, S.; Rai, H.M.; Mishra, V.; Warshi, M.K.; Roy, S.; Mondal, P.; Sagdeo, P.R.; Kumar, R. Amplification or cancellation of Fano resonance and quantum confinement induced asymmetries in Raman line-shapes. Phys. Chem. Chem. Phys. 2017, 19, 31788–31795. [Google Scholar] [CrossRef]
  55. Ai, B.; Song, C.; Bradley, L.; Zhao, Y. Strong Fano resonance excited in an array of nanoparticle-in-ring nanostructures for dual plasmonic sensor applications. J. Phys. Chem. C 2018, 122, 20935–20944. [Google Scholar] [CrossRef]
  56. Postaci, S.; Yildiz, B.C.; Bek, A.; Tasgin, M.E. Silent enhancement of SERS signal without increasing hot spot intensities. Nanophotonics 2018, 7, 1687–1695. [Google Scholar] [CrossRef]
  57. Hao, F.; Nordlander, P.; Sonnefraud, Y.; Dorpe, P.V.; Maier, S.A. Tunability of subradiant hipolar and Fano-type plasmon resonances in metallic ring/disk cavities: Implications for nanoscale optical sensing. ACS Nano 2009, 3, 643–652. [Google Scholar] [CrossRef]
  58. Sonnefraud, Y.; Verellen, N.; Sobhani, H.; Vandenbosch, G.A.E.; Moshchalkov, V.V.; Dorpe, P.V.; Nordlander, P.; Maier, S.A. Experimental realization of subradiant, superradiant, and Fano resonances in ring/disk plasmonic nanocavities. ACS Nano 2010, 4, 1664–1670. [Google Scholar] [CrossRef]
  59. Large, N.; Aizpurua, J.; Lin, V.K.; Teo, S.L.; Marty, R.; Tripathy, S.; Mlayah, A. Plasmonic properties of gold ring-disk nano-resonators: Fine shape details matter. Opt. Express 2011, 19, 5587–5595. [Google Scholar] [CrossRef] [Green Version]
  60. Cetin, A.E.; Altug, H. Fano resonant ring/disk plasmonic nanocavities on conducting substrates for advanced biosensing. ACS Nano 2012, 6, 9989–9995. [Google Scholar] [CrossRef]
  61. Rakovich, A.; Albella, P.; Maier, S.A. Plasmonic control of radiative properties of semiconductor quantum dots coupled to plasmonic ring cavities. ACS Nano 2015, 9, 2648–2658. [Google Scholar] [CrossRef] [PubMed] [Green Version]
  62. Johnson, P.B.; Christy, R.W. Optical constants of the noble metals. Phys. Rev. B 1972, 6, 4370–4379. [Google Scholar] [CrossRef]
  63. Zhu, X.; Shi, H.; Zhang, S.; Liu, Q.; Duan, H. Constructive-interference-enhanced Fano resonance of silver plasmonic heptamers with a substrate mirror: A numerical study. Opt. Express 2017, 25, 9938. [Google Scholar] [CrossRef] [PubMed]
  64. Cui, X.; Lai, Y.; Qin, F.; Shao, L.; Wang, J.; Lin, H. Strengthening Fano resonance on gold nanoplates with gold nanospheres. Nanoscale 2019, 11, 1–3. [Google Scholar] [CrossRef]
  65. Vahedian, M.; Naser-Moghadasi, M. The nano loop antenna with Fano resonance and symmetrical formation and reconfigurable characteristic for bio-sensing application. Opt. Quant. Electron. 2018, 50, 178. [Google Scholar] [CrossRef]
  66. Meng, L.; Sun, M.; Chen, J.; Yang, Z. A nanoplasmonic strategy for precision in-situ measurements of tip-enhanced Raman and fluorescence spectroscopy. Sci. Rep. 2016, 6, 19558. [Google Scholar] [CrossRef] [Green Version]
  67. Liu, Y.; Li, X.; Wu, H.; Zeng, Z.; Zhang, D.; Wang, P.; Zhang, L.; Fang, Y. Investigation of tip-enhanced Raman spectroscopy on a silver nanohole array substrate. Plasmonics 2017, 12, 1861–1867. [Google Scholar] [CrossRef]
  68. Huang, J.S.; Voronine, D.V.; Tuchscherer, P.; Brixner, T.; Hecht, B. Deterministic spatiotemporal control of optical fields in nanoantennas and plasmonic circuits. Phys. Rev. B 2009, 79, 195441. [Google Scholar] [CrossRef] [Green Version]
  69. Zhang, Q.; Wen, X.; Li, G.; Ruan, Q.; Wang, J.; Xiong, Q. Multiple Magnetic mode-based Fano resonance in split-ring resonator/disk nanocavities. ACS Nano 2013, 7, 11071–11078. [Google Scholar] [CrossRef]
  70. Pellarin, M.; Ramade, J.; Rye, J.M.; Bonnet, C.; Broyer, M.; Lebeault, M.; Lermé, J.; Marguet, S.; Navarro, J.R.G.; Cottancin, E. Fano transparency in rounded nanocube dimers induced by gap plasmon coupling. ACS Nano 2016, 10, 11266–11279. [Google Scholar] [CrossRef]
  71. Yang, Z. Fano interference of electromagnetic modes in subwavelength dielectric nanocrosses. J. Phys. Chem. C 2016, 120, 21843–21849. [Google Scholar] [CrossRef]
  72. Yang, D.; Im, S.; Pan, G.; Ding, S.; Yang, Z.; Hao, Z.; Zhou, L.; Wang, Q. Magnetic Fano resonance-induced second-harmonic generation enhancement in plasmonic metamolecule rings. Nanoscale 2017, 9, 6068–6075. [Google Scholar] [CrossRef]
  73. Shao, F.; Zenobi, R. Tip-enhanced Raman spectroscopy: Principles, practice, and applications to nanospectroscopic imaging of 2D materials. Anal. Bioanal. Chem. 2019, 411, 37–61. [Google Scholar] [CrossRef] [Green Version]
  74. Zanjani, N.K.; Vedraine, S.; Labarthet, F.L. Localized enhancement of electric field in tip-enhanced Raman spectroscopy using radially and linearly polarized light. Opt. Express 2013, 21, 25271–25276. [Google Scholar] [CrossRef] [Green Version]
  75. Pozzi, E.A.; Goubert, G.; Chiang, N.; Jiang, N.; Chapman, C.T.; McAnally, M.O.; Henry, A.; Seideman, T.; Schatz, G.C.; Hersam, M.C.; et al. Ultrahigh-vacuum tip-enhanced Raman spectroscopy. Chem. Rev. 2017, 117, 4961–4982. [Google Scholar] [CrossRef]
  76. Tok, R.U.; Sendur, K. Femtosecond pulse shaping using plasmonic snowflake nanoantennas. Phys. Rev. A 2011, 84, 033847. [Google Scholar] [CrossRef] [Green Version]
  77. Shah, R.A.; Scherer, N.F.; Pelton, M.; Gray, S.K. Ultrafast reversal of a Fano resonance in a plasmon-exciton system. Phys. Rev. B 2013, 88, 075411. [Google Scholar] [CrossRef] [Green Version]
  78. Utikal, T.; Stockman, M.I.; Heberle, A.P.; Lippitz, M.; Giessen, H. All-optical control of the ultrafast dynamics of a hybrid plasmonic system. Phys. Rev. Lett. 2010, 104, 113903. [Google Scholar] [CrossRef]
  79. Koo, T.W.; Chan, S.; Berlin, A.A. Single-molecule detection of biomolecules by surface-enhanced coherent anti-Stokes Raman scattering. Opt. Lett. 2005, 30, 1024–1026. [Google Scholar] [CrossRef]
  80. Yampolsky, S.; Fishman, D.A.; Dey, S.; Hulkko, E.; Banik, M.; Potma, E.O.; Apkarian, V.A. Seeing a single molecule vibrate through time-resolved coherent anti-Stokes Raman scattering. Nat. Photonics 2014, 8, 650–656. [Google Scholar] [CrossRef]
  81. Ropers, C.; Park, D.J.; Stibenz, G.; Steinmeyer, G.; Kim, J.; Kim, D.S.; Lienau, C. Femtosecond light transmission and subradiant damping in plasmonic crystals. Phys. Rev. Lett. 2005, 94, 113901. [Google Scholar] [CrossRef] [Green Version]
Figure 1. Schematic of the CARS process, where the three final states are all excited simultaneously by the pump field Ep, the Stokes field Es, and the probe field Epr.
Photonics 09 00338 g001
Figure 2. (a) Schematic of the modulation of the probe laser spectrum, and (b) CARS spectra for shaped probe pulse with the spectral width of 16 cm−1, centered at the wavenumber of 12,987 cm−1.
Photonics 09 00338 g002
Figure 3. Schematic of the modulations of (a) pump and (b) Stokes laser spectrum. The window of the pump laser is fixed, while that of the Stokes laser scans from low to high frequency, as shown by the green arrow.
Photonics 09 00338 g003
Figure 4. (a) Normalized stimulated Raman transition probabilities and (b) CARS intensities. The green dotted lines in (a) represent different step positions where the corresponding Raman peak is selectively excited. The green solid line represents the CARS intensities obtained only by cutting off the probe spectrum as shown in (b).
Photonics 09 00338 g004
Figure 5. Schematic of the disk-ring nanostructure.
Photonics 09 00338 g005
Figure 6. Scattering spectrum of the disk-ring nanostructure, where the curve is normalized according to the peak value. The red, green, and blue arrows denote the wavelengths of the pump (probe), Stokes, and anti-Stokes lights, respectively.
Photonics 09 00338 g006
Figure 7. (ad) Real and (e,f) imaginary parts of the electric field of the pump pulse; (a,c,e) the input pulses; and (b,d,f) the output pulses at the probe point of the disk-ring structure. (c) is an enlarged view of (a) in the range of 11,090–11,150 fs. (d) is the response of the pulse in (c), i.e., the pulse in the range of 11,115–11,175 fs in (b).
Photonics 09 00338 g007
Figure 8. Transient distributions of the electric field of (a) pump, (b) Stokes, (c) probe, (d) anti-Stokes light, and (e) the corresponding SECARS map at 7128.3 fs. The white box in (e) is an enlarged view of the area of 60 nm × 60 nm in the center of the disk-ring structure.
Photonics 09 00338 g008
Figure 9. Distribution of the electric field intensity in (a) X, (b) Y, and (c) Z axes for the pump, Stokes, probe, and anti-Stokes light at 7128.3 fs.
Photonics 09 00338 g009
Figure 10. Coincidence diagram of the input and the response of the pump pulse, in which the input pulse is amplified by 55.88 times and the output pulse moves forward by 31 fs.
Photonics 09 00338 g010
Figure 11. Spectrum of the input and response of (a) pump and (b) probe pulse. The spectra of the input pump and probe pulses are both multiplied by 58.7 times.
Photonics 09 00338 g011
Figure 12. Spectra of the input and the response of the Stokes pulse.
Photonics 09 00338 g012
Figure 13. Schematic of the phases of the input, response, and the phase difference of (a) pump and (b) probe pulse.
Photonics 09 00338 g013
Figure 14. Schematic of the phases of the input, response, and the phase difference of the Stokes pulse.
Photonics 09 00338 g014
Figure 15. CARS intensities in air and the disk-ring structure at the step positions of 12,387, 12,267, and 12,187 cm−1 of the Stokes laser, normalized with their own maximum, respectively.
Photonics 09 00338 g015
Table 1. Parameter settings.
ParametersSettingsParametersSettings
R1160 nmR2157 nm
W10 nmD10 nm
Height60 nmμ1
MaterialAgvolume1500 × 1200 × 900 nm3
Boundary conditionPerfectly matched layers
Publisher’s Note: MDPI stays neutral with regard to jurisdictional claims in published maps and institutional affiliations.

